Wood Supply Assessment for Commercial-Scale...
101
Wood Supply Assessment for Commercial-Scale Biomass Power Cogeneration and Biomass Utilization Projects in Central Washington Prepared for: The Tapash Sustainable Forest Collaborative and South Central Washington Resource Conservation and Development Council 1606 Perry Street, Suite E Yakima, WA 98902 Prepared by: TSS Consultants 2724 Kilgore Road Rancho Cordova, CA 95670 March 2009
Transcript of Wood Supply Assessment for Commercial-Scale...

Wood Supply Assessment for Commercial-Scale Biomass Power Cogeneration and Biomass Utilization Projects in
Central Washington
Prepared for:
The Tapash Sustainable Forest Collaborative
and
South Central Washington Resource Conservation
and Development Council 1606 Perry Street, Suite E
Yakima, WA 98902
Prepared by:
TSS Consultants 2724 Kilgore Road
Rancho Cordova, CA 95670
March 2009

ACKNOWLEDGMENTS
The authors wish to thank the many individuals and organizations for their efforts in support of this project. These include, but are not limited to: Bureau of Indian Affairs: Edwin Lewis Bureau of Land Management: Mark Williams Coeur d’Alene Fiber Fuels, Inc.: Eric Hanson Collaborative Groups: William Gillespie, South Central Washington Resource and Development Council; Betsy Bloomfield and Reese Lolley, The Nature Conservancy; Jay McLaughlin, Mt. Adams Resource Stewards Community Smallwood: Tadd Kuppinger Economic Development: Chelan County: Ron Johnston-Rodriguez and Jon Eberle (Development Partners) Kittitas County: Annie Agars and Bob Hansen, Jr. (Re-Max Community Realty) Yakima County: Lisa Smith and Dave McFadden Klickitat County: Jay McLaughlin, Michael Canon, Denny Newell Forest Products Operations: Jason Spadera, SDS Lumber Company; Jim Michael, WKO, Inc.; Wade Mosby, Collins Companies; Dirk Fledderjohann, Precision Beam and Timber; Roy Roberts, Bear Mountain Forest Products; Mike Morton, Morton Bark; Gerald Byers, Waupaca Northwoods, LLC; John Dick and Bill Howard, Boise Cascade; Marty Frank, Georgia-Pacific; Kevin Buck, Jeld-Wen; Matt McDougal, Dunollie Enterprises; Bill, Jeff and Brad Burgess, Burgess Logging; Pat Tagman, Willis Enterprises; Brent Deroo, AG Processors Grant County PUD: Kevin Nordt JTS Animal Bedding: Jim Bornstedt Landfill/Recycling: Brenda Harn, Chelan County; Wendy Mifflin, Yakima County Precision Energy Services, Inc.: John Steigers
Wood Fuel Assessment For Value Added Utilization TSS Consultants
i
Private Land Managers: Wayne Vineyard, Hancock Forest Management; Ron Simon, Longview Timber; Steve Griswold, Plum Creek; Eric Bieker, Western Pacific Timber, LLC; Jeff Jones, American Forest Land Company, LLC; Jim Frost, ACF, Ahatanum Irrigation; Bruce Summers, GreenWood Resources Roundtree Lodgepole Products: Travis Cook State of Washington Department of Natural Resources: Jon Tweedale, Eric Lamfers, Dave Richards, Phil Aust, George Shelton, Charlie McKinney, Rod Pfeifle State of Washington Department of Fish and Wildlife: Jeff Tayer, Douglas Kuehn
State of Washington Department of Ecology: Paul Rossow, Sue Billings, Mark Fuchs Transportation Contractors: Ted Schuler, DCT Chambers; Alvin James and Todd Lounsberry, James & Lounsberry U.S. Forest Service: Brad Flatten, Randy Shepard, Larry Swan U.S.D.A. Natural Resource Conservation District: Heather Simmons-Rigdon Washington State University Extension: Christine Jackson, Mike Bush, Raymond Faini, Tonia Jordan, M. Christine Price, Bridget Rohner, Debra Kollock (Agriculture); Dave Sjoding (Energy). Western Oregon Wood Products, Inc.: Mike Knobel Yakama Nation: Phil Rigdon, Steve Andringa Yakama Power: Steve Rigdon Yakama Forest Products: Ron Holen, Kelly Olney
Wood Fuel Assessment For Value Added Utilization TSS Consultants
ii

Table of Contents
ACKNOWLEDGMENTS ................................................................................................... i
INTRODUCTION .............................................................................................................. 1
SCOPE OF WORK .............................................................................................................. 1 TARGET STUDY AREA ...................................................................................................... 3
FINDINGS .......................................................................................................................... 5
BIOMASS AVAILABILITY .................................................................................................. 5 COST ESTIMATES ............................................................................................................. 7 VALUE-ADDED UTILIZATION TECHNOLOGIES ............................................................... 13
BIOMASS AVAILABILITY ........................................................................................... 14
TIMBER HARVEST RESIDUALS ....................................................................................... 14 FUELS TREATMENT/STAND IMPROVEMENT ACTIVITIES ................................................. 18 URBAN WOOD WASTE WITHIN THE TSA ...................................................................... 23 URBAN WOOD WASTE TRIBUTARY TO THE TSA ........................................................... 24
Seattle-Tacoma Area ........................................................................................................................... 25 Tri-Cities Area .................................................................................................................................... 25
FOREST PRODUCTS MANUFACTURING RESIDUALS ........................................................ 26 AGRICULTURAL BYPRODUCTS ....................................................................................... 28
Orchard Removals .............................................................................................................................. 29 Orchard Prunings ................................................................................................................................ 31 Fruit Pits .............................................................................................................................................. 32
SHORT ROTATION WOODY CROPS ................................................................................. 32 COST OF BIOMASS – COLLECTION, PROCESSING AND TRANSPORT ................................. 33 BIOMASS CHARACTERIZATION....................................................................................... 34
COMPETITION ANALYSIS ........................................................................................... 36
CURRENT COMPETITION FOR BIOMASS WITHIN THE TSA.............................................. 36 POTENTIAL COMPETITION .............................................................................................. 39
VALUE-ADDED UTILIZATION POTENTIAL ............................................................ 40
LOCATION EVALUATION ................................................................................................ 40 Chelan County .................................................................................................................................... 42 Kittitas County .................................................................................................................................... 42 Klickitat County .................................................................................................................................. 43 Yakima County ................................................................................................................................... 44
LOCATION SUMMARY ANALYSIS ................................................................................... 45 EXISTING TECHNOLOGIES .............................................................................................. 49
Biomass for Thermal Energy .............................................................................................................. 49 Post and Pole Operations .................................................................................................................... 50 Compost/Mulch/Soil Amendment/Landscape Cover .......................................................................... 51 Densified Fuel – Pellets ...................................................................................................................... 52 Whole Log Shavers ............................................................................................................................. 54 Whole Log Chipping ........................................................................................................................... 55 Wood Plastic Composites ................................................................................................................... 56
Wood Fuel Assessment For Value Added Utilization TSS Consultants
iii

EMERGING TECHNOLOGIES ............................................................................................ 57 Bio-Oil (Fast Pyrolysis) ...................................................................................................................... 58 Portable Bio-Oil Processing ................................................................................................................ 59 Ethanol and Other Alcohols ................................................................................................................ 60 Synthetic Diesel and Gasoline ............................................................................................................ 62 Bio-Based Chemicals .......................................................................................................................... 63 Mobile Pellet or Briquette Machine .................................................................................................... 63
TECHNOLOGY AND LOCATION RANKING ....................................................................... 64 CURRENT OPPORTUNITIES WITHIN THE TSA ................................................................. 65
FUTURE SUPPLY SOURCES AND RISKS .................................................................. 68
COST OF TRANSPORT ..................................................................................................... 69 SEASONAL AVAILABILITY .............................................................................................. 70 SUPPLY FROM FEDERALLY-MANAGED LANDS .............................................................. 71 THE U.S. ECONOMY ....................................................................................................... 73 INLAND REGIONAL ECONOMY ....................................................................................... 74
OBSERVATIONS AND RECOMMENDATIONS ......................................................... 75
STEWARDSHIP CONTRACTS ON FEDERAL LANDS ........................................................... 76 OPTIMIZED VALUE-ADDED ENTERPRISE LOCATIONS .................................................... 76 NEXT STEPS ................................................................................................................... 77 COLLECTION, PROCESSING AND TRANSPORT INFRASTRUCTURE .................................... 78 COMMUNITY SUPPORT ................................................................................................... 78 INITIATIVE 937 ............................................................................................................... 79 HB 1086 ........................................................................................................................ 79
Appendix A: Text of Initiative 937 .................................................................................. 80
Appendix B: Washington House Bill 1086 Analysis ...................................................... 90
Wood Fuel Assessment For Value Added Utilization TSS Consultants
iv

List of Tables
Table 1. Summary of Woody Biomass Fuel Potentially and Practically Available Within and Tributary to the TSA ............................................................................................ 6
Table 2. Summary of Woody Biomass PracticallyAvailable by Percent of Total Within and Tributary to the TSA ............................................................................................ 6
Table 3. Collection/Processing/Transport Costs and Market Values for Woody Biomass Sourced from Within and Tributary to the TSA ......................................................... 8
Table 4. Acres by Landowner/Managing Agency Within the TSA ................................... 8
Table 5. Forest Cover by Landowner or Managing Agency ........................................... 13
Table 6. Historic Timber Harvest Levels Within the TSA by Year (Private and Public Lands) ....................................................................................................................... 14
Table 7. Historic (2003-2007) Timber Harvest Levels Within the TSA by Year (Expressed by Ownership as Percent of Total) ......................................................... 15
Table 8. Historic (1975-1979) Timber Harvest Levels Within the TSA (Private and Public Lands) ............................................................................................................ 16
Table 9. Historic (1975-1979) Timber Harvest Levels Within the TSA (Expressed by Ownership as Percent of Total) ................................................................................. 17
Table 10. Estimated Timber Harvest Residuals Available Within the TSA .................... 18
Table 11. Estimated Fuels Treatment Material Available Within the TSA ..................... 22
Table 12. Estimated Urban Wood Waste Generated Within the TSA Annually ............. 24
Table 13. Urban/Industrial Wood Waste Annual Biomass Estimates by County Within the Seattle-Tacoma Area ........................................................................................... 25
Table 14. Urban/Industrial Wood Waste Annual Biomass Estimates by Community Within the Tri-Cities Area ........................................................................................ 26
Table 15. Biomass Fuel Produced from Commercial-Scale Forest Products Manufacturing Facilities Located Within the TSA ................................................... 27
Table 16. Whole Log Chip Manufacturing Facilities Located Within the TSA .............. 27
Table 17. Biomass Fuel Produced from Commercial-Scale Forest Products Manufacturing Facilities Located Tributary to the TSA ........................................... 28
Table 18. Wood Waste Practically Available from Orchard Removals Within the TSA 30
Table 19. Wood Waste Practically Available from Orchard Prunings Within the TSA . 31
Table 20. Summary Table of Agricultural Residuals Available Within the TSA ........... 32
Table 21. Collection, Processing, Transport Costs and Market Values .......................... 34
Table 22. Biomass Characterization, Competition and Time-of-Year Availability ........ 35
Table 23. Biomass Power Generation Facilities Located in Washington ........................ 36
Wood Fuel Assessment For Value Added Utilization TSS Consultants
v

Table 24. Biomass Power Generation Facilities and Forest Products Manufacturing Facilities Procuring Fuel and Fiber Generated Within the TSA ............................... 37
Table 25. Location Attribute Relative Ranking ............................................................... 46
Table 26. Technology to Location Relative Suitability Ranking .................................... 64
Table 27. Biomass from Timber Harvest and Fuels Treatment Operations Private and Public Ownership ...................................................................................................... 73
Wood Fuel Assessment For Value Added Utilization TSS Consultants
vi
Wood Fuel Assessment For Value Added Utilization TSS Consultants
vii
List of Figures
Figure 1. Target Study Area ............................................................................................... 4
Figure 2. Practically Available Biomass as Percent of Total ............................................. 7
Figure 3. Land Ownership Within the TSA ........................................................................ 9
Figure 4. Forest Cover by Landowner or Managing Agency .......................................... 11
Figure 5. Washington Plant Association Groups Within the TSA .................................. 12
Figure 6. Historic (2003-2007) Timber Harvest Trend Within the TSA ......................... 15
Figure 7. Historic (1975-1979) Timber Harvest Trend Within the TSA ......................... 16
Figure 8. Fruit Orchard Locations in Washington (Orchards Delineated in Red) ........... 29
Figure 9. Map of Commercial-Scale Plants Competing for Biomass Sourced from Within the TSA ..................................................................................................................... 38
Figure 10. Selected Sites for Attribute Evaluation Within the TSA ................................ 41
Figure 11. Biomass to Fuels and Chemicals .................................................................... 58
Figure 12. Fast Pyrolysis and Bio-Oil Uses ..................................................................... 59
Figure 13. Prototype Portable Bio-Oil Production .......................................................... 60
Figure 14. Biochemical Platform Process ........................................................................ 61
Figure 15. Thermochemical Platform Process ................................................................. 62
Figure 16. Core Fuel Market Sourcing Regions for Potential Biopower Facilities in Central Washington .................................................................................................. 66
Figure 17. Potential Biomass Synergy Opportunities Within the TSA ........................... 67
Figure 18. U.S. and West Coast Diesel Fuel Prices (July 2006 to January 2009) ........... 70
Figure 19. Practically Available Biomass as Percent of Total ......................................... 72
Figure 20. Practically Available Biomass Without Tributary Urban Wood as Percent of Total .......................................................................................................................... 72

INTRODUCTION
The South Central Washington Resource Conservation and Development Council (RC&D) is a participating member of the Tapash Sustainable Forest Collaborative (Collaborative). The Nature Conservancy (TNC), the U.S. Forest Service (USFS), the Washington Department of Fish & Wildlife (WDFW), the Washington Department of Natural Resources (WDNR), and the Yakama Nation are the founding members of the Tapash Sustainable Forests Collaborative and signatories to the Collaborative’s Memorandum of Understanding (MOU) dated October 25, 2007. The primary focus of the Collaborative and the MOU is to create interactive, consensus-based solutions for treatments to pressing threats to forests located on the east slopes of the Cascades in the state of Washington. The Collaborative’s mission is to restore forest health and protect eastern Cascades forested ecosystems from unsuitable conversion to alternate uses. The Collaborative has identified 5 million acres of forested lands managed by the Collaborative’s member agencies and organizations. Of this total, 3.5 million acres are open to active management and nearly 1 million of these acres are ecologically degraded. The Collaborative recognizes that portions of this landscape need to be treated annually to prevent further degradation. A significant barrier to success is the relative lack of ready markets for small diameter material generated as a byproduct of forest restoration and fuels treatment activities. The Collaborative would like to better understand the potential to develop additional sustainable, value-added technologies and enterprises in the region. Scope of Work TSS Consultants was retained by the RC&D to conduct a woody biomass market analysis to determine current and potential woody biomass material availability trends within the target study area (TSA) (Figure 1 below). The primary objectives for the assessment include:
• Determination of the current biomass availability and pricing trends of the woody biomass market that includes existing wood manufacturing residues, urban wood waste, agricultural byproducts, short rotation woody crops, and forest-sourced wood waste (public and private timber harvests, thinning and hazardous fuel reduction projects).
• Development of a competition analysis noting where available biomass is currently dedicated to competing plants and/or competing uses.
• Determination of prospective locations for value-added utilization facilities. • Identification of future biomass supply sources and risks.
Specific tasks completed as part of the scope of work for this study included:
Task 1. Conduct a woody biomass market analysis to determine current and potential woody biomass material availability trends within the TSA. The primary target study region is located on the east side of the Cascades. Additional
Wood Fuel Assessment For Value Added Utilization TSS Consultants
1

woody biomass material, particularly urban wood waste from metropolitan areas located outside of the target study area in Seattle/Tacoma and Richland/Kennewick, may be economically available and will be included in this assessment. Figure 1 (below) defines the Tapash study area.
Primary woody biomass material considered in this assessment included:
• Sawmill/forest products manufacturing residuals • Urban wood waste (construction/demolition wood, pallets, tree
trimmings) • Agricultural byproducts (orchard removals/prunings) • Short rotation woody crops (black locust/poplar plantations) • Forest-sourced material
o Timber harvest residuals o Fuels treatment/forest restoration residuals
Task 2. Develop a competition analysis noting where available biomass material generated from within and tributary to the study area is currently dedicated to competing plants and/or competing uses. Determine estimated delivered prices ($/bone dry ton) taking into account the costs of harvest, collection, processing and transport for woody biomass material. Characterize the origin, quality, and current disposition of identified potentially available biomass supply.
Task 3. As a result of findings from tasks 1 and 2, recommend logical locations for establishment of value-added utilization facilities. Generate a matrix that considers key elements that will facilitate systematic ranking (using reasonable filters) of the most promising sites. Prioritized ranking would include those projects with the most promising prospects for successful project development in the short term (next three years). Coordinate potential project ranking with TNC and the Collaborative to assure that community support is a key filter considered.
Task 4. Identify future woody biomass supply sources and risks.
Task 5. Utilizing information generated as a result of tasks 1 to 4, prepare a woody biomass material supply availability and project siting report. This report will estimate the availability and anticipated cost of recoverable biomass, within and tributary (potential cost effective urban wood from the Seattle/Tacoma and Richland/Kennewick urban centers) to the TSA as defined in Task 1. In addition, an optimized list of potential value-added project locations will be provided as well as a suggested list of commercial viable technologies that should be considered.
Wood Fuel Assessment For Value Added Utilization TSS Consultants
2

Target Study Area The map in Figure 1 shows the TSA for this assessment. The TSA consists of the four counties representative of the Collaborative’s efforts in dry ecosystem, eastside Cascades forests: Chelan, Kittitas, Yakima and Klickitat counties. Note that while the TSA represents the geographic region most likely to provide economical woody biomass to proposed facilities, additional woody biomass, particularly urban wood waste from the Seattle/Tacoma and Tri-Cities (Richland/ Kennewick) metropolitan areas was also included in this supply assessment. Figure 1 provides an overview of the Collaborative’s Target Study Area.
Wood Fuel Assessment For Value Added Utilization TSS Consultants
3

Figure 1. Target Study Area
Wood Fuel Assessment For Value Added Utilization TSS Consultants
4

FINDINGS
Biomass Availability TSS reviewed the practical and potential availability of woody biomass material within the TSA and tributary urban wood outside the TSA. TSS found that 2,100,740 bone dry tons (BDT)1 are potentially available and 1,148,570 BDT are practically available on an annual basis from current levels of operations. Operational increases in treatment and harvest levels would increase biomass availability from those sources. Reducing the practically available fuel total to reflect current and potential competition for use of woody biomass from within the TSA leaves a total of 304,230 BDT available on an annual basis. Table 1 reports the practical and potential biomass availability by fuel type within the TSA and by urban wood tributary sources outside the TSA. At current operating levels, the total volume of biomass net practically available from both the TSA and urban wood tributary to the TSA can support 13 megawatts (MW) of power generation2 assuming:
1. 3.0 fuel supply coverage ratio3 and 2. presuming that a base load power sales contract were to be obtained with rates
that make the project financially attractive and therefore viable. TSS acknowledges that biopower production may not be the optimized use of woody biomass resources. Potential power generation figures noted above are only presented to provide a perspective and not to advocate for a biopower-only business model. While this report examines current operations and utilization levels of potential biomass use, the Tapash Sustainable Forest Collaborative is evaluating future opportunities and treatments to improve forest health through the Central Washington Landscape Analysis (CWLA). The Washington Department of Natural Resources (DNR) is funding this project to develop a model to address current ecological conditions as well as the impact of alternative treatments to forest conditions into the future. The model will also evaluate prospective trade-offs to manage forests for species resilience, and treatments necessary to manage for long-term forest health. As the CWLA model and other analysis tools begin to offer new insights into potential biomass use, the findings of this report can adjust to new emerging conditions, including treatment levels on public lands. Table 1 shows the potential and practical biomass availability by type within the TSA. Tributary urban wood is the only potential biomass type that might be sourced from outside the TSA (Seattle/Tacoma and Richland/Kennewick). All other biomass material analyzed was located within the TSA. The category of fuel type labeled Manufacturing
1One bone dry ton is 2,000 pounds of biomass (usually in chip form) at zero percent moisture. 2One megawatt (MW) is a measure of electrical output and equals 1,000 kilowatts. This is enough generation to support approximately 1,000 households. 3Estimate assumes a consumption rate of 8,000 BDT/year per MW. Fuel supply coverage ratio represents the amount of fuel practically available over and above a facility’s annual fuel requirements.
Wood Fuel Assessment For Value Added Utilization TSS Consultants
5

Residuals includes byproduct from sawmill and plywood facilities as well as whole log chip operations.
Table 1. Summary of Woody Biomass Fuel Potentially and Practically Available
Within and Tributary to the TSA
BIOMASS TYPE POTENTIALLY
AVAILABLE (BDT/YR) PRACTICALLY
AVAILABLE (BDT/YR) Timber Harvest Residuals 299,210 179,100 Manufacturing Residuals 202,180 81,060 Urban Wood 76,730 50,820 Tributary Urban Wood 686,320 411,790 Agriculture Residuals 173,900 87,000 Fuels Treatment 662,400 338,800
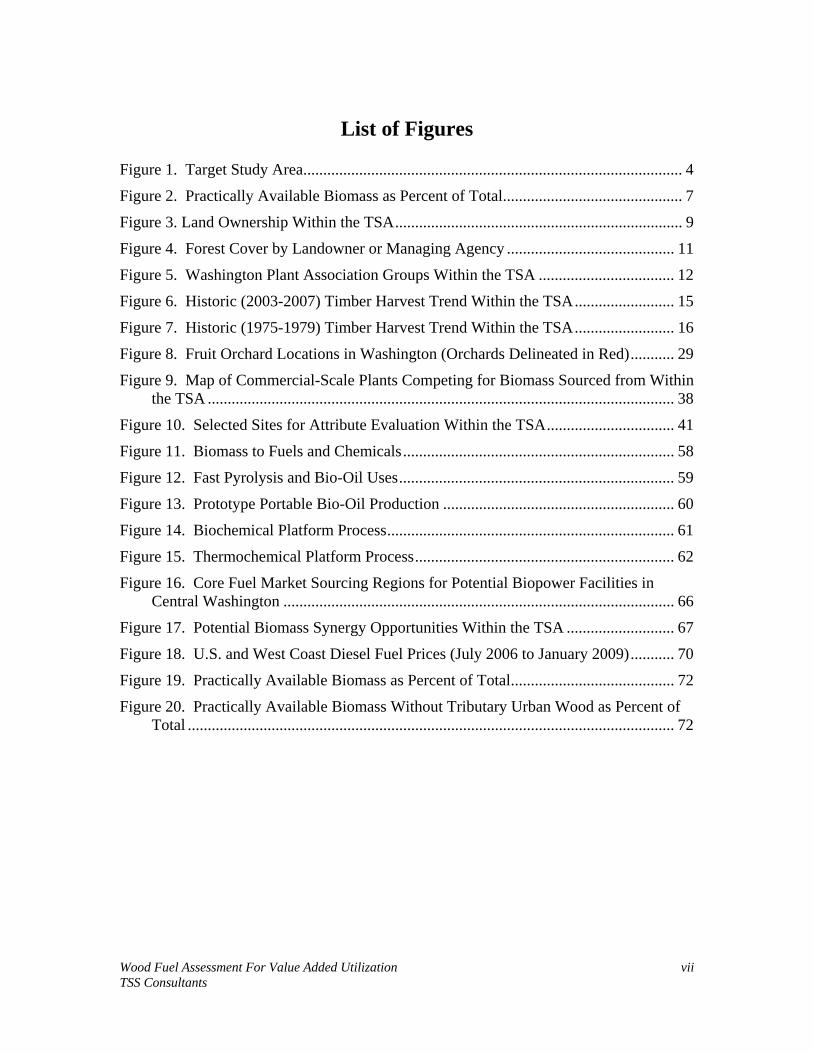
TOTALS 2,100,740 1,148,570 Table 2 shows the practical biomass availability by type as a percent of the total within and tributary to the TSA. While tributary urban wood may provide opportunities when favorable transport conditions exist, the clear opportunities within the TSA are forest- sourced biomass: timber harvest and fuels treatment/stand improvement residuals representing over 46% of available supply. Urban wood waste tributary to the TSA is the second largest source of biomass. However, this source is typically economically viable when backhaul (two-way loaded transport) opportunities are available and market conditions and product pricing are favorable. If the same allocation of prospective biomass is analyzed without contribution from tributary urban wood waste, forest-sourced biomass (timber harvest and fuels treatment) accounts for 72% of practically available biomass.
Table 2. Summary of Woody Biomass Practically Available by Percent of Total Within and Tributary to the TSA
BIOMASS TYPE
PRACTICALLY AVAILABLE % OF
TOTAL Timber Harvest Residuals 16% Manufacturing Residuals 7% Urban Wood 4% Tributary Urban Wood 36% Agriculture Residuals 8% Fuels Treatment 29%
TOTAL 100.0% Figure 2 below shows the practically available biomass as a percent of total in graphic form.
Wood Fuel Assessment For Value Added Utilization TSS Consultants
6
Figure 2. Practically Available Biomass as Percent of Total
Cost Estimates Summarized in Table 3 are cost estimates related to the expense of collection, processing and transport of woody biomass material sourced from within the TSA. For the purposes of this study, it was assumed that transport distance averages 40 miles one way (80 miles round trip) for timber harvest residuals, urban wood, and forest fuels treatment. TSS assumed 120 miles one way for urban wood considered tributary to the TSA. The transport distance for agricultural residuals was assumed at 30 miles one way (60 miles round trip). The cost estimates in Table 2 were generated as a result of interviews conducted with biomass processing contractors, timber harvesting contractors and resource managers currently conducting business within the TSA. The estimates assume a transportation cost of two dollars per running mile, loaded or unloaded.
Wood Fuel Assessment For Value Added Utilization TSS Consultants
7

Table 3. Collection/Processing/Transport Costs and Market Values for Woody Biomass Sourced from Within and Tributary to the TSA
BIOMASS TYPE
ON-BOARD TRUCK ($/BDT)
ONE-WAY TRIP
(MILES)
ROUND TRIP
(MILES)
BIOMASS MOISTURE CONTENT
BDT PER
LOAD
LOW PRICE ($/BDT)
HIGH PRICE ($/BDT)
Timber Harvest Residuals $36 40 80 40% 15.00 $47 $56 Sawmill Residuals $14 40 80 30% 22.40 $25 $33 Urban Wood $12 40 80 20% 22.80 $19 $23 Tributary Urban Wood $12 100 200 20% 22.80 $30 $35 Agriculture Residuals $30 30 60 40% 18.00 $37 $44 Fuels Treatment $45 40 80 50% 12.50 $58 $69
Table 4 below indicates the distribution of acres within the TSA by primary landowner/manager. These owners/managers represent 84% of the total land base within the TSA (7,387,598 acres). The acres for lands administered by the U.S. Forest Service as shown in Table 4 represent acres outside of designated wilderness areas, national parks, and recreation areas.
Table 4. Acres by Landowner/Managing Agency Within the TSA
ORGANIZATION ACRES PERCENT BLM 82,517 1% Private Landowners 2,276,284 37% USFS (non wilderness) 1,442,090 23% WDFW 268,272 4% WDNR 578,377 9% U.S. Department of Defense 327,100 5% Yakama Reservation 1,256,185 20%
TOTAL 6,230,825 100% Table 4 shows that the major landowners/managing agencies within the TSA are private landowners, the USFS and the Yakama Reservation. These organizations own or manage 80% of land within the TSA represented above. Figure 3 below illustrates the land ownership and agency management areas within the TSA. That region managed by the USFS characterized in Figure 3 includes all property administered by the USFS as well as the adjacent national parks and recreation areas.
Wood Fuel Assessment For Value Added Utilization TSS Consultants
8

Figure 3. Land Ownership Within the TSA
Wood Fuel Assessment For Value Added Utilization TSS Consultants
9

Woody biomass material available on a sustained basis, over time, and for a given area is directly dependent upon vegetation cover type. To appropriately assess woody biomass material availability, then, it is necessary to evaluate vegetation cover types within the TSA. The primary vegetative data source used in mapping and analysis for this assessment was LANDFIRE. LANDFIRE is a shared project between the USFS and U.S. Department of the Interior (USDI). LANDFIRE data allows ready evaluation of land and vegetative cover composition and structure. The predominant vegetative component within the TSA is forest cover. Figure 4 highlights forested vegetation cover by ownership/managing agency within the TSA.
Wood Fuel Assessment For Value Added Utilization TSS Consultants
10
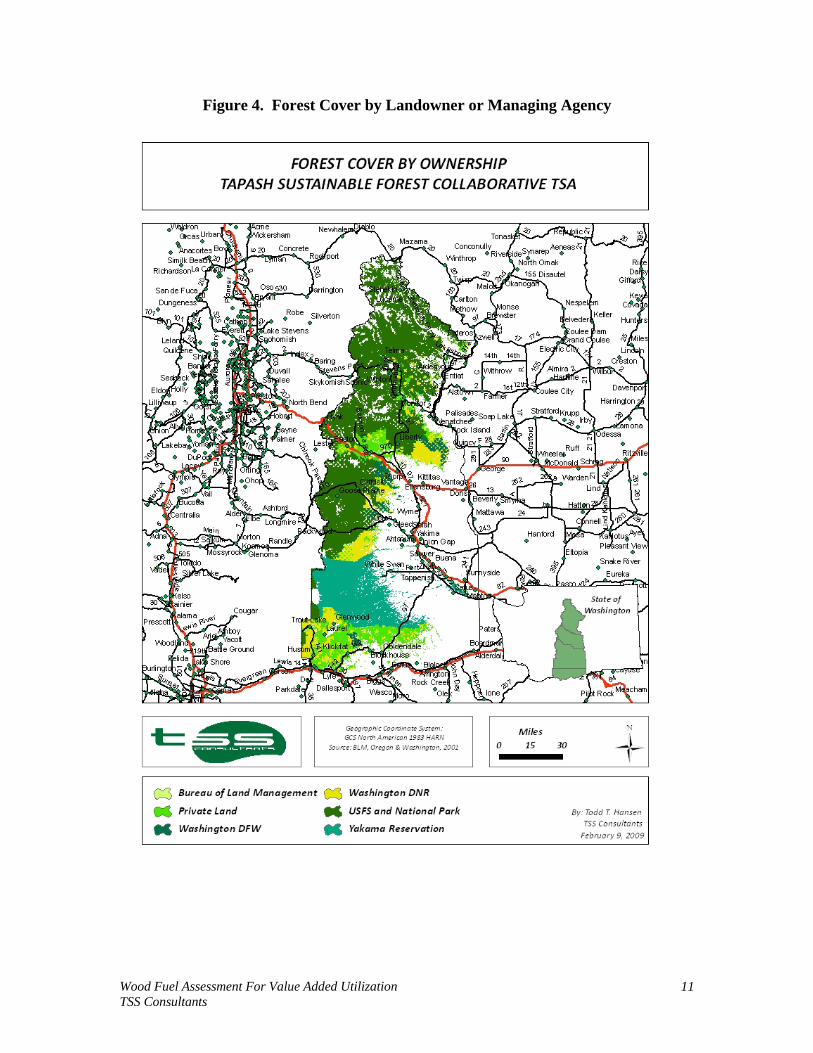
Figure 4. Forest Cover by Landowner or Managing Agency
Wood Fuel Assessment For Value Added Utilization TSS Consultants
11

Figure 5 shows basic forest cover types within the TSA. These forest cover types were provided by the Okanogan Wenatchee National Forest to The Nature Conservancy. The Nature Conservancy combined cover types predicated upon dominant species or cover to simplify the grouping into twelve basic categories.
Figure 5. Washington Plant Association Groups Within the TSA
Wood Fuel Assessment For Value Added Utilization TSS Consultants
12

Acres of forest cover by landowner/managing agency are characterized in Table 5. Clearly the most significant opportunities to access woody biomass material from forest vegetation cover are on the USFS managed lands, private landowners and the Yakama Reservation. In total, these three ownerships own or manage almost 85% of the forest cover within the TSA.
Table 5. Forest Cover by Landowner or Managing Agency
ORGANIZATION ACRES PERCENT BLM 6,563 <1% Private Landowners 527,070 21% USFS (non wilderness) 1,125,150 44% WDFW 71,175 3% WDNR 291,659 12% Yakama Reservation 507,112 20%
TOTAL 2,528,729 100% Observations from forest cover and landowner/managing agency analyses within the TSA include:
• The six landowners or managing agencies shown in Table 5 represent over 84% of the total acreage within the TSA.
• Over 44% of the total acreage within the TSA contains forest vegetation potentially suitable for biomass utilization.
• Nearly 48% of the entire acreage of the TSA is held privately. • Private landowners control 41% of forest cover within the TSA. • State and federal agencies manage nearly 2.7 million acres or 36% of the entire
TSA. • The USFS manages 1.125 million acres of forest cover (44% of the total) within
the TSA. Value-Added Utilization Technologies The use of small diameter logs and biomass as a catalyst to stimulate new businesses serves two primary goals important to rural community development within the TSA: 1) silvic improvement, and 2) rural economic improvement. Nearly 20 years of unmanaged vegetative growth in the TSA’s public forests has created unsustainable conditions. Creating sustainable markets for the small logs and biomass volume will facilitate needed economic opportunity and improved forest ecosystems. TSS analyzed selected industrial development sites located throughout the TSA to determine site potential for small diameter log and biomass utilization business establishment. Each general location was analyzed and ranked using a common list of site attributes (e.g., railroad line access). Information used in the review was collected from public development agencies headquartered throughout the TSA. The rankings are not based on rigorous analysis. They are a qualitative high elevation review using weighted attributes to compare potential locations, one to another.
Wood Fuel Assessment For Value Added Utilization TSS Consultants
13

Concurrent with the industrial site review, TSS also evaluated manufacturing technologies that may be compatible with small diameter log and biomass as raw material feedstock. Some of the technologies represent sustainable economic switching, while others represent new economic opportunity. Compatible matching of sites, technologies, and raw materials highlight ranked potential opportunities. This high-level review becomes the basis for future, more rigorous investigation of opportunities. BIOMASS AVAILABILITY
From August 2008 through December 2008, TSS conducted a woody biomass availability review of the TSA. As stated earlier, the primary objective of the study was to determine the volume of woody biomass resources that are potentially and practically available (environmentally sustainable and economical) as biomass for power generation, thermal energy or other value-added facilities within or tributary to the TSA. Timber Harvest Residuals Timber harvest residuals can provide a significant volume of woody biomass material. Typically available as limbs, tops and unmerchantable logs, these residuals are generated as byproducts of timber harvesting activities and as such, can be a relatively economical raw material source. Once collected and processed using portable grinders, this material is an excellent biomass source. Woody biomass assessment studies traditionally rely on information regarding historic timber harvest levels. This information can provide insight to determine trends and historical benchmarks to show actual forest harvest activities over time. Table 6 provides an historic perspective summarizing forest harvest activities from 2003 through 2007 within the TSA. Annual timber harvests4 during this four-year study period ranged from a high of 325,000 thousand board feet (MBF)5 in 2005 to a low of 275,000 MBF in 2007.
Table 6. Historic Timber Harvest Levels Within the TSA by Year (Private and Public Lands)
YEAR PRIVATE (MBF) PUBLIC (MBF) TOTAL (MBF) 2003 250,000 64,000 314,000 2004 273,000 50,000 323,000 2005 258,000 67,000 325,000 2006 239,000 64,000 303,000 2007 222,000 53,000 275,000
AVERAGE 248,400 59,600 308,000
4This data is presented courtesy of the WDNR, Phil Aust, Lead Economist, Office of Budget and Economics. 5MBF represents 1,000 board foot measure. One board foot is a solid wood board measured 12 inches square by 1 inch thick.
Wood Fuel Assessment For Value Added Utilization TSS Consultants
14

As shown in Table 6 and Figure 6, timber harvest activities and volumes have declined since 2005. In the short term it is anticipated that harvest levels will continue to decline in direct response to the recent downturn in housing markets. However, the five-year harvest data as shown in Table 6 does reflect historic trends (up and down) and for this reason, TSS utilized the five-year harvest average as the benchmark for this analysis. Figure 6 below illustrates the data in graph form, showing relatively consistent harvest volumes from both the public and private sector with overall decline in the total supply.
Figure 6. Historic (2003-2007) Timber Harvest Trend Within the TSA
As Table 7 indicates, private lands have had the highest harvest levels of any forest ownership in the TSA over the past five years.
Table 7. Historic (2003-2007) Timber Harvest Levels Within the TSA by Year (Expressed by Ownership as Percent of Total)
YEAR PRIVATE PUBLIC TOTAL 2003 80% 20% 100% 2004 85% 15% 100% 2005 79% 21% 100% 2006 79% 21% 100% 2007 81% 19% 100%
AVERAGE 81% 19% 100% Clearly, the opportunity to access timber harvest residuals is primarily on private lands. Private lands generated approximately 81% of timber harvest activities within the TSA from 2003 through 2007.
Wood Fuel Assessment For Value Added Utilization TSS Consultants
15

Anecdotally, the five-year harvest data in Table 8 and Figure 7 reflect the variability of TSA supply markets during another period of housing market uncertainty (1975-1979). Current TSA market harvest levels are significantly lower than these past levels. This may portend the possibilities of public land management policy changes, improved financial markets, and implementation of agreed-upon public forest policy and goals. Most forested regions in the West experienced significant timber harvest level declines over this time period. In the TSA, harvest levels remained fairly stable. Table 8. Historic (1975-1979) Timber Harvest Levels Within the TSA (Private and
Public Lands)
YEAR PRIVATE (MBF) PUBLIC (MBF) TOTAL (MBF) 1975 305,518 212,306 517,824 1976 324,661 220,750 545,411 1977 342,968 206,213 549,181 1978 358,299 234,972 593,271 1979 360,129 233,645 593,774
AVERAGE 338,315 221,577 559,892
Figure 7. Historic (1975-1979) Timber Harvest Trend Within the TSA
Table 9 provides an historic perspective regarding ownership of timber harvests as a percentage of total volume.
Wood Fuel Assessment For Value Added Utilization TSS Consultants
16

Table 9. Historic (1975-1979) Timber Harvest Levels Within the TSA (Expressed by Ownership as Percent of Total)
YEAR PRIVATE PUBLIC TOTAL 1975 59% 41% 100% 1976 60% 40% 100% 1977 62% 38% 100% 1978 60% 40% 100% 1979 61% 39% 100%
AVERAGE 60% 40% 100% An evaluation of Tables 6 and 8 reveal significant reduction of overall timber harvest volumes since 1979. Total harvest levels have declined from an average of 560,000 MBF to 308,000 MBF from 1979 to 2007, a 45% reduction. Harvest volumes have shifted significantly to private suppliers, from a 60/40 relationship of private to public (1975 to 1979) to an 80/20 relationship (2003 to 2007). Harvest volumes from public lands declined by an average of 221,600 MBF to 59,600 MBF, a 73% reduction. Timber growth accruing on standing inventory on public lands, normally harvested under past public management regimes, represents a potentially untapped latent supply. Based upon interviews with logging and wood waste processing contractors as well as with private and public land managers in the TSA and TSS’ experience, the recovery factor estimate for biomass processed from timber harvest residuals is estimated to be 0.9 BDT of woody biomass (tops and limbs) that could be generated from each MBF of timber harvested. Table 10 summarizes potential biomass available from timber harvest residuals using the 0.9 BDT/MBF biomass recovery factor estimate. Not all timber harvest operations lend themselves to ready recovery of harvest residuals. Steep slopes, remote locations, and road systems that will not readily accommodate transport of biomass will limit the volume of biomass recovered from timber harvest activities. The practically available timber harvest residual volumes shown in Table 10 reflect an adjustment as a result of input from resource managers regarding timber harvest operations conducted on forested landscapes that will not accommodate biomass recovery.6 A factor of 50% was applied to harvest volumes derived from BLM, USFS and WDNR managed lands. A factor of 63% was applied to harvest on private lands, and a factor of 65% was applied to harvest on WDFW managed lands. Using the average harvest level from private lands during the period 2003 through 2007 as a benchmark, and using expected harvest levels as provided by state and federal agencies, yields an estimate of 179,070 BDT per year of biomass as practically available from timber harvest activities within the TSA.
6USFS, Brad Flatten; BLM, Mark Williams; WDNR, Charlie McKinney; WDFW, Douglas Kuehn.
Wood Fuel Assessment For Value Added Utilization TSS Consultants
17

Table 10. Estimated Timber Harvest Residuals Available Within the TSA
LANDOWNER OR MANAGER
ESTIMATED ANNUAL HARVEST
VOLUME (MBF)
POTENTIALLY AVAILABLE
(BDT/YR)
PRACTICALLY AVAILABLE
(BDT/YR) BLM 100 90 50 USFS 30,000 27,000 13,500 WDNR 52,000 46,800 23,400 WDFW 2,000 1,800 1,170 Private 248,360 223,520 140,950
TOTALS 332,460 299,210 179,070 Table 10 clearly illustrates the fact that opportunities to secure biomass material from timber harvesting are most significant from private lands. Nearly 79% of the total biomass practically available is derived from harvest activity on private lands. Fuels Treatment/Stand Improvement Activities The National Fire Plan was launched after the devastating 2000 fire season when more than 8.4 million acres were impacted by wildfire. The nation began to realize the problem posed by years of fuel accumulating in private and publicly-managed forests. The National Fire Plan is the foundation for a long-term program to reduce fire risks and restore healthy, fire-adapted ecosystems. Since 2000, other efforts and initiatives have supplemented the general direction of the National Fire Plan. Examples of those efforts are as follows.
• The Ten-Year Comprehensive Strategy and Implementation Plan, a collaborative product of the Western Governors' Association, federal agencies, Tribes, interest groups, and local officials, calls for more active forest and rangeland management. The Plan outlines how to protect communities and improve the environment through restoration projects.
• The Healthy Forests Restoration Act (HFRA) of 2003 provides BLM and U.S.
Forest Service land managers with legislative tools to expedite forest and rangeland restoration projects. HFRA aims to expedite the preparation and implementation of hazardous fuels-reduction projects on federal land and assist rural communities, states, and private landowners in restoring healthy forest conditions on state and private lands. HFRA also facilitates the use of long-term stewardship contracts to allow treatment of public lands on a landscape level over a contract term of up to 10 years.
• The Tribal Forest Protection Act (TFPA) of 2004 authorizes the Secretary of
Agriculture and Secretary of the Interior to give special consideration to Tribally-proposed projects on U.S. Forest Service or BLM land bordering or adjacent to Indian trust land. The projects initiated under this Act are primarily to protect the
Wood Fuel Assessment For Value Added Utilization TSS Consultants
18

Indian trust resources from fire, disease, or other threats that may start on U.S. Forest Service or BLM lands.
• The Forest Landscape Restoration Act of 2008 authorizes the Secretaries of
Interior and Agriculture to establish a collaborative to identify forest landscapes with prioritized need of ecological restoration/treatment. Treatment is designated to occur on primarily federal lands but may include other state, Tribal or private lands. Appropriation of $40 million annually for the period 2008 through 2018 will be authorized. The act provides treatment implementation and monitoring by collaborative parties for at least 15 years after project initiation.
• The Tapash Sustainable Forests Collaborative (Collaborative) was established in
May 2006 by The Nature Conservancy, U.S. Forest Service, and Washington’s Department of Fish and Wildlife and Department of Natural Resources. In October 2007 the Yakama Nation joined the cooperative. The purpose of the cooperative is to encourage greater cooperation and coordination among these major landowners on issues regarding restoration of forest health. Collectively, their goal is to treat 200,000 acres per year, which could produce an estimated 2 million BDT of biomass material annually.
• The American Recovery and Reinvestment Act was signed into law on February
17, 2009. Designed as an economic stimulus initiative, this Act authorizes federal expenditures of $500 million to the U.S. Department of Agriculture for “Wildland Fire Management.” Of this, $250 million is for hazardous fuels reduction, forest health protection, rehabilitation, and hazard mitigation activities on federal lands. The remaining $250 million is allocated to state and private forestry activities including hazardous fuels reduction, forest health, and ecosystem improvement activities on state and private lands. Additionally the ARRA authorizes that up to $50 million of the total funding may be used to make wood-to-energy grants to promote increased utilization of biomass from federal, state and private lands.
The forests of Central Washington are fire-dependent, requiring natural fires to clear excess small diameter trees and brush. Many of the Central Washington forests have missed two to three natural fire intervals due largely to almost a century of successful fire exclusion. The buildup of brush and small trees has increased the risk and severity of wildfires, reduced tree growth and regeneration, and created forests more susceptible to diseases and pests such as bark beetles. Forest land managers are responding to this threat by reducing vegetation stocking levels through thinning and prescribed fire treatments. TSS contacted private and public land managers and collaborators to verify current fuel reduction and pre-commercial thinning activities. Summarized below are the findings.
• Jim Frost, Ahatanum Irrigation District, indicated they will be harvesting very limited volumes of timber, conducting limited stand improvement activities over
Wood Fuel Assessment For Value Added Utilization TSS Consultants
19

the next five years, and anticipate piling and burning the timber harvest residuals (logging slash).
• Jeff Jones, American Forest Land Company, LLC, stated that the impact of threatened and endangered species will significantly reduce their harvest and stand improvement operations to negligible levels over the next several years.
• Rich Potter, Hancock Forest Management, stated that they operate on approximately 3,000 acres a year. Historically, they have piled and burned the timber harvest residuals.
• Steve Griswold, Plum Creek, indicated their timber harvest and operational activity level is very low at this time and will remain low for the foreseeable future.
• Jay McLaughlin, Mt. Adams Resource Stewards, indicated they currently have a project focused upon utilization of small diameter material in western Klickitat County. The primary markets are firewood as well as post and pole manufacturing.
• Charlie McKinney, WDNR, indicated their region is expected to nearly double the number of acres treated in the next five year period, especially in regard to mechanical treatments.
• Eric Lamfers, WDNR, indicated the agency supports effort for value-added utilization of biomass, provides outlet for material otherwise burned, and affords treatment of areas that normally could not be treated without market-based opportunities.
• Brad Flatten, Wenatchee and Okanagan National Forest, was supportive of plans to establish biomass utilization facilities in the TSA since it may provide a market for small-diameter material typically generated from fuels treatment and stand improvement projects and potentially increase the number of treatment acres.
• Randy Shepard, Naches District Ranger, Wenatchee and Okanagan National Forest, indicated that the USFS is a very active participant in the Collaborative, giving full support to their goals of expediting landscape-level, forest restoration treatment. The Naches District is supportive of development of biomass utilization to reduce reliance upon burning as the primary disposal method.
Public land forest managers and fire staff typically accomplish fuels treatment using a variety of treatment options/tools including:
• Treat, pile and burn on site.
• Treat and leave on site.
• Treat and remove.
• Prescribed fire to combust unwanted vegetation on site (pile and burn or broadcast burn).
Wood Fuel Assessment For Value Added Utilization TSS Consultants
20

In recent years, public land managers have begun to re-think the use of prescribed fire as the primary fuels management tool of choice. Public stakeholders have voiced concerns regarding the predominant use of prescribed fire due to the following issues:
• Air quality impacts (haze, human health issues associated with air quality).
• Potential for escape (concerns for a repeat of the 2000 Cerro Grande fire in New Mexico or 1999 Lowden Fire in California).
• Visual impacts of burned and blackened forests.
• Biomass utilization for value-added products and rural employment.
• Carbon and greenhouse gas release.
The new National Fire Plan has fuels treatment goals that are the result of input by management and public stakeholders. The new plan for public lands has begun to increasingly use a “treat and remove” fuels treatment method. In addition, and as a result of the Healthy Forest Restoration Act, public forest managers have new contracting tools such as stewardship contracts that can facilitate the treatment of thousands of acres with maximum contractual terms of 10 years. These are contracts focused on the removal and use of forest materials ideally suited for use as biomass. Timber and fire staff managing public lands monitor forest fuels treatments as acres treated. Funding for these treatments is appropriated by Congress on an annual basis and may be inconsistent over time. However, due to recent federal policy initiatives (economic stimulus package), increased funding for targeted fuels treatment activities (shovel ready) is expected. Discussions with national forest staff also yielded information on four primary risks associated with project development and implementation on public forests.
• Budget limitations caused by depressed prices for timber sales and stewardship contracts. These conditions reduce revenues and increase costs, limiting availability of funding for future projects.
• Escalating firefighting costs in some national forests has reduced budgets for timber sale and stewardship programs.
• Annual variations in congressional fuels treatment funding can severely impact annual biomass treatment acreages.
• Litigation and/or appeals from conservation organizations. Some forests are clearly targeted for litigation as a method to stop management objectives.
Much of the funding allocated to forest fuels treatment projects is used in the compilation of environmental assessments and studies as required by the NEPA. Staffing levels for timber and fuels management personnel are dependent upon funding availability. If staff is reduced as a result of decreased funding, then the number of fuels treatment projects planned and implemented will likely be reduced. The USFS is continuing to evaluate the use of stewardship contracts, using “Indefinite Delivery, Indefinite Quantities” (IDIQ) contracts to provide more flexibility and efficiency to fuels treatment, forest restoration, and stand improvement projects. These
Wood Fuel Assessment For Value Added Utilization TSS Consultants
21
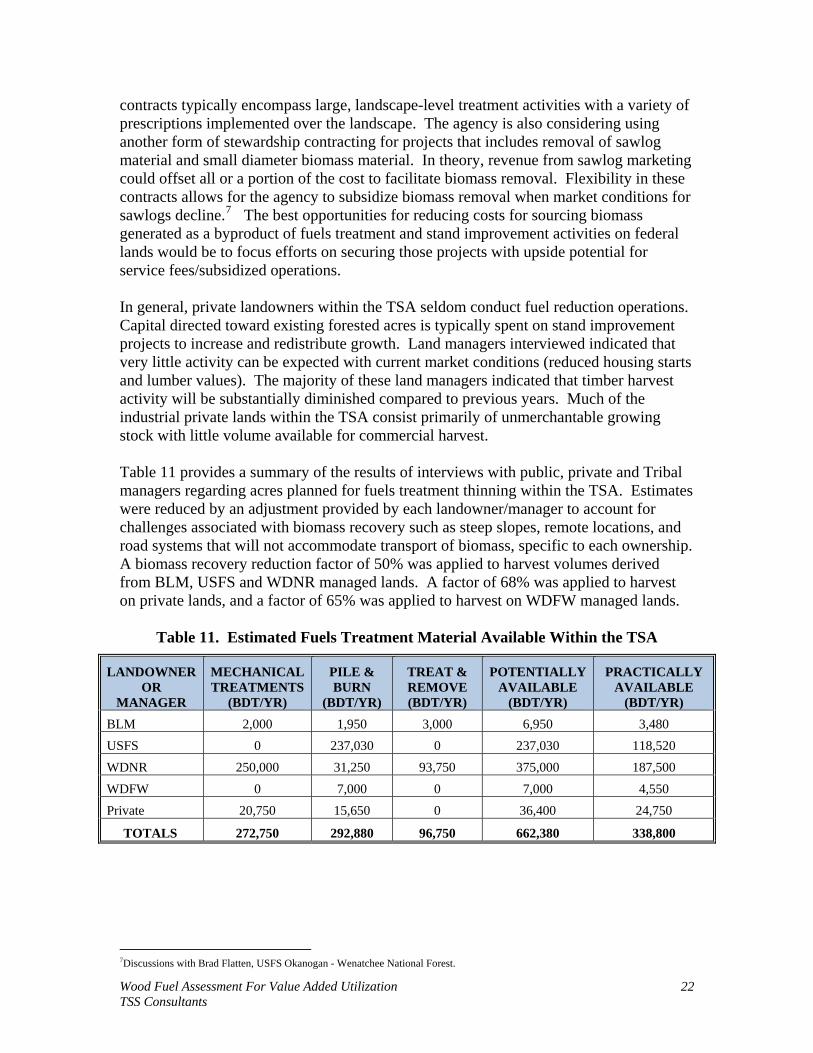
contracts typically encompass large, landscape-level treatment activities with a variety of prescriptions implemented over the landscape. The agency is also considering using another form of stewardship contracting for projects that includes removal of sawlog material and small diameter biomass material. In theory, revenue from sawlog marketing could offset all or a portion of the cost to facilitate biomass removal. Flexibility in these contracts allows for the agency to subsidize biomass removal when market conditions for sawlogs decline.7 The best opportunities for reducing costs for sourcing biomass generated as a byproduct of fuels treatment and stand improvement activities on federal lands would be to focus efforts on securing those projects with upside potential for service fees/subsidized operations. In general, private landowners within the TSA seldom conduct fuel reduction operations. Capital directed toward existing forested acres is typically spent on stand improvement projects to increase and redistribute growth. Land managers interviewed indicated that very little activity can be expected with current market conditions (reduced housing starts and lumber values). The majority of these land managers indicated that timber harvest activity will be substantially diminished compared to previous years. Much of the industrial private lands within the TSA consist primarily of unmerchantable growing stock with little volume available for commercial harvest. Table 11 provides a summary of the results of interviews with public, private and Tribal managers regarding acres planned for fuels treatment thinning within the TSA. Estimates were reduced by an adjustment provided by each landowner/manager to account for challenges associated with biomass recovery such as steep slopes, remote locations, and road systems that will not accommodate transport of biomass, specific to each ownership. A biomass recovery reduction factor of 50% was applied to harvest volumes derived from BLM, USFS and WDNR managed lands. A factor of 68% was applied to harvest on private lands, and a factor of 65% was applied to harvest on WDFW managed lands.
Table 11. Estimated Fuels Treatment Material Available Within the TSA
LANDOWNER OR
MANAGER
MECHANICAL TREATMENTS
(BDT/YR)
PILE & BURN
(BDT/YR)
TREAT & REMOVE (BDT/YR)
POTENTIALLY AVAILABLE
(BDT/YR)
PRACTICALLY AVAILABLE
(BDT/YR) BLM 2,000 1,950 3,000 6,950 3,480 USFS 0 237,030 0 237,030 118,520 WDNR 250,000 31,250 93,750 375,000 187,500 WDFW 0 7,000 0 7,000 4,550 Private 20,750 15,650 0 36,400 24,750
TOTALS 272,750 292,880 96,750 662,380 338,800
7Discussions with Brad Flatten, USFS Okanogan - Wenatchee National Forest.
Wood Fuel Assessment For Value Added Utilization TSS Consultants
22

The volumes for expected fuels treatment/stand improvement activities for the WDNR represent significant increases from historic activity levels (previous five years), as the agency continues to evaluate utilization of small diameter material as a ready market for biomass material generated as a byproduct of prescriptive treatments. Private industrial timber landowners seldom conduct fuels treatment or forest restoration operations. Stand improvement projects are conducted when such operations meet company biological and financial goals. As Table 11 indicates, nearly 314,050 BDT (93% of practically available biomass material) are derived from activities on state and federally-managed lands. Both fuels treatment and stand improvement activities can generate significant volumes of woody biomass material. Interviews with contractors, land managers and fuel procurement managers, as well as TSS’ experience, indicate that recovery of woody biomass from these activities can generate 10 to 25 BDT per acre on a consistent basis. TSS estimates that 338,800 BDT per year, as noted in Table 11, are practically available from fuel reduction treatments on public, Tribal, and private forest lands within the TSA. Urban Wood Waste Within the TSA Wood waste generated as a result of tree trimming, land clearing, construction, demolition and from commercial (non-forest products manufacturing) operations in the form of pallets and miscellaneous wood scraps, represents a significant potential biomass resource. Collectively known as urban wood waste, this material is typically low in moisture content, has a relatively high heating value (8,000+ BTU8 per dry pound) and is potentially available as a relatively low-cost fuel. Communities are considering increasing potential recovery of this wood waste for a variety of reasons, including:
• Extending the functional life of landfills through diversion of wood waste material to alternative uses. Tip fees at the landfills are rising, providing an incentive for increased recycling/alternative utilization efforts.
• Residential and commercial developments within the TSA often require clearing prior to construction. This creates wood waste in the form of vegetative material (brush, small trees, etc.).
• Air quality concerns have increased restrictions on the open burning of wood waste or vegetative material. Landfills in the Yakima Basin are restricted from waste burning. Burning of residential and commercially generated biomass (landscaping materials, agricultural materials) is highly regulated and is being completely phased out.
• Reduction of greenhouse gas emissions associated with biomass disposal by shifting the form of air emissions of the waste and residue biomass carbon from methane to carbon dioxide (methane is almost 25 times more potent as a greenhouse gas than CO2 on an instantaneous basis).9
8BTU (British Thermal Unit) is a measure of relative heat value. One BTU represents the quantity of heat required to raise the temperature of one pound of water from 60° F to 61° F at a constant pressure of one atmosphere. 9Western Governors’ Association, Biomass Task Force Report, January 2006.
Wood Fuel Assessment For Value Added Utilization TSS Consultants
23

Urban wood waste generated by a community or region is directly proportional to population. The higher the population within a given area, the more urban wood waste is produced. Within the TSA resides an estimated population of 367,50010 residents. Based on TSS’s experience analyzing urban wood waste generation, indications arapproximately 10.5% of solid waste is comprised of urban wood waste. The daily per capita solid waste generation is estimated at 11.5 pounds. Using this generation factor and a recovery factor of 60%, approximately 38,870 BDT of urban wood waste are practically available annually sourced from within the TSA. Based on our previous assessments in this region and experience with urban wood waste recovery, TSS has converted the volumes of wood waste to a bone dry ton basis assuming that the average moisture content of the urban wood waste is 20%.
e that
TSS has developed estimates of tree trimmings as a population-based measurement from previous studies. These studies indicate that approximately 100 dry pounds of tree trimmings suitable for fuel are generated annually per capita. TSS assumes approximately 65% of this wood waste is actually recoverable as biomass fuel. Based upon the census data above, approximately 11,940 BDT of tree trimmings are available as wood fuel each year sourced from within the TSA. These two potential sources together could provide an estimated 50,820 BDT annually. Table 12 summarizes urban wood waste projected to be available within the TSA on an annual basis.
Table 12. Estimated Urban Wood Waste Generated Within the TSA Annually
COUNTIES TSA
POPULATION
URBAN WOOD ADJUSTED FOR
MOISTURE (BDT/YR)
URBAN WOOD ADJUSTED FOR
RECOVERY (BDT/YR)
Chelan 72,100 15,050 9,970 Kittitas 39,400 8,230 5,450 Klickitat 20,100 4,200 2,780 Yakima 235,900 49,250 32,620
TOTALS 367,500 76,730 50,820 Urban Wood Waste Tributary to the TSA The volume of urban wood available from the Seattle-Tacoma and Tri-Cities areas is approximately 411,800 BDT total per year. However, urban wood waste transportation costs are very significant and urban wood tributary to the TSA is only economically available if transportation costs can be mitigated. The primary approach to reduce transportation costs is utilization of backhauls when and wherever possible. The use of backhauls splits the cost of transportation between two commodities. For example, a sawmill delivers wood chips to a paper mill in the Seattle-
10Office of Financial Management, Forecasting Division, State of Washington.
Wood Fuel Assessment For Value Added Utilization TSS Consultants
24

Tacoma area. The chip van, instead of returning empty, picks up a load of sorted and processed urban wood waste from a landfill diversion operation or woody biomass recycler, thus returning to the cogeneration facility on a backhaul with biomass fuel. Some mills have used curtain side vans for delivering lumber, returning with a load of biomass fuel. Essentially, using backhauls can double the economic haul radius for sourcing woody biomass fuel. Seattle-Tacoma Area Within the Seattle-Tacoma area, TSS estimated a population of 3.7 million11 residents. Based on TSS’s experience with urban and industrial wood waste generation, it was calculated that approximately 825,171 green tons (GT) are generated annually in the Seattle-Tacoma area. Of this volume, approximately 60% is actually recoverable as biomass fuel. Assuming 20% moisture content, TSS concludes that approximately 396,080 BDT of urban/industrial woody biomass is available each year sourced from the Seattle-Tacoma area. Table 13 breaks down this volume by county. The City of Seattle is approximately 107 miles (one way) from the town of Ellensburg, the approximate center of the TSA.
Table 13. Urban/Industrial Wood Waste Annual Biomass Estimates by County Within the Seattle-Tacoma Area
COUNTIES 2007
POPULATION
URBAN WOOD ADJUSTED FOR
MOISTURE (BDT/YR)
URBAN WOOD ADJUSTED FOR
RECOVERY (BDT/YR)
Island 78,400 13,820 8,290 Jefferson 28,600 5,040 3,030 King 1,861,300 328,140 196,880 Kitsap 244,800 43,160 25,890 Mason 54,600 9,630 5,780 Pierce 790,500 139,360 83,620 Snohomish 686,300 120,990 72,590
TOTALS 3,744,500 660,140 396,080 Tri-Cities Area Within the Tri-Cities area, TSS estimated a population of 148,48912 residents. Using this population estimate, it was calculated that approximately 32,722 GT are generated annually in the Tri-Cities area. Of this volume, TSS estimates that approximately 60% is actually recoverable as biomass fuel. Assuming 20% moisture content, TSS concludes that approximately 15,710 BDT of urban/industrial woody biomass is available each year sourced from the Tri-Cities area. Table 14 shows a breakdown of this volume by city within this area. The Tri-Cities area is approximately 96 miles (one way) from the town of Ellensburg, the approximate center of the TSA.
11Office of Financial Management, Forecasting Division, State of Washington. 12Ibid.
Wood Fuel Assessment For Value Added Utilization TSS Consultants
25

Table 14. Urban/Industrial Wood Waste Annual Biomass Estimates by Community Within the Tri-Cities Area
COMMUNITIES 2007
POPULATION
URBAN WOOD ADJUSTED FOR
MOISTURE (BDT/YR)
URBAN WOOD ADJUSTED FOR
RECOVERY (BDT/YR)
Pasco 38,233 6,740 4,040 Kennewick 59,334 10,460 6,280 Richland 42,537 7,500 4,500 West Richland City 8,385 1,480 890
TOTALS 148,489 26,180 15,710 Since the use of backhauls is generally limited to the amount of product deliveries made by the cogeneration project host (e.g., pulp chips to a paper mill), this study limited the potential availability of tributary urban wood to the level of wood chip loads delivered by a prospective host. Currently, there are several facilities that produce and deliver wood chips to operations outside the TSA.13 The majority of the transport of this material is directed to facilities east of the TSA (e.g., Boise Cascade at Wallula). Another factor to consider is utilization of product locally in the Seattle/Tacoma and Tri-Cities areas, providing a competitive disadvantage to end users within the TSA. The expansion of power generation capacity within the Seattle/Tacoma area (Tacoma Kraft and Seattle Steam upgrades) will increase pressure on available supply within this market area. Therefore, TSS considers only urban wood from the Tri-Cities area to be a potentially viable source of biomass fuel. Thus, TSS estimates a practical supply of urban wood tributary to the TSA as 7,860 BDT per year, which is approximately half of the total urban wood production in the Tri-Cities area. Forest Products Manufacturing Residuals Forest products manufacturing residuals generated within the TSA provide a potential biomass source for a value-added facility. There are only two commercial-scale primary forest products manufacturing facilities located within the TSA: Yakama Forest Products at White Swan and SDS Lumber at Bingen. These mills are currently utilizing approximately 225,000 MBF of logs annually (Eastside Scribner log rule). Table 15 summarizes estimates of biomass generated by commercial forest products facilities located within the TSA. The estimated annual biomass quantities shown are either numbers supplied by a representative from a specific company or calculated using a recovery factor. When a calculation was required, a value of 0.72 BDT per MBF was utilized to determine biomass recovery. The 0.72/BDT per MBF recovery factor (bark, sawdust and shavings) was utilized based on TSS’ experience working with sawmills operating in the Pacific Northwest region. Therefore, it is estimated that approximately 144,000 BDT per year are potentially available as biomass within the TSA.
13Based on interviews with personnel at Yakama Forest Products, Boise Cascade facility at White Swan, Dunhollie in Yakima.
Wood Fuel Assessment For Value Added Utilization TSS Consultants
26

Table 15. Biomass Fuel Produced from Commercial-Scale Forest Products Manufacturing Facilities Located Within the TSA
FACILITY
ESTIMATED ANNUAL SAWLOG
CONSUMPTION (MBF)
ESTIMATED ANNUAL BIOMASS FUEL PRODUCED
(BDT) Yakama Forest Products 135,000 80,000 SDS Lumber 90,000 64,000
TOTALS 225,000 144,000 In addition to the two primary forest products manufacturing facilities cited above, there are four whole log chip facilities currently operating that also generate suitable biomass in the form of bark and sawdust as a byproduct of chip production. These facilities, their locations and estimated biomass production are shown in Table 16.
Table 16. Whole Log Chip Manufacturing Facilities Located Within the TSA
FACILITY LOCATION ESTIMATED ANNUAL BIOMASS
FUEL PRODUCED (BDT/YR) Boise Cascade - Lounsberry White Swan 18,000 Dunollie Enterprises, LLC Yakima 12,000 Burgess Bros. Logging Winton 3,180 SDS Bingen 25,200
TOTAL 58,380 The facilities above were all operating at near full capacity when interviewed for this assessment. As the demand for pulp chips changes, expect similar adjustments relative to whole log chip production and therefore prospective biomass from these facilities. There are several forest product manufacturing facilities operating at locations considered tributary to the TSA. These operations are currently utilizing an estimated 204,000 MBF of sawlogs annually. This level of log consumption translates to approximately 146,000 BDT per year. Due to the significant haul distances and robust competition for biomass generated as manufacturing residuals, the biomass identified in Table 17 is not considered currently available for biomass utilization facilities within the TSA.
Wood Fuel Assessment For Value Added Utilization TSS Consultants
27

Table 17. Biomass Fuel Produced from Commercial-Scale Forest Products Manufacturing Facilities Located Tributary to the TSA
FACILITY LOCATION
ESTIMATED ANNUAL SAWLOG
CONSUMPTION (MBF)
ESTIMATED ANNUAL BIOMASS PRODUCED
(BDT) Colville Indian Precision Pine Omak, WA 40,000 42,000 Colville Indian Plywood & Veneer Omak, WA 45,000 18,000 WKO Carson, WA 100,000 71,000 WKO Hood River, OR 15,000 11,000 Precision Beam and Timber Walla Walla, WA 4,000 4,000
TOTALS 204,000 146,000
Agricultural Byproducts In some regions of the West, agricultural byproducts have the potential to provide a stable, long-term, and cost effective biomass source. Agricultural byproducts can be available in a variety of forms including:
• Orchard removals – As orchards mature over time, productivity and yield decline or become inconsistent. Orchards are removed and replaced with new orchard stock or are removed permanently due to alternative land uses such as commercial or residential development.
• Orchard prunings – Generated annually from orchard operations. • Fruit pits (e.g., peach pits, cherry pits).
Wood Fuel Assessment For Value Added Utilization TSS Consultants
28

Figure 8. Fruit Orchard Locations in Washington14 (Orchards Delineated in Red)
Orchard Removals Agricultural Extension staff15 at Washington State University (WSU) generally recommend an annual fruit orchard replacement rate of 10%. Age, disease avoidance, and varietal upgrades are the most common reasons. Fruit tree replacement rates vary with varieties and types. For example, pear and cherry orchard replacement rates are much lower (long-lived, few varietals) than apples. New apple varietals rapidly replace old, red delicious varietals, creating a greater impact since apples are Washington’s largest fruit crop. WSU Extension estimates that 10% is conservative and that 15 to 20% is a more current apple orchard replacement rate. Orchard removals (trees and stumps) are primarily piled and burned. Orchard piling and burning requires Washington State Department of Ecology (WSDOE) air quality burn permits when conducted within urban growth boundaries (as delineated by WSDOE). WSDOE’s Agricultural and Outdoor Burn Team, part of the Department’s Air Quality Program, encourages voluntary compliance but may issue fines of $10,000 per day per violation. Air quality is monitored by the Eastern Regional office of the WSDOE. Burning bans are invoked when air quality is threatened. In the Yakima Valley, for example, during the period from September to March, air quality is frequently compromised by stagnant air and burning is discouraged, metered, or outright banned on a day-by-day basis. WSDOE16 interviews indicate that air permitting may become more
14Washington Fruit Survey 2006, USDA/National Agricultural Statistics Service, Washington Field Office. 15Consultation: Michael Bush, Ph.D., Tree Fruit IPM, Washington State Extension. 16Consultation: Paul Rossow, Washington Department of Ecology.
Wood Fuel Assessment For Value Added Utilization TSS Consultants
29

restrictive as air quality deteriorates. Concerns regarding air quality degradation could end agricultural, silvicultural, and municipal burning. Alternative disposal methods in response to air quality issues will encourage orchard operations to chip tree removals provided that it does not become financially burdensome. According to WSU Extension17 and WSDOE air quality management,18 fruit orchard waste chipping and removal practices may substantially increase over time. Another alternative is mulching removed trees. As long as the alternatives to burning (including penalties) are financially reasonable, they will be considered. This is especially the case for orchards located within urban growth areas where agricultural burning is now discouraged and soon could be prohibited. Firewood markets are the primary revenue stream for orchard tree removals, but this captures only a small proportion of the total orchard removals. The other two common disposal methods are orchard abandonment or tree pulling followed by rotting in either piles or as they lie. Both approaches create vectors for pest and/or disease infestation. Local county pest and disease boards are typically called in to address these issues. WSU Extension estimates that about 200-300 acres per year fall into this category. Eventually this material must be removed by burning or chipping. Chipping is WSU Extension’s favored approach. The number of orchard acres removed annually in Table 18 represents a weighted average of 5% removal for pear orchards and 10% for other fruit. Based on experience with orchard removal operations, TSS estimates a 13 BDT per acre recovery factor from fruit orchard removals. Using this recovery factor and the estimated orchard removal acreage summarized in Table 16, TSS estimates that 133,210 BDT of wood waste are potentially available as a result of orchard removal activities within the TSA. Considering that some of the orchard removal material will be utilized as firewood and many orchards are at a distance from prospective biomass utilization locations, TSS reduced the potentially available biomass figure by 50% to arrive at an estimate of 66,600 BDT of practically available biomass from orchard tree removals per year.
Table 18. Wood Waste Practically Available from Orchard Removals Within the TSA
COUNTY ACRES IN
ORCHARDS ACRES OF ORCHARD
REMOVED ANNUALLY
POTENTIALLY AVAILABLE
BIOMASS (BDT)
PRACTICALLY AVAILABLE
BIOMASS (BDT) Chelan 32,540 2,700 35,070 17,530 Kittitas 800 70 850 420 Klickitat 4,000 340 4,370 2,190 Yakima 76,520 7,150 92,920 46,460
TOTALS 113,860 10,260 133,210 66,600
17Consultation: Mike Bush, Ph.D., WSU Extension, Yakima, WA. 18Consultation: Sue Billings, Washington Department of Ecology.
Wood Fuel Assessment For Value Added Utilization TSS Consultants
30

Orchard Prunings In Washington, growers do not need a permit to burn material generated as a result of orchard pruning. However, according to WSU Extension, if an orchardist keeps up with needed pruning practices annually, nearly 80% of those prunings can be disposed of through mastication or use of mower/flayer equipment that can chip or shred the smaller diameter pruning material. Approximately one green ton of orchard prunings is generated per acre per year. TSS estimates that approximately 51,800 BDT of orchard pruning material are potentially available per year. This estimate was determined by calculating the acres of orchards available for pruning, assuming 50% moisture content applied to a yield of 1 green ton per acre per year to calculate BDT per acre. For practical availability, TSS further reduced this estimate by 75% to account for orchards that will not readily accommodate pruning removal, and will likely continue to shred and scatter pruning material as a general practice, or are located some distance from the TSA. Approximately 12,950 BDT of orchard pruning material is practically available as biomass. Table 19 summarizes orchard pruning material estimates for the TSA
Table 19. Wood Waste Practically Available from Orchard Prunings Within the TSA
COUNTY ACRES IN
ORCHARDS
ACRES OF ORCHARD REMOVED ANNUALLY
ACRES OF ORCHARD
AVAILABLE FOR PRUNING
POTENTIALLY AVAILABLE
BIOMASS (BDT)
PRACTICALLY AVAILABLE
BIOMASS (BDT)
Chelan 32,540 2,700 29,840 14,920 3,730 Kittitas 800 70 730 370 90 Klickitat 4,000 340 3,660 1,830 460 Yakima 76,520 7,150 69,370 34,690 8,670
TOTALS 113,860 10,260 103,600 51,810 12,950
Wood Fuel Assessment For Value Added Utilization TSS Consultants
31

Fruit Pits Commercial processing of agricultural commodities within the TSA consistently produces quantities of byproduct in the form of cherry and peach pits. The majority of the fruit grown in the TSA is destined for the fresh fruit market, so pits are not available in significant amounts.19 A large processor of cherries in the Yakima Valley, Checker Cherries, demonstrated little interest in pit disposal.20 Peach and cherry pits have relatively high heating value and currently have significant disposal costs (plowed into clay soils as soil amendment). Sourcing fruit pits for use as biomass fuel can be very cost effective, as pit producers will likely be interested in a low-cost alternative to existing disposal methods. This may become a significant opportunity fuel source if fruit marketing practices change. Table 20 summarizes prospective biomass derived from orchard removals and pruning within the TSA. There are approximately 79,550 BDT per year of practically available agricultural residuals recoverable as prospective biomass.
Table 20. Summary Table of Agricultural Residuals Available Within the TSA
AGRICULTURAL RESIDUALS
POTENTIALLY AVAILABLE BIOMASS ANNUALLY (BDT)
PRACTICALLY AVAILABLE BIOMASS ANNUALLY (BDT)
Orchard Removal 133,210 66,600 Orchard Pruning 51,810 12,950
TOTALS 185,020 79,550 Short Rotation Woody Crops The development of fast-growing woody crops has been driven in recent years by significant improvements in the clonal propagation of fast-growing crop trees such as cottonwood, poplar, locust and eucalyptus. Known as short rotation woody crops (SRWC), these tree species are prized for value-added uses such as pulp/paper, engineered wood products, and even solid lumber products. In the early 1990’s, significant acres of arid land in the Northwest were irrigated for the expressed purpose of growing hybrid poplar trees. Initially the plantations were managed under an eight-year rotation cycle and produced pulp chips for the fiber-stressed pulp mills in the Inland region. During 2006 through 2007, a consortium of foreign and U.S. fund investors, Collins Products (Portland, OR) and GreenWood Resources (Portland, OR) set up a $175 million fund to purchase substantially all of the poplar plantations located near Boardman, OR. In mid 2007, Collins Products announced plans to build a sawmill within the 23,000 acre plantation near Boardman. The planned production capacity of the new sawmill is 100 million board feet (lumber tally) annually, making it the largest hardwood sawmill in the U.S. The sawmill has initiated commercial operation at approximately 30% of capacity while refining production and waiting for improvement in hardwood lumber market conditions. The dry kiln and planing facilities are being built 19Per discussion with Rick Mains, Bureau of Indian Affairs. 20Ibid.
Wood Fuel Assessment For Value Added Utilization TSS Consultants
32

on Port of Morrow property in Boardman. Annual log usage for the sawmill is estimated at 60,000 MBF. The figures used in this report for the Collins Products sawmill reflect an anticipated 2-shift operating strategy commencing in 2010. The Boardman poplar plantations are managed on a 12-year rotation and produce approximately 35 MBF of sawlogs per acre at harvest. The sawmill will require sustained harvesting of poplar at an average of 7 acres per day to meet stated capacities. The Collins Products sawmill will utilize the lower 25 feet of the tree bole and the top portion of the tree chipped for pulp or biomass fuel. GreenWood Resources, the resource management entity for the consortium, announced it has signed a non-binding letter of intent to provide poplar tree feedstock to support the operation of a cellulosic biorefinery to be sited at the Port of Morrow. The facility will be owned and operated by ZeaChem, Inc., of Lakewood, CO. With rising costs for corn, new feedstocks and technologies to convert cellulosic material (including wheat stover and woody biomass material) are being explored. Due to the relatively long haul distance from the TSA (153 miles one way) and competing uses located in the Boardman area, TSS concluded that these short rotation woody crops are currently not an economic long-term biomass source for a value-added utilization facility in the TSA. Cost of Biomass – Collection, Processing and Transport TSS Consultants has assessed the full expense of collection, processing and transport to better understand the cost of biomass delivered to a value-added utilization facility within the TSA. Interviews were conducted with forest fuels treatment operation managers, foresters, and wood waste processors. Low and high cost ranges are presented due to different variables that can impact costs of operation. The most significant variables include:
• Haul distance to facility.
• Vegetation type and density.
• Cost of diesel.
• Cost of labor.
• Road improvement and maintenance.
• Time of year delivery.
• Competing uses for the biomass material.
Summarized in Table 21 is the range of collection, processing and transportation costs associated with each biomass type. Note that forest product residuals have little or no collection and processing costs; therefore, prices presented below represent market values. For the purposes of this study, it was assumed that transport distance averaged approximately 40 miles one way (80 miles round trip) for all biomass types except sawmill residuals, agricultural residuals, and urban wood tributary to the TSA. For
Wood Fuel Assessment For Value Added Utilization TSS Consultants
33
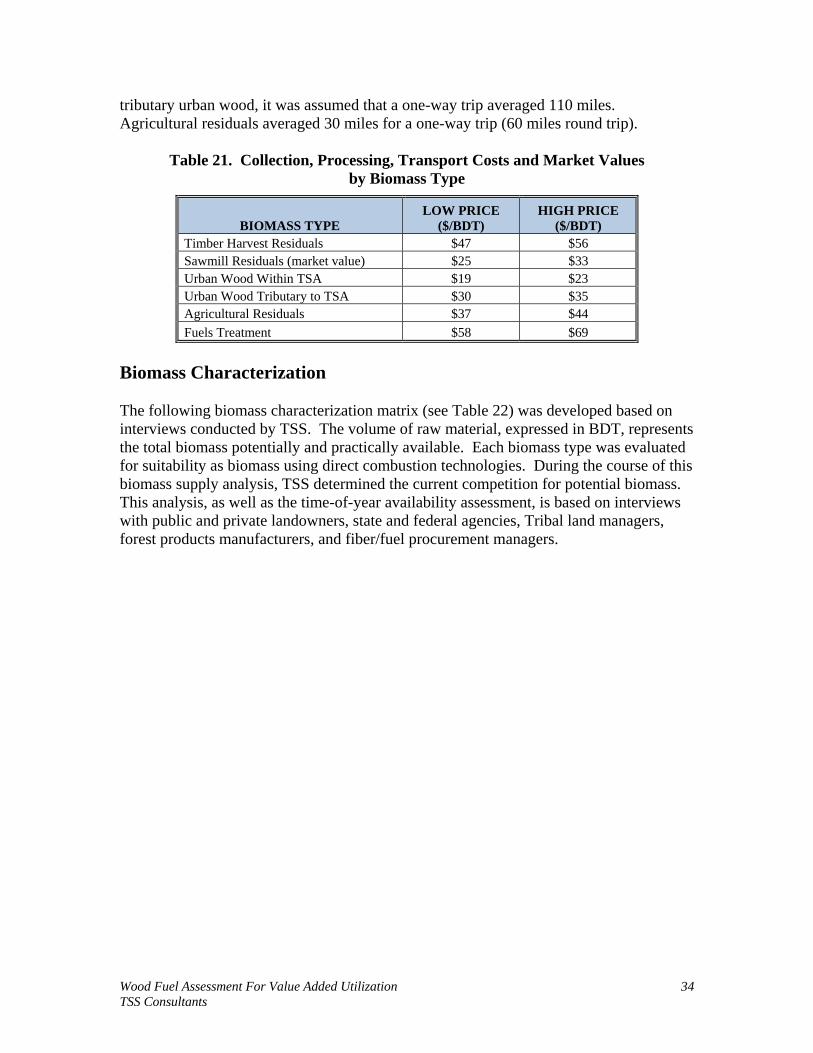
tributary urban wood, it was assumed that a one-way trip averaged 110 miles. Agricultural residuals averaged 30 miles for a one-way trip (60 miles round trip).
Table 21. Collection, Processing, Transport Costs and Market Values by Biomass Type
BIOMASS TYPE LOW PRICE
($/BDT) HIGH PRICE
($/BDT) Timber Harvest Residuals $47 $56 Sawmill Residuals (market value) $25 $33 Urban Wood Within TSA $19 $23 Urban Wood Tributary to TSA $30 $35 Agricultural Residuals $37 $44 Fuels Treatment $58 $69
Biomass Characterization The following biomass characterization matrix (see Table 22) was developed based on interviews conducted by TSS. The volume of raw material, expressed in BDT, represents the total biomass potentially and practically available. Each biomass type was evaluated for suitability as biomass using direct combustion technologies. During the course of this biomass supply analysis, TSS determined the current competition for potential biomass. This analysis, as well as the time-of-year availability assessment, is based on interviews with public and private landowners, state and federal agencies, Tribal land managers, forest products manufacturers, and fiber/fuel procurement managers.
Wood Fuel Assessment For Value Added Utilization TSS Consultants
34
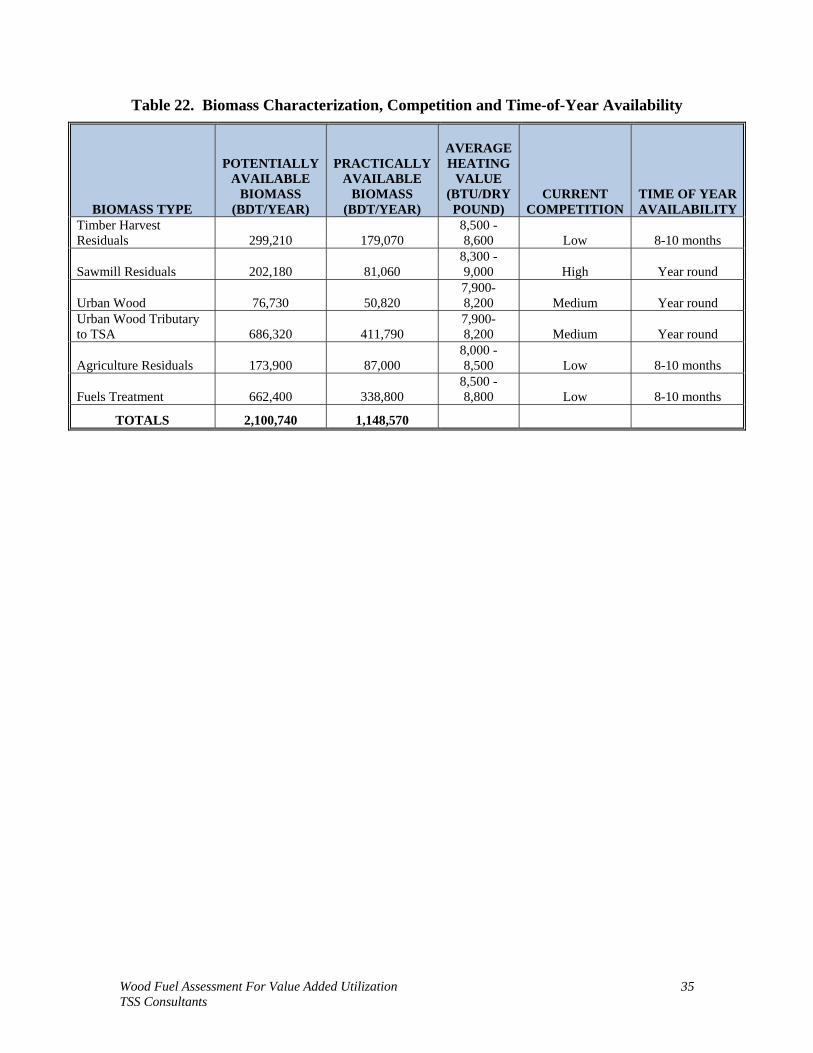
Table 22. Biomass Characterization, Competition and Time-of-Year Availability
BIOMASS TYPE
POTENTIALLY AVAILABLE
BIOMASS (BDT/YEAR)
PRACTICALLY AVAILABLE
BIOMASS (BDT/YEAR)
AVERAGE HEATING
VALUE (BTU/DRY POUND)
CURRENT COMPETITION
TIME OF YEAR AVAILABILITY
Timber Harvest Residuals 299,210 179,070
8,500 - 8,600 Low 8-10 months
Sawmill Residuals 202,180 81,060 8,300 - 9,000 High Year round
Urban Wood 76,730 50,820 7,900- 8,200 Medium Year round
Urban Wood Tributary to TSA 686,320 411,790
7,900- 8,200 Medium Year round
Agriculture Residuals 173,900 87,000 8,000 - 8,500 Low 8-10 months
Fuels Treatment 662,400 338,800 8,500 - 8,800 Low 8-10 months
TOTALS 2,100,740 1,148,570
Wood Fuel Assessment For Value Added Utilization TSS Consultants
35

COMPETITION ANALYSIS
Currently there are 15 biomass power plants located in the state of Washington with approximately 419 MW of total generation capacity. Of these, 12 are currently operational. Table 23 provides an overview of the plants by ownership, location, and generation capacity.
Table 23. Biomass Power Generation Facilities Located in Washington
OWNER
DISTANCE FROM
YAKIMA (MILES)
DISTANCE FROM
WENATCHEE (MILES) LOCATION
GENERATION CAPACITY
Avista 282 203 Kettle Falls 51 MW
Colville Indian Plywood & Veneer 197 96 Omak
7.5 MW (currently retired)
Hampton Lumber Co. 212 163 Darrington 7.5 MW Georgia Pacific 172 278 Camas 52 MW Grays Harbor Paper, LP 233 266 Grays Harbor 5.5 MW Kimberly-Clark 166 123 Everett 52 MW Longview Fiber 168 255 Longview 67.5 MW
Port Townsend Paper 235 240 Port Townsend
14.5 MW (currently in Chapter 11)
SDS Lumber 114 220 Bingen 8.5 MW Sierra Pacific Industries 184 135 Arlington 30 MW Sierra Pacific Industries 204 237 Aberdeen 18 MW
Simpson Tacoma Kraft 157 162 Tacoma
55 MW (operational mid-2009)
Vaagen Brothers Lumber 276 212 Colville 4.6 MW
Weyerhaeuser Company 205 238 Cosmopolis 15.5 MW
(currently down)Weyerhaeuser Company 168 255 Longview 30 MW
While very few of these facilities are currently accessing woody biomass from the TSA, in the aggregate they demonstrate that the state of Washington has a well-developed biomass power generation industry. Current Competition for Biomass Within the TSA Due to recent sawmill curtailments, residuals from forest products manufacturing facilities have decreased significantly and are currently in short supply. Demand for this commodity has resulted in efforts to process and utilize as biomass traditionally underutilized material such as urban wood waste and timber harvest residuals. Competition from the enterprises identified in Table 24 for residuals from forest products manufacturing operations within the TSA has been significant. A recent downturn in the market for building products linked to housing has created some supply contractions.
Wood Fuel Assessment For Value Added Utilization TSS Consultants
36

TSS estimates that until forest products markets rebound and manufacturing operations once again operate at or near full capacity, volatility in the market for biomass material supply and pricing will continue. The SDS Lumber power plant listed in Table 24 will soon undergo a significant upgrade and increase power generation capacity from 8.5 MW to between 18 to 24 MW.21 The decorative bark and fuel pellet plant operators all expressed a desire to increase production if more raw material feedstocks (bark, sawdust, shavings) were available and housing markets rebound. Commercial-scale facilities currently procuring biomass within the TSA are listed in Table 24. At this time, the closest biomass power generation facility now procuring fuel from within the TSA is SDS Lumber (mentioned earlier) at Bingen. Interviews with area fiber managers indicate that regional (TSA) competition for the biomass resource is minimal. Table 24. Biomass Power Generation Facilities and Forest Products Manufacturing
Facilities Procuring Fuel and Fiber Generated Within the TSA
FACILITY
FUEL/FIBER CONSUMPTION
(BDT/YEAR
FUEL/FIBER PROCURED
FROM WITHIN TSA (BDT/YEAR)
DISTANCE FROM
YAKIMA (MILES)
DISTANCE FROM
WENATCHEE (MILES)
Power Plant SDS Lumber 68,000 68,000 114 220
Decorative Bark Morton & Sons 3,400 3,400 0 107
Waupaca Northwoods 11,000 11,000 9 115
Wood Pellets Bear Mountain Forest Products
30,000 20,000 143 250
Composite Products
Jeld-Wen 48,000 48,000 10 140
Pulp Mills Boise Cascade 235,000 75,000 106 150 Georgia Pacific 175,000 35,000 172 278
TOTALS 570,400 260,400
Figure 9 identifies the location of these facilities in relationship to the TSA.
21Interview with SDS representative.
Wood Fuel Assessment For Value Added Utilization TSS Consultants
37
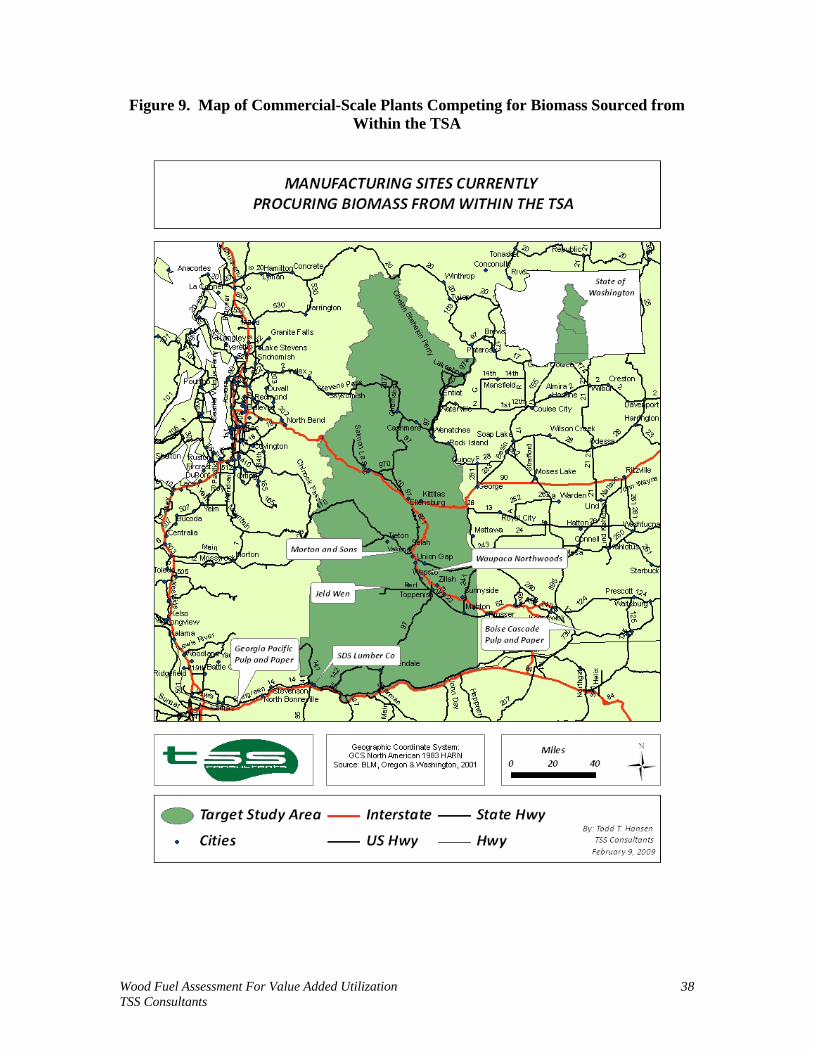
Figure 9. Map of Commercial-Scale Plants Competing for Biomass Sourced from Within the TSA
Wood Fuel Assessment For Value Added Utilization TSS Consultants
38

Potential Competition There are two proposed biomass projects that will impact supply availability within the TSA. The Grant County Public Utility District in partnership with the Yakama Nation and Yakama Forest Products are analyzing the potential of siting a 15 MW facility at White Swan. Such a facility will require an estimated 120,000 BDT of fuel annually, wheeling electricity to the grid as well as heat and steam to the wood products manufacturing operation. The Colville Reservation Energy Program is investigating the feasibility of siting a 20 MW biomass fueled facility to be co-located with the plywood and veneer plant at Omak. This facility would consume an estimated 160,000 BDT of fuel annually. It would generate heat and steam for the wood products manufacturing operation and wheel power to the grid. The ripple effect of increasing public interest to reduce utilization of fossil fuels and the potential for rising crude oil prices over time provides continued motivation and interest in alternative transportation fuels. Currently, most of the biofuels development in Central Washington is focused on utilization of wheat stover and other agricultural byproducts as feedstock. Current research in converting woody biomass into biofuels is progressing and may become a competitive factor for the projects in the future, but not likely in the near term (three to five years). The U.S. Forest Service22 indicated that small mobile fuel pellet vendors have made inquiries on the Naches District of the Okanogan and Wenatchee National Forests. These ventures appear to be small in scale at this time but may become significant competition for timber harvest residuals and forest fuels reduction biomass if their numbers increase and the conversion technology is improved. Fuel pellet manufacturers typically prefer sawmill residuals as their primary raw material feedstock due to the relatively low ash and moisture content. Competition Summary Assessment of the amount of net practically available biomass volume requires analysis of current factors influencing the marketplace within and tributary to the TSA. These factors include:
• Transport cost and utilization of supply within the local market render urban wood waste from Seattle and surrounding areas economically unviable (396,080 BDT per year).
• Fifty percent of practical tributary urban wood waste, 7,860 BDT per year, from
the Tri-Cities area would be available and economical.
22Interview with Brad Flatten, Stewardship & Timber Sales Specialist, Wenatchee National Forest.
Wood Fuel Assessment For Value Added Utilization TSS Consultants
39

• The wood products operations identified in Table 22 will continue to source product from within the TSA, estimated at 260,400 BDT per year.
• Expansion of the existing biomass facility co-located with SDS wood products
manufacturing operation will require an additional 100,000 BDT per year. TSS estimates that 50% of this fuel (50,000 BDT) will be sourced from within the TSA.
• A 15 MW facility co-located with Yakama Forest Products would consume an
estimated 120,000 BDT per year from within the TSA.
• A 20 MW facility co-located with Colville Indian Plywood & Veneer would consume an estimated 160,000 BDT per year. TSS estimates that 10,000 BDT per year would be sourced from within the TSA.
Considering the market factors identified above, in conjunction with previously estimated supply filtering, approximately 304,230 BDT per year are available and uncommitted to alternative markets within the TSA. VALUE-ADDED UTILIZATION POTENTIAL
TSS reviewed selected sites distributed throughout the TSA for attributes relative to the potential for siting small diameter and biomass value-added utilization facilities. These rankings are not intended to provide quantifiable results but simply weigh relative attributes of one location to another. Communities with substantially larger populations typically have well-developed infrastructure providing inherent advantages over communities with smaller populations. TSS also evaluated the technology needed for selected small diameter and biomass value-added processing. A brief summary of existing as well as emerging technologies is included. Based upon location attributes as described above and processing facility requirements and preferences, TSS developed a relative ranking of processing facility suitability to the various selected locations. Location Evaluation The identification of prospective properties and associated data for each was provided by the counties’ Economic Development staff. The selected sites are shown in Figure 10.
Wood Fuel Assessment For Value Added Utilization TSS Consultants
40
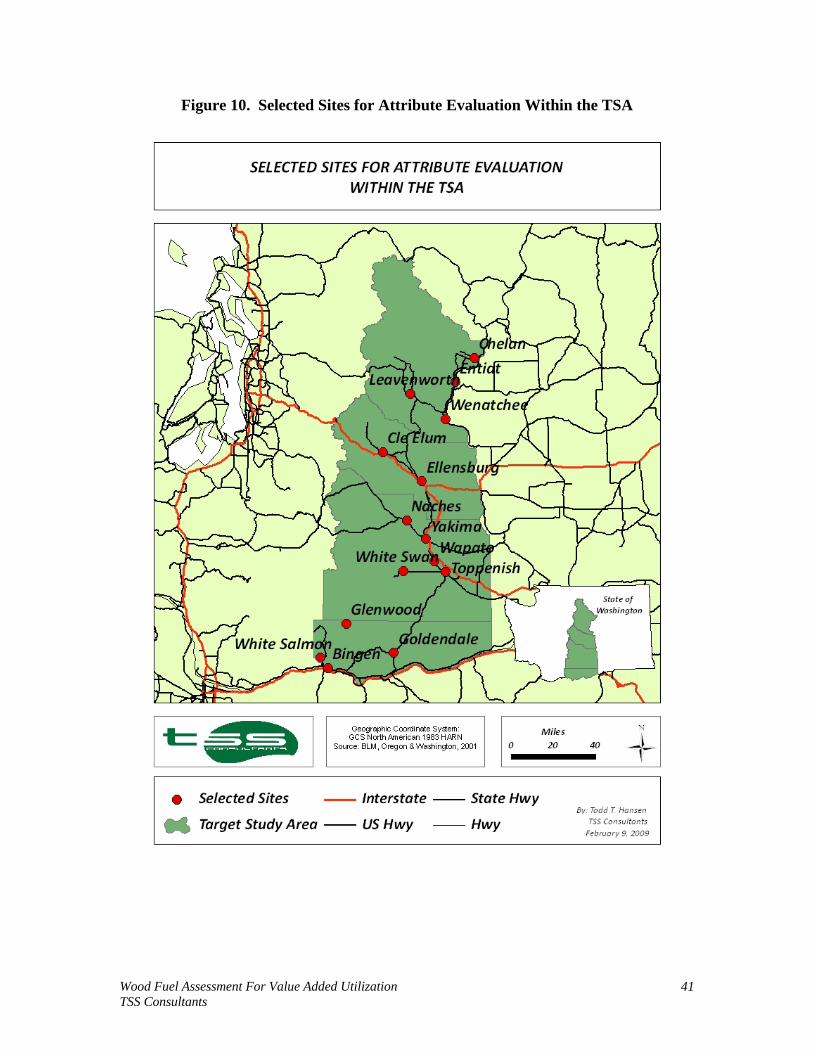
Figure 10. Selected Sites for Attribute Evaluation Within the TSA
Wood Fuel Assessment For Value Added Utilization TSS Consultants
41

Chelan County The population centers selected for attribute review within Chelan County include Leavenworth, Chelan and Wenatchee. The Economic Development staff indicated that there are two parcels located in Chelan, one suitable parcel located in the Leavenworth area, one in Cashmere (12 miles northwest of Wenatchee), three in Entiat (20 miles north of Wenatchee) and one in Wenatchee. Nearly all of these parcels have the necessary attributes to meet suitability standards for facilities identified as Existing Technologies according to the Economic Development staff. The limiting factor for some sites is proximity to facilities that may object to dust, noise or particulate from some technologies. While many of the financing incentives are derived from state programs, creatively structured lease rates on public properties may be available as well as the potential for tax exempt bonds issued on behalf of private companies by local public corporations. The current unemployment rate for the county is 7.6%. Rail lines run through Wenatchee, Entiat, Chelan, Cashmere and Leavenworth. However, the only existing spur access is located in Entiat, though sites near Leavenworth and Cashmere are former mill sites and may have some rail opportunities. All major roads through the area are U.S. highways, primarily running north-south (Highway 97) along the Columbia River and one east-west route from Wenatchee toward Seattle. Inexpensive hydroelectric power is available from the Public Utility District of Chelan County. Natural gas is generally unavailable for these parcels. Current operations in the county include a whole log chip operation outside of Leavenworth. USFS-managed lands comprise the vast majority of potentially suitable forest cover that may yield small diameter stems which can serve as raw material for value-added utilization. Kittitas County The population centers selected for attribute review within Kittitas County included Cle Elum and Ellensburg. The information provided by the local Economic Development staff indicated there are currently two potentially suitable parcels located in Cle Elum and three located in or near Ellensburg. One parcel in Cle Elum and one in Ellensburg are less than three acres in size. Parcels of this size will limit opportunities for some technologies. Another of the parcels located near Ellensburg is zoned for residential as well and may limit manufacturing opportunities. A limiting factor for this site is proximity to facilities that may object to dust, noise or particulate, especially if residential development occurs nearby. The current unemployment rate for the county is 9.9%. Rail lines run through Ellensburg and Cle Elum, while the only confirmed siding access is located in Cle Elum. Both locations have excellent access to Interstate Highway 90, facilitating east to west transport. Interstate Highway 82 heads south from Ellensburg. Transport to the north is facilitated by U.S. Highway 97 over Blewett Pass to U.S. Highway 2.
Wood Fuel Assessment For Value Added Utilization TSS Consultants
42

Nearly all of these parcels have the necessary attributes to meet suitability standards for facilities identified as Existing Technologies according to the Economic Development staff. Ellensburg provides inexpensive electricity from its own municipal electric utility, the majority of which is sourced from hydroelectric power. Cle Elum is serviced by Public Utility District #1. Natural gas is generally unavailable for these parcels. Current operations in the county include a whole log chip operation near Cle Elum. The operation has temporarily suspended manufacturing to realign its customer base. USFS managed lands comprise the vast majority of potentially suitable forest cover that may yield small diameter stems which can serve as raw material for value-added utilization. However, there is significant private industrial and non-industrial forestland ownership within and near the county. Klickitat County Goldendale (county seat), Glenwood, and the Bingen/White Salmon area are the three major population centers selected for business development attribute review in Klickitat County. Klickitat economic development staff identified parcels in Goldendale and Bingen/White Salmon with characteristics conducive to all the technologies considered in the TSA. All three towns have water, natural gas, and electric utilities capable of supporting varying levels of industrial enterprise. Bingen/White Salmon has a large development park, three major transportation modes (interstate highway, transcontinental rail, inland-to-ocean barge) and close access to a regional airport. Bingen/White Salmon has the largest capacity to support mid to large-sized enterprise (one large lumber and plywood manufacturer exists with multi-modal shipping capacity, as well as a co-located whole log chip operation). The existing biomass facility is scheduled for expansion to provide heat and steam to associated manufacturing as well as wheel power to the grid. Agricultural processing businesses also have similar scale and capacity. Glenwood business is constrained by location and a small population. Former forest product enterprises have moved to more accessible locations. Development staff describes efforts in Glenwood centering on post and pole manufacturing and other uses of related biomass for landscape/garden material, animal and pet shavings, and densified fuel pellets. Biomass as a fuel for heating (fuels for schools) public buildings may be an ideal business venture in Glenwood. Goldendale has a similar profile but does have city, county and federal government presence. Agriculture is the predominant business. Access to Interstate 84 via U.S. Highway 97 makes Goldendale more viable as a business center than Glenwood. All of these parcels have the necessary attributes to meet suitability standards for Existing Technology facilities according to the Economic Development staff. While many of the financing incentives are derived from state programs, creatively structured lease rates on public properties may be available as well as the potential tax exempt bonds issued by local public development corporations on behalf of private companies contemplating new business development.
Wood Fuel Assessment For Value Added Utilization TSS Consultants
43

Yakima County Yakima County is described by its county development association as a lean entrepreneurial community offering favorable operating costs and a toolbox of incentives for growing companies. Yakima’s location in Central Washington provides businesses efficient access to Pacific Northwest markets. The population centers selected for attribute review within Yakima County includes Yakima, Naches, Wapato/Toppenish and White Swan. The dominant economic sectors for Yakima County are natural resource utilization related. Agriculture and forest/forest products are the dominant business segments. Existing forest product manufacturing facilities located within Yakima County include a sawmill and two whole log chip operations. Tribal and public forests are the primary raw material sources fueling the businesses. Thirty percent (30%) of Yakima County’s employment is in the agricultural and forest product sectors. Thirty-nine percent (39%) of the county’s employment is in government (local, state, and federal). The four largest manufacturing companies in the county are agriculturally related employing over 2,500 people. From 2003 through 2008, county unemployment averaged 7.7%. Modes of transportation include north, south, east and west interstate and state highways. There is an airport in Yakima with regional connections. North-south rail service is provided by Union Pacific, and Burlington Northern provides east-west service. Two local short lines also serve the Yakima Valley. Utilities for the county include electricity and natural gas. Commercial and industrial properties suitable for existing technologies evaluated in this study are located near and within Yakima. Depending upon the site, they have rail, highway and surface road access. Utilities vary. Twenty-two (22) industrial sites are available. Sizes range from 11 to 320 acres. Varying modes of transportation access and egress exist dependent on specific property. Primary and secondary forest product manufacturing sites are available due to closures. Expanding companies in Yakima County can benefit from a state-financed infrastructure fund which can lower the cost of providing access roads, rail lines, sewer and water extension, or other public works needed for industrial development. Yakima County also offers funds through its SIED (Supporting Investments in Economic Diversification) program that can be used to offset or reduce costs of a non-retail development project. Job creation and capital investment are crucial criteria needed to trigger access to state and local infrastructure financing programs. Yakima County and its municipalities are committed to reduce roadblocks and paperwork that stand in the way of private investment projects. Permits and licenses can generally be approved within 30-60 days from the time a company submits completed applications.
Wood Fuel Assessment For Value Added Utilization TSS Consultants
44

Location Summary Analysis TSS, with the assistance of representatives of the RC&D, identified 12 communities geographically distributed throughout the TSA and 18 different business development attributes (see Table 25) for a “fit” review of new business development opportunities. TSS collected business development data for the 12 TSA selected cities, towns, and city/town combinations (locations). Bingen/White Salmon is a combination example. The two communities are municipally distinct but economically linked. Relative scores of one (1), two (2), and three (3) were assigned for each attribute for each location. Higher scores result in a higher relative ranking as a desirable site for locating a small diameter or biomass utilization enterprise. Each location’s scores were summed. The scores are meant to be qualitative, not rigorously quantitative. The sum of the relative scores provides a competitive comparison of the TSA’s cities, towns, and city/town combinations. This review is based on generalized descriptions of available data provided by economic development agencies, personal contacts, and TSS research. It is not meant to be used as critical decision-making information. It is meant to be helpful in providing some guidance in assessing potential business opportunities at locations within the TSA. Data in Table 25 was also used in TSS’ Technology to Location Relative Suitability Ranking (Table 26). That analysis is an investigation of where business technologies identified in the study might match community attributes. The technologies considered are those that fit small diameter log and biomass raw materials found throughout the TSA. The suitability index is a general and qualitative “fit” assessment of small diameter log and biomass manufacturing business technologies. Table 25 below shows basic data for each selected location as well as the relative ranking of attributes for each.
Wood Fuel Assessment For Value Added Utilization TSS Consultants
45
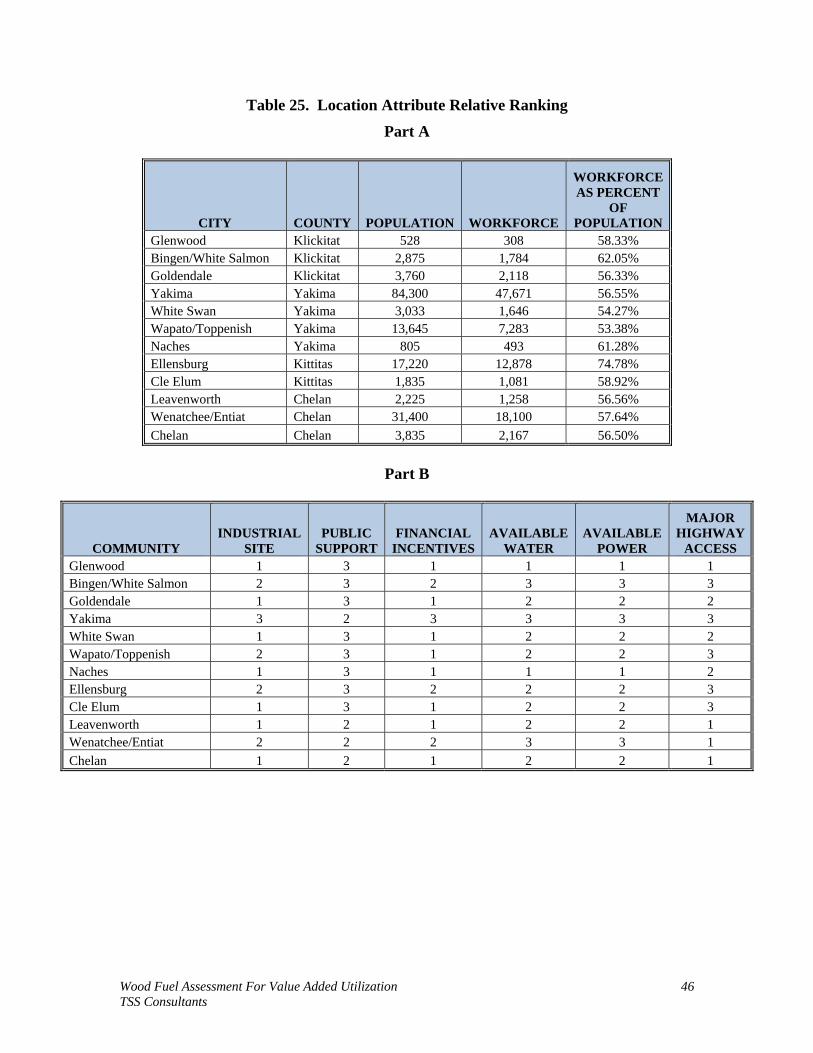
Table 25. Location Attribute Relative Ranking
Part A
CITY COUNTY POPULATION WORKFORCE
WORKFORCE AS PERCENT
OF POPULATION
Glenwood Klickitat 528 308 58.33% Bingen/White Salmon Klickitat 2,875 1,784 62.05% Goldendale Klickitat 3,760 2,118 56.33% Yakima Yakima 84,300 47,671 56.55% White Swan Yakima 3,033 1,646 54.27% Wapato/Toppenish Yakima 13,645 7,283 53.38% Naches Yakima 805 493 61.28% Ellensburg Kittitas 17,220 12,878 74.78% Cle Elum Kittitas 1,835 1,081 58.92% Leavenworth Chelan 2,225 1,258 56.56% Wenatchee/Entiat Chelan 31,400 18,100 57.64% Chelan Chelan 3,835 2,167 56.50%
Part B
COMMUNITY INDUSTRIAL
SITE PUBLIC
SUPPORT FINANCIAL
INCENTIVES AVAILABLE
WATER AVAILABLE
POWER
MAJOR HIGHWAY
ACCESS Glenwood 1 3 1 1 1 1 Bingen/White Salmon 2 3 2 3 3 3 Goldendale 1 3 1 2 2 2 Yakima 3 2 3 3 3 3 White Swan 1 3 1 2 2 2 Wapato/Toppenish 2 3 1 2 2 3 Naches 1 3 1 1 1 2 Ellensburg 2 3 2 2 2 3 Cle Elum 1 3 1 2 2 3 Leavenworth 1 2 1 2 2 1 Wenatchee/Entiat 2 2 2 3 3 1 Chelan 1 2 1 2 2 1
Wood Fuel Assessment For Value Added Utilization TSS Consultants
46

Part C
CITY RAIL
ACCESS AIR
DISCHARGE WATER
DISCHARGE LAND USE
OTHER ENVIRONMENTAL
ISSUES
RAW MATERIAL
SUPPLY Glenwood 1 3 1 3 2 2 Bingen/White Salmon 3 2 2 3 2 2 Goldendale 1 2 2 3 2 1 Yakima 3 1 3 3 1 2 White Swan 3 1 2 3 2 3 Wapato/Toppenish 3 1 2 3 2 2 Naches 1 2 1 3 2 2 Ellensburg 2 2 2 3 1 2 Cle Elum 3 1 1 3 1 2 Leavenworth 2 1 1 3 2 1 Wenatchee/Entiat 3 2 2 3 1 1 Chelan 1 2 2 3 2 1
Part D
COMMUNITY RELATIVE
SCORE RANK Glenwood 20 6 Bingen/White Salmon 30 1 Goldendale 22 5 Yakima 30 1 White Swan 25 3 Wapato/Toppenish 26 2 Naches 20 6 Ellensburg 26 2 Cle Elum 23 4 Leavenworth 19 7 Wenatchee/Entiat 25 3 Chelan 20 6
Brief explanations of the attributes reviewed that are associated with each location are shown below.
• Industrial Site: Existence, quantity and quality of industrial locations that could accommodate and are compatible with one or all of the study technologies; quantity is self explanatory; quality accounts for site development level, study technology(s) compatibility, and location. A zero rating for Industrial Site would indicate that there are none.
• Public Support: This is a “soft” approximation of the support each study
community offers new business. No study community scored lower than medium.
Wood Fuel Assessment For Value Added Utilization TSS Consultants
47

• Financial Incentives: Most financial incentives flow from federal and state programs; often community size is directly correlated to available incentives at the local level.
• Available Water: Wells; municipal water systems; industrial water systems;
actual versus planned; quantity; quality.
• Available Power: Existence, residential, commercial, industrial, provider.
• Major Highway Access: Proximity, road class: city, county, state, federal; north/south/east/west.
• Rail Access: Mainline (e.g., Union Pacific), short line, spurs serving study
communities.
• Air Discharge: Highly regulated air shed/basin; permitted discharges; restricted activities.
• Water Discharge: Residential, urban, commercial waste water regulations and
facilities and treatment options.
• Land Use: Targets technology use restrictions.
• Other Environmental Issues: Known wild cards; localized issues with dust, noise, industrial traffic, particulate.
• Raw Material Supply: Timber harvest volumes; producers – private
nonindustrial, industrial, Tribal, county, state, federal; forest product manufacturing byproducts (chips, saw dust, planner shavings, hog fuel); agricultural.
The relative scores of the TSA cities, towns and combinations analyzed indicate that Bingen/White Salmon and Yakima have the most favorable attributes for business development. These are qualitative indices that reflect positive business establishment and growth within the TSA. Large differences between analyzed subjects may indicate clear differences. Relatively small differences suggest similarities between evaluated subjects. Locations that are ranked second include Wapato/Toppenish and Ellensburg. Third tier ranking included Wenatchee/Entiat and White Swan. The Bingen/White Salmon combination was assigned a favorable ranking over many other of the study’s selected locations. It has multiple transportation modes, access to predictable resources, and access to large urban markets. Communities centered (more isolated) within the TSA may have a distinct advantage in accessing larger quantities of small diameter and biomass material supplies.
Wood Fuel Assessment For Value Added Utilization TSS Consultants
48
Finally, higher relative scores indicate generally better attributes for the business technologies considered in the study. An individual city, town, or combination may have a clearly better environment for establishment of one specific utilization technology considered in the study. This may be the case even if that entity’s relative score is lower than other subject municipalities included in the study. Existing Technologies TSS and representatives from the RC&D reviewed and designated the following technologies to be evaluated for prospective siting and suitability within the TSA. Biomass for Thermal Energy Thermal heating applications using biomass fuels within rural forested regions of the United States is an emerging sustainable strategy to replace conventional fossil fueled technologies. It is an early adaptation program using public incentives to develop sustainable fuel sources and improved public forest management. Markets are rural community public buildings that create heat or steam for heating using oil or natural gas fuel. They are particularly vulnerable to global fuel oil and natural gas supply fluctuations. Outcomes are less volatile heating costs; increased forest-based business employment; improved forest management opportunities and lower carbon emissions. Carbon dioxide emissions generated in the wood combustion process are typically 90% less than when burning fossil fuel. Thermal heating fuels are available in two primary forms: biomass and densified fuel pellets. Biomass may include wood chips, sawdust, shavings, and bark. It may also be a combination of ground wood waste and bark. Fuel pellets are an extrusion product that converts biomass into small (residential) and large (industrial) size pellets. Fuel uniformity is a critical criterion for efficient heat generation. Biomass is sourced from forest product manufacturers and from forest management activities that include forest harvesting and silvicultural improvement projects. Sound forest management yields healthier and more sustainable forests. Keys to successful operations include communities with public buildings needing heat or steam with close proximity to biomass production operations; predictable biomass production; conversion capital; managed public and private forests; stable forest product manufacturers; developed public roads and forest highway systems; and predictable timber harvest volumes and forest management activities. The most significant potential customers for thermal heating facilities using biomass fuels are rural communities located near functioning public and private forests; that have public (primary users) and private (secondary users) buildings scaled at a minimum 100,000 square feet in size; and that require heat and steam for space heating. Capital investments to convert fossil fuel thermal operations to biomass thermal operations are estimated at $250,000 to $500,000, depending on circumstances (e.g., scale).
Wood Fuel Assessment For Value Added Utilization TSS Consultants
49

Thermal heating conversion locations generally require heavy truck ingress and egress; fuel storage structure; material handling equipment; and maintenance shop. Less than one acre is usually sufficient. Fuel use is directly dependent upon project scale. Fuel requirements range from 300 to 20,000 green tons per year, roughly 12 to 800 truck loads annually. The “Fuels for Schools and Beyond” program is the most notable example of a successful biomass-fueled thermal heating program. The program uses partnership between the USDA Forest Service’s State and Private Forestry Division, the State Foresters of Montana, North Dakota, Idaho, Nevada, Utah and Wyoming, and the Bitter Root Resource Conservation and Development Area, Inc., to promote and facilitate the use of forest biomass waste for heating, cooling and power in public and private buildings. Similar programs are now in the northern lake states and the northeast United States. Post and Pole Operations Manufactured posts and poles is a small, generally localized, but important segment of the western U.S. forest product value chain. The industry’s production levels have been declining since 1990. The decline is partly attributed to a reduction in availability of the preferred raw material species, lodgepole pine. This is especially true in the case of federally controlled and managed forests in the western U.S. Additionally, poles and posts were not treated (preserved) properly, and markets switched to more predictable substitute products (wood plastic composites, metal) rather than continue procuring inferior posts and poles.23 Lodgepole pine is the preferred species for several reasons. Its thin bark makes it relatively easy to peel, the high proportion of sapwood facilitates ease of treatment with preservative, and the tree grows in pure, dense stands that produce uniform raw material piece sizes. Extraction costs are low because suitable stands are concentrated and easily accessible. Lodgepole pine is generally very straight, with minimal taper, and naturally sheds its branches. These characteristics expedite processing with minimal waste. Most importantly, its market price has been low (favored for paper production rather than for lumber). Alternative timber species for post and pole production have primarily been white fir and ponderosa pine. These are less desirable because they are not as strong or receptive to treating as lodgepole. During the last decade, federal supplies of lodgepole pine have declined and shifted increasingly to non-industrial private forest lands. The current supply from federally- managed lands is approximately 44%. Remaining supplies are sourced from industrial, non-industrial and Canadian imports. Montana and Oregon produce the majority of posts and poles, with 60% of production in 2001.24 Few post and pole producers extract raw logs, mostly relying on delivered logs from private logging contractors.
23“A Characterization of the Western US Post and Pole Industry” by Roy C. Anderson, Montana State University, Larry Swan, USFS, Edwin Burke, University of Montana, October 2004. 24Ibid.
Wood Fuel Assessment For Value Added Utilization TSS Consultants
50

California and Washington are the major west coast post and pole markets. Local and regional markets are extremely important to post and pole economic viability. This makes marketing a key success strategy. Product lengths of posts are primarily 8, 10 and 12 feet. Many operations focus on the 8 foot post and 10 foot rail fencing markets. Other operations produce a variety of specialty products ranging from poles for hops growers to stakes for berry farms. The majority of the west coast markets demand treated posts and rails. Post and pole manufacturers typically accept raw material (logs) with top inside bark diameters down to 2 inches. Raw logs for post production usually range from 5 inches to 7 inches in diameter and 3 inches to 4 inches for rails. Smaller logs (2 inches) are used for stakes, specialized custom fencing, and exterior housing trim in the southwest United States. Most post and pole manufacturers rely upon delivered logs in lengths suitable for transport on log trucks. Some operations rely upon logs cut and delivered in finished product lengths. Post and pole manufacturing sites relying upon delivered logs for their raw material supply indicate preferred site size of approximately 10 acres with 3 phase electricity service (though many producers successfully operate on fewer acres). Initial capital requirements range from $100,000 to $200,000 for processing equipment and rolling stock, not including site acquisition and improvements. Ten-acre sized operations with four employees commonly must produce 400 to 600 posts/poles per day to remain economically viable. Some operations prefer onsite air drying capability to reduce moisture content prior to shipping for treatment. Post/rail producers indicated a preference for raw material (logs) that has remained felled in the woods to reduce moisture content to improve manufacturing and treating. Primary post and pole manufacturing byproducts are bark, shavings, sawdust, and firewood. Shavings are produced as logs are rotated and peeled to remove bark and more cylindrical products. Most operations attempt to market byproduct shavings locally as animal bedding. Large, unmanageable byproduct inventories are sold as biomass fuel or landscaping raw material. Locally marketed firewood is typically a byproduct of rejected log segments unusable as posts or rails. Key operationally successful elements are well-developed markets, availability of quality (straight stem, little defect) lodgepole pine, industrial sites removed from residential or developed areas, and access to transportation and distribution centers. These operations produce noise, dust and particulate and are best suited to industrial settings. Compost/Mulch/Soil Amendment/Landscape Cover The majority of the businesses in this industry typically rely upon forest product manufacturing byproduct (e.g., sawmill residuals) for the bulk of their raw material requirements. This material may consist of wood chips, shavings, bark, sawdust or a mix of each of these byproducts. This provides a relatively inexpensive source of raw
Wood Fuel Assessment For Value Added Utilization TSS Consultants
51

material for use in compost and mulch development, soil amendment, or as decorative landscape cover. Products developed from grinding material generated from forest-based operations such as fuel treatments, stand improvement projects and timber harvesting are typically reprocessed until suitably sized for use as compost/mulch or soil amendment. Larger material is separated for use as landscape cover. The product marketed as landscape cover can be dyed to a particular color, creating uniform products, or sold un-dyed as natural cover material. Packaged products (e.g., one cubic foot bags) are sold to regional markets or in bulk to local markets or secondary processors. Markets for both product lines would include existing landscape yards, vineyards and industrial-sized nurseries and farms. The development of a landscape yard with a product line consisting solely of processed forest residuals would probably be ineffective. Successful landscape yards typically market a variety of products, including sand, gravel and rock products, in addition to bark, landscape cover, compost/mulch and soil amendment. The best opportunities are for grinding contractors to develop marketing relationships with such existing facilities. Key operational successful elements are: well-developed markets, abundant availability of raw material, industrial sites away from residential or developed areas, access to transportation and distribution centers. These operations produce noise, dust and particulate and are best suited to industrial settings. Consolidation or primary processing sites can be large in size and must have access to large residual suppliers like sawmills and other equivalent forest product manufacturers. Proximity to large urban areas with suburban communities is a plus for local market outlets. Truck and rail access are very important. Densified Fuel – Pellets In the United States there are currently two main product lines of pellets: the residential heating market and commercial power generation market. The specifications for pellets produced for the residential heating market are related to product purity, ash content, density and fine material. The largest market for residential heating pellets is the eastern United States. The majority of residential heating pellets produced in the west coast region are marketed regionally to various retail outlets. The market for pellets has historically been seasonal, with operations generating and financing inventory for marketing during the winter months (peak heating demand season). Cold winters and rising energy costs have a significant impact on an operation’s financial performance. Facilities generating product for the residential heating market typically use clean shavings and sawdust from primary and secondary wood product manufacturing operations. This material is blended together in a hopper and fed into a rotary drum dryer to reduce moisture content to between 8% and 10%. The blended mixture is then forwarded to a surge bin and a pelletizer which extrudes the mixture through a die,
Wood Fuel Assessment For Value Added Utilization TSS Consultants
52

processed to a specific length, screened for fines and sent for packaging. The waste product of fines are screened and used as fuel for the dryer in the manufacturing process. The typical operation will develop between 48,000 to 60,000 tons of residential pellets per year. The minimum production for economic viability is estimated to be 25,000 tons. The preferred species for production includes Douglas-fir, western larch and all pine species. Hog fuel (sawmill residual made up of bark and sawdust) is not used for residential heating market pellets because of the potential for dirt and excessive fines in the material. Commercial pellet manufacturers will use raw materials with more ash content and will accept a certain percentage of hog fuel. Forest-sourced residuals are currently not utilized for the residential heating market due to the possibility of material contamination (high bark and needle content). Additional screening and related increased processing costs constrain utilization of this material. Minimum operation site requires 10 acres with 3 phase electricity and a transformer capable of powering up to 3,000 horsepower engines. The effective operation of these facilities typically requires 12 employees. Water is not used in manufacturing and there is no wastewater discharge. The environmental permitting for air quality is extensive. Pellet manufacturing facilities are best located away from residential areas to avoid noise, dust, traffic and particulate complaints. A significant increase in processing cost would be incurred for a facility utilizing forest- sourced biomass material for pellet production for the residential heating market. Most facilities are located adjacent or very near primary or secondary wood products manufacturers. The typical pellet manufacturer will locate near the raw material supply and as close to the customer market as possible. Backhaul opportunities are important to reduce raw material and finished product transport costs. Economically viable alternatives are commercial pellet production or perhaps facility development capable of raw log processing for pellet production. The current U.S. market for commercial pellets is very limited. Most viable market opportunities are industrial-scale power generators in China, Japan and Europe. The generally prevalent scenario is pellet production to raw material supply and bulk shipping to final market (e.g., Australia timber and production with bulk water transport to Japan). There are facilities located in Colorado utilizing delivered logs as their primary source of raw material. The processing costs are higher due to the two-step chipping/grinding process to develop suitable raw material, and the facility requires more space (40 acres) for log inventory than facilities relying upon sawmill residuals for raw material.
Wood Fuel Assessment For Value Added Utilization TSS Consultants
53

Whole Log Shavers The primary shavings market is animal bedding. Though this implies primary use in barn stalls, the use of shavings in the equestrian market is much more diverse. One operation interviewed indicated their primary market consisted of equestrian centers and racetracks. The product is used as dust abatement as well as animal bedding. However, its use as dust abatement applied on the ground is not recommended in moist environments as it will absorb water. As in most of these industries, the key is developing markets and developing product to fit their specific requirements. The size of production facilities can range from garage-based businesses utilizing substantial hand labor to automated production lines and packaging systems. The automated production lines consist of using delivered logs, with a maximum butt size of 17 inches and a minimum top diameter of 2 inches inside bark. The major species of preference in the market is ponderosa pine, but Douglas-fir is used as well. With animal bedding for personal pet markets, cedars are the preferred species. Commercial-scale facilities will even mix ponderosa pine and other species (such as Douglas-fir) together. Though not all facilities sell their product in dry form, most markets prefer the dry product. For production of shavings from whole logs, the logs are initially cut into 8 foot lengths. For small-scale, manual operations, the shaving machine may require lengths as short as 4 feet. The 8-foot lengths are then screened to eliminate fines and large, unattached material. After being cut to desired lengths, the logs are deposited into a hopper and horizontally moved across the shaver blades. The shavings material is conveyed into covered storage and forwarded to the automated packaging machine where it is bagged and palletized for transport. In small-scale, manual operations, the bagging and loading is performed by hand. The fines generated as waste byproduct can be marketed to composite panel manufacturers or burned to dry the shavings. The larger material can be reprocessed for use in the drying process or sold into the local firewood market. Annual production for automated processors is a minimum of 31,000 cubic units.25 This minimum production level requires delivery of 1,040 loads of logs or 26,000 green tons of logs annually. The preferred site size is 10 acres with 3 phase electricity; however, it is possible to operate successfully on fewer acres. The cost for automated facility installation, including packaging, is approximately $1.25 million. The small, manual units can be purchased for as little as $6,000. There is no use or discharge of water in the manufacturing process. The operation of these facilities creates noise, dust and air particulate and as such are best located in industrial settings away from populated areas. Air discharge (e.g., dust and particulate matter) may require environmental permitting in Washington.
25A cubic unit is a measure used in the pulp and paper industry equaling approximately 200 cubic feet.
Wood Fuel Assessment For Value Added Utilization TSS Consultants
54
Whole Log Chipping The whole log chip (chip mill) industry within forested regions of the United States is an important part of the forest product value chain. Chips are produced from two primary raw materials: chip grade logs or portions of saw logs. Chip grade logs are generally too small26 or of poor quality27 to be used for lumber or plywood (panel) manufacture. Saw log chips are produced from those parts of a log cylinder that cannot be manufactured into lumber or veneer for panels. Keys to successful operations are: developed highway systems, short haul distances to market (pulp and paper, biopower generation, large landscape and nursery operations), and predictable, closely located abundant wood chip and fiber volume. Existing forest product manufacturing businesses are a plus and may offer the best co-location opportunities. Existing industrial sites, permitted and developed, are a plus. The most significant customers for whole log chips are pulp and paper manufacturers. Production levels are directly linked to those markets. Pulp and paper operations are always located near large sources of water. This makes access to water transportation a logistical plus when longer supply distances exist. The primary chip mill products are sorted, clean chips. Chips are the basic raw material for all predominant paper grades. They can be sold by specie (e.g., Douglas-fir) and type (softwood or hardwood). Secondary chip products include sorted bark and hog fuel. Sorted bark primarily enters landscaping and biomass fuel markets. Hog fuel directly enters biopower markets in raw form or in ground-up form. Chip mill locations are generally determined by linear program analysis of raw material supply quantity, quality and availability juxtaposed with market location, raw material supply ownership, and transportation networks. Chip mill capital requirements range from $10 to $30 million dependent upon scale of operation. Chip mill configuration is capable of including biopower cogeneration. Capital investment for a cogeneration option is greater than the chip mill investment. Chip mill site locations generally require unrestricted log truck ingress and egress; central mill foot print locations; material handling equipment; maintenance shop; and inventory space for raw material supply storage (logs). Ten acres is a minimum but that size considerably restricts operations. Highways, rail links, and water transportation play important parts in siting new whole log chip mills. Direct employment is generally 20 to 35 people dependent upon size and specific conditions. Indirectly, employment in raw material extraction, transportation, and service increases when new, untapped raw material supplies are accessed (e.g., public lands forest health improvement programs). Coniferous forests are the predominant forest cover types near the sites being analyzed in the study. During the last 20 years, raw material supplies have increasingly shifted away from federally-managed lands to industrial and non-industrial forest lands. Leveraging 26The small end of the log cylinder is less than three inches. 27Logs that are not straight or with characteristics that prevent lumber or veneer manufacture.
Wood Fuel Assessment For Value Added Utilization TSS Consultants
55

federal forest health improvement programs may provide opportunity for increased volume inherently suited to whole log chip manufacturing. Additional funding that targets fuels reduction projects included in the American Recovery and Reinvestment Act may facilitate a short-term ramp up of activity on public and private lands. The whole log chip niche must outcompete new sawmill design technology that competes for similar raw material. That technology essentially recovers a small quantity of higher-valued lumber from a chip quality raw material (logs). Transportation networks accessing chip mill raw materials must generally be limited to short hauls (less than 50 miles)28 or have backhaul opportunities. Ideal location sites are near forest resources and former and/or existing forest product manufacturing sites. Noise, dust, and organic particulate materials are generated during whole log chip production. This makes industrial locations the most attractive settings. Access to pulp and paper manufacturing customers is paramount unless a new and innovative use of low-value forest fiber can be developed. Wood Plastic Composites Wood Plastic Composites (WPC) are manufactured from combinations of two recycled materials: plastics (resins) and wood fibers.29 WPC are generally extruded or molded. Products range from residential decking to dolphin bumpers at maritime ports. Until the early 1990’s, the automotive industry was the largest user of WPC. Residential use of WPC as decking, fencing, siding, and roofing is projected to grow, replacing wood, stucco, brick, metal and asphalt composites. Plastic composites without wood fiber or with sealed exterior surfaces are now growing in use. These products avoid degradation due to microbial decay of wood fiber within WPC. Keys to successful WPC manufacturing operations include: stringent manufacturing controls that ensure quality; low-cost raw material supplies (access to recycled plastics and wood fiber); low-cost access to developed transportation systems, short hauls or easy access to markets (urban, suburban, industrial); predictable/stable power; and a reliable industrial work force. Existing industrial sites, permitted and developed, are a plus. The largest markets for WPC are home construction and renovation and industries that use recyclable bins, pallets, shipping containers, and bulk commodity containers (e.g., orchard fruit containers). They are the primary products of the WPC industry. Current market growth is contingent upon growing replacement of wood and other traditional residential and commercial building products. New uses in agriculture and shipping represent large-scale market growth. Capital investment for a WPC manufacturing operation is estimated at from $500,000 to $1,000,000. Pressure and heat are primary requirements for WPC manufacturing. Thus, WPC plants may be compatible with a steam and heat generation operation. WPC plant
28The exceptions are long-distance water and rail transportation. 29“Considerations in Recycling of Wood-Plastic Composites,” Winandy, J.E; Stark, N.M.; Clemons, C.M.; Forest Products Laboratory – USDA Forest Service, Madison, WI; 2004.
Wood Fuel Assessment For Value Added Utilization TSS Consultants
56

locations generally require: unrestricted transportation ingress and egress; multiple transportation modes, material handling equipment; maintenance shop; and inventory space for raw material supply storage (plastics and wood fiber). Direct employment is generally 20 to 30 people, dependent upon business size and specific conditions. Indirect employment consists of raw material handling, storage, transportation, and maintenance/repair. In a 2007 report,30 more than half of the nearly 200 worldwide producers of WPC were located in the United States. European and U.S. manufacturers represented over 90% of the world’s WPC producers. Germany and Austria led research and development with nearly half of the worldwide research centers. Demand for wood-plastic composite and plastic lumber is projected to advance about ten percent per year through 2011.31 Composite and plastic lumber growth is projected to continue, benefiting from durability, low maintenance requirements, and low life-cycle cost. Interest in “green” building products such as WPC continues to grow based on its recycled content. Emerging Technologies Emerging technologies are in various stages of improvement, utilization, and marketability. They represent possible alternatives to existing technologies, perhaps in the near term. Most of the technologies presented are biomass conversion to biofuels (liquid transportation fuels) options. In addition to producing electricity through commercially-available controlled combustion systems, biomass can be converted to fuels and chemicals (biofuels and bio-based chemicals). As biomass is principally composed of cellulose, it can be converted via two principal platforms as indicated in Figure 11. In the sugar (or biochemical) platform, cellulose is broken down into sugars, which are then fermented to produce bioalcohols or chemically converted to other bioproducts. In the thermochemical platform, biomass feedstock can be converted via gasification and/or pyrolysis to form synthesis gas (similar to natural gas) or bio-oils, which can then be converted into a wide variety of bioalcohols, synthetic diesel and gasoline, and bio-based chemicals.
30“Worldwide Market Report on Wood-Plastic Composites” Revised Edition 2007; A. Eder, S. Strobl, P. Schwarzbauer. 31Fredonia Group Inc., September 1, 2007, Pub ID: FG1550112.
Wood Fuel Assessment For Value Added Utilization TSS Consultants
57

Figure 11. Biomass to Fuels and Chemicals
Forest-sourced biomass has been fuel for the generation of electricity for many decades. As such it is a mature and commercial industry. However, the economic production of liquid transportation fuels from biomass has not yet occurred on a commercial-scale basis. There are, though, significant private and public funds being spent on research, development, demonstration, and deployment of emerging technologies that will use forest-sourced biomass to create a variety of liquid fuels, as well as bio-based chemicals. Some of the more promising approaches to using forest-sourced biomass in production of biofuels include:
• Bio-oil (fast pyrolysis)
• Portable bio-oil processing
• Ethanol and other alcohols
• Synthetic diesel and gasoline
• Bio-based chemicals
Bio-Oil (Fast Pyrolysis) Fast pyrolysis of forest biomass produces a liquid product, pyrolysis oil or bio-oil, that can be readily stored and transported. Pyrolysis oil is a renewable liquid fuel and can also be used for production of chemicals. Several reactor configurations have been shown to assure this condition and to achieve yields of liquid product as high as 75% based on the starting dry biomass weight. They include bubbling fluid beds, circulating and transported beds, cyclonic reactors, and ablative reactors. Pyrolysis oil or other thermochemically-derived biomass liquids can be used directly as fuel but also hold great promise as platform intermediates for production of high-value chemicals and materials. Pyrolysis oil has been successfully tested in engines, turbines and boilers and has been
Wood Fuel Assessment For Value Added Utilization TSS Consultants
58

upgraded to high-quality hydrocarbon fuels, although at a presently unacceptable energetic and financial cost. Figure 12 below illustrates the various uses of fast pyrolysis and bio oil.
Figure 12. Fast Pyrolysis and Bio-Oil Uses
Due to the small number and limited scale of existing pyrolysis oil production units, the economics of a commercial-scale unit can only be estimated. Costs of bio-oil production depend on feedstock (pre-treatment) costs, plant scale, type of technology, and so on. There are also technical difficulties that bio-oil production and storage must overcome, i.e., bio-oil has stability problems and is a relatively toxic material (like crude oil). It also needs to be demonstrated that existing oil refineries will take it in and convert it into fungible fuels, such as synthetic diesel and gasoline, as they currently do with fossil-based crude oil. However, bio-oil does show commercial promise, as large conversion facilities co-located with refineries may be able to make synthetic diesel from bio-oil in the $2/gallon range.32 Portable Bio-Oil Processing Using forest biomass for the production of bio-oil has the potential advantage (once the technologies are developed into commercially-viable systems) of producing an added-value energy product that could offset costs of mechanical biomass removal. However, portable pyrolysis units, which can convert biomass into bio-oil directly in the forest, are currently being promoted for the following reasons:
• Transporting bulky biomass to central processing facilities must be minimized or eliminated in order to make forest bioenergy production more economical. Transporting liquid bio-oil is more cost effective than trucking bulky forest biomass, as bio-oil is 6 to 7 times denser than green wood chips.
32 UOP, Inc. Presentation to National Petroleum Refiners Association, February 2008
Wood Fuel Assessment For Value Added Utilization TSS Consultants
59
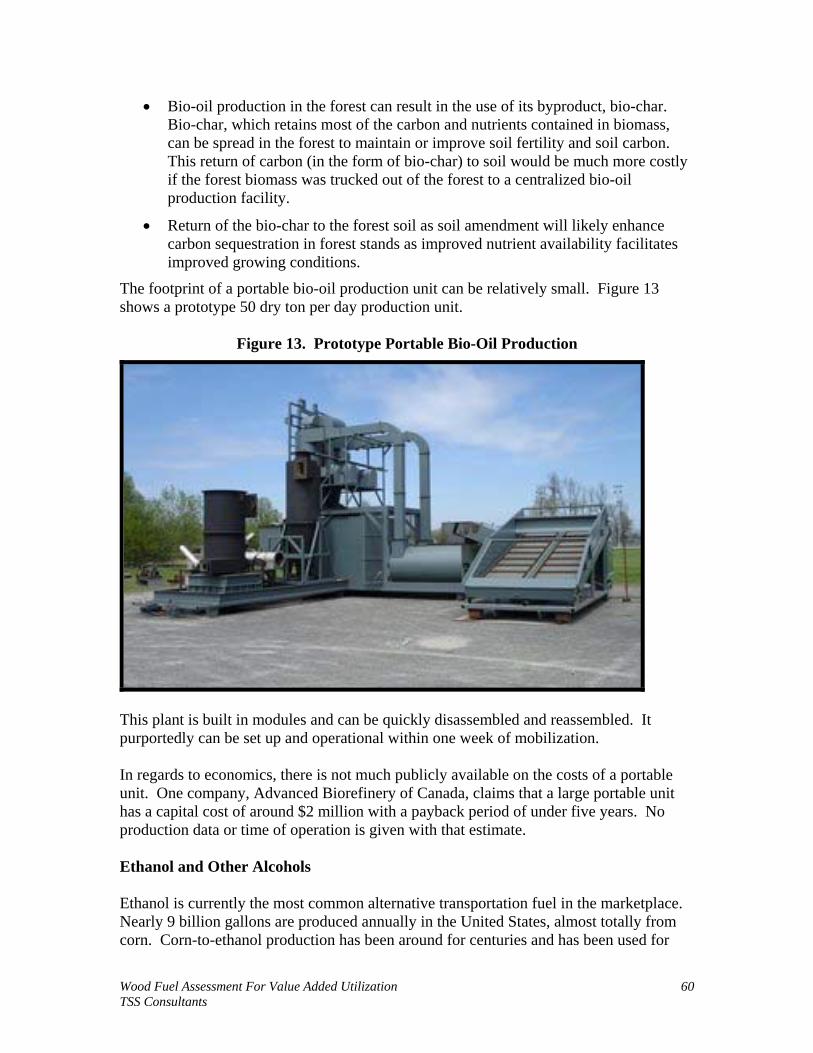
• Bio-oil production in the forest can result in the use of its byproduct, bio-char. Bio-char, which retains most of the carbon and nutrients contained in biomass, can be spread in the forest to maintain or improve soil fertility and soil carbon. This return of carbon (in the form of bio-char) to soil would be much more costly if the forest biomass was trucked out of the forest to a centralized bio-oil production facility.
• Return of the bio-char to the forest soil as soil amendment will likely enhance carbon sequestration in forest stands as improved nutrient availability facilitates improved growing conditions.
The footprint of a portable bio-oil production unit can be relatively small. Figure 13 shows a prototype 50 dry ton per day production unit.
Figure 13. Prototype Portable Bio-Oil Production
This plant is built in modules and can be quickly disassembled and reassembled. It purportedly can be set up and operational within one week of mobilization. In regards to economics, there is not much publicly available on the costs of a portable unit. One company, Advanced Biorefinery of Canada, claims that a large portable unit has a capital cost of around $2 million with a payback period of under five years. No production data or time of operation is given with that estimate. Ethanol and Other Alcohols Ethanol is currently the most common alternative transportation fuel in the marketplace. Nearly 9 billion gallons are produced annually in the United States, almost totally from corn. Corn-to-ethanol production has been around for centuries and has been used for
Wood Fuel Assessment For Value Added Utilization TSS Consultants
60

transportation since around 1900. A major increase in its use in the United States began several years ago in the desire to lessen dependence on foreign oil. Being the prevalent alternative transportation fuel, with heavy price supports and large infrastructure in place, ethanol continues to be the alternative fuel of choice for continued development. As corn to ethanol is known as “first generation” biofuels, cellulose to ethanol is known as “second generation” biofuels. Considerable research, development and deployment efforts are underway for converting wood waste into ethanol (and higher alcohols that naturally form in the thermochemical platform process). As mentioned above, there are two principal methods in creating ethanol: the biochemical (sugars) platform and the thermochemical platform. These are further illustrated in Figures 14 and 15.
Figure 14. Biochemical Platform Process
Basically, sugars are made from the cellulose and then fermented by relatively traditional ethanol fermentation processes. The liquid ethanol is then transported by rail or truck to a gasoline storage and blending facility where it is blended into gasoline. Corn to ethanol is made with the same basic fermentation. The principal (and more costly) difference is that the cellulosic materials must go through a pretreatment step to break down the cellulose into the fermentable sugars.
Wood Fuel Assessment For Value Added Utilization TSS Consultants
61

Figure 15. Thermochemical Platform Process
The thermochemical process uses gasification and/or pyrolysis (another form of gasification) to create a synthetic gas (aka syngas) from the complete breakdown of the biomass. This syngas is then subjected to a catalytic reforming process where the syngas is reformed into liquid ethanol and some other higher grade alcohols (which must be separated via a distillation step). Although it is a very promising method of creating ethanol and other alcohols from woody biomass, no commercial operations currently exist. There are some demonstration-size facilities under construction, but full commercialization of this process is probably three to five (or more) years away. In terms of economics, cellulosic ethanol price must be cost-competitive with corn ethanol and low enough to compete with gasoline. A minimally profitable ethanol selling price of $2.50/gallon can compete on an energy-adjusted basis with gasoline derived from oil costing $75 to $80/barrel. At the lower oil prices ($45 to $50/barrel), cellulosic technology will not be as competitive and could require policy supports and regulatory mandates to drive the market. Synthetic Diesel and Gasoline Synthetic diesel and gasoline from biomass, if not derived from bio-oil refining in a standard oil refinery, can also be produced via the Fischer-Tropsch method. This method is actually the part of the process which turns a syngas made from biomass into the synthetic diesel and gasoline. First the biomass must be converted to syngas by some form of gasification. The Fischer-Tropsch method has been used on coal and natural gas for many decades, albeit not economically competitive without subsidies. The economics of synthetic fuels via Fischer-Tropsch require a relatively high price of crude oil in order to be competitive with petroleum-based fuels without subsidies. As a
Wood Fuel Assessment For Value Added Utilization TSS Consultants
62

benchmark, crude oil prices must maintain a level of $60 to $90 dollars a barrel to allow such synthetic fuels to be profitable. Bio-Based Chemicals Bio-based chemicals and materials are commercial or industrial products, other than food and feed, derived from biomass feedstocks. Bio-based products include green chemicals, renewable plastics, natural fibers, and natural structural materials. Many of these products can replace products and materials traditionally derived from petrochemicals, but new and improved processing technologies will be required, as well as integration into facilities referred to as biorefineries. A biorefinery is a facility that integrates biomass conversion processes and equipment to produce fuels, power, and chemicals from biomass. The biorefinery concept is analogous to today's petroleum refineries, which produce multiple fuels and products from petroleum. Industrial biorefineries have been identified as the most promising route to the creation of a new domestic bio-based industry. By producing multiple products, a biorefinery can take advantage of the differences in biomass components and intermediates and maximize the value derived from the biomass feedstock. A biorefinery might, for example, produce one or several low-volume, but high-value, chemical products and a low-value, but high-volume, liquid transportation fuel, while generating electricity and process heat for its own use with perhaps enough for commercial sale of electricity. The high-value products enhance profitability, the high-volume fuel helps meet national energy needs, and the power production reduces costs and avoids greenhouse-gas emissions. The economics of biorefineries, given their need for economies of scale, will require large facilities and large amounts of biomass material. Generally a minimum of 1,000 BDT of biomass would be needed for a single biorefinery-type installation of economic scale. This would calculate to a need of 330,000 BDT annually. Mobile Pellet or Briquette Machine The only mobile pellet operation (in the Pacific Northwest) with a successful development history for the residential pellet market was developed by Western Oregon Wood Products.33 The company placed a small pelletizer on a flatbed trailer and transported the equipment to Las Vegas to utilize urban wood waste to generate residential pellets. The equipment was subsequently transported back to Oregon and is currently operating as a stationary facility. The company indicated that transporting the equipment by trailer or flatbed is easily facilitated. While moving the equipment to remote, forested locations to utilize fuels treatment and timber harvest residuals was not an issue, recoverability of marketable product would prove to be problematic. In addition to the pelletizer, grinding equipment and a
33Discussion with Mike Knobel, Director of Operations for Western Oregon Wood Products, Inc.
Wood Fuel Assessment For Value Added Utilization TSS Consultants
63

hammermill are needed to develop a product suitable for use as fuel pellet raw material. Without substantial screening or separation of ground material, potential introduction of contaminants make the residential pellets unsuitable for markets. The product is then suited only for commercial use and becomes more difficult to market and less profitable. Proponents of mobile pelletizers mentioned previously in this report intended to use machines configured to produce pellets unsuited to the residential heating market. These machines were designed to manufacture a small wood briquette as a two inch cube. The manufacturing process is very similar to that characterized previously in this report. Pellet production with use of grinder only will develop a pellet with coarser material, also unsuited for the residential pellet market. In short, production may have proceeded without adequate market development for commercial-grade pellets. The market for this product within the United States is still in development stages, and this product line is not commercially ready at this time. Technology and Location Ranking Table 26 contains the relative ranking of the selected value-added utilization technologies by location. The rankings reflect general suitability of value-added product technologies to the study’s locations and their associated attributes. Attributes include raw material supply availability (small diameter logs and biomass), modal transportation availability, markets, existing regional competition, and general environmental and infrastructure conditions that are favorable.
Table 26. Technology to Location Relative Suitability Ranking
CITY
BIOMASS FOR
THERMAL ENERGY
POST & POLE
COMPOST/MULCH
ETC.
DENSIFIED FUEL
(PELLETS)
WHOLE LOG
SHAVERS
WHOLE LOG
CHIPPING
WOOD PLASTIC
COMPOSITES Glenwood High Low Low Medium Medium Low Low Bingen/White Salmon Medium Low Medium Low Medium Low High Goldendale Medium Medium Medium Low High Medium Medium Yakima Low Medium High Medium Medium Low Medium White Swan High High Medium High High Low High Wapato/Toppenish Medium Medium Medium Medium Medium Low Medium Naches High Medium Medium Low High Low Low Ellensburg Low Medium Medium Low High Low Low Cle Elum Medium Medium Medium Low Medium Low Low Leavenworth Medium Low Medium Low Medium Low Low Wenatchee/Entiat Low Low High Low Medium Medium Low Chelan Low Low Medium Low Medium Medium Low
The rankings above are not exclusionary. A characterization of “medium” or “low” certainly does not indicate unsuitability of the technology to a particular location. Based upon a review of the rankings above, biomass for thermal energy would fit best in Glenwood, White Swan and Naches. Supply and markets are favorable. Public forest
Wood Fuel Assessment For Value Added Utilization TSS Consultants
64
supply should produce needed raw materials with its emphasis on forest health improvement. Markets are smaller public buildings that can be retrofitted to use biomass fuels. “Fuels for Schools” programs have been successfully initiated in rural forested regions with access to biomass fuel sourced from public forests. The best relative location for a post and pole operation is White Swan. The market demands lodgepole pine posts and poles, as characterized previously within this report. White Swan area forest vegetative cover is heavy to lodgepole pine. Supply security is critical for any business. Ready access to private timber supplies (including Tribal) and those managed by the WDNR, which exist in the White Swan area, provide a potentially secure supply. Glenwood is also close to private timber suppliers. A post and pole business has entered the Glenwood supply region, which renders Glenwood with a low suitability for a new post and pole business. Compost/mulch manufacturing requires residential and commercial landscape markets for its products. Compost/mulch businesses are typically located near more heavily populated areas that have increasing development. Densified fuel (pellets) for the residential heating market is very competitive in the western United States. Production advantages exist for facilities located in close proximity to sources of forest products manufacturing byproduct. Dried ponderosa pine is the preferred species for the shavings market. These facilities will occasionally compete with whole log chip manufacturing for raw material. As with densified fuel production, wood plastic composite manufacturing achieves cost advantages when utilizing forest products manufacturing byproduct. As is the case for most of these operations, security of raw material supply and market development is paramount to success. Private enterprises are reluctant to predicate business planning upon supply controlled by federal agencies subject to government funding, planning, and bidding processes. Also, the potential for litigation regarding land management activities on federal lands adds a layer of vulnerability (risk) that many private sector enterprises find challenging. Current Opportunities Within the TSA There are existing synergies for marketing biomass product within the TSA. As characterized previously in this report, there are two biomass power facilities currently being considered located either within or tributary to the TSA, and one existing facility scheduled for expansion. As Figure 10 clearly indicates, the raw material supply areas of proposed biomass power facilities located at White Swan and Omak very nearly intersect and, in fact, cover the majority of the TSA. The raw material supply area of the proposed facility located at White Swan overlaps significantly with the existing facility located at Bingen. All of these facilities will rely heavily upon residuals from co-located wood products manufacturing facilities. However, some of the balance of supply will be sourced from residuals produced from forest operations within the TSA.
Wood Fuel Assessment For Value Added Utilization TSS Consultants
65

Figure 16. Core Fuel Market Sourcing Regions for Potential Biopower Facilities in
Central Washington
Operations within the TSA generating biomass as manufacturing byproduct as well as those considered as “existing technologies” for small diameter or biomass value-added utilization are shown below in Figure 17.
Wood Fuel Assessment For Value Added Utilization TSS Consultants
66

Figure 17. Potential Biomass Synergy Opportunities Within the TSA
The facilities shown in Figure 17 provide clear opportunities for sourcing byproducts generated from fuels treatment, stand improvement, forest restoration projects as well as residuals from timber harvest operations. There are a number of whole log chip operations distributed throughout the TSA. Currently the facility located at Cle Elum is
Wood Fuel Assessment For Value Added Utilization TSS Consultants
67
not operating. An interview with the fiber procurement manager indicated that the facility is scheduled to resume operation in the near term. The facility located outside of Leavenworth is sited on a small parcel leased from the USFS. With a curtailment of management activities on local industrial private lands, this operation has begun to look toward activities on USFS managed lands for raw material opportunities. The operation was suspended for a short period while the facility’s primary chip market stabilized supply. The whole log chip facility located on Boise Cascade’s previous plant site in Yakima has long-term plans for non-industrial development by its owners. It currently operates as a chip production facility and has substantial log inventory on site. Indications are that when current log inventory is processed, the owners will begin serious evaluation and planning of urban development potential. There is a sawmill and whole log chip operation at White Swan. The sawmill is owned and operated by Yakama Forest Products. The chip operation was initiated by Boise Cascade’s pulp and paper facility at Wallula to augment supply after sawmill production curtailment and the divestiture of Boise Cascade’s pulp and paper from their other forest products manufacturing operations. The Mt. Adams Resource Stewards collaborative group is currently attempting to locate a post and pole manufacturing facility in Glenwood. Further south in Bingen, SDS Lumber Company operates a sawmill and plywood, whole log chip and biomass facilities. As mentioned previously, the existing biomass facility is scheduled for a significant capacity expansion. FUTURE SUPPLY SOURCES AND RISKS
The primary mitigation measure to minimize the impact of potential or current biomass supply competition is to concentrate procurement efforts in the development of suppliers located close in and tributary to facility location. Clearly, a project will have significant transport cost advantages when sourcing biomass generated within a 40 to 50 mile radius of its location. An additional mitigation measure to minimize the impact of competing biomass purchasers is to secure stable and price competitive sources utilizing long-term supply agreements. As market conditions improve and the forest products industry increases production, manufacturing byproducts production will increase as well. This material has historically been a relatively inexpensive source of supply. Manufacturing reliance upon supply from more expensive sources, such as forest-sourced material, will decline as cheaper product becomes available. Without the ability to market non-merchantable sawlog product generated from timber harvesting and fuels treatment, the number of acres subject to such operations will decline. However, improved market conditions would also potentially increase merchantable sawlog value. For timber harvest operations and fuels treatment with some sawlog
Wood Fuel Assessment For Value Added Utilization TSS Consultants
68
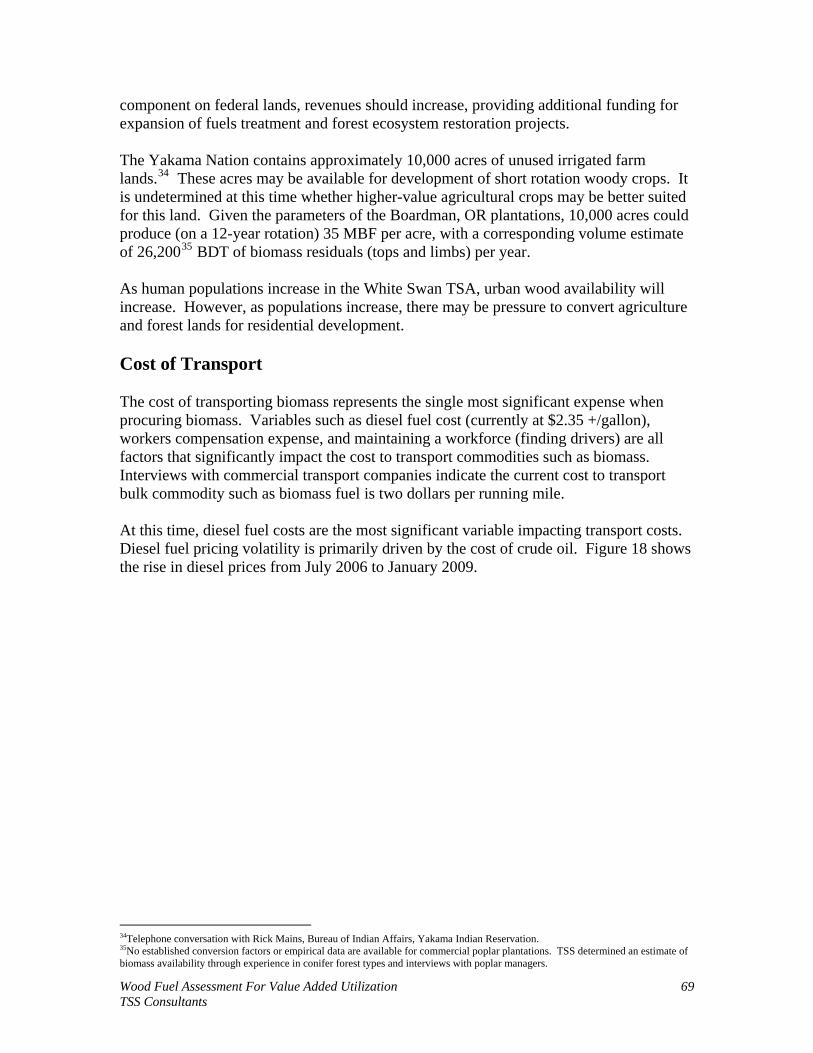
component on federal lands, revenues should increase, providing additional funding for expansion of fuels treatment and forest ecosystem restoration projects. The Yakama Nation contains approximately 10,000 acres of unused irrigated farm lands.34 These acres may be available for development of short rotation woody crops. It is undetermined at this time whether higher-value agricultural crops may be better suited for this land. Given the parameters of the Boardman, OR plantations, 10,000 acres could produce (on a 12-year rotation) 35 MBF per acre, with a corresponding volume estimate of 26,20035 BDT of biomass residuals (tops and limbs) per year. As human populations increase in the White Swan TSA, urban wood availability will increase. However, as populations increase, there may be pressure to convert agriculture and forest lands for residential development. Cost of Transport The cost of transporting biomass represents the single most significant expense when procuring biomass. Variables such as diesel fuel cost (currently at $2.35 +/gallon), workers compensation expense, and maintaining a workforce (finding drivers) are all factors that significantly impact the cost to transport commodities such as biomass. Interviews with commercial transport companies indicate the current cost to transport bulk commodity such as biomass fuel is two dollars per running mile. At this time, diesel fuel costs are the most significant variable impacting transport costs. Diesel fuel pricing volatility is primarily driven by the cost of crude oil. Figure 18 shows the rise in diesel prices from July 2006 to January 2009.
34Telephone conversation with Rick Mains, Bureau of Indian Affairs, Yakama Indian Reservation. 35No established conversion factors or empirical data are available for commercial poplar plantations. TSS determined an estimate of biomass availability through experience in conifer forest types and interviews with poplar managers.
Wood Fuel Assessment For Value Added Utilization TSS Consultants
69

Figure 18. U.S. and West Coast Diesel Fuel Prices36 (July 2006 to January 2009)
As Figure 18 clearly demonstrates, only recently (August 2008) have diesel fuel prices begun to decline as crude oil prices have fallen due to declining demand related to current economic conditions. Seasonal Availability A biomass value-added utilization facility will likely access raw material from forest operations (timber harvest residuals/fuels treatment and forest restoration activities) and agricultural residuals that typically operate on a seasonal basis. Suppliers collecting, processing, and transporting this material are limited to operating in dry weather conditions (typically May to October) due to concerns over potential damage to soil resources when operating in wet conditions. Forest fuels treatment and/or forest remediation are activities that typically generate significant volumes of woody biomass. Locally, agricultural residuals from orchard-based operations are generated in the fall or spring. In order to accommodate these suppliers and the seasonality of their operations, projects should have a raw material inventory capacity available to accommodate 45 to 90 days’ consumption on site. In this way, the project will be able to accumulate an adequate inventory to sustain the plant through the winter months when the forest
36Energy Information Administration, http://tonto.eia.doe.gov/
Wood Fuel Assessment For Value Added Utilization TSS Consultants
70

operations and agricultural residual processors are not operational due to wet weather conditions. Supply From Federally-Managed Lands There have been several issues mentioned previously in this study that impact supply from federal agencies. These agencies are funded through annual Congressional appropriations and are therefore subject to variability over time. The variability associated with their funding can reduce financial resources allocated toward timber and fuels treatment projects. The staff time required in development of environmental assessments and studies, as required by NEPA, is significant. The annual appropriated budget impacts funding for personnel to prepare, plan, implement and administer these activities. Project-level litigation and legal appeals targeting public agency activities continue to be a significant challenge. There are several other factors that directly impact federal agency budgets and associated funding. Severe fire season suppression costs can reduce timber sale, stewardship, fuels treatment, and stand improvement funding. A reduction in timber sale and stewardship revenues during market downturns will impact fuels treatment and stewardship projects. Understanding these variables can clarify the significance of federal supplies in the projects’ overall supply plan. Operational changes, such as larger landings and location of treatment activities on road systems suitable for chip vans, will increase small diameter and biomass material recovery. It is worth noting that byproducts derived from forest operations represent a significant source of potential raw material supply. Forest operations (timber harvesting/fuel treatment/stand improvement) represent 45% of total practically available supply. When tributary urban wood waste is removed from consideration, this figure increases to 70%. Figures 19 and 20 demonstrate the impact of removing tributary urban wood waste.
Wood Fuel Assessment For Value Added Utilization TSS Consultants
71
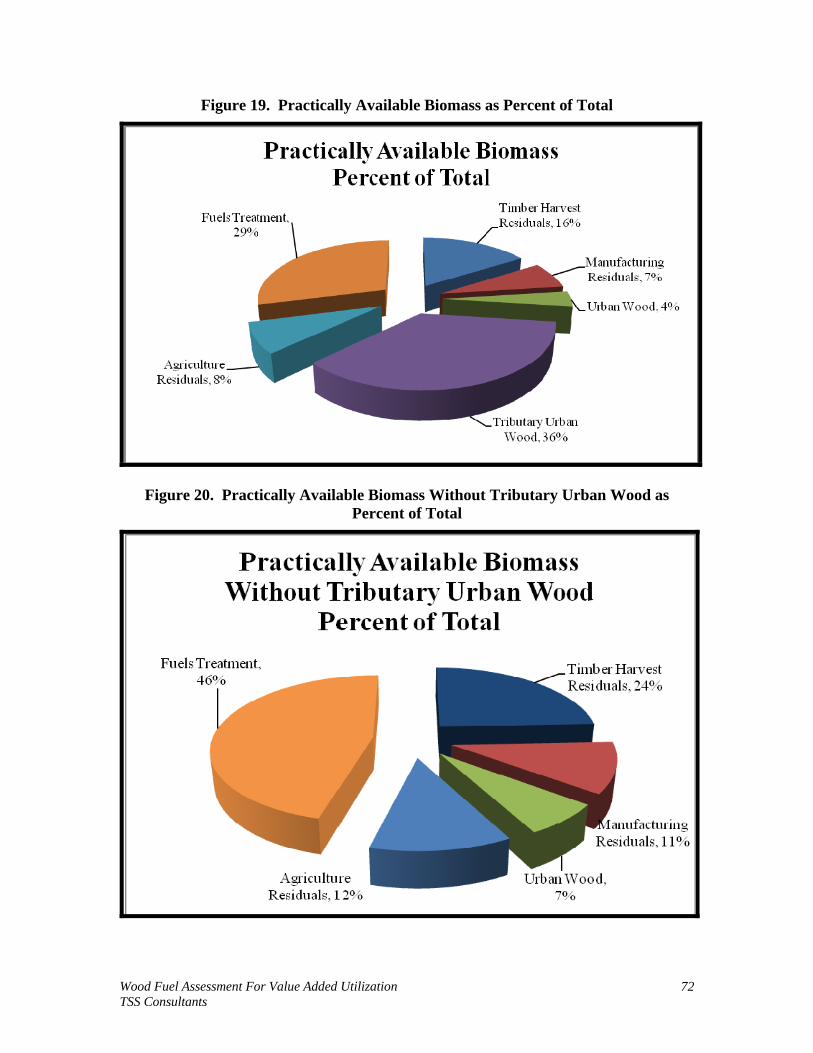
Figure 19. Practically Available Biomass as Percent of Total
Figure 20. Practically Available Biomass Without Tributary Urban Wood as Percent of Total
Wood Fuel Assessment For Value Added Utilization TSS Consultants
72

Of this prospective supply, 68% is derived from state and federally-managed lands. Over 23% is derived from federal lands. Table 27 shows practically available BDT for fuels treatment and timber harvest operations by public and private ownership. Table 27. Biomass from Timber Harvest and Fuels Treatment Operations Private
and Public Ownership
BIOMASS TYPE
PRIVATE LANDS PRACTICALLY
AVAILABLE BDT/YEAR
PUBLIC LANDS PRACTICALLY
AVAILABLE BDT/YEAR Timber Harvest Residuals 140,950 38,120 Fuels Treatment 24,750 314,041
TOTALS 165,700 352,161 PERCENT OF TOTAL 32% 68%
Most federal agency long-term stewardship contracts consist of operations that include both sawlog removal and stand improvement/fuels reduction operations. These contracts are predicated upon either generating revenue from the sale of products produced (sawlogs, posts/poles) or subsidizing operations given variations in market conditions. The impact of subsidizing operations for the agencies is a potential reduction in budget and treatment opportunities in subsequent years. However, current federal economic stimulus policies being implemented (see discussions regarding the American Recovery and Reinvestment Act above) may provide additional appropriations to address the backlog of public lands that are in need of treatment. The U.S. Economy The Western Wood Products Association (WWPA) recently reported that sawmills in the western United States are currently experiencing the largest decline in lumber demand since WWPA began tracking data. The WWPA expects the decline in demand to continue through 2009 with recovery starting in 2010.37 Lumber production in the United States is expected to fall to the lowest level since 1982. The American Forest andPaper Association reported a year-to-date decline (ending November 2008) in printingand writing paper shipments of 6.6% and 2.3% for recoverable fiber consumption.
he
38 Tassociation also reported declines of 20.2% and 8.5% respectively in November 2008 compared to November 2007. A recent Wall Street Journal39 article indicated that housing starts in December, 2008 had declined 15.5% compared to November, 2008—this following a decline of 15.1% for November, 2008. For the entire year, housing starts totaled 904,300, marking a new low. The previous low was 1,014,000 starts in 1991. In 2007, housing starts totaled 1,355,000. Housing starts were down 45% for December 2008 when compared to levels December 2007. Home prices declined as well, dropping 1.8% from October to
37Western Wood Products Association, “LUMBER FORECAST REVISED DOWNWARD DUE TO WEAK HOUSING MARKET, ECONOMY,” Press Release of 6 January 2009. 38American Forest & Paper Association, “NOVEMBER 2008 PRINTING-WRITING PAPER REPORT,” December 22, 2008 and “NOVEMBER 2008 RECOVERED FIBER REPORT,” December 19, 2008. 39“Home Construction at Record Slow Pace,” Wall Street Journal (wsj.com), January 23, 2009.
Wood Fuel Assessment For Value Added Utilization TSS Consultants
73

November, with the sharpest declines occurring in the west and midwest regions of the United States. The Labor Department reported for the week ending January 17, 2009, that claims for jobless benefits were at their highest level since November 1982. Overall there has been a reduction in the number of sawmills and plywood mills in the inland region, due primarily to the long-term reduction of harvest levels from public lands and the declining state of the economy. Although the total number of sawmills in the western U.S. has dropped significantly in the past two decades, the installed capacity nationally has increased at a greater rate. Today the installed capacity of the lumber manufacturing facilities in the U.S. and Canada is in excess of 75 billion board feet annually. During the period 2004 to 2006, the consumption of wood products was at a record-setting level of ±65 billion board feet. Consumption for 2008 is forecast to be less than 50 billion board feet. An important factor which must be considered is the time frame required for essential tasks: securing permits, selecting engineering/procurement and construction contractors, financing the capital investment, negotiating and developing markets, and construction of a facility can take a significant amount of time (24 to 36 months). It is quite possible that by the time a facility is ready to begin commercial operation, the forest products markets will have returned to normal, resulting in additional residuals generated and available in the marketplace. Inland Regional Economy The current competition for mill residuals and volatility in prices is driven by numerous factors. The primary factor is the result of a reduced supply tied to sawmill and plywood mill curtailments. These curtailments are due to the falling housing and credit markets (as previously discussed). These curtailments have decreased forest products manufacturing residuals significantly. Low supply-to-demand ratios may begin to affect biomass utilization in the region. This demand has shifted efforts to process and utilize traditionally underutilized material such as urban wood waste and timber harvest residuals. Until forest products markets rebound and manufacturing operates at or near full capacity, the market will likely continue to experience fluctuations in both capacity and pricing. Decorative (landscape) bark producers are experiencing reductions in demand as housing starts decline. Fuel pellet plant producers within the region are experiencing tightened raw material supplies (sawdust, shavings) as a result of curtailed wood products manufacturing. Recent pulp and paper industry market contractions have driven chip prices down regionally. This market sector is saddled with excess available capacity and high existing inventories. Historically, similar market conditions have caused a dramatic reduction in chip consumption within the pulp/paper industry. Given this change, fiber (chip) suppliers will begin analyzing efficiencies and marketing opportunities to reduce transportation costs. This may provide some additional fiber into the biomass
Wood Fuel Assessment For Value Added Utilization TSS Consultants
74

marketplace, including the TSA. Only recently have biomass fuel prices begun to decline.40 Current trends indicate increasing availability of chips and product used to manufacture chips, with prices approaching those of biomass fuel. OBSERVATIONS AND RECOMMENDATIONS
The focus of the Collaborative is to reach consensus among its stakeholders in regard to forest treatments to improve dry site ecosystems in Washington’s eastern Cascades. Consensus is intended to expedite project planning, approval, and implementation of operational-scaled treatments on federally-administered forest lands (e.g., USFS). The Collaborative’s evaluations of current forest conditions indicate a need for expeditious and extensive increases in the size and number of forest treatments. Projects are necessary in order to alter an accelerating stagnation of pre-climax forest health. Treatment projects and associated contracts must address the critical need for removal of forest material that is well-matched to low-value markets. Agency land managers (fuels treatment, forest restoration, timber sales, etc.) must consider biomass and small diameter material recovery opportunities in planning and implementation. Some small diameter and biomass manufacturing technologies operate best when located near or with traditional forest product manufacturing businesses. Others have technologies and scale of operations that require steady raw material supply and economic access to their markets. There are niche market technologies that require predictable supply of certain preferred species (e.g., lodgepole pine for posts/poles). This does not preclude the utilization of alternative raw materials but some decline in market value can be expected. Existing and newly proposed utilization facilities represent significant market forces within the TSA. New entries into the market will recognize existing utilization facilities and search for strategic relationships or underutilized supplies. USFS controls 44% of forestland potentially suitable for small diameter and biomass recovery. Understanding the characteristics of the traditional and niche markets will pay dividends for public (and private) forest managers as they pursue improvement of the forest resources. There are two basic TSA forest product raw material suppliers: public and private. Public suppliers are federal (USFS, BLM) and state (WDNR) forests. Private suppliers include industrial, Tribal, and non-industrial forest land owner/managers. Each of these organizations supply and market timber dependent upon their stakeholder goals. Federal managers are guided by a wide range of required multiple use purposes and political policy. DNR managers are guided by its fiduciary Trust requirements and public policy. Industrial managers are guided by owners’ core principals, profit and loss, and over-arching public regulation. Tribal ownerships are guided by cultural goals and core principals, profit and loss, and public policy. Finally, private non-industrial owners are guided by their core principals and a very complex matrix of personal goals dependent on each owner’s circumstance(s).
40Recent discussions with Central Oregon fuel procurement managers.
Wood Fuel Assessment For Value Added Utilization TSS Consultants
75
“From small beginnings come great things,” should be the mantra for projects initiated via the Collaborative. These “forest health” projects will not only produce better forests, they could create an environment that begins to produce jobs in the region. As allies, public forest managers and industrial entrepreneurs can improve economic conditions for people living within the Collaborative region. “Test Projects” must become operational. Projects that use public, Tribal, industrial and private-non-industrial forest resources on an operational basis will become successful. Public and Tribal ownerships dominate the TSA’s forest landscape. Private and Tribal resources have been the primary raw material producers during the last 20 years. Forest management of these lands is a significant vector on the well being of all the people living within the TSA’s region. Only agriculture has a similar impact to the region. Without the whole (participation of all forest ownerships and resources), conditions for the region’s forestry sector will continue to be constrained. Stewardship Contracts on Federal Lands Consideration should be given to utilize long-term stewardship contracts to secure woody biomass material from forest fuels treatment and forest restoration activities on federally-managed lands, including local national forests. The best opportunities for reducing costs for sourcing biomass from fuels treatment and stand improvement activities on federal lands would be to focus efforts on securing those projects with upside potential for service fees/subsidized operations. Other opportunities for reducing biomass costs would be to pursue cost share funds (subsidies to offset operating expenses) from state and federal agencies for fuels treatment and timber stand improvement operations on private lands. Optimized Value-Added Enterprise Locations The location ranking analysis (Table 25) is not intended to exclude particular locations or technologies. Technology suitability is not predicated solely upon location attributes. It includes evaluation of technology utilization and marketing potential. Best fit estimate to existing conditions is the goal of the review An evaluation of Table 26, “Technology to Location Relative Suitability Ranking,” indicates that White Swan has the highest suitability ranking for the technologies evaluated. White Swan is followed by the Bingen/White Salmon combination. The ratings are the result of the existing business environment (i.e., manufacturing, manufacturing byproduct supply, existing infrastructure, modes of transportation, etc.). The Bingen/White Salmon location has existing manufacturing, internal utilization of controlled and uncontrolled raw material, and low external competition. Technologies considered in the study may prosper in this environment. A second group of locations with grouped suitability rankings include Yakima, Naches, Wapato/Toppenish and Goldendale. The factors most influencing the ranking of
Wood Fuel Assessment For Value Added Utilization TSS Consultants
76

locations within Kittitas County include raw material species and forest ownership. The factors most influencing the locations ranking within Chelan County include raw material supply derived primarily from federally-managed lands and transport issues. The ranking does not imply that businesses would all locate the technologies considered in the study in only those locations. The analysis only looks at location attributes and ranks the locations’ business environment. The location rankings address internal or external competition to some degree, but not the odds of success or failure of a planned venture. Businesses considering value-added technologies will tend to seek the locations that most favor their success. For example, a post and pole venture would tend to seek a location with favorable access to lodgepole pine forests. The rankings do not exclude one or another location from establishment potential of opportunities (technologies) identified in this study. In other words, the analysis does not purport a “zero sum competition, highest score wins all.” All the locations in the study have applicable and suitable business conditions that could favor one or more of the technologies considered in the analysis. Next Steps Figure 10, “Core Fuel Market Sourcing Regions for Potential Biopower Facilities in Central Washington,” illustrates a 75-mile radius raw material supply region for existing and proposed biomass power facilities within the TSA. The proposed new facilities in White Swan and Omak will use internal manufacturing and forest-based raw materials for the majority of their required biomass fuel supply. The balance of needed supply will be procured from well within a 75-mile supply radius. The existence of whole log chip operations located near Cle Elum and Leavenworth does not preclude small-diameter log and biomass utilization opportunity within this area of the TSA. The resources within the area encompassing Ellensburg, Cle Elum, Leavenworth, Wenatchee/Entiat and Chelan are currently underutilized. Raw material procurement in the area should focus on private forest landowner supply sources and relationships developed with the WDNR, as well as strategic positioning to utilize supply from treatment activities on federally-managed lands. Without modification of federal forest supply management (see “Observations and Recommendations” above), that supply must be considered as a secondary raw material source. Management initiatives must be closely monitored and engaged when practical to prevent missing a “sea change” event. Existing whole log chip manufacturing must be included as a prospective supply opportunity in any analysis of small diameter raw material and biomass-based manufacturing business. Byproduct could be available and suitable for some of the technologies considered in the assessment. Whole log chipping will generally procure some material too small for chipping (depending upon the mill configuration). Prospective technology suitability for these locations would include biomass for thermal energy, post and pole manufacturing, whole log shavers, and fuel pellet production
Wood Fuel Assessment For Value Added Utilization TSS Consultants
77

utilizing whole logs as raw material supply. Efficient, existing whole chip operations could be strong competition for many of the technologies considered in this study. Detailed business analysis of markets, raw material supply, transportation, appropriate technology, and financing is needed before any selected business technology can be sited within the TSA. Collection, Processing and Transport Infrastructure During the course of this biomass assessment, it became very clear that there are few existing contractors focused on the collection, processing and transport of biomass material. If new commercial-scale, value-added biomass utilization facilities are developed within the TSA, significant efforts focused on development of small diameter and biomass material collection, processing and transport infrastructure development will be necessary. Recruitment of contractors focused on this market sector will be critical to successful supply chain operation. Forest transportation networks are primarily built for the extraction of sawlogs. The invention of the compensating log trailer revolutionized the movement of timber from the typically steep terrain in the mountainous Pacific Northwest. The steep terrain greatly inhibits biomass removal from harvested land in the Northwest. There is ongoing research into equipment modifications to improve biomass extraction from forested landscapes on challenging terrain. Operational polices are currently limiting opportunities to recover biomass material from federally-managed lands. Policies that limit landing size and distribution will increase biomass removal costs and occasionally render collection economically unfeasible. Focusing treatment operations on transportation systems affording effective biomass removal will improve recovery from federal lands. Community Support During the course of the resource assessment interviews, it became apparent that there is wide-ranging community support for development of value-added utilization of biomass material within the TSA. TSS found significant support and understanding of both the environmental and economic benefits that renewable energy projects or other value-added facilities would bring to Central Washington. This observation is evident in the efforts of the Tapash Collaboration, a group whose members are actively working to facilitate restoration of forest ecosystems and related economies within and outside the TSA. Along with the support of many within the community, there are a number of individuals familiar with the forest products industry in the TSA who are generally supportive of utilization of small diameter and biomass material and look forward to a market that can support fuels reduction and forest restoration on public and private lands.
Wood Fuel Assessment For Value Added Utilization TSS Consultants
78

Wood Fuel Assessment For Value Added Utilization TSS Consultants
79
Initiative 937 The citizens of Washington have enacted a Renewable Portfolio Standard, Initiative 937. The initiative requires qualifying utilities (those serving 25,000 residential customers or more) to utilize renewable power to service their customers’ electrical demand or acquire the equivalent in renewable energy credits. The initiative requires utilities to begin using renewable energy in 2010 and have up to 15% of their load comprised of renewable energy by 2020. Biomass energy generated from specific qualifying biomass fuel/feedstock (which does not include wood sourced from old growth forests) qualifies as renewable energy in this initiative. Tribal land managers and agency managers indicated that fuel reduction and timber harvest projects are not normally conducted within forest stands that meet the old growth definition. Old growth forest harvesting on private lands is also minimal due to relatively low inventories of old growth forests. Therefore, TSS believes that harvesting of wood from old growth forests will not be an issue for prospective projects to meet the old growth statute as stated in Initiative 937. (Refer to Appendix A for complete text of this Initiative.) HB 1086 Recent State of Washington draft legislation has been initiated that attempts to set renewable energy rates based on the European model of feed-in tariffs. HB 1086 (see Appendix B for complete text) sets specific energy payment rates for small distributed generation facilities producing up to 5 MW of power. A feed-in tariff is an offering of a fixed price contract over a specific term to eligible renewable energy generators. Countries such as Germany and Spain have successfully implemented this methodology, and response (more renewable energy generation) has been significant. Feed-in tariffs have been considered by other states (Oregon and California) but Washington appears to be the closest to actually implementing a feed-in tariff payment structure for renewable energy generation. American Recovery and Reinvestment Act As mentioned earlier in this report, the ARRA was recently signed (February 17, 2009) into law and represents a significant federal initiative targeting economic growth. Considering the numerous societal benefits associated with the treatment of forested landscapes (both public and private), the ARRA should be targeting regions such as Central Washington as prime candidates for investment. The Collaborative and the RC&D should monitor implementation of the ARRA very closely and seek out grant funding/low interest loans targeted for renewable energy projects and business development initiatives.

Appendix A: Text of Initiative 937
Wood Fuel Assessment For Value Added Utilization TSS Consultants
80

Wood Fuel Assessment For Value Added Utilization TSS Consultants
81

Wood Fuel Assessment For Value Added Utilization TSS Consultants
82

Wood Fuel Assessment For Value Added Utilization TSS Consultants
83
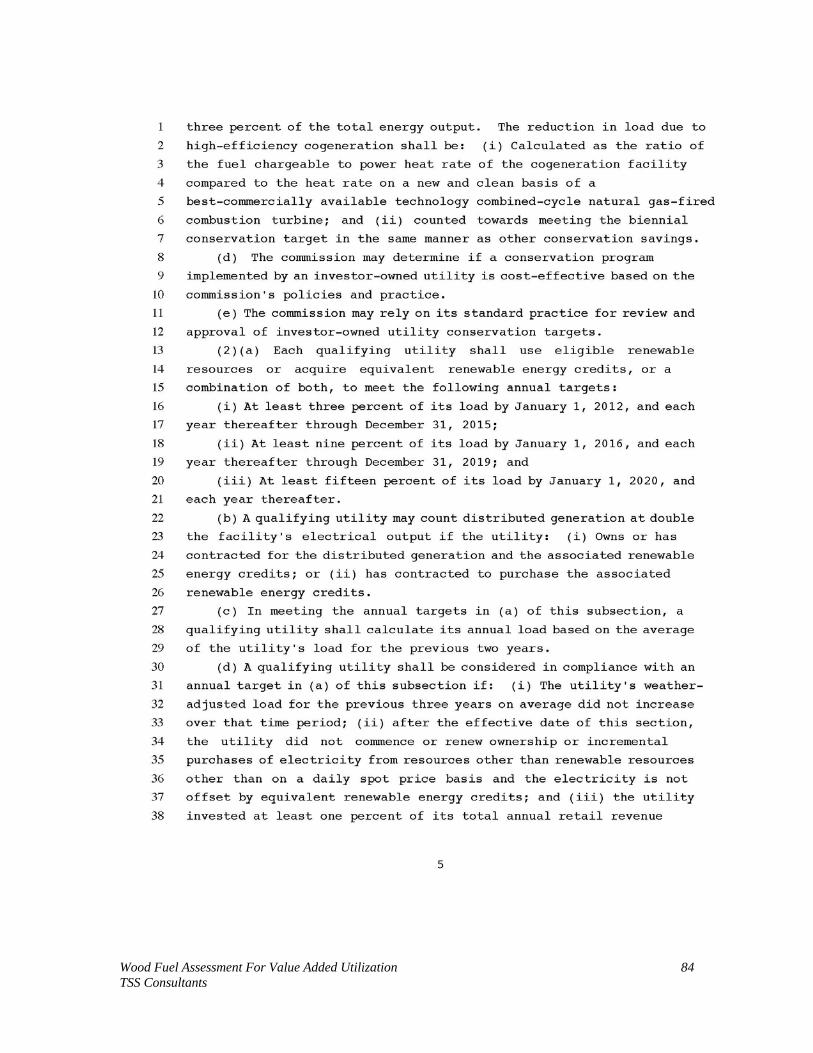
Wood Fuel Assessment For Value Added Utilization TSS Consultants
84

Wood Fuel Assessment For Value Added Utilization TSS Consultants
85

Wood Fuel Assessment For Value Added Utilization TSS Consultants
86
Wood Fuel Assessment For Value Added Utilization TSS Consultants
87

Wood Fuel Assessment For Value Added Utilization TSS Consultants
88

Wood Fuel Assessment For Value Added Utilization TSS Consultants
89

Appendix B: Washington House Bill 1086 Analysis
Wood Fuel Assessment For Value Added Utilization TSS Consultants
90
Wood Fuel Assessment For Value Added Utilization TSS Consultants
91

Wood Fuel Assessment For Value Added Utilization TSS Consultants
92

Wood Fuel Assessment For Value Added Utilization TSS Consultants
93