WOOD CHIPS GASIFICATION FOR SYNGAS PRODUCTION
39
RIGA TECHNICAL UNIVERSITY Faculty of Power and Electrical Engineering Institute of Energy Systems and Environment Vladimirs Kirsanovs Doctoral Student of the Study Programme "Environmental Science" WOOD CHIPS GASIFICATION FOR SYNGAS PRODUCTION Summary of the Doctoral Thesis Scientific supervisor Profesor Dr. sc. ing. CLAUDIO ROCHAS RTU Press Riga 2018
Transcript of WOOD CHIPS GASIFICATION FOR SYNGAS PRODUCTION

RIGA TECHNICAL UNIVERSITY
Faculty of Power and Electrical Engineering
Institute of Energy Systems and Environment
Vladimirs Kirsanovs
Doctoral Student of the Study Programme "Environmental Science"
WOOD CHIPS GASIFICATION FOR SYNGAS PRODUCTION
Summary of the Doctoral Thesis
Scientific supervisor
Profesor Dr. sc. ing. CLAUDIO ROCHAS
RTU Press
Riga 2018

Kirsanovs V. Wood Chips Gasification for Syngas Production. Summary of the Doctoral Thesis. Riga: RTU Press, 2018. 39 p.
Published in accordance with the Resolution of the RTU Institute of Energy Systems and Environment Promotion Council dated 11 January 2018, Minutes No. 89.
ISBN 978-9934-22-091-3 (print)
ISBN 978-9934-22-092-0 (pdf)

3
DOCTORAL THESIS PROPOSED TO RIGA TECHNICAL UNIVERSITY FOR THE PROMOTION TO THE SCIENTIFIC
DEGREE OF DOCTOR OF ENVIRONMENTAL ENGINEERING
To be granted the scientific degree of Doctor of Environmental Engineering, the present Doctoral Thesis has been submitted for the defence at the open meeting of RTU Promotion Council on ___________________________ at the Faculty of Power and Electrical Engineering of Riga Technical University, 12/1 Āzenes Street, Room 115.
OFFICIAL REVIEWERS
Professor Dr. habil. sc. ing. Gatis Bažbauers Riga Technical University
Senior Researcher Dr. sc. ing. Anna Volkova Tallinn University of Technology, Estonia
Professor Dr. sc. ing. Edmunds Teirumnieks Rēzekne Academy of Technologies
DECLARATION OF ACADEMIC INTEGRITY
I hereby declare that the Doctoral Thesis submitted for the review to Riga Technical University for the promotion to the scientific degree of Doctor of Environmental Engineering is my own. I confirm that this Doctoral Thesis had not been submitted to any other university for the promotion to a scientific degree.
Name Surname ……………………………. (signature)
Date: ………………………
The Doctoral Thesis has been written in Latvian. It consists of Introduction; 4 chapters; Conclusion; 66 figures; 19 tables; the total number of pages is 133. The Bibliography contains 156 titles.
4
CONTENT
OVERVIEW ................................................................................................................... 5
1. JUSTIFICATION OF INNOVATIVE SYNGAS PRODUCTION TECHNOLOGY 9
1.1. The necessity for biomass gasification ................................................................ 9
1.2. Choice of technological solution for biomass gasification ................................ 10
1.3. The factors influencing the gasification process ................................................ 11
1.4. By-products of gasification process ................................................................... 13
2. MATHEMATICAL MODELING OF GASIFICATION PROCESS ...................... 17
2.1. Model description of gasification ...................................................................... 17
2.2. Modeling results of gasification process ........................................................... 19
3. EXPERIMENTAL SYSTEM OF BIOMASS GASIFICATION ............................. 23
4. OBTAINED RESULTS AND THEIR ANALYSIS ................................................ 26
4.1. Research of experimental system ...................................................................... 26
4.1.1. Preheating of the entered air ........................................................................... 26
4.1.2. Moisture of the fuel ......................................................................................... 27
4.2. Mathematical model validation ......................................................................... 28
4.3. Optimization of experimental system ................................................................ 29
4.4. Analysis of experimental data ............................................................................ 31
4.5. Gasification possibilities of non-wood material ................................................ 33
CONCLUSIONS .......................................................................................................... 35
REFERENCES ............................................................................................................. 37

5
OVERVIEW
Topicality of the work
Energy sector plays a decisive role in the development of any country. Sustainable and economically sound policy in the energy sector serves as an important basis for the development of other public sectors. This work researches an innovative fuel conversion technology – syngas production from local renewable resource ‒ wood. Syngas can be a fuel for heat and electricity generation. Local syngas production from wood chips will help to reduce fossil fuel imports for Latvia and increase energy security. Any country willing to increase its sustainability should pay interest to syngas production from wood. For a country with significant biomass resources replacing imported fossil fuels with local renewable energy will also help to boost local economy.
For the EU countries, an innovative syngas production technology from wood chips will contribute to achieving the objectives of Directive 2009/28/EC – to increase the share of renewable energy in gross consumption up to 40 %. Paris Climate Conference held in 2015 also emphasized the involvement of each country in addressing environmental issues – replacing fossil fuels with renewable energy is a binding condition for any country willing to reduce anthropogenic greenhouse gas emissions in atmosphere.
Goal and tasks of the work
The goal of the Thesis is to investigate the possibilities of syngas production via gasification process, using local renewable energy resource – wood chips. The following objectives were set in order to achieve the goal:
to develop a thermodynamic mathematical model of the gasification process;
to determine influences of fuel moisture and air equivalence ratio on gasification process using the developed mathematical model;
experimental investigation of the gasification process in an industrial facility determining the possibilities of drying wood chips using physical heat obtained during syngas cooling process;
mathematical model validation using experimental research results;
to analyse possible optimization of gasification system by dividing the supplied air into primary and secondary air;
to use the developed mathematical model to research syngas production from other local biomass resources.
Methodology of research
Figure 1 illustrates general structure of the research methodology used in the Doctoral Thesis. Two research approaches were applied. The first approach included creation of a thermodynamic mathematical model of gasification process, use of created gasification process model exploring variable fuel moistures and equivalence ratios. The second approach was based on experimental research of wood chips gasification process in an industrial facility varying operating parameters.

6
Fig. 1. Methodology of execution of the Doctoral Thesis.
Experimental results were used to validate the developed model. Using the calorific value
of syngas and the total gasification process efficiency as criteria, the gasification process optimization by dividing the supplied air into the primary and secondary air flow into the gasifier was researched. Experimental research data was analyzed and used for validation of the developed mathematical model. The developed mathematical model was used to analyse the possibilities of using different biomass in the gasification process.
Scientific novelty of the work
The gasification process is a method of thermochemical conversion of biomass, which depends on a large number of factors – gasifier type, gasifier design, gasification agent, air supply system, air equivalence ratio, fuel moisture, fuel particle size and other parameters.
Within the framework of the Doctoral Thesis, a complex investigation of syngas production from wood chips gasification was done. The developed thermodynamic model of the gasification process was validated using data from experimental system. During the experimental research gasifier optimization was done. Air supply was divided into primary and secondary air. The results and regression equations of the work can be used to design and optimize other gasifiers.
Practical significance of the work
Using the syngas production technology from wood chips via gasification process it is possible to increase the use of local renewable energy resources and to promote the growth of Latvia’s energy sector. Results of this work have practical significance at the national, regional and municipal levels. The results of work have several target groups:
energy sector companies, as well as the users of produced syngas for heat and electricity generation;
companies in the chemical processing and energy sector using syngas as a raw material for other products with high added value;
manufacturers of gasification equipment, which are using experimental results and recommendations for the design, development and regulation of new gasification systems;
biomass processing companies as raw material suppliers.

7
Approbation of work results
The results of the research that are defined in the Doctoral Thesis were presented at 7 international scientific conferences:
1. Kirsanovs, V., Žandeckis, A., Blumberga, D., Veidenbergs, I. The Influence of Process Temperature, Equivalence Ratio and Fuel Moisture Content on Gasification Process: A Review. 27th International Conference on Efficiency, Cost, Optimization, Simulation and Environmental Impact of Energy Systems, ECOS 2014; Abo Akademi University, Turku, Finland; 15–19 June 2014;
2. Kirsanovs, V., Žandeckis, A. Investigation of biomass gasification process with torrefaction using equilibrium model. International Scientific Conference of Environmental and Climate Technologies, CONECT 2014, Riga, Latvia, 14–16 October 2014.
3. Kirsanovs, V., Žandeckis, A. Investigation of fuel effect on biomass gasification process using equilibrium model. 6th International Conference Biosystems Engineering, BSE 2015, Tartu, 07–08 May 2015.
4. Kirsanovs, V., Blumberga, D., Dzikevičs, M., Kovals, A. Design of experiments for equivalence ratio, fuel moisture content and fuel consumption effect investigation on gasification process. International Scientific Conference Environmental and Climate Technologies, CONECT 2015, Riga Technical University, Riga, Latvia, 14–16 October 2015.
5. Kirsanovs, V., Žandeckis, A., Rochas, C. Biomass Gasification Thermodynamic Model Including Tar and Char. 7th International Conference on Biosystems Engineering, BSE 2016, Tartu, 12–13 May 2016.
6. Kirsanovs, V., Blumberga, D., Kārkliņa, K., Veidenbergs, I., Rochas, C., Vīgants, E., Vīgants, Ģ. Biomass Gasification for District Heating. International Scientific Conference Environmental and Climate Technologies, CONECT 2016, Riga, Latvia, 12–14 October 2016.
7. Kirsanovs, V., Blumberga, D., Veidenbergs, I., Rochas, C., Vīgants, E., Vīgants, Ģ. Experimental investigation of downdraft gasifier at various conditions. International Scientific Conference on Environmental and Climate Technologies, CONECT 2017, Riga, Latvia, 10–12 May 2017.
The results of the research which are presented in the Doctoral Thesis are reflected in 7 international scientific publications:
1. Kirsanovs, V., Žandeckis, A., Blumberga, D., Veidenbergs, I. The Influence of Process Temperature, Equivalence Ratio and Fuel Moisture Content on Gasification Process: A Review. 27th International Conference on Efficiency, Cost, Optimization, Simulation and Environmental Impact of Energy Systems (ECOS 2014): Proceedings, 2014, pp. 1046–1060.
2. Kirsanovs, V., Žandeckis, A. Investigation of biomass gasification process with torrefaction using equilibrium model. Energy Procedia, 2015, Vol. 72, pp. 329–336.
3. Kirsanovs, V., Žandeckis, A. Investigation of fuel effect on biomass gasification process using equilibrium model. Agronomy Research, 2015, Vol. 13, No. 2, pp. 500–510.

8
4. Kirsanovs, V., Blumberga, D., Dzikevičs, M., Kovals, A. Design of experiments for equivalence ratio, fuel moisture content and fuel consumption effect investigation on gasification process. Energy Procedia, 2016 Vol. 95, pp. 189–194.
5. Kirsanovs, V., Žandeckis, A., Rochas, C. Biomass Gasification Thermodynamic Model Including Tar and Char. Agronomy Research, 2016, Vol. 14, No. 4, pp. 1321–1331.
6. Kirsanovs, V., Blumberga, D., Kārkliņa, K., Veidenbergs, I., Rochas, C., Vīgants, E., Vīgants, Ģ. Biomass Gasification for District Heating. Energy Procedia, 2017, Vol. 113, pp. 217–223.
7. Kirsanovs, V., Blumberga, D., Veidenbergs, I., Rochas, C., Vīgants, E., Vīgants, Ģ. Experimental investigation of downdraft gasifier at various conditions. Energy Procedia, 2018, Vol. 128, pp. 332–338.

9
1. JUSTIFICATION OF INNOVATIVE SYNGAS PRODUCTION TECHNOLOGY
1.1. The necessity for biomass gasification
Climate change mitigation is one of the greatest challenges our civilization is facing nowadays. The significant increases of anthropogenic greenhouse gas emissions into the atmosphere since the beginning of the 20th century might be contributing to global warming and climate change. A significant part of the anthropogenic greenhouse gas emissions come from energy sector particularly due to the use of fossil fuels. Increasing the use of renewable sources for energy production in Latvia will lead to reduction of anthropogenic greenhouse gas emissions. The amount of imported energy resources will decrease and country's energy security will increase.
Renewable energy resources already play a significant role in the balance of the primary energy resources of Latvia. However, based on Directive 2009/28/EC of the European Parliament and of the Council, Latvia needs to further increase the use of renewable energy sources in order to produce at least 40 % of its energy share in total energy consumption in 2020 [1]. Renewable energy resources used for energy production amounted to 37.6 % in the balance of the primary energy resources of Latvia in 2016 [2].
Latvia has a high potential for replacing fossil fuels with local renewable energy resources, which is important both for the economy of Latvia and for the individual players of energy sector. One of the main resources in Latvia is biomass. Biomass is already widely used in the production of heat and electricity. Although biomass includes a wide range of raw materials, it is undeniable that wood is the dominant resource which is used by the energy sector in Latvia. It is also important that, despite the active use of wood resources in various sectors of the economy, the total forest area is increasing. Based on data from the Central Statistics Bureau, the total area was 3 260 000 hectares or 50.5 % of the total territory of the country in 2014. The total stock of timber in the country was also increasing, reaching 11.7 million m3 in 2014 [3].
An important advantage of biomass in comparison with fossil fuel types is the price of raw materials. Based on the data from the Central Statistical Bureau, the average natural gas price in 2016 was 246 Euro for 1 000 m3 or 25.9 Euro per MWh. For comparison, the average price of wood chips in 2016 was only 7.0 Euro per cubic metre or 7.4 Euro per MWh, which is almost 3.5 times lower than of natural gas. It is also important that the growth of wood chip price over the last 10 years is one of the lowest among commonly used fuels in Latvia. The use of chips during the last 5 years experienced a significant increase from 8.2 PJ in 2011 to 20.9 PJ in 2016 [4].
Innovations are closely linked to the use of renewable energy. It is important to use modern technologies for the conversion of renewable energy resources into heat and power to use raw materials with high efficiency. This will contribute to a more rapid reduction in the use of fossil fuels and to the increase in the use of local resources. Biomass gasification is one of the most suitable technologies for which it is possible to place emphasis on increasing the share of renewable energy in total primary consumption in Latvia. The process of gasification has been actively studied already for a considerable time, mainly in laboratory conditions, as a result important knowledge of the organization of the process has been obtained. However, there remains a considerable amount of completely unexplored matter, and in particular there is a lack of research on the gasification process in real conditions in industrial facilities. Although heat and

10
electricity costs from the gasification process could be higher as compared to biomass conversion methods, which are based on the combustion process, nevertheless, due to the rapid development of gasification technologies, it is possible to predict a significant cost reduction of syngas production.
One of the main advantages of the gasification process is the fact that the produced syngas has a wide application spectrum. The gasification process is widely used in district heating systems in Scandinavian countries, especially in Sweden [5]. Heat and electricity production using the biomass gasification process has great prospects for decentralized heating systems in certain regions of the country [6]. The obtaining of electricity in integrated biomass gasification stations may not only be economically viable in comparison with biomass cogeneration plants with boilers, but also can be an ecologically cleaner method [7].
The use of syngas as a raw material for high added value goods production is increasing every year [8]. Syngas contains three valuable components – hydrogen, hydrocarbons and methane. The concentrations of these substances determine future possibilities for syngas use. Hydrogen is produced by cooling and compressing syngas [9]. Syngas is often used as a raw material for fuel production via Fisher-Trophe process [10]. To produce these products in Latvia, firstly it is necessary to research the possibilities of syngas production from available biomass resources and to find optimal technological solutions.
1.2. Choice of technological solution for biomass gasification
The gasification process takes place in a special reactor or gasifier. Technological solutions of gasifier have a significant effect on the process and the characteristics of the acquired syngas. Nowadays, there are many different types of gasifiers, each of them has its own advantages and disadvantages. Generally, biomass is most often gasified using the following gasifier types (Fig. 1.1):
fixed bed downdraft;
fixed bed updraft;
fluidized bed.
Fig. 1.1. Gasifier types: downdraft (left), updraft (centre) and fluidized bed (right).

11
Table 1.1 summarizes the influence of gasifier type on the gasification process efficiency and obtained products. Tar amount is significantly lower in downdraft gasifiers because tar produced in the pyrolytic zone goes through hot oxidation and reduction zones, where it reduces in high temperatures. In updraft gasifiers, syngas crosses pyrolysis and drying zone prior to the exit with a relatively low temperature. The resulting amount of tar can reach up to 50 g/Nm3. Syngas temperature in downdraft and fluidized bed gasifiers can reach above 700 °C and be more than two times higher than in updraft systems. Syngas cooling can recover useful energy.
Table 1.1
Gasifier Type Impact on the Gasification Process
Downdraft Updraft Fluidized bed
Tar content, g/Nm3 < 1 50 10
Syngas temperature, °C 700 300 750
Syngas calorific value, MJ/Nm3 4.5–5 5–6 6
Total efficiency, % 85–90 90–95 75–90
Optimal thermal capacity, MW > 1 1–10 1–100
Syngas obtained in fluidized bed gasifiers has the highest calorific value. The main reason for this is mix of fuel and gasification agent ‒ in the downdraft gasifiers oxidation reactions concentrate in one zone and their significantly higher activity is burning more fuel. Varying around 90 % the total efficiency of gasification process is relatively high for all three of gasifier types.
Downdraft gasifiers typically are designed to operate up to 1 MW, updraft gasifiers 1 – 10 MW. By choosing more capacity it is often difficult to achieve a good mix of a fuel and gas agent. The capacity of industrial fluidized bed gasifiers is usually even higher and ranges from 1 to 100 MW. Often the optimal range of gasifier capacity is a decisive parameter when choosing the type of gasifier.
1.3. Factors influencing the gasification process
The gasification process depends on a large number of different factors limiting the wide use of gasification process in the world. The type and design of gasifier, temperature in the gasifier, gasification agent, equivalence ratio, fuel moisture, fuel size, amount of ash and density are just some of the factors playing a significant role in the gasification process affecting the quality of the obtained syngas.
Temperatures within the gasifier vary considerably. Syngas temperature is assumed to have the maximum value ‒ in downdraft and updraft gasifiers syngas forms in the oxidation zone. The gasification temperature plays a crucial role in virtually all reactions occurring in the gasifier. Temperatures in the gasifier directly or indirectly influence the composition of the produced syngas, the calorific value and amount of produced syngas, the efficiency of the gasification process and other parameters.

12
The carbon in fuel reacts with CO2 produced by the pyrolysis zone much more actively at high temperatures. This process is described in the Boudouard reaction, but the result is an increase of CO within syngas. The increase of the temperature of gasification contributes to the increase of water-gas and steam-carbon reaction activity, which result in the increase of H2 within syngas. The rise of temperature also increases the activity of methane reaction, which contributes to the increase in the production of CH4. After reaching the specified critical temperature in the gasifier, combustion reactions become more active and resulting CO, H2 and CH4 start to drop sharply [11], [12].
At low temperatures, as the temperature in the gasifier increases, the calorific value of syngas and the efficiency of the gasification process increase due to the increase in CO and H2. However, reaching a certain temperature the calorific value of syngas begins to decrease due to a significant drop in CO and due to the reduction in CH4. Although temperature plays a determining role in the gasification process, this parameter depends on other factors and therefore is not an independent variable. The equivalence ratio and the raw material moisture are two factors that have a dominant influence on the temperature in the gasifier.
Some quantity of gasification agent is injected into the gasifier together with the fuel. The task of the gasification agent is to ensure biomass decomposition and partial combustion. The gasification agent usually is injected into the oxidation zone and participates in combustion reactions. In general, there are three most commonly used types of gasification agents – air, steam and oxygen. The use of oxygen and steam has certain advantages, among which is the increased calorific value of syngas (10–28 MJ/Nm3). Oxygen proportion in the air is only around 21 %, the main element in the air is nitrogen, the proportion of which exceeds 78 %. Consequently, using air as a gasification agent, the produced syngas will contain high nitrogen amount. Using air as gasification agent, syngas calorific value can vary from 4 to 7 MJ/Nm3. Nevertheless air is the most popular gasification agent. This is due to the extra costs incurred in obtaining steam and oxygen, which increase the cost of the produced syngas [13].
For complete combustion of fuel, it is necessary to supply the right amount of oxygen. Taking into account that in the gasification process air is used more often as an agent, when calculating the necessary amount of oxygen, for convenience reasons, usually the amount of air to be introduced in the gasifier is calculated. The supplied air volume is characterized by an equivalence ratio, which is the ratio between the actual amount of air introduced into the gasifier and the amount that is theoretically necessary. The main difference of the gasification process from combustion processes is that gasification process happens under oxygen deficit conditions resulting in only partial oxidation of the fuel. The air consumption may vary depending on the type of gasifier and the used operational settings.
The composition of the syngas, and gasification process in general, is largely dependent on the air consumption. Increasing of the amount of injected oxygen increases the oxidation reaction activity, as a result more fuel is being burnt, more heat is released and the temperature in the gasifier increases. Consequently, an increase of the equivalence ratio has a similar effect on the gasification process as in the case of temperature increase. It is significant that at the increase of the air consumption, the amount of N2 in syngas is rapidly increasing, which contributes to the reduction of calorific value of syngas and the efficiency of gasification process [14], [15]. The analysis of literature shows that equivalence ratio t ranging from 0.25 to 0.30 in most cases is optimal for gasification.

13
Raw material properties are significant for the gasification process and the chemical composition of the produced syngas. The amount of water in the fuel can vary significantly from 5–10 % for pellets and briquettes to 40 % or more for wood chips. When using wet fuels, energy is spent for evaporation of water thus decreasing the efficiency of the whole gasification process and calorific value of syngas. The amount of CO in syngas decreases significantly as fuel moisture increases. As the fuel moisture increases, the total amount of hydrogen injected into the gasifier goes up. At low fuel moisture, steam-carbon and water-gas reactions are active, as a result H2 initially increases. When the fuel moisture content reaches the critical limit, the amount of H2 in the syngas starts to decrease due to a significant temperature drop in the gasifier. The proportion of CH4 in syngas is increasing due to the growth of the fuel moisture. However, the increase in CH4 does not compensate for the substantial reduction in CO and H2 amounts at high fuel humidity because the calorific value of syngas and the efficiency of the gasification process decrease. The amount of H2O vapour in syngas increases significantly with the use of humid biomass, and active H2O steam condensation may also cause the gasification process to stop [16], [17].
Depending on biomass properties, recommended sizes of fuel can vary significantly. Increasing particle size increases heating and drying time. Increasing temperature gradient between the fuel surface and the middle part of the fuel particle contributes to a decrease in the amount of CO and CH4 in the syngas. Consequently, it is necessary to ensure that the size of wood chips is suitable [18].
Calorific value of produced syngas and the total efficiency of gasification process depend on the chemical composition of the fuel, in particular on hydrogen and carbon contents [19]. When using fuels with higher ash content, it is necessary to evaluate the necessity of optimization of the ash removing system. Increased ash content in raw material prevents the release of volatile substances from the fuel as well as the complete decomposition of char [20]. Good quality wood chips with ash content typically around 1% does not pose a problem for successful organization of the gasification process.
1.4. By-products of gasification process
Not all fuel introduced into the gasifier in gasification process is transformed into syngas. Part of the fuel does not transform to gaseous state, but goes out of the gasifier as tar or char. Tar is a very complex mixture of organic compounds – it contains both light compounds such as phenol and benzene, as well as heavy, non–volatile polychromatic compounds. Frequently chemical composition of tar is characterized by a general formula with three chemical elements – carbon, hydrogen and oxygen [21].
The presence of tar in syngas has a negative effect on further use of syngas. The accumulation of tar can have a negative effect on the operation of gasifier by obstructing the pipes, which may cause the gasifier to go out of service. It is important to reduce the amount of tar in syngas. Emphasis should be placed on tar formation reduction methods, minimizing the need for syngas treatment from tar [8].
Certain amounts of fuel do not convert to syngas but remain in solid form as char. The main component of char is carbon. Like tar, char is composed by three chemical elements: carbon, hydrogen, and oxygen. The heat of char combustion may exceed 30 MJ/kg, so char can be used for energy production, too [22].

14
The amount of tar and char former in the gasification process varies considerably depending on several factors. The amount of tar can depend on the type of gasifier. Usually the smallest tar amounts form in downdraft gasifiers. The gasification temperature has a predominant role in the formation process of tar and the total amount of char. Temperature increase in the gasifier contributes to an increase in the activity of hydrocarbon decomposition reactions, significantly reducing the amount of tar [23]. At increased temperatures, the activity of char degradation reactions in the reduction zone also increases [24].
However, as stated, gasification temperature is a dependent factor influenced by many parameters. The increase in the equivalence ratio contributes to a decrease in the amount of tar and char at the exit from the gasifier [25], [18]. Sometimes, two-stage air delivery systems are installed in the gasifiers introducing air at different heights or zones to increase the release of gases from biomass reducing the amount of tar and char [26].
Using fuels with higher moisture, the temperature in the gasifier goes down contributing to increases in the amounts of tar and char [25]. As the particle size of the fuel rises, the temperature difference between the fuel particle surface and within the particle increases. This contributes to the increase in the amount of tar and char [18].
Tar and char formation processes depend on a large number of factors therefore estimating yields from the gasification process using mathematical simulations is complicated. In most of the mathematical models of the gasification process, tar and char are not included at all. Sometimes the amount of tar and char is assumed to be a constant – not changing depending on the parameters of the gasifier's operation [27].
Table 1.2 presents the quantities of tar and char at different biomass gasification conditions. The data is compiled from scientific articles. The gasifier type and agent have a significant effect on volumes of tar and char. The table includes only the studies that reflect the amount of by-products in downdraft type reactors where air is used as gasification agent. Only the articles that reflect the actual quantities of tar and char during the experimental study of the gasification process were used.

15
Table 1.2
Summary of Previous Studies Presenting Tar and Char Formation During Biomass
Gasification Process
Gasification
temperature, °C
Air/fuel ratio,
m3/kg
Biomass
moisture, %
Ash content, %,
(dry) Source
930–1040 1.29–2.88 6.17 5.93 [15]
821–1206 1.37–1.64 12.5 0.77 [28]
553–755 1.04–1.63 6.00–11.0 0.50–1.4 [29]
705–920 0.87–1.85 4.37–15.2 3.90 [30]
830–1120 0.96–1.83 4.40–14.9 0.40–21.8 [31]
1009–1077 2.28–2.69 11.8 23.5 [32]
870–1108 1.11–1.28 8.00 0.55 [33]
773 1.88 18.0 1.3 [34]
Data analysis examining the yield of produced tar and char depending on various parameters was performed using the scientific articles mentioned in Table 1.3. Data analysis was done using the STATGRAPHICS Centurion 16.1.17 programme. Two regression equations were obtained. It was determined that the amount of produced tar depends on gasification temperature, air and fuel ratio, and moisture content. In the first equation, the amount of tar is expressed as the mass of the produced tar from the gasifier in relation to the total quantity of products introduced into the gasifier (fuel with air), or the proportion of tar in the total amount of produced products as a result of the gasification process (1.1.).
2(6.411 0.203 ) 0.248 0.024tar g fw T AF W (1.1.)
where wtar is the amount of tar in relation to the total quantity of injected products in the gasifier,
%; gT is temperature in the gasifier reactor, °C; AF is the ratio of input air into the gasifier to the
amount of injected fuel, m3/kg; and fW is fuel moisture content, %.
In turn, the amount of produced char in the second equation depends on the gasification temperature, the air/fuel ratio, the moisture, and ash content of the fuel. In the equation the amount of char is expressed as the mass of the produced char in relation to the amount of injected fuel into the gasifier (1.2.).
2(6.443 0.006 ) 2.108 0.193 0.487fchar g f fw T AF W A (1.2.)
where fcharw is the amount of char in relation to the amount of injected fuel into the gasifier, %;
and fA is fuel ash content, %.
The abovementioned equation expresses the amount of char in relation to the amount of total injected product into the gasifier, or the proportion of char in the total amount of products in the gasification process (1.3.).
16
f char fchar
in
m ww
m (1.3.)
where wchar is the amount of char in relation to the total quantity of injected products in the gasifier, %; mf is amount of entered fuel in the gasifier, kg; and min is total quantity of products, which are entered in the gasifier, kg.
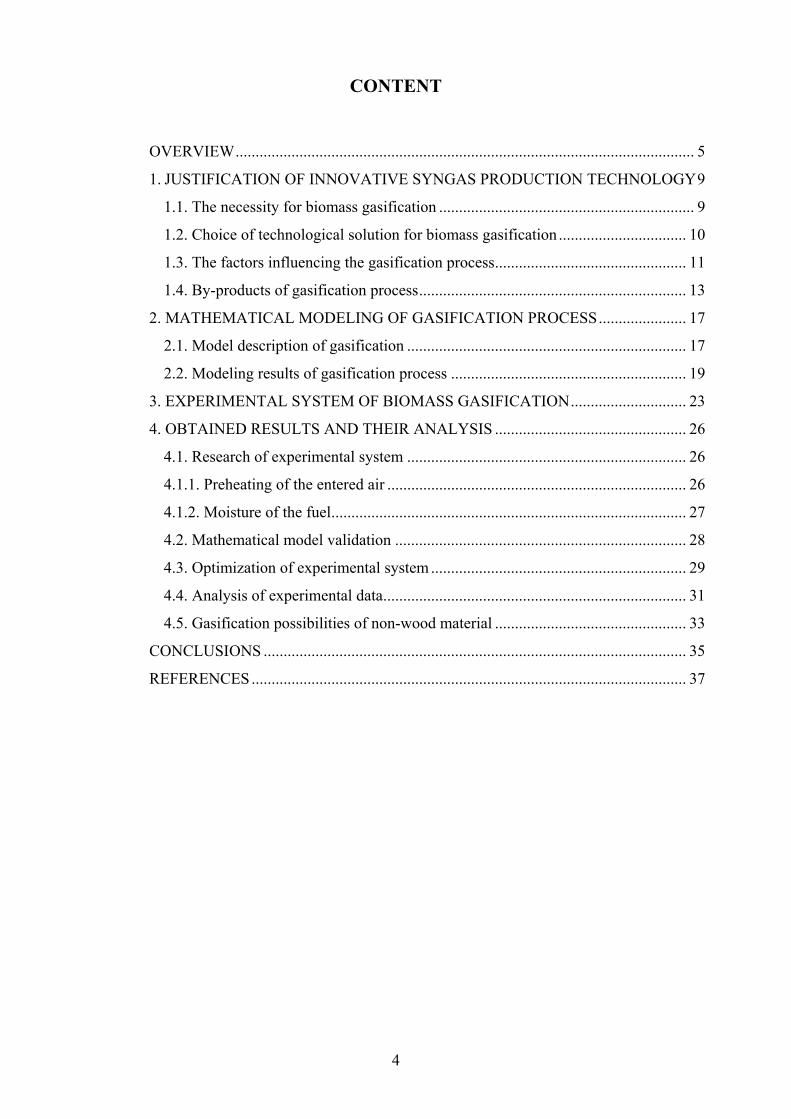
Correlation coefficients R2 show that the obtained regression equations represent 77.60 % and 68.24 % of tar and char values (Table 1.3). Standard error values are low, which suggests that equations can be successfully used to determine the amount of tar and char at different parameters. In both equations temperature has the greatest influence on the dependent parameter.
Table 1.3
Data Analysis of the Regression Model
Regression model
Dependent variable R2, % Adjusted R2, % Standard error
of estimate
I Tar 77.60 75.81 0.51
II Char 68.24 63.67 2.13
The analysis of the data, the obtained regression equations, as well as the possibility and advantages of using these equations in the mathematical models of the gasification process, can be found in Kirsanovs et al. publication in scientific journal [35].

17
2. MATHEMATICAL MODELING OF GASIFICATION PROCESS
2.1. Description of gasification model
The process of biomass gasification depends on a number of factors. This means that there is a need for a large amount of experiments to determine the impact of all factors. Nowadays the role of modeling in researching the gasification processes is increasing. Mathematical models simulate and study both physical and chemical processes that are taking place in a gasifier. It is essential that models can obtain results at specific operational parameter values. In the case of experimental research, especially in industrial experiments, it is often difficult to obtain values of the required parameters, especially in longer term. Often mathematical models determine the optimal geometric parameters of the gasifier – the gasifier length, the distribution of zones, the height of the injected air. Additionally it can be possible to simulate the operation of a gasifier under critical conditions by setting the maximum permissible working ranges for operating factors. In the case of modeling, the development of the model takes more time, but simulation and data acquisition do not require significant time resources as well as financial resources compared to experimental research.
Within the framework of the research, a model of biomass gasification process was developed. The model is based thermodynamic laws and reactions. Based on literature analysis provided in Chapter 1 comparing the known gasification technologies, the developed model describes the gasification process for a downdraft gasifier, where air is used as the gasification agent. It was assumed that the obtained syngas consists of six typical gases – CO, CO2, H2, CH4, N2, and H2O. In addition to syngas, gasification produces two by-products − tar and char, which are included in the model as wel. Based on the literature review it was concluded that the main factors in the gasification process are the equivalence ratio and the fuel moisture. The model primarily studies the effects of these two factors to determine the optimal value in order to achieve the maximum efficiency of the gasification process.
The mass and energy balance in the model corresponds to the actual flow of the process. The mass balance in model consists of two input and four output flows (Fig. 2.1.). The main input flow is the fuel, including the ash and moisture content. The second input flow is air – the gasification agent. Output flows are syngas, tar, char, and ash.
Fig. 2.1. Gasification process mass (left) and energy (right) balance.

18
The energy balance in the model consists of three input and three output flows. The predominant amount of heat in the gasifier comes from combustion heat. The second and third input flows are relatively small amounts of entered physical heat of air and fuel. This amount of heat can be increased by preheating air and fuel. The energy balance consists of three output flows, the biggest of which is energy in the form of combustion gases in syngas. The syngas temperature at the exit from the gasifier is quite high and hence physical heat too is a significant part of the energy balance. In addition, as in any other thermodynamic process, heat loss occurs.
The developed mathematical model can be described with a general equation that consists of the chemical composition and moisture of the biomass as well as the injected air, but the process leads to the formation of syngas, which consists of six gases, as well as tar and char (2.1.).
charntarnNnOHnCHnCOn
COnHnNObOaHNOCH zyx
8726254423
21222 2)76.3(
(2.1.)
where zyx NOCH is dry fuel, kmol; a is amount of water, kmol; b is amount of air, kmol; 21Hn is
amount of H2, kmol; COn2 is amount of CO, kmol; 23COn is amount of CO2, kmol; 44CHn is
amount of CH4, kmol; OHn 25 is amount of H2O, kmol; 26Nn is amount of N2, kmol; tarn7 is
amount of tar, kmol; and charn8 is amount of char, kmol.
The model is based on a number of assumptions that are fundamental for the gasification process. First are equations for balance of carbon, hydrogen and oxygen (2.2.)−(2.4.):
018744232 charntarnCHnCOnCOn (2.2.)
0242 287442521 OaHxxcharnxtarnCHnOHnHn chartar (2.3.)
0)76.3(2
2
222
8725232
yNObOaH
ycharnytarnOHnCOnCOn chartar (2.4.)
where xtar is the molecular proportion of hydrogen in tar; xchar is the molecular proportion of hydrogen in char; ytar is the molecular proportion of oxygen in tar; and ychar is the molecular proportion of oxygen in char.
Many reactions happen during biomass gasification. Two reactions – the reaction of water vapour convection and the methane reaction − are used as obligatory conditions in the mathematical model (2.5.)−(2.6.):
0961.3
4276
2522123
TeOHnCOnHnCOn (2.5.)
24 4 1 2
3 62
2
7082.842( 6.567ln
(7.467 10 ) 2.167 10 0.70232.541) 0
2 6 2
kopn CH n n H EXP TT
TT
T
(2.6.)
where T is gasification temperature, °C.

19
The developed model also calculates the amount of tar and char, which are produced during the gasification process. This amount can be expressed in two ways. First of all, the amount of tar and char is the multiplication of the molar ratio and molecular weight to these products. In addition, two regression equations were obtained from the analysis of the data, showing the amount of tar and char depending on the temperature of the gasification, the ratio of air and fuel, the amount of moisture and ash in the fuel. Thus, the equations that need to be implemented as a result of gasification are expressed (2.7.)−(2.8.):
7 tar in tarn tar M m w (2.7.)
8 char in charn char M m w (2.8.)
where Mtar is the ratio of the mass of tar and molecular weight, kg/kmol; and Mchar is the ratio of the mass of char and molecular weight, kg/kmol.
Another condition that needs to be implemented in the gasification process is the energy balance of the process when the energy and physical heat of the input products are equal to the energy of produced products and the heat from the gasification surface to the surrounding environment (2.9.).
izvprodieviev QHQH (2.9.)
where Hiev is the energy of injected products in the gasifier, kJ/kmol; Qiev is the physical heat of injected products in the gasifier, kJ/kmol; Hprod is the energy from the gasification process, kJ/kmol; and Qizv is the heat from the gasifier surface to the surrounding environment, kJ/kmol.
2.2. Modeling results of gasification process
The developed gasification model determines the influence of equivalence ratio and fuel moisture on the production of syngas. Typical chemical composition of wood chips can be described by chemical formula CH1.47O0.66. This type of wood chips was also used in the model to simulate the parameters as close as possible to the real-life experimental research. Data of optimal operational parameters was obtained from experimental research (including input fuel and air volume).
The modeling of gasification process was done for the following fuel moistures – 10 %, 20 % and 30 %, to determine the impact of fuel moisture content. The results of the simulation showed that depending on fuel moisture, the equivalence ratio increase promotes the gasification temperature growth up to 840–1030 °C (Fig. 2.2.). The rate of oxidation reactions increases when air supply to gasifier is increased. When the fuel moisture increases, the temperature in the gasifier decreases, because the amount of energy needed to evaporate all water that is in the fuel increases. Depending on the change of moisture content the temperature decrease in the gasifier can range from 150–190 °C (Fig. 2.2.)

20
Fig. 2.2. Equivalence ratio and fuel moisture effect on the gasification temperature.
The results of mathematical modeling show that with the increase in the equivalence ratio,
the yield of tar and char in relation to the total quantity of output products decreases (Fig. 2.3.). The increase in the equivalence ratio contributes to the temperature increases in the reactor. In response, temperature increase contributes to the growth in the activity of hydrocarbon decomposition reactions. As a result, most of tar converts to compounds with lower molecular weights and decomposing in the reduction zone. Char decomposition is also much more active at higher temperatures. The increase in the moisture content of the fuel contributes to a decrease in the temperature of the gasification and increases the amount of tar by 0.6–3.2 % and char by 2.4–3.5 % depending on the equivalence ratio.
Fig. 2.3. Equivalence ratio and fuel moisture effect on the tar (left) and char yield (right).
Changes in air supply and fuel moisture content indirectly have significant effect on the
composition of the produced syngas. In practice, all reactions occurring in the gasifier are temperature dependent. As the temperature rises, Boudouard reaction activity increases: the carbon in the fuel reacts more significantly with CO2, which was released in the pyrolysis zone. As a result, the CO concentration in the syngas increases with the increase of the equivalence ratio, but, with increasing fuel moisture, CO concentration decreases by 11.8–19.0 % (Fig. 2.4). This signifies that when the gasification temperature reaches a certain level, the amount of CO starts decreasing.
300
450
600
750
900
1050
0.20 0.25 0.30 0.35 0.40
Equivalence ratio
Gasification temperature, °C
Wf=10 % Wf=20 % Wf=30 %
0
1
2
3
4
5
6
7
0.20 0.25 0.30 0.35 0.40
Equivalence ratio
Tar, %
Wf=10 % Wf=20 % Wf=30 %
0
1
2
3
4
5
6
7
8
9
10
0.20 0.25 0.30 0.35 0.40
Equivalence ratio
Char, %
Wf=10 % Wf=20 % Wf=30 %

21
Fig. 2.4. Equivalence ratio and fuel moisture effect on the CO (left) and H2 (right) weight in syngas.
The increase of gasification temperature increases the activity of water-gas and steam-
carbon reactions. This contributes to the increase in H2 in syngas. On the other hand, the increase in the temperature of gasification contributes to the increased activity of oxidation reactions, as a result H2 is burnt. It is possible to assess the trend that initially H2 levels increase at low gasification temperatures, however, after temperature reaches a certain critical point, the trend is changing and the amount of H2 begins to decrease.
Temperature rise contributes to an increase in activity of methanation reactions. However, oxidation reactions that lead to the separation of CH4 into CO and H2O vapour are also significantly more active. Consequently, the concentration of CH4 in syngas decreases with the increase of equivalence ratio until minimum (Fig. 2.5.). With increasing fuel moisture, the amount of CH4 increases.
Fig. 2.5. Equivalence ratio and fuel moisture effect on the CH4 (left) and H2O (right)
weight in syngas.
Gasification process also yields certain amount of H2O vapour, which condenses cooling syngas and condensate can be removed. H2O steam contains hydrogen, which is not used for the increase of the calorific value of syngas. The increase in fuel moisture contributes to the increase in H2O in syngas by 11–27 % depending on equivalence ratio. When air supply is increased, the amount of H2O increases. The reactions of methanation lead to the formation of H2O vapour from CO and H2.
0
5
10
15
20
25
30
0.20 0.25 0.30 0.35 0.40
Equivalence ratio
CO, vol% (dry)
Wf=10 % Wf=20 % Wf=30 %
0
5
10
15
20
25
0.20 0.25 0.30 0.35 0.40
Equivalence ratio
H2, vol% (dry)
Wf=10 % Wf=20 % Wf=30 %
0
1
2
3
4
5
6
0.20 0.25 0.30 0.35 0.40
Equivalence ratio
CH4, vol% (dry)
Wf=10 % Wf=20 % Wf=30 %
0
5
10
15
20
25
30
35
40
0.20 0.25 0.30 0.35 0.40
Equivalence ratio
H2O, vol% (wet)
Wf=10 % Wf=20 % Wf=30 %

22
The calorific value of syngas is influenced by the amount of CO, H2 and CH4 it contains. Although the increase of equivalence ratio contributes to the increase in CO concentration, the proportion of H2 and CH4 in syngas decreases. Consequently, it can be observed that the calorific value of syngas decreases by 0.4–1.9 % depending on fuel moisture and air supply (Fig. 2.6.). The increase in the fuel moisture also has a negative effect on the calorific value of the produced gas. CO and H2 concentrations in syngas will decrease and the increase in CH4 cannot compensate the reduction of syngas combustion heat.
Fig. 2.6. Equivalence ratio and fuel moisture effect on the syngas calorific value (left) and gasification process total efficiency (right).
The increase of fuel moisture reduces total efficiency of the gasification process by 26–40 %, which is evident by the decrease in the syngas calorific value and the increase in the amount of tar and char. In turn, the increase of the equivalence ratio has a positive effect on the efficiency of the process. Although the calorific value of syngas goes down with increasing air supply, the amount of produced syngas increases substantially, because the amount of both by-products tar and char decreases. The total efficiency of gasification depends not only on the amount of total produced syngas and its calorific value, but also on the physical heat that is removed from syngas during cooling. When the equivalence ratio is increased, the gasification temperature is rising contributing to the rising temperature of syngas at the exit of gasifier. Consequently, it is possible to recover more physical heat from syngas by cooling process. As a result, with the increase of the equivalence ratio, the efficiency of the gasification process is increasing. The growth of efficiency is especially significant when increasing the equivalence ratio from 0.20 to 0.30. However, with an increase of equivalence ratio above 0.30, the increase in the total efficiency becomes significantly lower due to the rapid drop in the calorific value of the produced syngas.
The obtained results of the developed mathematical model of gasification process allow two significant conclusions. First, the effect of fuel moisture on the gasification process is clearly negative. With increasing moisture, the proportion of tar and char in the total amount of produced products increases, the CO and H2 gas concentrations in syngas, calorific value of produced gas, and the efficiency of the gasification process decreases. Secondly, an increase in the equivalence ratio contributes to the decomposition of tar and char, which results in an increase in the total amount of syngas, as well as an increase in the CO concentration. As a result, the efficiency of the total gasification process is increasing. However, as the air coefficient reaches the critical point, the concentration of H2 and CH4 gases in syngas begins to decrease. As a result, the produced syngas is of lower quality – lower amount of H2 and CH4 as well as lower calorific value.
0
1
2
3
4
5
6
7
0.20 0.25 0.30 0.35 0.40
Equivalence ratio
Syngas calorific value, MJ/Nm3
Wf=10 % Wf=20 % Wf=30 %
20
30
40
50
60
70
80
90
0.20 0.25 0.30 0.35 0.40
Equivalence ratio
Total efficiency, %
Wf=10 % Wf=20 % Wf=30 %

23
3. EXPERIMENTAL SYSTEM OF BIOMASS GASIFICATION
The analysis of literature showed that wood chips are the most accessible local resource that can help to increase the share of energy from renewable energy sources in total energy consumption. However, the widespread use of wood chips in the gasification process is limited by high moisture content, which has a negative impact on the quality of the produced syngas. One of the solutions is partial drying of the fuel before entering the gasifier. Nowadays there is a considerable amount of technological solutions for biomass drying. All technologies use heat that can be obtained from electricity, combustion of a fuel or other source of energy and undoubtedly certain costs are implied.
The results of the modeling of the gasification process show that it is possible to recover a certain amount of physical heat during cooling syngas. This amount of heat depends on many factors, the most important of which are the equivalence ratio and the fuel moisture. The physical heat of syngas can be used to partially dry wood chips before entering into the gasifier. In this way, the technological solution for obtaining syngas from humid wood chips can be considered an innovative technology of gasification.
The research of an innovative gasification technology took place in an industrial facility. The advantage of industrial experiments is that the research of the system happens in real working conditions, taking into account the existing factors that are influencing the gasification process. The gasification process is a complicated thermodynamic process in which one factor directly influences the value of several other parameters. Consequently, experimental research methodology is crucial – the gasification study depended on a set of multiple factors rather than just one parameter. In the performed experimental study, based on the measured data, gas mass balance and energy balance for different modes of gasification were calculated and compiled. It was possible to obtain regression equations characterizing the operation of system depending on several variables.
Usually the parameters selection for gasification depends on the further exploitation of syngas. This affects the choice of gasifier type and thermal power. Based on these criteria, the choice of other elements takes place. The research system is equipped with a downdraft gasifier because the temperature of syngas at the outlet from the gasifier is high and it is possible to obtain more physical heat by cooling process for drying of wood chips.
In the experimental system, the gasifier has a nominal thermal capacity of 400 kW. As concluded in the literature review, downdraft reactors are recommended for low thermal power. In addition, the concentration of the tar in syngas from downdraft gasifiers is considerably lower, and hence the technology of cleaning of syngas can be considerably simpler and cheaper in installation and in operation. The reactor of gasifier has a pronounced narrowing in the middle. One of the main gasifier's peculiarities and differences from other available gasifiers is that there is a vertical element with blades in the middle of the reactor that slowly but continuously rotates ensuring fuel mixing. The results of fuel mixing are that the heating of the fuel, drying and the release of volatile substances happen evenly.
Figure 3.1 illustrates the studied gasification system and measured parameters. The gasification system has the following parts: fuel preparation and delivery system, air supply system, gasification plant or the gasifier, cooling system, syngas cleaning system, and the

24
utilization system. In addition to the individual element, the gasification process monitoring and control system can be considered.
Fig. 3.1. Flowchart of the biomass gasification plant with measurement points, where T1 is gasifier temperature in the pyrolysis zone, °C; T2 is gasifier temperature in the oxidation zone, °C; T3 is gasifier temperature in the reduction zone, °C; T4 is injected air temperature before
syngas / air heat exchanger, °C; T5 is air temperature after syngas / air heat exchanger, °C; m1 is injected air flow kg/h; V1 is primary air flow, m3/h; V2 is secondary air flow, m3/h; T6 is water temperature before syngas / water heat exchanger (return), °C; T7 is water temperature after
syngas / water heat exchanger (supply), °C; m2 is water flow rate through syngas / water heat exchanger; T8 is temperature of syngas at the exit from the gasifier, °C; T9 is temperature of
syngas after syngas / air heat exchanger, °C; T10 is temperature of syngas after syngas / water heat exchanger, °C; Ss is composition of syngas, volume% (dry); Fs is sample of fuel; Bs is
sample of char; and Ts are measurements of tar concentration.
The gasification system is installed in four container modules that make the system mobile
and easy to transport. The first container is equipped with the gasifier itself, as well as char outlet system. The upper container contains a part of the fuel supply system, as well as cooling and purification systems of syngas. Next to the container is a monitoring and control system of gasifier. The last container contains a gas boiler for syngas burning with control system. In addition to the adjacent containers, a storage module of wood chips with wood chips delivery system is present.
The investigated gasification system features a two-stage cooling system of syngas. The largest amount of recovered heat is used to dry wood chips using air heater. Wood chips are stored and dried in a special module. The moisture content of the fuel at the exit from the storage container depends on the amount of initial moisture of the fuel, the length of time of fuel in the container or the drying time, the amount of supplied heat to the dryer, and other factors.
Air is used as a gasification agent and it is taken from the surrounding environment. Before entering the reactor, it is introduced into a heat exchanger where it is heated by direct contact with hot syngas. In this way, the gasifier does not form areas with low temperatures in places where air injection occurs. Another peculiarity of the investigated gasification system is the possibility to split the air supply into the gasifier as primary and secondary flows. Primary air is injected in the middle of the gasifier before the narrowing or oxidation zone, where the partial combustion

25
process takes place. The secondary air is injected in the pyrolysis zone, which is located above the oxidation zone. The secondary air can be varied from 0 % to 15 % of the total amount of injected air into the reactor.
Cyclone and a special fabric filter are used to clean the cooled syngas from solid particles. The utilization of syngas in the system takes place in a gas boiler. Char is removed from the bottom of gasifier and then stored in a special container. The operation of gasifier is guided by measurement data of the monitoring system.

26
4. OBTAINED RESULTS AND ANALYSIS
4.1. Research of experimental system
The obtained results characterize the operation of a gasification station under real working conditions. To determine the optimal operating settings for the gasification station, measurements were made, and the values of several parameters were changed. The main attention was paid to determining the influence of air preheating and moisture of fuel. Changes in operating settings happened gradually without rapid fluctuations. Consequently, there is often no distinction between measured values of the tests. This is one of the main differences from laboratory studies where there is a strong distribution of tests, and each test describes the operation of the gasifier with certain parameters.
4.1.1. Preheating of the entered air
One of the peculiarities of the innovative technological solution is the possibility to heat up the supplied air to the gasifier. When syngas flows through syngas / air heat exchanger, it heats air. The temperature to which it is possible to heat up air depends on the flow rate of syngas, the temperature of the syngas at the exit of the gasifier, as well as air flow rate and the initial temperature. Measurements to determine the usefulness of air preheating were made when the gasifier operated without air preheating, and with air preheating. Without air preheating the average injected air temperature was 16.0 °C, while using preheated air it was 360 °C. The obtained results show that the temperature in the gasifier in the oxidation zone increases from 522 °C without air preheating to 611 °C with air preheating (Fig. 4.1.). As a result, the temperature of syngas increases from 428 °C to 495 °C. This in turn means that it is possible to get more physical heat by cooling syngas.
Fig. 4.1. Air preheating effect on injected air temperature, oxidation zone temperature and syngas temperature.
The increase in temperature in the gasifier contributes to the increase in the activity of
several reactions. The carbon, that is in the fuel, reacts more actively with the CO2 that is produced in the pyrolysis zone, as well as the activity of the water-gas and steam-carbon reactions increases, as a result the amount of hydrogen in syngas increases. However, at higher temperatures, methane separation processes are more active, resulting in gas being divided into CO2 and H2O. CH4 concentration drops from 1.3 % to 1.1 % (Fig. 4.2.).
360
16
611
495522
428
300
350
400
450
500
550
600
650
700
0
50
100
150
200
250
300
350
400
T air T oxidation zone T syngas
Air temperature, °C Syngas and oxidation zone temperature, °C
With preheating Without preheating

27
Fig. 4.2. Air preheating effect on CO, H2 and CH4 weight in syngas (left) and syngas calorific value and gasification process total efficiency (right).
Changes in the composition of syngas contribute to the change in the calorific value of
syngas. Although the concentration of CH4 in syngas decreases by preheating the air, however, the increase in concentrations of CO and H2 gases is more significant and syngas calorific value increases from 4.8 MJ /m3 to 5.1 MJ /m3. The increase in the temperature of the supplied gas in the gasifier also has a significant impact on the total efficiency of the gasification process. Efficiency rises by 1.4 % from 62.3 % without preheating the air up to 63.7 % with preheated air.
4.1.2. Moisture of the fuel
Syngas is cooled not only with air, but also with water. The heat recovered by water is used to dry fuel. Consequently, drying of wood chips happens all the time while the gasification process takes place. This contributes to a gradual reduction of fuel moisture. In experiments, fuels with different moisture content were used. By changing moisture content of fuel from 12.0 % to 16.2 % and to 21.1 % the temperature in the oxidation zone or the gasification temperature decreased from 611 °C to 558 °C. The temperature of syngas dropped from 495 °C to 439 °C (Fig. 4.3.).
Fig. 4.3. Fuel moisture effect on oxidation zone temperature and syngas temperature.
The reduction in the temperature of the gasification also contributes to a decrease of CO concentration from 21.3 % to 13.6 % (Fig. 4.4.). H2 concentration changes in the syngas are significantly lower. Due to the reduction of temperature water-gas and steam-carbon reaction
21.3
19.119.6
17.5
1.1
1.3
0.0
0.3
0.6
0.9
1.2
1.5
1.8
2.1
15
16
17
18
19
20
21
22CH4, vol% (dry)CO un H2, vol% (dry)
With preheating Without preheating
CO H2 CH4
5.1
4.8
63.7
62.3
60
61
62
63
64
65
4.3
4.5
4.7
4.9
5.1
5.3
Syngas calorific value Total efficiency
Total efficiency, %Syngas calorific value, MJ/m3
With preheating Without preheating
611 592 558 495
469439
420
440
460
480
500
520
520
540
560
580
600
620
T oxidation zone T syngas
Syngas temperature, °COxidation zone temperature, °C
W=12.0 % W=16.2 % W=21.1 %

28
activities decrease. On the other hand, as the fuel moisture increases, an additional amount of H2 is also introduced into the gasifier. In turn, the CH4 concentration increases from 1.06 % to 1.66 %. This is mainly due to the decrease in the CH4 decomposition activity when the temperature in the reduction zone decreases.
Fig. 4.4. Fuel moisture effect on CO, H2 and CH4 weight in syngas (left) and syngas calorific value and total efficiency of gasification process (right).
There is no doubt that, at the increase of the fuel moisture, the amount of H2O steam
increases significantly. H2O steam condensation occurs when the temperature of the syngas falls below 100 °C. In the case of high H2O vapour, it is necessary to pay special attention to the condensate removal process from syngas. Reduction of CO and H2 concentration of syngas contributes to a reduction in the calorific value of combustion of gas. In the considered example, when the fuel moisture increased from 12 % to 21.1 %, syngas calorific value decreased from 5.1 MJ /m3 to 4.3 MJ /m3. The increase in fuel moisture also has a negative impact on the total efficiency of the gasification process. The efficiency decreased from 63.7 % to 51.9 %.
4.2. Validation of mathematical model
The data obtained during the experimental study was used to validate the developed mathematical model in order to evaluate the quality of model and its further application possibilities. The data from gasification experiments (with the preheating of the introduced air and the gasifier operating at its nominal thermal output with variable fuel moisture) was used. The difference or error between the experimentally measured parameter value and the parameter value obtained in modeling was calculated using the following equation (4.1.):
-
100%exp mod
Errorexp
(4.1.)
where Error is difference between data from experimental and mathematical model, %; exp is experimental data value; and mod is data value from mathematical model.
Figure 4.5 presents the comparison between the obtained CO concentration in syngas from experimental research and modeling. In all scenarios during the experimental study, the measured CO concentration is 1.4 % to 3.0 % higher than CO concentration obtained by the mathematical model. The difference in H2 concentration between experimentally obtained values and the mathematical model are also relatively small and ranges from 0.5 % to 3.2 %. The CH4 content of syngas is significantly lower than the amount of CO and H2. This could be one of the factors for
21.3
19.117.9 18.8
13.6
18.5
1.06
1.25
1.66
0.6
0.8
1.0
1.2
1.4
1.6
1.8
10
12
14
16
18
20
22CH4, vol% (dry)CO and H2, vol% (dry)
W=12.0 % W=16.2 % W=21.1 %
CO H2 CH4
5.1
4.7
4.3
63.7
59.0
51.9
45
49
53
57
61
65
3.5
3.9
4.3
4.7
5.1
5.5
Syngas calorific value Total efficiency
Total efficiency, %Syngas calorific value, MJ/m3
W=12.0 % W=16.2 % W=21.1 %

29
the bigger difference between the CH4 concentration in syngas from the experimental research and modeling. The difference between the measured and calculated CH4 concentration ranges from 3.3 % to 6.9 %.
Fig. 4.5. CO (left) and H2 (right) data comparison from experiment and model.
Differences between the composition of syngas in the experimental measurement data and
the results that are obtained from the mathematical model, largely depend on how accurate is the data describing gasification temperature. Overall, the temperature variation ranges from 2.6 % to 4.0 %. The differences in the obtained calorific values between the experimentally acquired data and data from the mathematical model do not exceed 2.4 % (Fig. 4.6.). The differences between measured and calculated gasification process efficiencies are slightly higher and range from 4.2% to 6.2%. Efficiency depends on many parameters, among which are calorific value of syngas, syngas yield, heat losses, fuel parameters etc. where smaller errors add up.
Fig. 4.6. Comparison of data of total efficiency of syngas heat of combustion (left) and gasification process (right) from the experiment and model.
Validation of the mathematical model confirmed correct development of the model. The
results obtained from the model closely coincide with the experimental data and the maximum difference between the results was 6.9 % for the total gasification efficiency. The developed mathematical model can do simulation of the gasification process under various conditions.
4.3. Optimization of experimental system
The possibilities of gasification process optimization focused on the air supply division into primary and secondary air. Typically for downdraft gasifiers, the primary air is injected in the
0 5 10 15 20 25
CO, vol% (dry)
Experiment Model Error
Wf=21.1 %
Wf=16.2 %
Wf=12.0 %
1.4 %
2.1 %
3.0 %
0 5 10 15 20 25
H2, vol% (dry)
Experiment Model Error
Wf=21.1 %
Wf=16.2 %
Wf=12.0 %
3.0 %
3.2 %
0.5 %
0.0 1.0 2.0 3.0 4.0 5.0 6.0
Syngas calorific value, MJ/m3
Experiment Model Error
Wf=21.1 %
Wf=16.2 %
Wf=12.0 %
0.0 %
0.1 %
2.4 %
0 20 40 60 80
Total efficiency, %
Experiment Model Error
Wf=21.1 %
Wf=16.2 %
Wf=12.0 %
6.2 %
5.1 %
4.2 %
30
oxidation zone. It was decided to inject secondary air higher in the pyrolysis zone. Three scenarios were tested in the experiments to study the distribution of supplied air. In the first case, all air was supplied into the oxidation zone and, consequently, the proportion of secondary air was 0 %. In the second case 92.5 %, and in the third case 85 % of the total supplied air was injected with primary air, so the secondary air in the second and third scenario was 7.5 % and 15 % of the total air supply. Measurements of varying secondary air amounts were done using fuel with moisture content 12 %. Preheated air temperature was the same in all measurements.
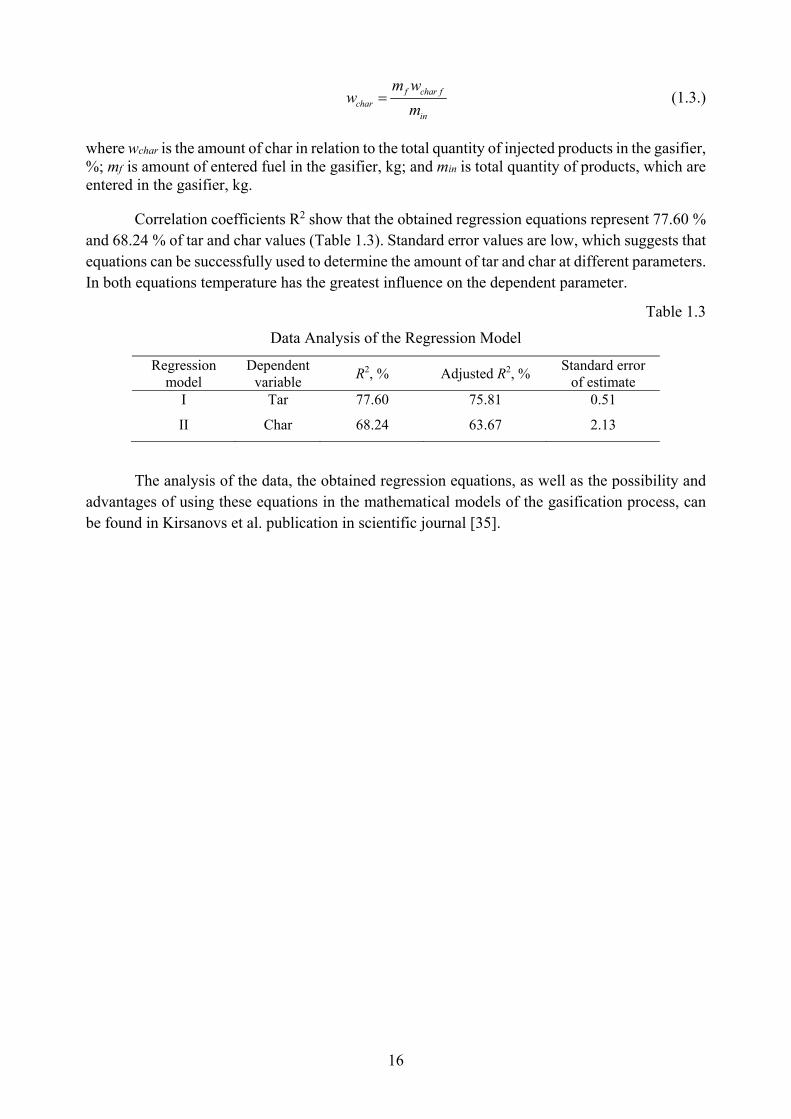
Measurement results show that by increasing the proportion of secondary air, the temperatures in the pyrolysis and oxidation zone are increasing (Fig. 4.7.). The increase of temperature in the pyrolysis zone from 256 °C to 312 °C can be explained by the injection of air preheated to 360 °C temperature. Fuel enters the oxidation zone with higher temperature, therefore the release of volatile substances and oxidation reactions is more active. The temperature in the oxidation zone increased from 611 °C to 653 °C. The increase in temperature in the gasifier contributes to the increase of syngas temperature from 495 °C to 578 °C, and it is possible to obtain more heat during the cooling process (for wood chip drying).
Fig. 4.7. Effect of ratio of secondary air flow on pyrolysis zone temperature,
oxidation zone temperature and syngas temperature.
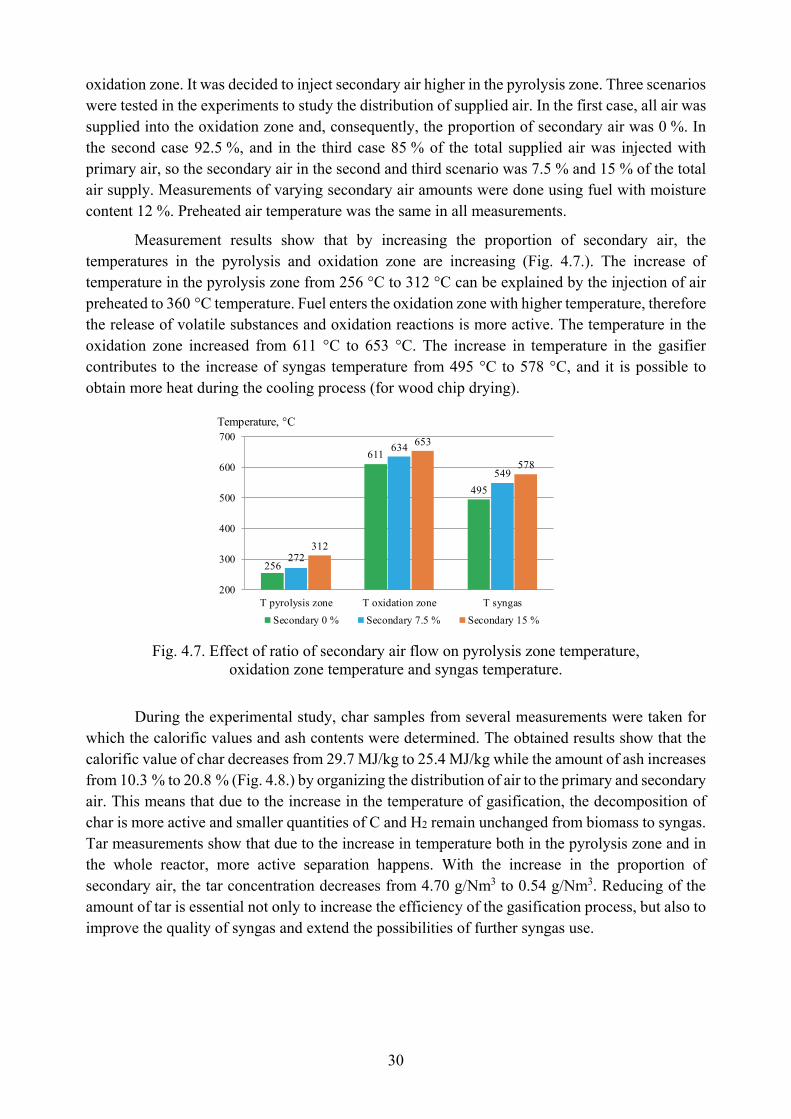
During the experimental study, char samples from several measurements were taken for which the calorific values and ash contents were determined. The obtained results show that the calorific value of char decreases from 29.7 MJ/kg to 25.4 MJ/kg while the amount of ash increases from 10.3 % to 20.8 % (Fig. 4.8.) by organizing the distribution of air to the primary and secondary air. This means that due to the increase in the temperature of gasification, the decomposition of char is more active and smaller quantities of C and H2 remain unchanged from biomass to syngas. Tar measurements show that due to the increase in temperature both in the pyrolysis zone and in the whole reactor, more active separation happens. With the increase in the proportion of secondary air, the tar concentration decreases from 4.70 g/Nm3 to 0.54 g/Nm3. Reducing of the amount of tar is essential not only to increase the efficiency of the gasification process, but also to improve the quality of syngas and extend the possibilities of further syngas use.
256
611
495
272
634
549
312
653
578
200
300
400
500
600
700
T pyrolysis zone T oxidation zone T syngas
Temperature, °C
Secondary 0 % Secondary 7.5 % Secondary 15 %

31
Fig. 4.8. Effect of ratio of secondary air flow on char properties (left) and tar content (right).
Air division into primary and secondary air has a positive effect on the chemical composition of the obtained syngas. Increase in the gasification temperature contributes to an increase in the Boudouard reaction activity, which results in an increase in the CO concentration in syngas from 21.3 % to 23.5 % at a secondary air 15.0 % (Fig. 4.9.). On the other hand, the H2 concentration is initially rising from 19.1 % to 21.7 %, followed by a sharp drop in H2 to 19.6 %. Initially with increasing gas temperature, the activity of water-gas and steam-carbon reactions also go up and as a result the amount of H2 increases. However, if the temperature is continuing to grow, a certain critical limit is reached when oxidation reactions become too active and H2 is burned. The increase in temperature also has a negative effect on the CH4 concentration, which decreases from 1.1 % to 0.85 %.
Fig. 4.9. Effect of secondary air ratio on CO, H2 and CH4 weight in syngas (left) and syngas
calorific value and total efficiency of gasification process (right).
By organizing the distribution of supplied air into primary and secondary air and providing
7.5 % of secondary air, it is possible to obtain syngas with the highest calorific value of 5.5 MJ/m3 as well as increase the efficiency of the gasification process up to 69.6 %. By increasing the proportion of secondary air up to 15.0 %, the temperature in the reactor increases and reaches a limit when the calorific value of syngas and the efficiency of the gasification process decreases.
4.4. Analysis of experimental data
Experimental research data was analyzed using the STATGRAPHICS Centurion 16.1.17 programme. The main task defined in the data analysis was to determine the influence of gasifier
29.7
27.1
25.4 10.3
17.7
20.8
8
12
16
20
24
24
26
28
30
32
Char calorific value Ash content
Ash content, %Char heating value, MJ/kg
Secondary 0 % Secondary 7.5 % Secondary 15 %
4.70
0.870.54
0
1
2
3
4
5
6
Tar content, g/Nm3
Secondary 0 % Secondary 7.5 % Secondary 15 %
21.3
19.1
22.121.7
23.5
19.6
1.061.01
0.85
0.6
0.7
0.8
0.9
1.0
1.1
1.2
18
19
20
21
22
23
24
CH4, vol% (dry)CO and H2, vol% (dry)
Secondary 0 % Secondary 7.5 % Secondary 15 %
CO H2 CH4
5.1
5.5
5.4
63.7
69.668.5
56
59
62
65
68
71
4.7
4.9
5.1
5.3
5.5
5.7
Syngas calorific value Total efficiency
Total efficiency, %Syngas heating value, MJ/m3
Secondary 0 % Secondary 7.5 % Secondary 15 %

32
operating parameters on the main factors of the gasification process: the thermal capacity of the gasifier, the calorific value of the produced syngas, and the process efficiency. The results of data analysis show that moisture and consumption of fuel, and primary / secondary air flow rates had a decisive influence on the performance of gasifier in the experimental study. Three equations were obtained. Equations summarize the main gasification process parameters depending on the variable factors of the gasifier operation. The proportion of primary air characterizes the distribution of supplied air. The effect of change in primary air ratio is not linear, therefore, in each model the same parameter was added in the second grade (4.2.)−(4.4.).
2prim prim f f-3860.39 + 88.79 - 0.486039 + 2.89992 - 16.9648 terQ w w m W (4.2.)
2sin f prim prim-35.3626 - 0.0919856 + 0.911552 - 0.00495398 LHV W w w (4.3.)
2prim prim f f-584.985 + 14.5856 - 0.0802632 - 1.5113 + 0.0714425 tot w w W m (4.4.)
where terQ is gasifier thermal capacity, kW; sinLHV is syngas calorific value, MJ/m3; tot is total
efficiency, %; primw is share of primary air, %; fW is fuel moisture, %; and fm is fuel consumption,
kg/h.
The thermal capacity of the gasifier as well as the total efficiency of the process depends on three parameters: the proportion of fuel moisture, fuel consumption and primary air flow. In order to increase the thermal capacity, it is necessary to increase fuel consumption (Fig. 4.10.). The decrease in the moisture of the injected fuel contributes to the growth of thermal capacity. During the experimental research, the nominal thermal capacity of the gasifier (400 kW) was achieved at fuel consumption of 144–153 kg/h and fuel moisture content of 10.9–12.8 %.
Fig. 4.10. Gasifier thermal capacity, syngas calorific value and gasification process efficiency depending on fuel moisture, fuel consumption and share of primary air.

33
The total efficiency of the gasification process depends on the fuel moisture, the proportion of primary air and fuel consumption. The results of the data analysis show that the maximum efficiency of the gasification process can be ensured with primary air content between 91 % and 94 %, by reducing the amount of moisture of injected fuel into the gasifier, and by increasing fuel consumption to ensure the nominal thermal capacity of gasifier.
The calorific value of syngas depends on the fuel moisture and distribution of air supply into primary and secondary air. There was no statistically significant correlation between the calorific value of syngas and fuel consumption. Fuel moisture content reduction can increase the calorific value of syngas. The primary air proportion was required to be between 91 % and 94 % to acquire syngas with the highest calorific value. In the experimental study, syngas highest calorific value 5.5 MJ/m3 was obtained using fuel with 12.8 % moisture content and with 92.5 % of primary air supply.
The correlation coefficients for all equations are high ranging from 89.90 % to 97.92 %. The mean absolute errors are relatively low (Table 4.1). Regression model can be used to describe the performance of a gasification process and to control operational settings. In addition, regression model can be also used when designing new gasification stations.
Table 4.1
Data Analysis of Regression Models
Regression model Dependent variable R2, % Adjusted, R2,
% Standard error
of estimate
I Thermal capacity 98.04 97.92 8.27
II Heat of combustion of
syngas 95.44 95.24 0.06
III Total efficiency of gasification process
90.49 89.90 1.18
4.5. Gasification possibilities of non-wood material
In Latvia, there is a sufficient amount of non-wood biomass resources suitable for the energy sector. Cereal is cultivated widely in Latvia, and straw is a by-product. The total yield of grain in 2016 amounted to 2 622 thousand tons, while the straw − to 2 192 thousand tons. About 30 % of the available straw is used for litter, so about 1 600 thousand tons of straw can be used for energy production. Rapeseed is another farmed resource. The amount of rapeseed has increased from 120.6 thousand tons to 281.3 thousand tons in the period from 2006 to 2016 [36]. Rapeseed is mainly a raw material for oil production and has a relatively high calorific value. Spoiled rapeseed or derived rapeseed by-products can be used to generate energy. Another still poorly used and evaluated bioresource in Latvia is reed. Calorific value of reed is about 16 MJ/kg. Significant amount of breweries are actively operating in Latvia, by-product is brewer’s grain or draff having the calorific value of around 20 MJ /kg. Two largest beer producers, Ltd. "Aldaris" and Ltd. "Cesu Alus" produce approximately 20 thousand tons of draff per year [37], [38].
One of the advantages of the gasification process is that it allows using various raw materials. Consequently, straw, reed and draff grain – all of which are widely available in Latvia − are suitable as raw material for syngas production. Using the developed mathematical model

34
gasification process modeling with different types of non-wood material using the known biomass parameters was performed [39]:
straw CH1.53O0.81N0.01;
reed CH1.56O0.83N0.01;
draff grain CH1.87O0.69N0.08.
For comparison, the data from wood chips gasification experimental study was used. Chemical composition of wood chips can be characterized by the chemical formula CH1.47O0.66. In order to assess the impact of fuel consumption on the gasification process, the values of the other factors were the same in all four scenarios – the equivalence ratio was 0.25 and the fuel moisture was 10 %.
The chemical composition of wood is distinguished by considerably higher carbon content compared to the selected non-wood materials. Syngas from wood has a significantly higher CO content − 22.5 % (Fig. 4.11.). In comparison, the CO content from draff grain is only 19.5 %. However, syngas from draff grain has the highest amount of H2 – 21.8 %, due to higher hydrogen content in the draff grain composition of 7.26 %. For comparison, the proportion of hydrogen in wood materials is only 6.15 %. The amount of CH4 is considerably higher in syngas from wood and brewer’s grain.
Fig. 4.11. CO, H2 and CH4 weight in syngas (left) and syngas calorific value and total efficiency of gasification process (right) depending on the used biomass.
The higher amount of CO in syngas from wood is the decisive reason for the highest calorific value – 5.3 MJ/m3. A slightly lower calorific value has syngas from draff grain – 5.1 MJ/m3. Calorific values of syngas from straw and reed reaches only 4.8 MJ/m3. Similarly, the highest efficiency of total gasification process has wood and draff grain gasification – 71.3 % and 70.4 %.
The results of gasification process modeling using different fuels show that all three non-wood materials can be used in the gasification process. Although the efficiency of the total gasification process is lower as compared to wood gasification, efficiency ratios remain quite high. Also, the calorific values of syngas in all cases are close to 5 MJ/m3. Such syngas can be used in the production of heat and electricity. It should be noted that H2 concentration in syngas obtained from draff grain is even higher than that of syngas obtained from wood and reaches 21.8 %. Consequently, such syngas is suitable for the production of various hydrogen-containing products.
22.5
21.0 20.7
19.519.8
18.5 18.6
21.8
0.92
0.50 0.48
0.77
0.0
0.2
0.4
0.6
0.8
1.0
1.2
1.4
1.6
15
16
17
18
19
20
21
22
23
wood straw common reed draff
CH4, vol% (dry)CO and H2, vol% (dry)
CO H2 CH4H2 CH4
5.3
4.8 4.8
5.1
71.3
67.5 67.3
70.4
65
66
67
68
69
70
71
72
4.5
4.6
4.7
4.8
4.9
5.0
5.1
5.2
5.3
5.4
wood straw common reed draff
Total efficiency, %Syngas calorific value, MJ/m3
Calorific value Efficiency

35
CONCLUSIONS
1. An innovative technology for obtaining syngas from the gasification of wood was studied using two approaches – mathematical modeling and experimental research of the process.
2. The developed thermodynamic model of the gasification process was used to study the influence of air equivalence ratio and fuel moisture on the gasification process. The results indicate that wood chip moisture content increase from 10 % to 30 % reduces syngas calorific value by 2.2 MJ/Nm3 and the gasification process efficiency decreases by 33.8 % on average. The optimum equivalence ratio lies within the range of 0.25 to 0.30 ER, contributing to high calorific value of the obtained syngas reaching 5.30 MJ/Nm3, total process efficiency of 62.6 % and a relatively low tar yield – 2.2 % of the total amount of products.
3. Wood chip drying using the recovered physical heat of syngas from cooling process was performed to reach higher syngas quality and gasification efficiency of the experimental system. A downdraft type gasifier with high temperature of syngas at the exit of the gasifier provided the heat necessary to dry the fuel. Gasification process yielding high quality syngas depends on all the elements that facilitate it – gasification plant, fuel storage, drying and supply module, cooling module of syngas with syngas / air and syngas / water heat exchangers, a cleaning system of syngas, utilization system, as well as gasification monitoring and control systems.
4. Based on the performed experimental research, the influence of air preheating and fuel moisture on the gas station was determined. The results show that by heating the supplied air from the gasifier at 16 °C to 360 °C, it is possible to increase the temperature in the oxidation zone from 522 °C to 611 °C. It contributes to the produced gas calorific value growth from 4.8 MJ/Nm3 to 5.1 MJ/Nm3 and the total gasification process efficiency from 62.3 % to 63.7 %.
5. Via cooling, the recovered physical heat from syngas is used for drying wood chips efficiently. Fuel moisture reduction from 21.1 % to 12.0 % increases CO concentration from 13.6 % to 21.3 % and H2 concentration increases from 18.5 % to 19.1 %. This contributes to an increase of syngas calorific value by 0.8 MJ/Nm3 from 4.3 MJ/Nm3 to 5.1 MJ/Nm3 and an 11.8 % increase in the total efficiency from 51.8 % to 63.7 %.
6. Validation of the mathematical model was performed using the data obtained from the experimental research. The comparison of data shows that the average differences between experimental and model results are as follows: 2.2 % for CO values, 2.3 % for H2 values, 5.1 % for CH4 values, 3.1 % for gas temperature values, 0.8 % for syngas calorific value, and 5.2 % for values of total process efficiency. Validation results are within ±7 % range indicating that the developed mathematical model of the gasification process is suitable for simulation and optimization of other similar gasification systems.
7. Within the framework of the research optimization of the experimental gasification was system was performed, which focused on air supply division into the primary and secondary air. The predominant amounts of air were injected as the primary air in the oxidation zone, and the rest as the secondary air in the pyrolysis zone. Three gasification scenarios were experimentally researched: without secondary air; with secondary air at 7.5 %; and secondary air at 15.0 %. The measurements show that higher gasification

36
parameters can be achieved with secondary air at 7.5 %, resulting in syngas calorific value 5.8 MJ/Nm3 and total process efficiency 69.6 %. The main reason for this is the temperature increase in pyrolysis and oxidation zones facilitating more active transformation and decomposition of the tar and char.
8. The experimental data analysis yielded several regression equations. Equations describe the thermal capacity of the gasifier, the syngas calorific value and the total gasification process efficiency depending on the values of variable factors. These equations can be used to improve the operation of existing gasification stations and also to design and adjust new gasification plants.
9. The technology of syngas production from the wood chips gasification process is innovative, sustainable, and economically and environmentally reasonable. Application of this technology could increase Latvia’s energy security and independence by increasing the use of local renewable energy resources and reducing the need for imported fossil fuels.
10. The developed mathematical model of gasification process can be used to analyse the potential of the syngas from other biomass resources. The results of modeling the gasification process with straw, reed and draff grain indicate that all three non-wood materials can be used for syngas production. Quality syngas with calorific value 5.1 MJ/Nm3 and H2 concentration 21.8 % can be obtained from draff grain gasification.

37
REFERENCES
1. Eiropas Parlamenta un Padomes Direktīva 2009/28/EK par atjaunojamo energoresursu izmantošanas veicināšanu un ar ko groza un sekojoši atceļ Direktīvas 2001/77/EK un 2003/30/EK. Eiropas Savienības Oficiālais Vēstnesis, 2009, 1–47.
2. Latvijas energobilance 2016. gadā. Centrālā statistikas pārvalde, 2017, 1–8.
3. Latvijas meža zeme un koksnes krāja. Centrālās statistikas pārvaldes datubāze.
4. Energoresursu vidējās cenas gala patērētājiem. Centrālas statistikas pārvaldes datubāze.
5. Börjesson, M., Ahlgren, E. Biomass gasification in cost-optimized district heating systems – a regional modelling analysis. Energy Policy. 2010, 38: 168–180.
6. Buragohain, B., Mahanta, P., Moholkar, V. Biomass gasification for decentralized power generation: The Indian perspective. Renewable and Sustainable Energy Reviews. 2010, 14: 73–92.
7. Difs, K., Wetterlund, E., Trygg, L., Söderström, M. Biomass gasification opportunities in a district heating system. Biomass and Bioenergy 2010, 34: 637–651.
8. Blumberga, D., Veidenbergs, I., Romagnoli, F., Rochas, C., Žandeckis, A. Bioenerģijas tehnoloģijas, RTU Vides aizsardzības un siltuma sistēmu instituts, Rīga, 2011.
9. Dornburg, V., Faaij, A. Efficiency and economy of wood-fired biomass energy systems in relation to scale regarding heat and power generation using combustion and gasification technologies. Biomass and Bioenergy. 2001, 21: 91–108.
10. Rafati, M., Wang, L., Dayton, D., Schimmel, K., Kabadi, V., Shahbazi, A. Techno–economic analysis of production of Fischer-Tropsch liquids via biomass gasification: The effects of Fischer-Tropsch catalysts and natural gas co-feeding. Energy Conversion and Management. 2017, 133: 153–166.
11. Ghassemi, H., Shahsavan-Markadeh, R. Effects of various operational parameters on biomass gasification process; a modified equilibrium model. Energy Conversion and Management. 2014, 79: 18–24.
12. Karamarkovic, R., Karamarkovic, V. Energy and exergy analysis of biomass gasification at different temperatures. Energy. 2010, 35: 537–549.
13. Basu, P. Biomass gasification and pyrolysis. Practical design. Burlington, USA, 2010.
14. Guo, F., Dong, Y., Dong, L., Guo, C. Effect of design and operating parameters on the gasification process of biomass in a downdraft fixed bed: An experimental study. International Journal of Hydrogen Energy. 2014, 39: 5625–5633.
15. Gai, C., Dong, Y. Experimental study on non-woody biomass gasification in a downdraft gasifier. International Journal of Hydrogen Energy. 2012, 37:4935–4944.
16. Itai, Y., Santos, R., Branquinho, M., Malico, I., Ghesti, G., Brasil, A. Numerical and experimental assessment of a downdraft gasifier for electric power in Amazon using açaí seed (Euterpe oleracea Mart.) as a fuel. Renewable Enegy. 2014, 66: 662–669.
38
17. Zainal, Z., Ali, R., Lean, C., Seetharamu, K. Prediction of performance of a downdraft gasifier using equilibrium modeling for different biomass materials. Energy Conversion and Management. 2001, 42: 1499–1515.
18. Mohammed, M. A. A., Salmiaton, A., Wan Azlina, W. A. K. G., Mohammad Amran, M. S., Fakhru'l-Razi, A. Air gasification of empty fruit bunch for hydrogen-rich gas production in a fluidized-bed reactor. Energy Conversion and Management. 2011, 52: 1555–1561.
19. Ptasinski, K. J., Prins, M. J., Pierik A. Exergetic evaluation of biomass gasification. Energy. 2007, 32: 568–574.
20. Ryu, C., Yang, Y., Khor, A., Yates, N., Sharifi, V., Swithenbank, J. Effect of fuel properties on biomass combustion: Part I. Experiments-fuel type, equivalence ratio and particle size. Fuel. 2006, 85: 1039–1046.
21. Li, X. T., Grace, J. R., Lim, C. J., Watkinson, A. P., Chen, H. P., Kim, J. R. Biomass and Bioenergy. 2004, 26: 171–193.
22. Corella, J., Sanz, A. Modeling circulating fluidized bed biomass gasifiers. A pseudo-rigorous model for stationary state. Fuel Processing Technology. 2005, 86: 1021–1053.
23. Erkiaga, A., Lopez, G., Amutio, M., Bilbao, J., Olazar, M. Syngas from steam gasification of polyethylene in a conical spouted bed reactor. Fuel. 2013, 109: 461–469.
24. Luo, S., Zhou, Y., Yi, C. Hydrogen–rich gas production from biomass catalytic gasification using hot blast furnace slag as heat carrier and catalyst in moving–bed reactor. International Journal o f Hydrogen Energy. 2012, 27: 15081–15085.
25. Guo, F., Dong, Y., Dong, L., Jing, Y. An innovative example of herb residues recycling by gasification in a fluidized bed. Waste Management. 2013, 33: 825–832.
26. Corella, J., Toledo, J., Molina, G. Calculation of the conditions to get less than 2 g tar/Nm3 in a fluidized bed biomass gasifier. Fuel Processing Technology. 2006, 87: 841–846.
27. Barman, N., Ghosh, S., De, S. Gasification of biomass in a fixed bed downdraft gasifier – a realistic model including tar. Bioresource Technology. 2012, 107: 505–511.
28. Dogru, M., Howarth, C., Akay, G., Keskinler, B., Malik, A. Gasification of hazelnut shells in a downdraft gasifier. Energy. 2002, 27: 415–427.
29. Sarket, S., Nielsen, H. Assessing the gasification potential of five woodchips species by employing a lab-scale fixed-bed downdraft reactor. Energy Conversion and Management. 2015, 103: 801–813.
30. Sheth, P., Babu, B. Production of hydrogen energy through biomass (waste wood) gasification. International Journal of Hydrogen Energy. 2010, 35: 10803–10810.
31. Striūgas, N., Zakarauskas, K., Džiugys, A., Navakas, R., Paulauskas, R. An evaluation of performance of automatically operated multi-fuel downdraft gasifier for energy production. Applied Thermal Engineering. 2014, 73: 1151–1159.
32. Dogru, M., Midilli, A., Howarth, C. Gasification of sewage sludge using a throated downdraft gasifier and uncertainty analysis. Fuel Processing Technology. 2002, 75: 55–82.

39
33. Lv, P., Yuan, Z., Ma, L., Wu, C., Chen, Y., Zhu, J. Hydrogen-rich gas production from biomass air and oxygen / steam gasification in a downdraft gasifier. Renewable Energy. 2007, 32: 2173–2185.
34. Atnaw, S., Kueh, S., Sulaiman, S. Study on Tar Generated from Downdraft Gasification of Oil Palm Fronds. The Scientific World Journal. 2014, 2014: 1–8.
35. Kirsanovs, V., Žandeckis, A., Rochas, C. Biomass Gasification Thermodynamic Model Including Tar and Char. Agronomy Research. 2016, 14(4): 1321–1331.
36. Lauksaimniecības kultūru sējumu platība, kopraža un vidējā ražība. Centrālas statistikas pārvaldes datubāze.
37. B kategorijas piesārņojošās darbības atļauja Nr. VA14IB0008, Valsts Vides Dienests, 2014.
38. B kategorijas piesārņojošās darbības atļauja Nr. RI11IB0019, Valsts Vides Dienests 2011.
39. Žandeckis, A., Romagnoli, F., Beloborodko, A., Kirsanovs, V., Blumberga, D., Mehind, A., Hovi, M. Briquettes from mixtures of herbaceous biomass and wood: biofuel investigation and combustion tests. Chemical engineering transactions. 2014, 42: 67–72.