Wood as an Engineering Material - 2
144
7–1 Chapter 7 Fastenings Lawrence A. Soltis Contents Nails 7–2 Withdrawal Resistance 7–2 Lateral Resistance 7–5 Spikes 7–8 Staples 7–8 Drift Bolts 7–9 Wood Screws 7–9 Withdrawal Resistance 7–9 Lateral Resistance 7–10 Lag Screws 7–11 Withdrawal Resistance 7–11 Lateral Resistance 7–12 Bolts 7–14 Bearing Stress of Wood Under Bolts 7–14 Loads at an Angle to the Grain 7–14 Steel Side Plates 7–15 Bolt Quality 7–15 Effect of Member Thickness 7–15 Two-Member, Multiple-Member Joints 7–15 Spacing, Edge, and End Distance 7–16 Effect of Bolt Holes 7–16 Pre-1991 Allowable Loads 7–17 Post-1991 Yield Model 7–18 Connector Joints 7–18 Parallel-to-Grain Loading 7–18 Perpendicular-to-Grain Loading 7–18 Design Loads 7–20 Modifications 7–21 Net Section 7–23 End Distance and Spacing 7–23 Placement of Multiple Connectors 7–23 Cross Bolts 7–24 Multiple-Fastener Joints 7–24 Metal Plate Connectors 7–25 Fastener Head Embedment 7–26 References 7–27 he strength and stability of any structure depend heavily on the fastenings that hold its parts together. One prime advantage of wood as a structural material is the ease with which wood structural parts can be joined together with a wide variety of fasten- ings—nails, spikes, screws, bolts, lag screws, drift pins, staples, and metal connectors of various types. For utmost rigidity, strength, and service, each type of fastening requires joint designs adapted to the strength properties of wood along and across the grain and to dimensional changes that may occur with changes in moisture content. Maximum lateral resistance and safe design load values for small-diameter (nails, spikes, and wood screws) and large- diameter dowel-type fasteners (bolts, lag screws, and drift pins) were based on an empirical method prior to 1991. Research conducted during the 1980s resulted in lateral resistance values that are currently based on a yield model theory. This theoretical method was adapted for the 1991 edition of the National Design Specification for Wood Construction (NDS). Because literature and design proce- dures exist that are related to both the empirical and theoreti- cal methods, we refer to the empirical method as pre-1991 and the theoretical method as post-1991 throughout this chapter. Withdrawal resistance methods have not changed, so the pre- and post-1991 refer only to lateral resistance. The information in this chapter represents primarily Forest Products Laboratory research results. A more comprehensive discussion of fastenings is given in the American Society of Civil Engineers Manuals and Reports on Engineering Practice No. 84, Mechanical Connections in Wood Struc- tures. The research results of this chapter are often modified for structural safety, based on judgment or experience, and thus information presented in design documents may differ from information presented in this chapter. Additionally, research by others serves as a basis for some current design criteria. Allowable stress design criteria are presented in the National Design Specification for Wood Construction pub- lished by the American Forest and Paper Association; limit states design criteria are presented in the Standard for Load and Resistance Factor Design (LRFD) for Engineered Wood Construction published by the American Society of Civil Engineers.
-
Upload
pubudu-malinda-ranawaka -
Category
Documents
-
view
176 -
download
1
Transcript of Wood as an Engineering Material - 2
7–1
Chapter 7FasteningsLawrence A . Soltis
ContentsNails 7–2
Withdrawal Resistance 7–2Lateral Resistance 7–5
Spikes 7–8Staples 7–8Drift Bolts 7–9Wood Screws 7–9
Withdrawal Resistance 7–9Lateral Resistance 7–10
Lag Screws 7–11Withdrawal Resistance 7–11Lateral Resistance 7–12
Bolts 7–14Bearing Stress of Wood Under Bolts 7–14Loads at an Angle to the Grain 7–14Steel Side Plates 7–15Bolt Quality 7–15Effect of Member Thickness 7–15Two-Member, Multiple-Member Joints 7–15Spacing, Edge, and End Distance 7–16Effect of Bolt Holes 7–16Pre-1991 Allowable Loads 7–17Post-1991 Yield Model 7–18
Connector Joints 7–18Parallel-to-Grain Loading 7–18Perpendicular-to-Grain Loading 7–18Design Loads 7–20Modifications 7–21Net Section 7–23End Distance and Spacing 7–23Placement of Multiple Connectors 7–23Cross Bolts 7–24
Multiple-Fastener Joints 7–24Metal Plate Connectors 7–25Fastener Head Embedment 7–26References 7–27
he strength and stability of any structure dependheavily on the fastenings that hold its partstogether. One prime advantage of wood as a
structural material is the ease with which wood structuralparts can be joined together with a wide variety of fasten-ings—nails, spikes, screws, bolts, lag screws, drift pins,staples, and metal connectors of various types. For utmostrigidity, strength, and service, each type of fastening requiresjoint designs adapted to the strength properties of woodalong and across the grain and to dimensional changes thatmay occur with changes in moisture content.
Maximum lateral resistance and safe design load values forsmall-diameter (nails, spikes, and wood screws) and large-diameter dowel-type fasteners (bolts, lag screws, and driftpins) were based on an empirical method prior to 1991.Research conducted during the 1980s resulted in lateralresistance values that are currently based on a yield modeltheory. This theoretical method was adapted for the 1991edition of the National Design Specification for WoodConstruction (NDS). Because literature and design proce-dures exist that are related to both the empirical and theoreti-cal methods, we refer to the empirical method as pre-1991and the theoretical method as post-1991 throughout thischapter. Withdrawal resistance methods have not changed,so the pre- and post-1991 refer only to lateral resistance.
The information in this chapter represents primarily ForestProducts Laboratory research results. A more comprehensivediscussion of fastenings is given in the American Society ofCivil Engineers Manuals and Reports on EngineeringPractice No. 84, Mechanical Connections in Wood Struc-tures. The research results of this chapter are often modifiedfor structural safety, based on judgment or experience, andthus information presented in design documents may differfrom information presented in this chapter. Additionally,research by others serves as a basis for some current designcriteria. Allowable stress design criteria are presented in theNational Design Specification for Wood Construction pub-lished by the American Forest and Paper Association; limitstates design criteria are presented in the Standard for Loadand Resistance Factor Design (LRFD) for Engineered WoodConstruction published by the American Society ofCivil Engineers.
7–2
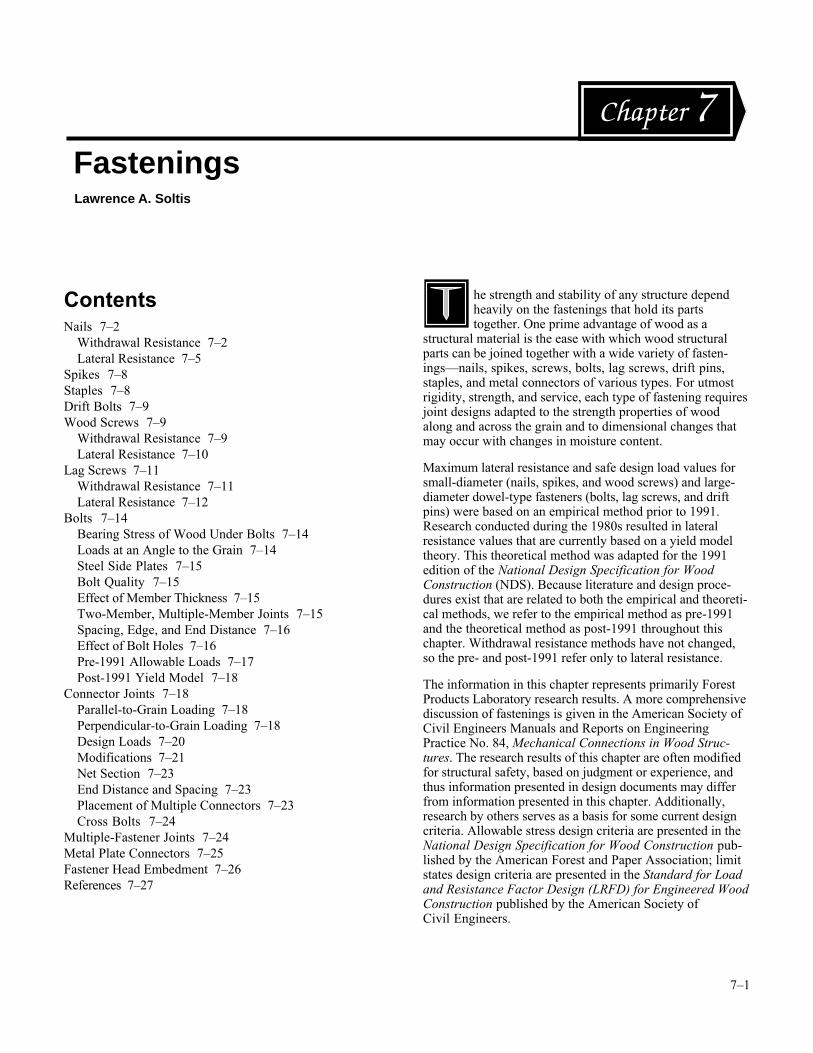
NailsNails are the most common mechanical fastenings used inwood construction. There are many types, sizes, and forms ofnails (Fig. 7–1). The load equations presented in this chapterapply for bright, smooth, common steel wire nails driveninto wood when there is no visible splitting. For nails otherthan common wire nails, the loads can be adjusted by factorsgiven later in the chapter.
Nails in use resist withdrawal loads, lateral loads, or a com-bination of the two. Both withdrawal and lateral resistanceare affected by the wood, the nail, and the condition of use.In general, however, any variation in these factors has a morepronounced effect on withdrawal resistance than on lateralresistance. The serviceability of joints with nails laterallyloaded does not depend greatly on withdrawal resistanceunless large joint distortion is tolerable.
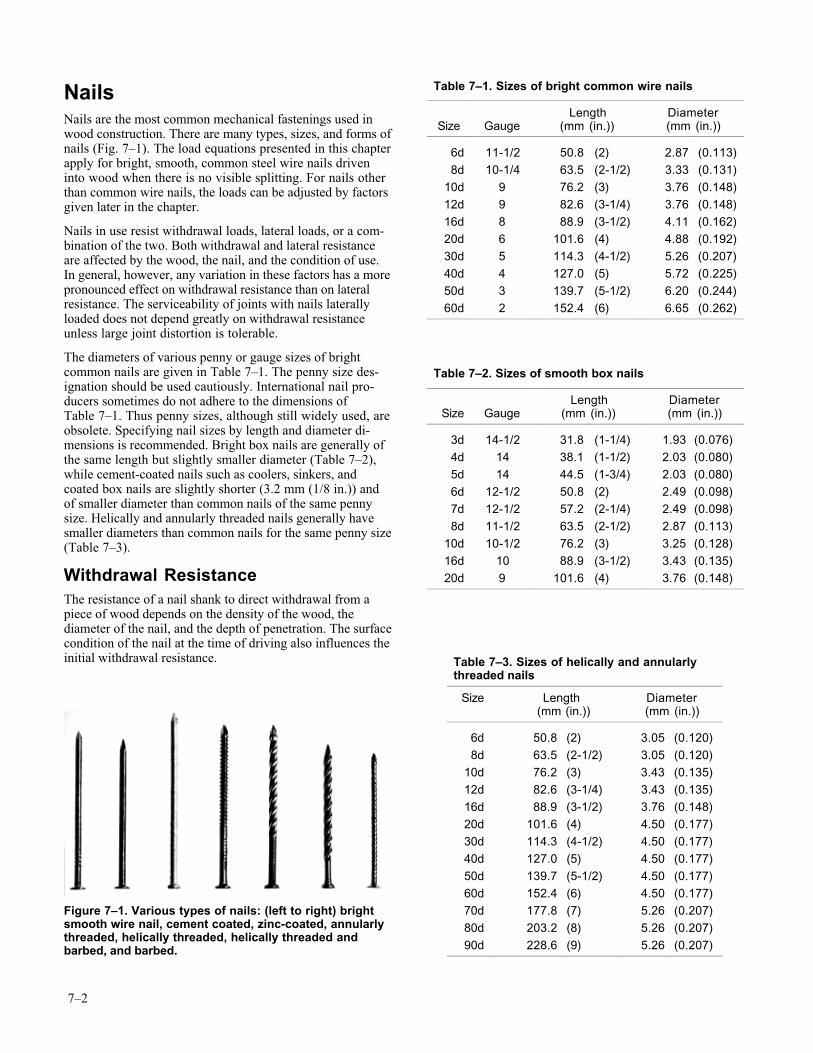
The diameters of various penny or gauge sizes of brightcommon nails are given in Table 7–1. The penny size des-ignation should be used cautiously. International nail pro-ducers sometimes do not adhere to the dimensions ofTable 7–1. Thus penny sizes, although still widely used, areobsolete. Specifying nail sizes by length and diameter di-mensions is recommended. Bright box nails are generally ofthe same length but slightly smaller diameter (Table 7–2),while cement-coated nails such as coolers, sinkers, andcoated box nails are slightly shorter (3.2 mm (1/8 in.)) andof smaller diameter than common nails of the same pennysize. Helically and annularly threaded nails generally havesmaller diameters than common nails for the same penny size(Table 7–3).
Withdrawal ResistanceThe resistance of a nail shank to direct withdrawal from apiece of wood depends on the density of the wood, thediameter of the nail, and the depth of penetration. The surfacecondition of the nail at the time of driving also influences theinitial withdrawal resistance.
Figure 7–1. Various types of nails: (left to right) brightsmooth wire nail, cement coated, zinc-coated, annularlythreaded, helically threaded, helically threaded andbarbed, and barbed.
Table 7–1. Sizes of bright common wire nails
Size GaugeLength
(mm (in.))Diameter(mm (in.))
6d 11-1/2 50.8 (2) 2.87 (0.113)
8d 10-1/4 63.5 (2-1/2) 3.33 (0.131)
10d 9 76.2 (3) 3.76 (0.148)
12d 9 82.6 (3-1/4) 3.76 (0.148)
16d 8 88.9 (3-1/2) 4.11 (0.162)
20d 6 101.6 (4) 4.88 (0.192)
30d 5 114.3 (4-1/2) 5.26 (0.207)
40d 4 127.0 (5) 5.72 (0.225)
50d 3 139.7 (5-1/2) 6.20 (0.244)
60d 2 152.4 (6) 6.65 (0.262)
Table 7–2. Sizes of smooth box nails
Size GaugeLength
(mm (in.))Diameter(mm (in.))
3d 14-1/2 31.8 (1-1/4) 1.93 (0.076)
4d 14 38.1 (1-1/2) 2.03 (0.080)
5d 14 44.5 (1-3/4) 2.03 (0.080)
6d 12-1/2 50.8 (2) 2.49 (0.098)
7d 12-1/2 57.2 (2-1/4) 2.49 (0.098)
8d 11-1/2 63.5 (2-1/2) 2.87 (0.113)
10d 10-1/2 76.2 (3) 3.25 (0.128)
16d 10 88.9 (3-1/2) 3.43 (0.135)
20d 9 101.6 (4) 3.76 (0.148)
Table 7–3. Sizes of helically and annularlythreaded nails
Size Length (mm (in.))
Diameter(mm (in.))
6d 50.8 (2) 3.05 (0.120)
8d 63.5 (2-1/2) 3.05 (0.120)
10d 76.2 (3) 3.43 (0.135)
12d 82.6 (3-1/4) 3.43 (0.135)
16d 88.9 (3-1/2) 3.76 (0.148)
20d 101.6 (4) 4.50 (0.177)
30d 114.3 (4-1/2) 4.50 (0.177)
40d 127.0 (5) 4.50 (0.177)
50d 139.7 (5-1/2) 4.50 (0.177)
60d 152.4 (6) 4.50 (0.177)
70d 177.8 (7) 5.26 (0.207)
80d 203.2 (8) 5.26 (0.207)
90d 228.6 (9) 5.26 (0.207)
7–3
For bright common wire nails driven into the side grain ofseasoned wood or unseasoned wood that remains wet, theresults of many tests have shown that the maximum with-drawal load is given by the empirical equation
p G DL= 54 12 5 2. / (metric) (7–1a)
p G DL= 7 850 5 2, / (inch–pound) (7–1b)
where p is maximum load (N, lb), L depth (mm, in.) ofpenetration of the nail in the member holding the nail point,G specific gravity of the wood based on ovendry weight andvolume at 12% moisture content (see Ch. 4, Tables 4–2 to4–5), and D diameter of the nail (mm, in.). (The NDS andLRFD use ovendry weight and volume as a basis.)
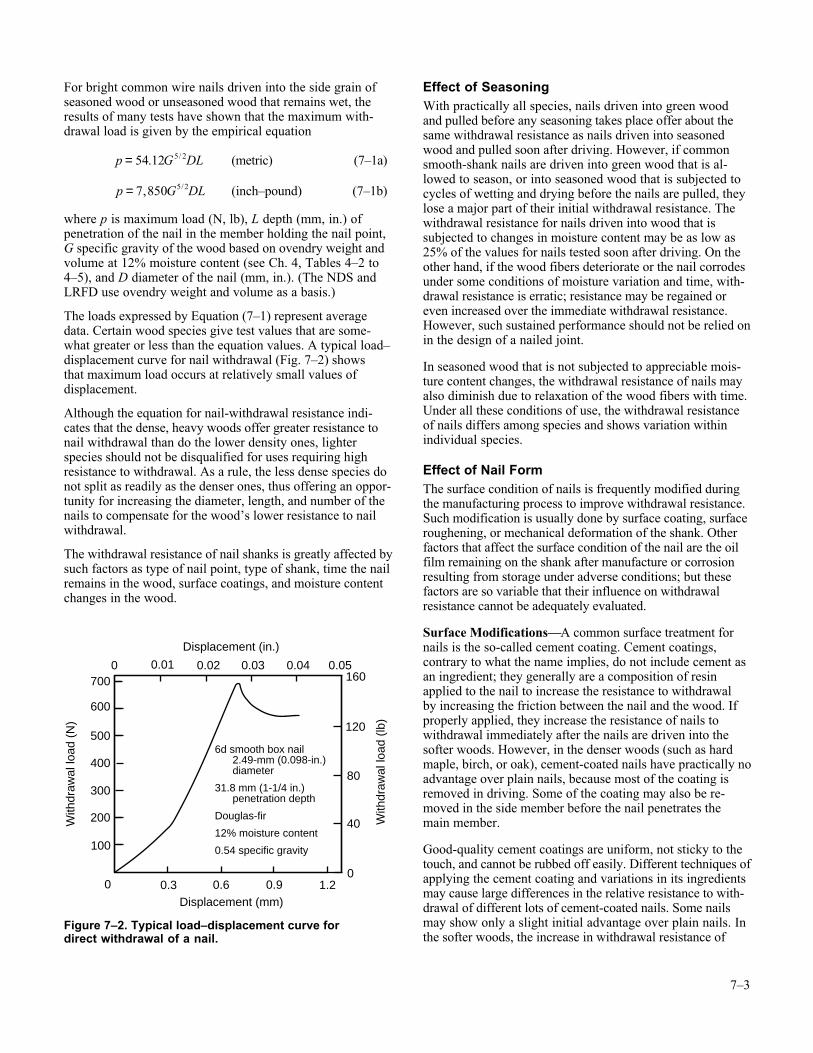
The loads expressed by Equation (7–1) represent averagedata. Certain wood species give test values that are some-what greater or less than the equation values. A typical load–displacement curve for nail withdrawal (Fig. 7–2) showsthat maximum load occurs at relatively small values ofdisplacement.
Although the equation for nail-withdrawal resistance indi-cates that the dense, heavy woods offer greater resistance tonail withdrawal than do the lower density ones, lighterspecies should not be disqualified for uses requiring highresistance to withdrawal. As a rule, the less dense species donot split as readily as the denser ones, thus offering an oppor-tunity for increasing the diameter, length, and number of thenails to compensate for the wood’s lower resistance to nailwithdrawal.
The withdrawal resistance of nail shanks is greatly affected bysuch factors as type of nail point, type of shank, time the nailremains in the wood, surface coatings, and moisture contentchanges in the wood.
Effect of SeasoningWith practically all species, nails driven into green woodand pulled before any seasoning takes place offer about thesame withdrawal resistance as nails driven into seasonedwood and pulled soon after driving. However, if commonsmooth-shank nails are driven into green wood that is al-lowed to season, or into seasoned wood that is subjected tocycles of wetting and drying before the nails are pulled, theylose a major part of their initial withdrawal resistance. Thewithdrawal resistance for nails driven into wood that issubjected to changes in moisture content may be as low as25% of the values for nails tested soon after driving. On theother hand, if the wood fibers deteriorate or the nail corrodesunder some conditions of moisture variation and time, with-drawal resistance is erratic; resistance may be regained oreven increased over the immediate withdrawal resistance.However, such sustained performance should not be relied onin the design of a nailed joint.
In seasoned wood that is not subjected to appreciable mois-ture content changes, the withdrawal resistance of nails mayalso diminish due to relaxation of the wood fibers with time.Under all these conditions of use, the withdrawal resistanceof nails differs among species and shows variation withinindividual species.
Effect of Nail FormThe surface condition of nails is frequently modified duringthe manufacturing process to improve withdrawal resistance.Such modification is usually done by surface coating, surfaceroughening, or mechanical deformation of the shank. Otherfactors that affect the surface condition of the nail are the oilfilm remaining on the shank after manufacture or corrosionresulting from storage under adverse conditions; but thesefactors are so variable that their influence on withdrawalresistance cannot be adequately evaluated.
Surface Modifications—A common surface treatment fornails is the so-called cement coating. Cement coatings,contrary to what the name implies, do not include cement asan ingredient; they generally are a composition of resinapplied to the nail to increase the resistance to withdrawalby increasing the friction between the nail and the wood. Ifproperly applied, they increase the resistance of nails towithdrawal immediately after the nails are driven into thesofter woods. However, in the denser woods (such as hardmaple, birch, or oak), cement-coated nails have practically noadvantage over plain nails, because most of the coating isremoved in driving. Some of the coating may also be re-moved in the side member before the nail penetrates themain member.
Good-quality cement coatings are uniform, not sticky to thetouch, and cannot be rubbed off easily. Different techniques ofapplying the cement coating and variations in its ingredientsmay cause large differences in the relative resistance to with-drawal of different lots of cement-coated nails. Some nailsmay show only a slight initial advantage over plain nails. Inthe softer woods, the increase in withdrawal resistance of
700
With
draw
al lo
ad (
lb)
With
draw
al lo
ad (
N)
6d smooth box nail 2.49-mm (0.098-in.) diameter
31.8 mm (1-1/4 in.) penetration depth
Douglas-fir
12% moisture content
0.54 specific gravity
600
500
400
300
200
100
0.3
0 0.01 0.02 0.03 0.04 0.05160
120
80
40
00.6 0.9 1.2
Displacement (mm)
Displacement (in.)
0
Figure 7–2. Typical load–displacement curve fordirect withdrawal of a nail.
7–4
cement-coated nails is not permanent but drops off signifi-cantly after a month or so. Cement-coated nails are usedprimarily in construction of boxes, crates, and othercontainers usually built for rough handling and relativelyshort service.
Nails that have galvanized coatings, such as zinc, are in-tended primarily for uses where corrosion and staining resis-tance are important factors in permanence and appearance. Ifthe zinc coating is evenly applied, withdrawal resistance maybe increased, but extreme irregularities of the coating mayactually reduce it. The advantage that uniformly coatedgalvanized nails may have over nongalvanized nails in resis-tance to initial withdrawal is usually reduced by repeatedcycles of wetting and drying.
Nails have also been made with plastic coatings. The useful-ness and characteristics of these coatings are influenced by thequality and type of coating, the effectiveness of the bondbetween the coating and base fastener, and the effectiveness ofthe bond between the coating and wood fibers. Some plasticcoatings appear to resist corrosion or improve resistance towithdrawal, while others offer little improvement.
Fasteners with properly applied nylon coating tend to retaintheir initial resistance to withdrawal compared with othercoatings, which exhibit a marked decrease in withdrawalresistance within the first month after driving.
A chemically etched nail has somewhat greater withdrawalresistance than some coated nails, as the minutely pittedsurface is an integral part of the nail shank. Under impactloading, however, the withdrawal resistance of etched nails islittle different from that of plain or cement-coated nails undervarious moisture conditions.
Sand-blasted nails perform in much the same manner aschemically etched nails.
Shape Modifications—Nail shanks may be varied from asmooth, circular form to give an increase in surface areawithout an increase in nail weight. Special nails with barbed,helically or annularly threaded, and other irregular shanks(Fig. 7–1) are commercially available.
The form and magnitude of the deformations along the shankinfluence the performance of the nails in various wood spe-cies. In wood remaining at a uniform moisture content, thewithdrawal resistance of these nails is generally somewhatgreater than that of common wire nails of the same diameter.For instance, annular-shank nails have about 40% greaterresistance to withdrawal than common nails. However, underconditions involving changes in moisture content of thewood, some special nail forms provide considerably greaterwithdrawal resistance than the common wire nail—about fourtimes greater for annularly and helically threaded nails of thesame diameter. This is especially true of nails driven intogreen wood that subsequently dries. In general, annularlythreaded nails sustain larger withdrawal loads, and helicallythreaded nails sustain greater impact withdrawal work valuesthan do the other nail forms.
Nails with deformed shanks are sometimes hardened by heattreatments for use where driving conditions are difficult or toobtain improved performance, such as in pallet assembly.Hardened nails are brittle and care should be exercised toavoid injuries from fragments of nails broken during driving.
Nail Point—A smooth, round shank nail with a long, sharppoint will usually have a greater withdrawal resistance,particularly in the softer woods, than the common wire nail(which usually has a diamond point). However, sharp pointsaccentuate splitting in certain species, which may reducewithdrawal resistance. A blunt or flat point without taperreduces splitting, but its destruction of the wood fibers whendriven reduces withdrawal resistance to less than that of thecommon wire nail. A nail tapered at the end and terminatingin a blunt point will cause less splitting. In heavier woods,such a tapered, blunt-pointed nail will provide about thesame withdrawal resistance, but in less dense woods, itsresistance to withdrawal is less than that of the common nail.
Nail Head—Nail head classifications include flat, oval,countersunk, deep-countersunk, and brad. Nails with alltypes of heads, except the deep-countersunk, brad, and someof the thin flathead nails, are sufficiently strong to withstandthe force required to pull them from most woods in directwithdrawal. The deep-countersunk and brad nails are usuallydriven below the wood surface and are not intended to carrylarge withdrawal loads. In general, the thickness and diame-ter of the heads of the common wire nails increase as the sizeof the nail increases.
The development of some pneumatically operated portablenailers has introduced nails with specially configured heads,such as T-nails and nails with a segment of the head cut off.
Corrosion and StainingIn the presence of moisture, metals used for nails may cor-rode when in contact with wood treated with certain preserva-tive or fire-retardant salts (Chs. 14 and 17). Use of certainmetals or metal alloys will reduce the amount of corrosion.Nails of copper, silicon bronze, and 304 and 316 stainlesssteel have performed well in wood treated with ammoniacalcopper arsenate and chromated copper arsenate. The choice ofmetals for use with fire-retardant-treated woods depends uponthe particular fire-retardant chemical.
Staining caused by the reaction of certain wood extractives(Ch. 3) and steel in the presence of moisture is a problem ifappearance is important, such as with naturally finishedsiding. Use of stainless steel, aluminum, or hot-dippedgalvanized nails can alleviate staining.
In general, the withdrawal resistance of copper and otheralloy nails is comparable with that of common steel wirenails when pulled soon after driving.
DrivingThe resistance of nails to withdrawal is generally greatestwhen they are driven perpendicular to the grain of the wood.When the nail is driven parallel to the wood fibers (that is,
7–5
into the end of the piece) withdrawal resistance in the softerwoods drops to 75% or even 50% of the resistance obtainedwhen the nail is driven perpendicular to the grain. The differ-ence between side- and end-grain withdrawal loads is less fordense woods than for softer woods. With most species, theratio between the end- and side-grain withdrawal loads ofnails pulled after a time interval, or after moisture contentchanges have occurred, is usually somewhat greater than thatof nails pulled immediately after driving.
Toe nailing, a common method of joining wood framework,involves slant driving a nail or group of nails through theend or edge of an attached member and into a main member.Toe nailing requires greater skill in assembly than doesordinary end nailing but provides joints of greater strengthand stability. Tests show that the maximum strength oftoenailed joints under lateral and uplift loads is obtained by(a) using the largest nail that will not cause excessive split-ting, (b) allowing an end distance (distance from the end ofthe attached member to the point of initial nail entry) ofapproximately one-third the length of the nail, (c) driving thenail at a slope of 30° with the attached member, and(d) burying the full shank of the nail but avoiding excessivemutilation of the wood from hammer blows.
The results of withdrawal tests with multiple nail joints inwhich the piece attached is pulled directly away from themain member show that slant driving is usually superior tostraight driving when nails are driven into drywood andpulled immediately, and decidedly superior when nails aredriven into green or partially dry wood that is allowed toseason for a month or more. However, the loss in depth ofpenetration due to slant driving may, in some types ofjoints, offset the advantages of slant nailing. Cross slantdriving of groups of nails through the side grain is usuallysomewhat more effective than parallel slant driving throughthe end grain.
Nails driven into lead holes with a diameter slightly smaller(approximately 90%) than the nail shank have somewhatgreater withdrawal resistance than nails driven without leadholes. Lead holes also prevent or reduce splitting of thewood, particularly for dense species.
ClinchingThe withdrawal resistance of smooth-shank, clinched nails isconsiderably greater than that of unclinched nails. The pointof a clinched nail is bent over where the nail protrudesthrough the side member. The ratio between the loads forclinched and unclinched nails varies enormously, dependingupon the moisture content of the wood when the nail isdriven and withdrawn, the species of wood, the size of nail,and the direction of clinch with respect to the grain of thewood.
In dry or green wood, a clinched nail provides 45% to 170%more withdrawal resistance than an unclinched nail whenwithdrawn soon after driving. In green wood that seasonsafter a nail is driven, a clinched nail gives 250% to 460%greater withdrawal resistance than an unclinched nail.
However, this improved strength of a clinched-nail joint doesnot justify the use of green lumber, because the joints mayloosen as the lumber seasons. Furthermore, laboratory testswere made with single nails, and the effects of drying, suchas warping, twisting, and splitting, may reduce the efficiencyof a joint that has more than one nail. Clinching of nails isgenerally confined to such construction as boxes and cratesand other container applications.
Nails clinched across the grain have approximately 20%more resistance to withdrawal than nails clinched along thegrain.
Fastening of PlywoodThe nailing characteristics of plywood are not greatly differ-ent from those of solid wood except for plywood’s greaterresistance to splitting when nails are driven near an edge.The nail withdrawal resistance of plywood is 15% to 30%less than that of solid wood of the same thickness. Thereason is that fiber distortion is less uniform in plywood thanin solid wood. For plywood less than 12.5 mm (1/2-in.)thick, the greater splitting resistance tends to offset the lowerwithdrawal resistance compared with solid wood. The with-drawal resistance per unit length of penetration decreases asthe number of plies per unit length increases. The directionof the grain of the face ply has little influence on the with-drawal resistance from the face near the end or edge of a pieceof plywood. The direction of the grain of the face ply mayinfluence the pull-through resistance of staples or nails withseverely modified heads, such as T-heads. Fastener designinformation for plywood is available from APA–TheEngineered Wood Association.
Allowable LoadsThe preceding discussion dealt with maximum withdrawalloads obtained in short-time test conditions. For design,these loads must be reduced to account for variability, dura-tion-of-load effects, and safety. A value of one-sixth the aver-age maximum load has usually been accepted as the allow-able load for long-time loading conditions. For normalduration of load, this value may be increased by 10%. Nor-mal duration of load is defined as a load of 10-year duration.
Lateral ResistancePre-1991Test loads at joint slips of 0.38 mm (0.015 in.)(approximate proportional limit load) for bright commonwire nails in lateral resistance driven into the side grain(perpendicular to the wood fibers) of seasoned wood areexpressed by the empirical equation
p KD= 3 2/ (7–2)
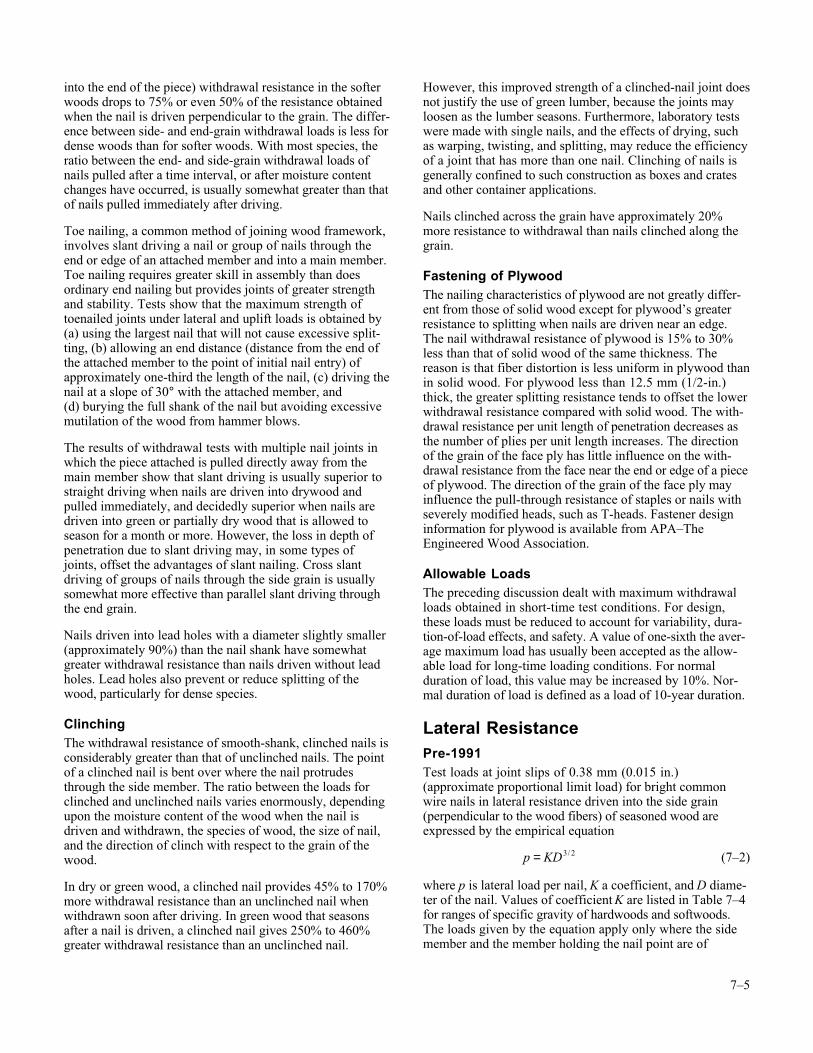
where p is lateral load per nail, K a coefficient, and D diame-ter of the nail. Values of coefficient K are listed in Table 7–4for ranges of specific gravity of hardwoods and softwoods.The loads given by the equation apply only where the sidemember and the member holding the nail point are of
7–6
approximately the same density. The thickness of the sidemember should be about one-half the depth of penetration ofthe nail in the member holding the point.
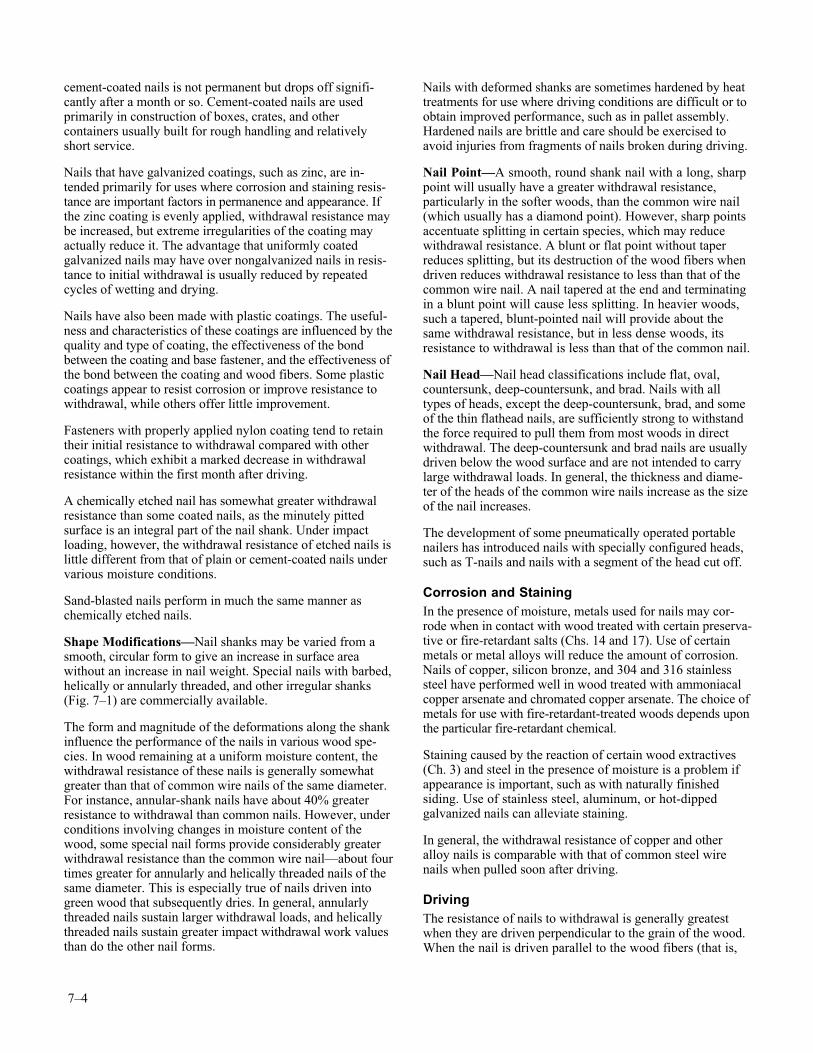
The ultimate lateral nail loads for softwoods may approach3.5 times the loads expressed by the equation, and for hard-woods they may be 7 times as great. The joint slip atmaximum load, however, is more than 20 times 0.38 mm(0.015 in.). This is demonstrated by the typical load–slipcurve shown in Figure 7–3. To maintain a sufficient ratiobetween ultimate load and the load at 0.38 mm (0.015 in.),the nail should penetrate into the member holding the pointby not less than 10 times the nail diameter for dense woods(specific gravity greater than 0.61) and 14 times the diameterfor low density woods (specific gravity less than 0.42). Forspecies having densities between these two ranges, thepenetration may be found by straight line interpolation.
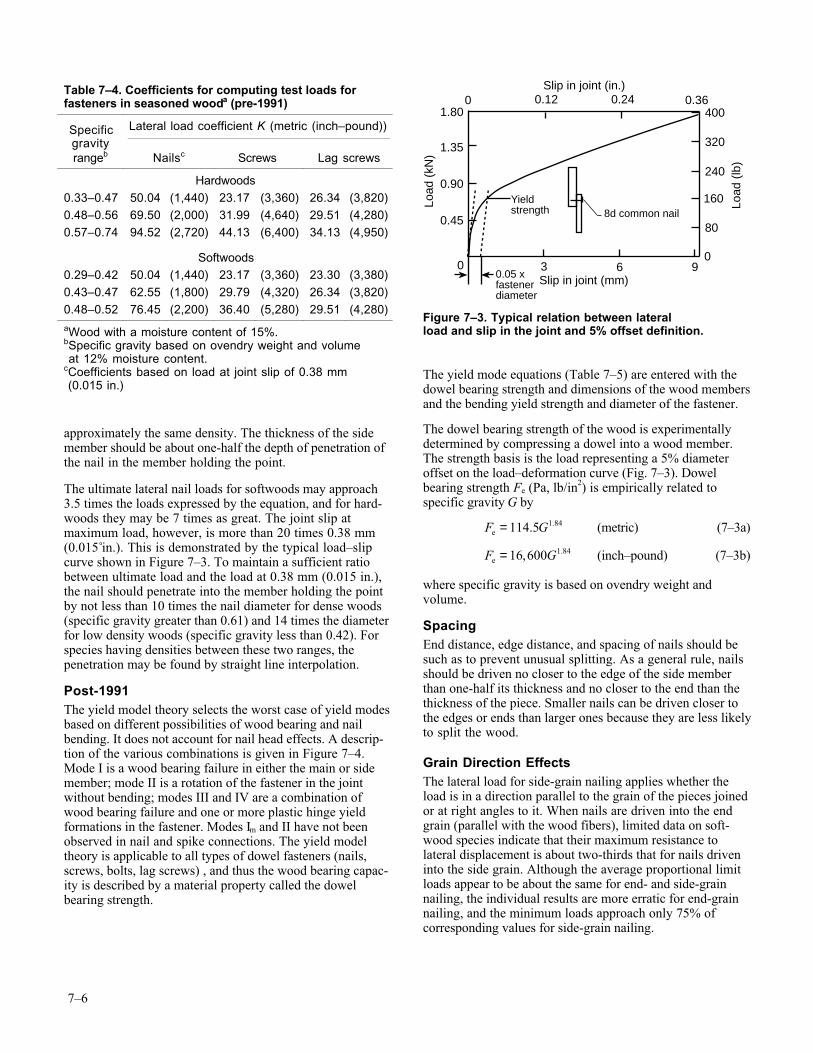
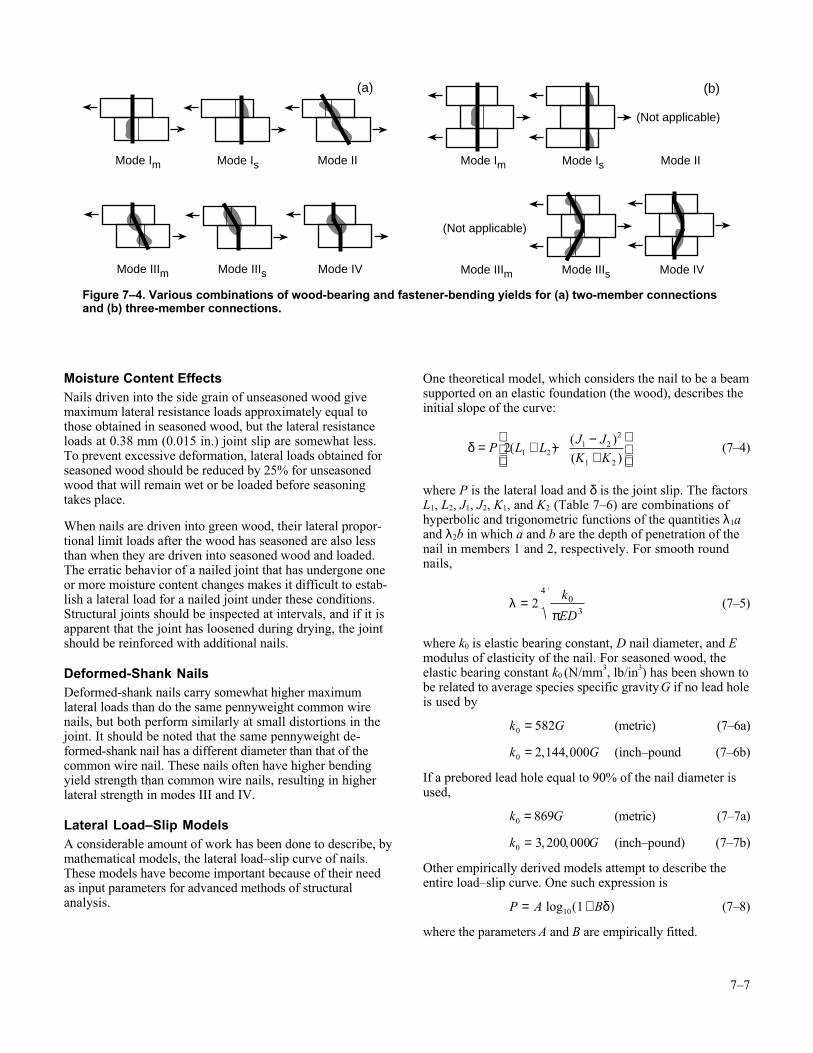
Post-1991The yield model theory selects the worst case of yield modesbased on different possibilities of wood bearing and nailbending. It does not account for nail head effects. A descrip-tion of the various combinations is given in Figure 7–4.Mode I is a wood bearing failure in either the main or sidemember; mode II is a rotation of the fastener in the jointwithout bending; modes III and IV are a combination ofwood bearing failure and one or more plastic hinge yieldformations in the fastener. Modes Im and II have not beenobserved in nail and spike connections. The yield modeltheory is applicable to all types of dowel fasteners (nails,screws, bolts, lag screws) , and thus the wood bearing capac-ity is described by a material property called the dowelbearing strength.
The yield mode equations (Table 7–5) are entered with thedowel bearing strength and dimensions of the wood membersand the bending yield strength and diameter of the fastener.
The dowel bearing strength of the wood is experimentallydetermined by compressing a dowel into a wood member.The strength basis is the load representing a 5% diameteroffset on the load–deformation curve (Fig. 7–3). Dowelbearing strength Fe (Pa, lb/in2) is empirically related tospecific gravity G by
F Ge = 114 5 1 84. . (metric) (7–3a)
F Ge = 16 600 1 84, . (inch–pound) (7–3b)
where specific gravity is based on ovendry weight andvolume.
SpacingEnd distance, edge distance, and spacing of nails should besuch as to prevent unusual splitting. As a general rule, nailsshould be driven no closer to the edge of the side memberthan one-half its thickness and no closer to the end than thethickness of the piece. Smaller nails can be driven closer tothe edges or ends than larger ones because they are less likelyto split the wood.
Grain Direction EffectsThe lateral load for side-grain nailing applies whether theload is in a direction parallel to the grain of the pieces joinedor at right angles to it. When nails are driven into the endgrain (parallel with the wood fibers), limited data on soft-wood species indicate that their maximum resistance tolateral displacement is about two-thirds that for nails driveninto the side grain. Although the average proportional limitloads appear to be about the same for end- and side-grainnailing, the individual results are more erratic for end-grainnailing, and the minimum loads approach only 75% ofcorresponding values for side-grain nailing.
Table 7–4. Coefficients for computing test loads forfasteners in seasoned wooda (pre-1991)
Specificgravity
Lateral load coefficient K (metric (inch–pound))
rangeb Nailsc Screws Lag screws
Hardwoods
0.33–0.47 50.04 (1,440) 23.17 (3,360) 26.34 (3,820)
0.48–0.56 69.50 (2,000) 31.99 (4,640) 29.51 (4,280)
0.57–0.74 94.52 (2,720) 44.13 (6,400) 34.13 (4,950)
Softwoods
0.29–0.42 50.04 (1,440) 23.17 (3,360) 23.30 (3,380)
0.43–0.47 62.55 (1,800) 29.79 (4,320) 26.34 (3,820)
0.48–0.52 76.45 (2,200) 36.40 (5,280) 29.51 (4,280)
aWood with a moisture content of 15%.bSpecific gravity based on ovendry weight and volume at 12% moisture content.cCoefficients based on load at joint slip of 0.38 mm (0.015 in.)
3 6 9
0 0.12 0.24 0.36
8d common nail
1.80
1.35
0.90
0.45
Load
(kN
)
Load
(lb
)
400
320
240
160
80
00
Slip in joint (mm)
Slip in joint (in.)
Yieldstrength
0.05 xfastenerdiameter
Figure 7–3. Typical relation between lateralload and slip in the joint and 5% offset definition.
7–7
Moisture Content EffectsNails driven into the side grain of unseasoned wood givemaximum lateral resistance loads approximately equal tothose obtained in seasoned wood, but the lateral resistanceloads at 0.38 mm (0.015 in.) joint slip are somewhat less.To prevent excessive deformation, lateral loads obtained forseasoned wood should be reduced by 25% for unseasonedwood that will remain wet or be loaded before seasoningtakes place.
When nails are driven into green wood, their lateral propor-tional limit loads after the wood has seasoned are also lessthan when they are driven into seasoned wood and loaded.The erratic behavior of a nailed joint that has undergone oneor more moisture content changes makes it difficult to estab-lish a lateral load for a nailed joint under these conditions.Structural joints should be inspected at intervals, and if it isapparent that the joint has loosened during drying, the jointshould be reinforced with additional nails.
Deformed-Shank NailsDeformed-shank nails carry somewhat higher maximumlateral loads than do the same pennyweight common wirenails, but both perform similarly at small distortions in thejoint. It should be noted that the same pennyweight de-formed-shank nail has a different diameter than that of thecommon wire nail. These nails often have higher bendingyield strength than common wire nails, resulting in higherlateral strength in modes III and IV.
Lateral Load–Slip ModelsA considerable amount of work has been done to describe, bymathematical models, the lateral load–slip curve of nails.These models have become important because of their needas input parameters for advanced methods of structuralanalysis.
One theoretical model, which considers the nail to be a beamsupported on an elastic foundation (the wood), describes theinitial slope of the curve:
δ = + − −
+
P L LJ JK K
2 1 21 2
2
1 2
( )( )( )
(7–4)
where P is the lateral load and δ is the joint slip. The factorsL1, L2, J1, J2, K1, and K2 (Table 7–6) are combinations ofhyperbolic and trigonometric functions of the quantities λ1aand λ2b in which a and b are the depth of penetration of thenail in members 1 and 2, respectively. For smooth roundnails,
λ
π= 2 0
3
4 k
ED(7–5)
where k0 is elastic bearing constant, D nail diameter, and Emodulus of elasticity of the nail. For seasoned wood, theelastic bearing constant k0 (N/mm3, lb/in3) has been shown tobe related to average species specific gravity G if no lead holeis used by
k G0 582= (metric) (7–6a)
k G0 2 144 000= , , (inch–pound (7–6b)
If a prebored lead hole equal to 90% of the nail diameter isused,
k G0 869= (metric) (7–7a)
k G0 3 200 000= , , (inch–pound) (7–7b)
Other empirically derived models attempt to describe theentire load–slip curve. One such expression is
P A B= +log10 1( )δ (7–8)
where the parameters A and B are empirically fitted.
Mode Im Mode Is Mode II
(Not applicable)
(b)
Mode Im Mode Is Mode II
(a)
Mode IIIm Mode IIIs Mode IV
(Not applicable)
Mode IIIm Mode IIIs Mode IV
Figure 7–4. Various combinations of wood-bearing and fastener-bending yields for (a) two-member connectionsand (b) three-member connections.
7–8
SpikesCommon wire spikes are manufactured in the same manneras common wire nails. They have either a chisel point or adiamond point and are made in lengths of 76 to 305 mm(3 to 12 in.). For corresponding lengths in the range of 76 to152 (3 to 6 in.), they have larger diameters (Table 7–7) thancommon wire nails, and beyond the 60d size they are usuallydesignated by diameter.
The withdrawal and lateral resistance equations and limita-tions given for common wire nails are also applicable tospikes, except that in calculating the withdrawal load forspikes, the depth of penetration is taken as the length of thespike in the member receiving the point, minus two-thirdsthe length of the point.
StaplesDifferent types of staples have been developed with variousmodifications in points, shank treatment and coatings,gauge, crown width, and length. These fasteners are availablein clips or magazines for use in pneumatically operatedportable staplers. Most factors that affect the withdrawal andlateral loads of nails similarly affect the loads on staples. Thewithdrawal resistance, for example, varies almost directlywith the circumference and depth of penetration when thetype of point and shank are similar to nails. Thus, Equation(7–1) has been used to predict the withdrawal load for oneleg of a staple, but no verification tests have been done.
The load in lateral resistance varies approximately as the 3/2power of the diameter when other factors, such as quality ofmetal, type of shank, and depth of penetration, are similar tonails. The diameter of each leg of a two-legged staple musttherefore be about two-thirds the diameter of a nail to providea comparable load. Equation (7–2) has been used to predictthe lateral resistance of staples. However, yield modeltheory equations have not yet been experimentally verifiedfor staples.
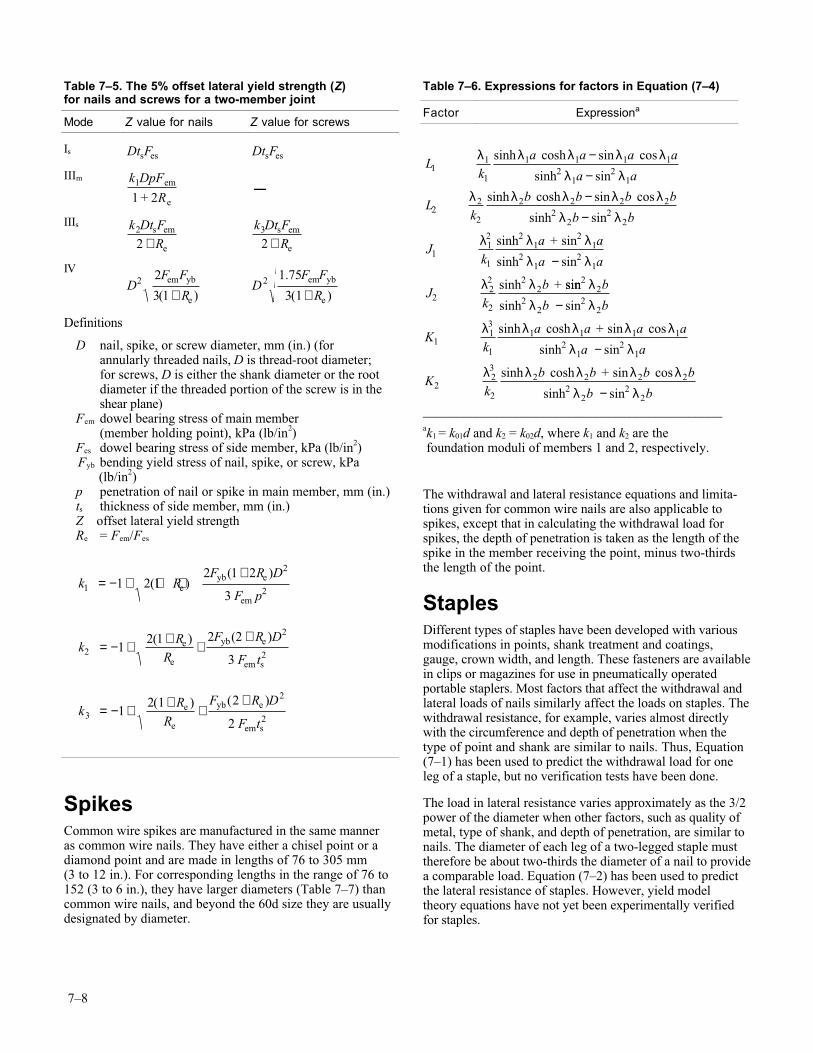
Table 7–5. The 5% offset lateral yield strength (Z)for nails and screws for a two-member joint
Mode Z value for nails Z value for screws
Is Dt Fs es Dt Fs es
IIIm
k DpF
+ R1
1 2em
e
—
IIIs
k Dt F
R2
2s em
e+
k Dt FR
3
2s em
e+
IV
D
F F
R2 2
3 1em yb
e( )+ D
F F
R2 1 75
3 1
.
( )em yb
e+
Definitions
D nail, spike, or screw diameter, mm (in.) (forannularly threaded nails, D is thread-root diameter;for screws, D is either the shank diameter or the rootdiameter if the threaded portion of the screw is in theshear plane)
Fem dowel bearing stress of main member(member holding point), kPa (lb/in2)
Fes dowel bearing stress of side member, kPa (lb/in2) Fyb bending yield stress of nail, spike, or screw, kPa (lb/in2)p penetration of nail or spike in main member, mm (in.)ts thickness of side member, mm (in.)Z offset lateral yield strengthRe = Fem/Fes
k R
F R D
F p1
2
21 2 1
2 1 2
3 ( )
( )= − + + +
+e
yb e
em
k
RR
F R D
F t2
2
21
2 1 2 2
3
( ) ( )= − + + +
+e
e
yb e
sem
kR
R
F R D
F t3
2
21
2 1 2
2
( ) ( )= − + + +
+e
e
yb e
sem
Table 7–6. Expressions for factors in Equation (7–4)
Factor Expressiona
Lk
a a a a
a a
Lk
b b b b
b b
Jk
a + a
a a
Jk
b +
11
1
1 1 1 12
12
1
22
2
2 2 2 22
22
2
112
1
21
21
21
21
222
2
22
sinh cosh sin cos
sinh sin
sinh cosh sin cos
sinh sin
sinh sin
sinh sin
sinh
λ λ λ λ λλ λ
λ λ λ λ λλ λ
λ λ λλ λ
λ λ
−−−−
−
sinsin
sinh sin
sinh cosh sin cos
sinh sin
sinh cosh sin cos
sinh sin
22
22
22
113
1
1 1 1 12
12
1
223
2
2 2 2 22
22
2
λλ λ
λ λ λ λ λλ λ
λ λ λ λ λλ λ
b
b b
Kk
a a + a a
a a
Kk
b b + b b
b b
−
−
−_____________________________________________ak1 = k01d and k2 = k02d, where k1 and k2 are the foundation moduli of members 1 and 2, respectively.
7–9
In addition to the immediate performance capability of sta-ples and nails as determined by test, factors such as corro-sion, sustained performance under service conditions, anddurability in various uses should be considered in evaluatingthe relative usefulness of a stapled connection.
Drift BoltsA drift bolt (or drift pin) is a long pin of iron or steel, withor without head or point. It is driven into a bored holethrough one timber and into an adjacent one, to prevent theseparation of the timbers connected and to transmit lateralload. The hole in the second member is drilled sufficientlydeep to prevent the pin from hitting the bottom.
The ultimate withdrawal load of a round drift bolt or pinfrom the side grain of seasoned wood is given by
p G DL= 45 51 2. (metric) (7–9a)
p G DL= 6 600 2, (inch–pound) (7–9b)
where p is the ultimate withdrawal load (N, lb), G specificgravity based on the ovendry weight and volume at 12%moisture content of the wood, D diameter of the drift bolt(mm, in.), and L length of penetration of the bolt (mm, in.).(The NDS and LRFD use ovendry weight and volume as abasis.)
This equation provides an average relationship for all spe-cies, and the withdrawal load for some species may be aboveor below the equation values. It also presumes that the boltsare driven into prebored holes having a diameter 3.2 mm(1/8 in.) less than the bolt diameter.
Data are not available on lateral resistance of drift bolts. Theyield model should provide lateral strength prediction, butthe model has not been experimentally verified for drift bolts.Designers have used bolt data and design methods based onexperience. This suggests that the load for a drift bolt driveninto the side grain of wood should not exceed, and ordinarily
should be taken as less than, that for a bolt of the samediameter. Bolt design values are based on the thickness ofthe main member in a joint. Thus the depth of penetrationof the drift bolt must be greater than or equal to the main-member thickness on which the bolt design value is based.However, the drift bolt should not fully penetrate its joint.
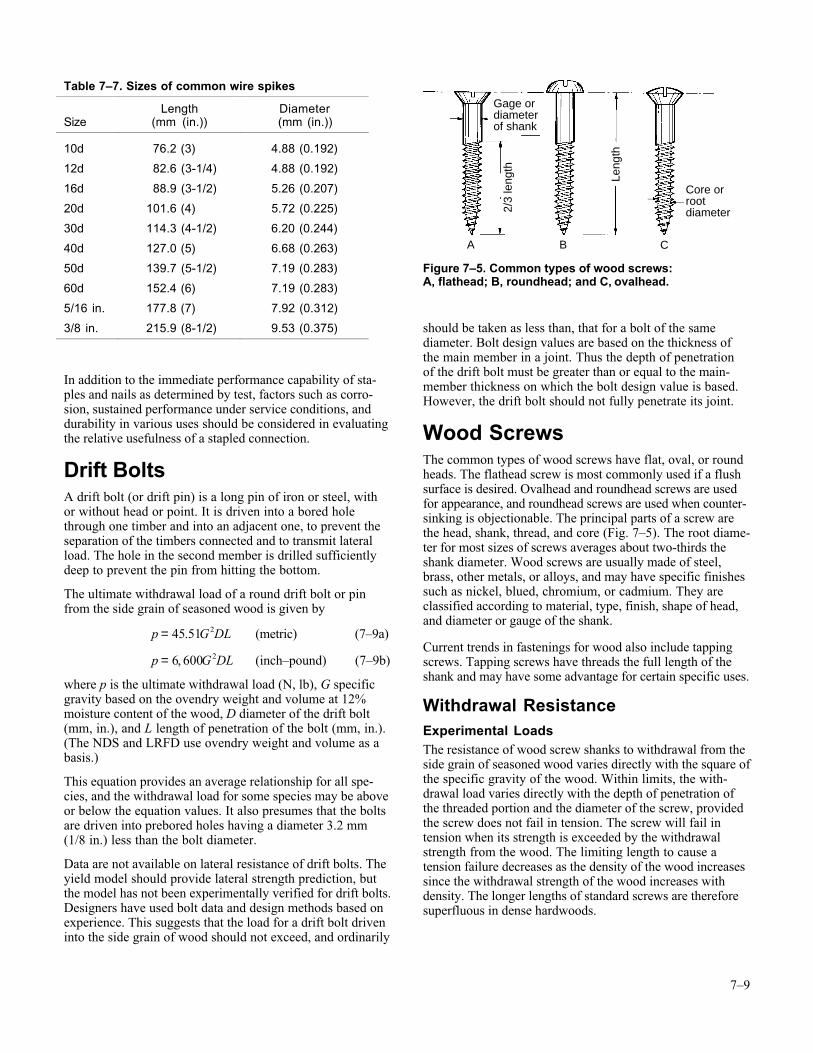
Wood ScrewsThe common types of wood screws have flat, oval, or roundheads. The flathead screw is most commonly used if a flushsurface is desired. Ovalhead and roundhead screws are usedfor appearance, and roundhead screws are used when counter-sinking is objectionable. The principal parts of a screw arethe head, shank, thread, and core (Fig. 7–5). The root diame-ter for most sizes of screws averages about two-thirds theshank diameter. Wood screws are usually made of steel,brass, other metals, or alloys, and may have specific finishessuch as nickel, blued, chromium, or cadmium. They areclassified according to material, type, finish, shape of head,and diameter or gauge of the shank.
Current trends in fastenings for wood also include tappingscrews. Tapping screws have threads the full length of theshank and may have some advantage for certain specific uses.
Withdrawal ResistanceExperimental LoadsThe resistance of wood screw shanks to withdrawal from theside grain of seasoned wood varies directly with the square ofthe specific gravity of the wood. Within limits, the with-drawal load varies directly with the depth of penetration ofthe threaded portion and the diameter of the screw, providedthe screw does not fail in tension. The screw will fail intension when its strength is exceeded by the withdrawalstrength from the wood. The limiting length to cause atension failure decreases as the density of the wood increasessince the withdrawal strength of the wood increases withdensity. The longer lengths of standard screws are thereforesuperfluous in dense hardwoods.
Table 7–7. Sizes of common wire spikes
Length DiameterSize (mm (in.)) (mm (in.))
10d 76.2 (3) 4.88 (0.192)
12d 82.6 (3-1/4) 4.88 (0.192)
16d 88.9 (3-1/2) 5.26 (0.207)
20d 101.6 (4) 5.72 (0.225)
30d 114.3 (4-1/2) 6.20 (0.244)
40d 127.0 (5) 6.68 (0.263)
50d 139.7 (5-1/2) 7.19 (0.283)
60d 152.4 (6) 7.19 (0.283)
5/16 in. 177.8 (7) 7.92 (0.312)
3/8 in. 215.9 (8-1/2) 9.53 (0.375)
Core orrootdiameter
Gage ordiameterof shank
2/3
leng
th
Leng
th
A B C
Figure 7–5. Common types of wood screws:A, flathead; B, roundhead; and C, ovalhead.
7–10
The withdrawal resistance of type A tapping screws, com-monly called sheet metal screws, is in general about 10%greater than that for wood screws of comparable diameter andlength of threaded portion. The ratio between the withdrawalresistance of tapping screws and wood screws varies from1.16 in denser woods, such as oak, to 1.05 in lighter woods,such as redwood.
Ultimate test values for withdrawal loads of wood screwsinserted into the side grain of seasoned wood may beexpressed as
p G DL= 108 25 2. (metric) (7–10a)
p G DL= 15 700 2, (inch–pound) (7–10b)
where p is maximum withdrawal load (N, lb), G specificgravity based on ovendry weight and volume at 12% mois-ture content, D shank diameter of the screw (mm, in.), and Llength of penetration of the threaded part of the screw (mm,in.). (The NDS and LRFD use ovendry weight and volumeas a basis.) These values are based on reaching ultimate loadin 5- to 10-min.
This equation is applicable when screw lead holes have adiameter of about 70% of the root diameter of the threads insoftwoods, and about 90% in hardwoods.
The equation values are applicable to the screw sizes listedin Table 7–8. (Shank diameters are related to screw gauges.)
For lengths and gauges outside these limits, the actualvalues are likely to be less than the equation values.
The withdrawal loads of screws inserted in the end grain ofwood are somewhat erratic, but when splitting is avoided,they should average 75% of the load sustained by screwsinserted in the side grain.
Lubricating the surface of a screw with soap or similar lubri-cant is recommended to facilitate insertion, especially indense woods, and it will have little effect on ultimate with-drawal resistance.
Fastening of ParticleboardTapping screws are commonly used in particleboard wherewithdrawal strength is important. Care must be taken whentightening screws in particleboard to avoid stripping thethreads. The maximum amount of torque that can be appliedto a screw before the threads in the particleboard are strippedis given by
T X= +3 16 0 0096. . (metric) (7–11a)
T X= +27 98 1 36. . (inch–pound) (7–11b)
where T is torque (N–m, in–lb) and X is density of theparticleboard (kg/m3, lb/ft3). Equation (7–11) is for 8-gaugescrews with a depth of penetration of 15.9 mm (5/8 in.). Themaximum torque is fairly constant for lead holes of 0 to 90%of the root diameter of the screw.
Ultimate withdrawal loads P (N, lb) of screws from particle-board can be predicted by
P = KD L D G1 2 5 4 23/ /( )− (7–12)
where D is shank diameter of the screw (mm, in.), L depth ofembedment of the threaded portion of the screw (mm, in.),and G specific gravity of the board based on ovendry weightand volume at current moisture content. For metric meas-urements, K = 41.1 for withdrawal from the face of the boardand K = 31.8 for withdrawal from the edge; for inch–poundmeasurements, K = 2,655 for withdrawal from the face andK = 2,055 for withdrawal from the edge. Equation (7–12)applies when the setting torque is between 60% to 90% of T(Eq. ( 7–11)).
Withdrawal resistance of screws from particleboard is notsignificantly different for lead holes of 50% to 90% of the rootdiameter. A higher setting torque will produce a somewhathigher withdrawal load, but there is only a slight difference(3%) in values between 60% to 90% setting torques(Eq. (7–11)). A modest tightening of screws in many casesprovides an effective compromise between optimizing with-drawal resistance and stripping threads.
Equation (7–12) can also predict the withdrawal of screwsfrom fiberboard with K = 57.3 (metric) or 3,700 (inch–pound) for the face and K = 44.3 (metric) or 2,860 (inch–pound) for the edge of the board.
Lateral ResistancePre-1991The proportional limit loads obtained in tests of lateralresistance for wood screws in the side grain of seasoned woodare given by the empirical equation
p KD= 2 (7–13)
where p is lateral load, D diameter of the screw shank, andK a coefficient depending on the inherent characteristics of thewood species. Values of screw shank diameters for variousscrew gauges are listed in Table 7–9.
Table 7–8. Screw sizesappropriate for Equation (7–10)
Screw length (mm (in.)) Gauge limits
12.7 (1/2) 1 to 6
19.0 (3/4) 2 to 11
25.4 (1) 3 to 12
38.1 (1-1/2) 5 to 14
50.8 (2) 7 to 16
63.5 (2-1/2) 9 to 18
76.2 (3) 12 to 20
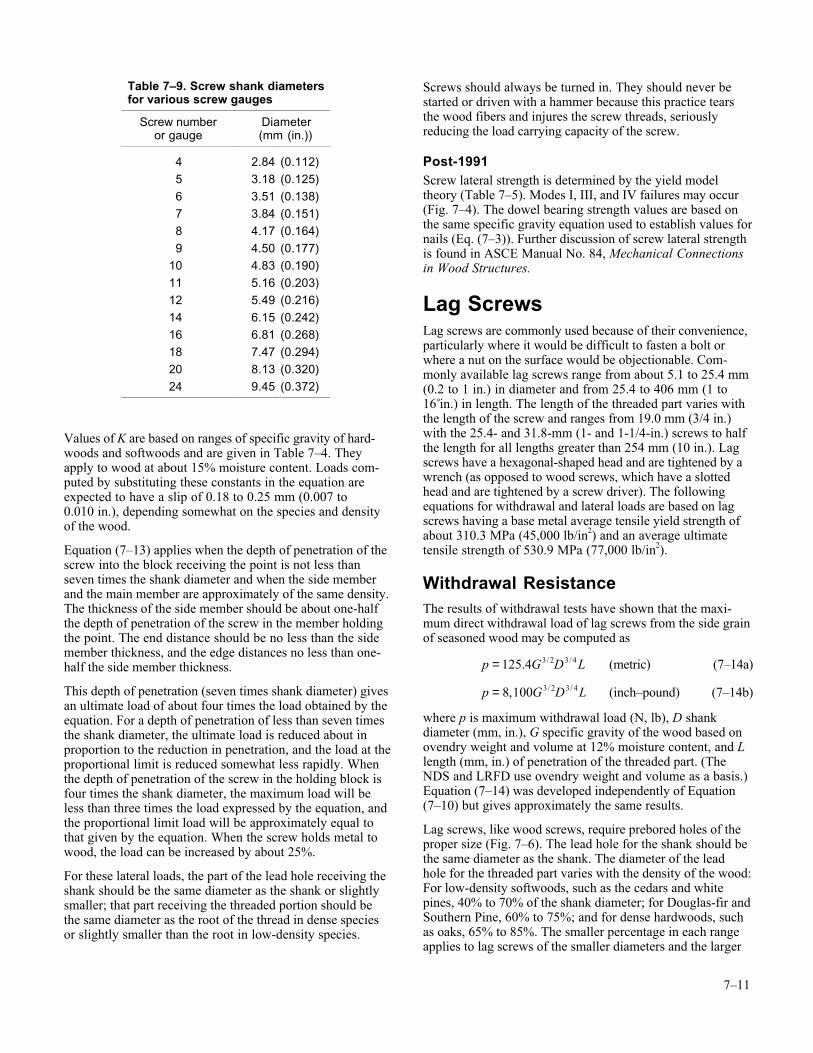
7–11
Values of K are based on ranges of specific gravity of hard-woods and softwoods and are given in Table 7–4. Theyapply to wood at about 15% moisture content. Loads com-puted by substituting these constants in the equation areexpected to have a slip of 0.18 to 0.25 mm (0.007 to0.010 in.), depending somewhat on the species and densityof the wood.
Equation (7–13) applies when the depth of penetration of thescrew into the block receiving the point is not less thanseven times the shank diameter and when the side memberand the main member are approximately of the same density.The thickness of the side member should be about one-halfthe depth of penetration of the screw in the member holdingthe point. The end distance should be no less than the sidemember thickness, and the edge distances no less than one-half the side member thickness.
This depth of penetration (seven times shank diameter) givesan ultimate load of about four times the load obtained by theequation. For a depth of penetration of less than seven timesthe shank diameter, the ultimate load is reduced about inproportion to the reduction in penetration, and the load at theproportional limit is reduced somewhat less rapidly. Whenthe depth of penetration of the screw in the holding block isfour times the shank diameter, the maximum load will beless than three times the load expressed by the equation, andthe proportional limit load will be approximately equal tothat given by the equation. When the screw holds metal towood, the load can be increased by about 25%.
For these lateral loads, the part of the lead hole receiving theshank should be the same diameter as the shank or slightlysmaller; that part receiving the threaded portion should bethe same diameter as the root of the thread in dense speciesor slightly smaller than the root in low-density species.
Screws should always be turned in. They should never bestarted or driven with a hammer because this practice tearsthe wood fibers and injures the screw threads, seriouslyreducing the load carrying capacity of the screw.
Post-1991Screw lateral strength is determined by the yield modeltheory (Table 7–5). Modes I, III, and IV failures may occur(Fig. 7–4). The dowel bearing strength values are based onthe same specific gravity equation used to establish values fornails (Eq. (7–3)). Further discussion of screw lateral strengthis found in ASCE Manual No. 84, Mechanical Connectionsin Wood Structures.
Lag ScrewsLag screws are commonly used because of their convenience,particularly where it would be difficult to fasten a bolt orwhere a nut on the surface would be objectionable. Com-monly available lag screws range from about 5.1 to 25.4 mm(0.2 to 1 in.) in diameter and from 25.4 to 406 mm (1 to16 in.) in length. The length of the threaded part varies withthe length of the screw and ranges from 19.0 mm (3/4 in.)with the 25.4- and 31.8-mm (1- and 1-1/4-in.) screws to halfthe length for all lengths greater than 254 mm (10 in.). Lagscrews have a hexagonal-shaped head and are tightened by awrench (as opposed to wood screws, which have a slottedhead and are tightened by a screw driver). The followingequations for withdrawal and lateral loads are based on lagscrews having a base metal average tensile yield strength ofabout 310.3 MPa (45,000 lb/in2) and an average ultimatetensile strength of 530.9 MPa (77,000 lb/in2).
Withdrawal ResistanceThe results of withdrawal tests have shown that the maxi-mum direct withdrawal load of lag screws from the side grainof seasoned wood may be computed as
p G D L= 125 4 3 2 3 4. / / (metric) (7–14a)
p G D L= 8 100 3 2 3 4, / / (inch–pound) (7–14b)
where p is maximum withdrawal load (N, lb), D shankdiameter (mm, in.), G specific gravity of the wood based onovendry weight and volume at 12% moisture content, and Llength (mm, in.) of penetration of the threaded part. (TheNDS and LRFD use ovendry weight and volume as a basis.)Equation (7–14) was developed independently of Equation(7–10) but gives approximately the same results.
Lag screws, like wood screws, require prebored holes of theproper size (Fig. 7–6). The lead hole for the shank should bethe same diameter as the shank. The diameter of the leadhole for the threaded part varies with the density of the wood:For low-density softwoods, such as the cedars and whitepines, 40% to 70% of the shank diameter; for Douglas-fir andSouthern Pine, 60% to 75%; and for dense hardwoods, suchas oaks, 65% to 85%. The smaller percentage in each rangeapplies to lag screws of the smaller diameters and the larger
Table 7–9. Screw shank diametersfor various screw gauges
Screw number Diameteror gauge (mm (in.))
4 2.84 (0.112)
5 3.18 (0.125)
6 3.51 (0.138)
7 3.84 (0.151)
8 4.17 (0.164)
9 4.50 (0.177)
10 4.83 (0.190)
11 5.16 (0.203)
12 5.49 (0.216)
14 6.15 (0.242)
16 6.81 (0.268)
18 7.47 (0.294)
20 8.13 (0.320)
24 9.45 (0.372)
7–12
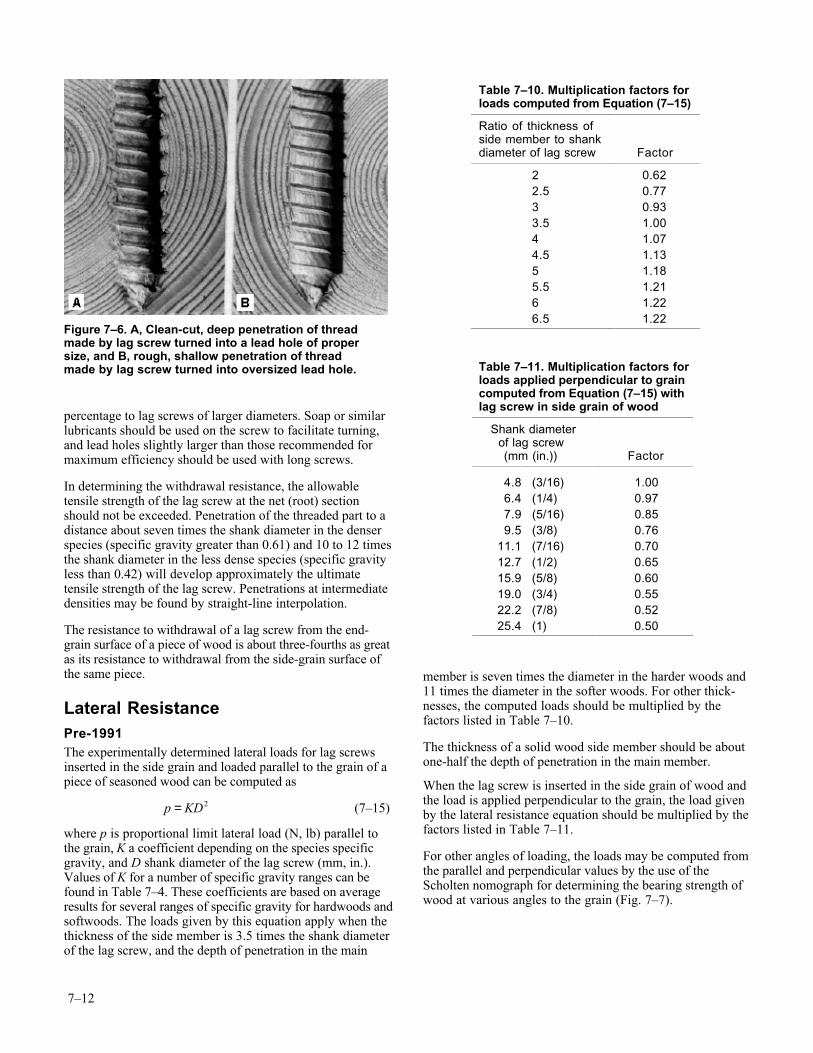
percentage to lag screws of larger diameters. Soap or similarlubricants should be used on the screw to facilitate turning,and lead holes slightly larger than those recommended formaximum efficiency should be used with long screws.
In determining the withdrawal resistance, the allowabletensile strength of the lag screw at the net (root) sectionshould not be exceeded. Penetration of the threaded part to adistance about seven times the shank diameter in the denserspecies (specific gravity greater than 0.61) and 10 to 12 timesthe shank diameter in the less dense species (specific gravityless than 0.42) will develop approximately the ultimatetensile strength of the lag screw. Penetrations at intermediatedensities may be found by straight-line interpolation.
The resistance to withdrawal of a lag screw from the end-grain surface of a piece of wood is about three-fourths as greatas its resistance to withdrawal from the side-grain surface ofthe same piece.
Lateral ResistancePre-1991The experimentally determined lateral loads for lag screwsinserted in the side grain and loaded parallel to the grain of apiece of seasoned wood can be computed as
p KD= 2 (7–15)
where p is proportional limit lateral load (N, lb) parallel tothe grain, K a coefficient depending on the species specificgravity, and D shank diameter of the lag screw (mm, in.).Values of K for a number of specific gravity ranges can befound in Table 7–4. These coefficients are based on averageresults for several ranges of specific gravity for hardwoods andsoftwoods. The loads given by this equation apply when thethickness of the side member is 3.5 times the shank diameterof the lag screw, and the depth of penetration in the main
member is seven times the diameter in the harder woods and11 times the diameter in the softer woods. For other thick-nesses, the computed loads should be multiplied by thefactors listed in Table 7–10.
The thickness of a solid wood side member should be aboutone-half the depth of penetration in the main member.
When the lag screw is inserted in the side grain of wood andthe load is applied perpendicular to the grain, the load givenby the lateral resistance equation should be multiplied by thefactors listed in Table 7–11.
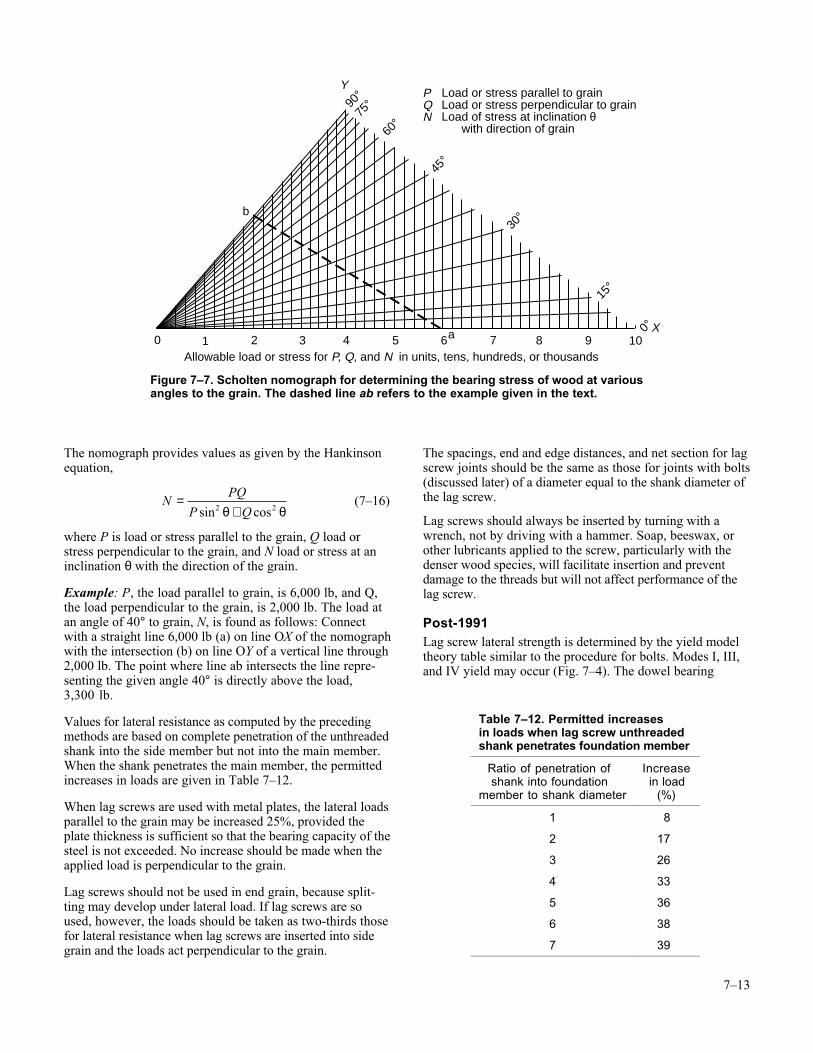
For other angles of loading, the loads may be computed fromthe parallel and perpendicular values by the use of theScholten nomograph for determining the bearing strength ofwood at various angles to the grain (Fig. 7–7).
Figure 7–6. A, Clean-cut, deep penetration of threadmade by lag screw turned into a lead hole of propersize, and B, rough, shallow penetration of threadmade by lag screw turned into oversized lead hole.
Table 7–10. Multiplication factors forloads computed from Equation (7–15)
Ratio of thickness ofside member to shankdiameter of lag screw Factor
2 0.622.5 0.773 0.933.5 1.004 1.074.5 1.135 1.185.5 1.216 1.226.5 1.22
Table 7–11. Multiplication factors forloads applied perpendicular to graincomputed from Equation (7–15) withlag screw in side grain of wood
Shank diameter of lag screw (mm (in.)) Factor
4.8 (3/16) 1.006.4 (1/4) 0.977.9 (5/16) 0.859.5 (3/8) 0.76
11.1 (7/16) 0.7012.7 (1/2) 0.6515.9 (5/8) 0.6019.0 (3/4) 0.5522.2 (7/8) 0.5225.4 (1) 0.50
7–13
The nomograph provides values as given by the Hankinsonequation,
N
PQ
P Q=
+sin cos2 2θ θ (7–16)
where P is load or stress parallel to the grain, Q load orstress perpendicular to the grain, and N load or stress at aninclination θ with the direction of the grain.
Example: P, the load parallel to grain, is 6,000 lb, and Q,the load perpendicular to the grain, is 2,000 lb. The load atan angle of 40° to grain, N, is found as follows: Connectwith a straight line 6,000 lb (a) on line OX of the nomographwith the intersection (b) on line OY of a vertical line through2,000 lb. The point where line ab intersects the line repre-senting the given angle 40° is directly above the load,3,300 lb.
Values for lateral resistance as computed by the precedingmethods are based on complete penetration of the unthreadedshank into the side member but not into the main member.When the shank penetrates the main member, the permittedincreases in loads are given in Table 7–12.
When lag screws are used with metal plates, the lateral loadsparallel to the grain may be increased 25%, provided theplate thickness is sufficient so that the bearing capacity of thesteel is not exceeded. No increase should be made when theapplied load is perpendicular to the grain.
Lag screws should not be used in end grain, because split-ting may develop under lateral load. If lag screws are soused, however, the loads should be taken as two-thirds thosefor lateral resistance when lag screws are inserted into sidegrain and the loads act perpendicular to the grain.
The spacings, end and edge distances, and net section for lagscrew joints should be the same as those for joints with bolts(discussed later) of a diameter equal to the shank diameter ofthe lag screw.
Lag screws should always be inserted by turning with awrench, not by driving with a hammer. Soap, beeswax, orother lubricants applied to the screw, particularly with thedenser wood species, will facilitate insertion and preventdamage to the threads but will not affect performance of thelag screw.
Post-1991Lag screw lateral strength is determined by the yield modeltheory table similar to the procedure for bolts. Modes I, III,and IV yield may occur (Fig. 7–4). The dowel bearing
a
b
1 2 43 5 7 8 9 100Allowable load or stress for P, Q, and N in units, tens, hundreds, or thousands
6
90°75
°
60°
45°
30°
15°
0°
Load or stress parallel to grain Load or stress perpendicular to grain Load of stress at inclination θ with direction of grain
Y
X
PQN
Figure 7–7. Scholten nomograph for determining the bearing stress of wood at variousangles to the grain. The dashed line ab refers to the example given in the text.
Table 7–12. Permitted increasesin loads when lag screw unthreadedshank penetrates foundation member
Ratio of penetration of shank into foundationmember to shank diameter
Increasein load
(%)
1 8
2 17
3 26
4 33
5 36
6 38
7 39
7–14
strength values are based on the same parallel- and perpen-dicular-to-grain specific gravity equations used to establishvalues for bolts.
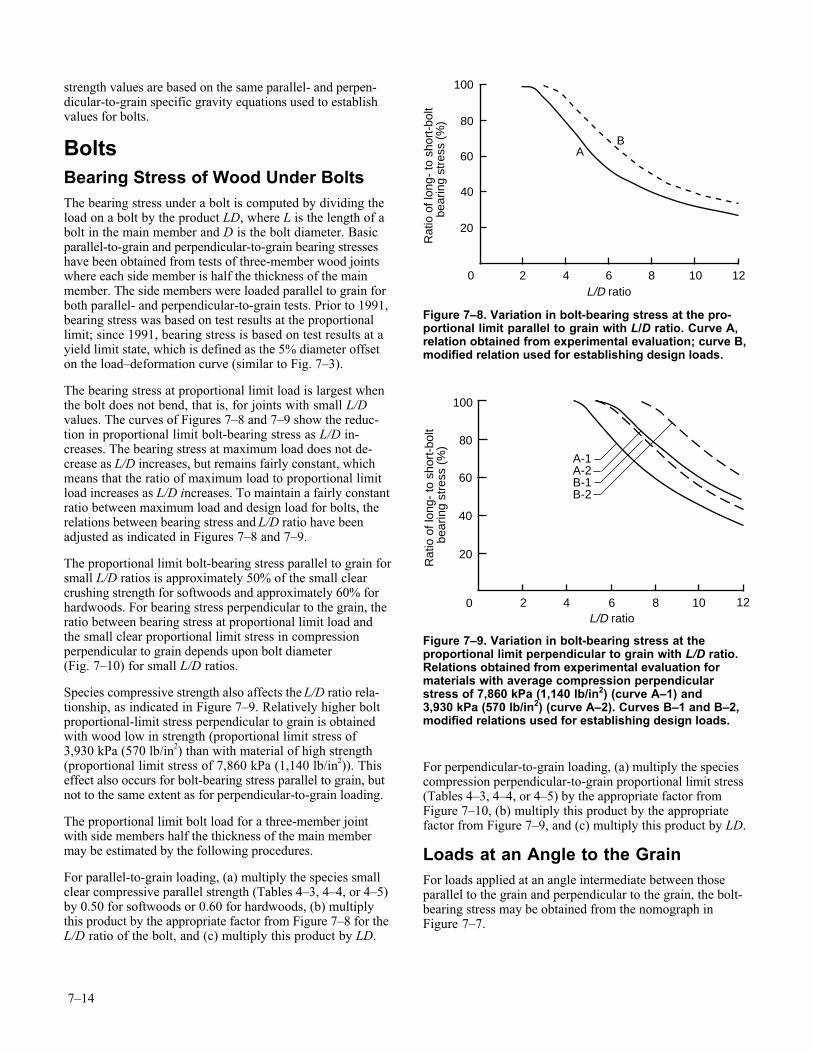
BoltsBearing Stress of Wood Under BoltsThe bearing stress under a bolt is computed by dividing theload on a bolt by the product LD, where L is the length of abolt in the main member and D is the bolt diameter. Basicparallel-to-grain and perpendicular-to-grain bearing stresseshave been obtained from tests of three-member wood jointswhere each side member is half the thickness of the mainmember. The side members were loaded parallel to grain forboth parallel- and perpendicular-to-grain tests. Prior to 1991,bearing stress was based on test results at the proportionallimit; since 1991, bearing stress is based on test results at ayield limit state, which is defined as the 5% diameter offseton the load–deformation curve (similar to Fig. 7–3).
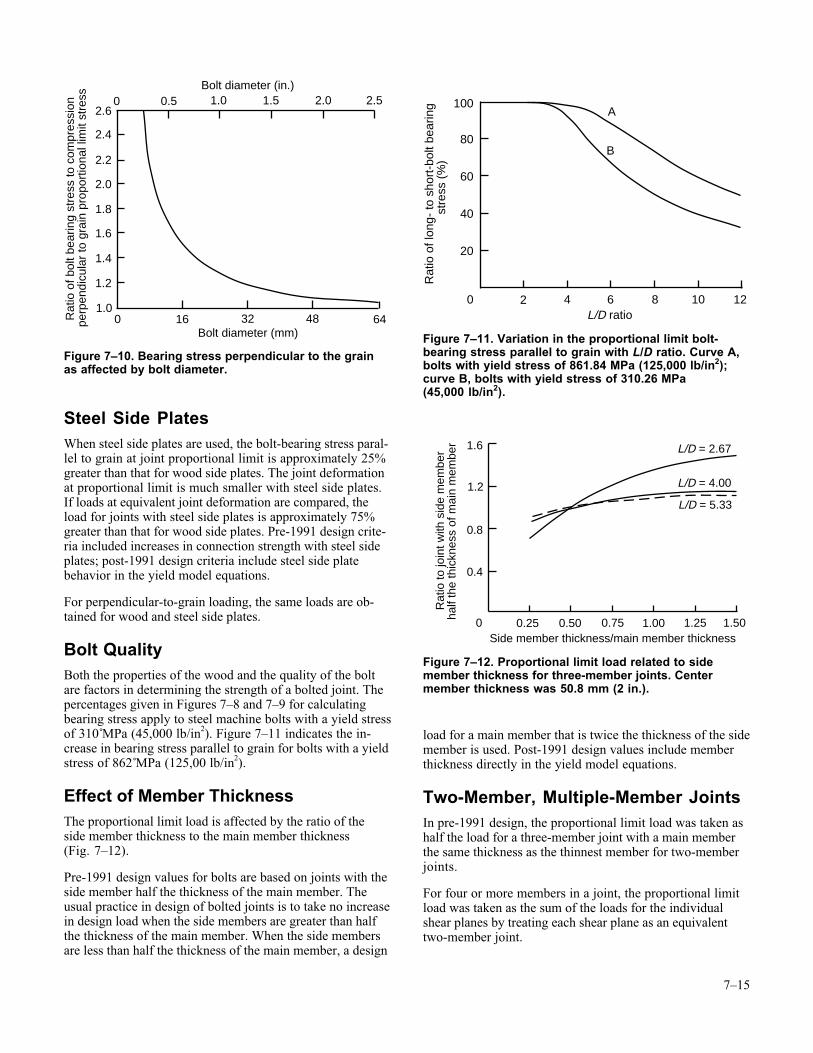
The bearing stress at proportional limit load is largest whenthe bolt does not bend, that is, for joints with small L/Dvalues. The curves of Figures 7–8 and 7–9 show the reduc-tion in proportional limit bolt-bearing stress as L/D in-creases. The bearing stress at maximum load does not de-crease as L/D increases, but remains fairly constant, whichmeans that the ratio of maximum load to proportional limitload increases as L/D increases. To maintain a fairly constantratio between maximum load and design load for bolts, therelations between bearing stress and L/D ratio have beenadjusted as indicated in Figures 7–8 and 7–9.
The proportional limit bolt-bearing stress parallel to grain forsmall L/D ratios is approximately 50% of the small clearcrushing strength for softwoods and approximately 60% forhardwoods. For bearing stress perpendicular to the grain, theratio between bearing stress at proportional limit load andthe small clear proportional limit stress in compressionperpendicular to grain depends upon bolt diameter(Fig. 7–10) for small L/D ratios.
Species compressive strength also affects the L/D ratio rela-tionship, as indicated in Figure 7–9. Relatively higher boltproportional-limit stress perpendicular to grain is obtainedwith wood low in strength (proportional limit stress of3,930 kPa (570 lb/in2) than with material of high strength(proportional limit stress of 7,860 kPa (1,140 lb/in2)). Thiseffect also occurs for bolt-bearing stress parallel to grain, butnot to the same extent as for perpendicular-to-grain loading.
The proportional limit bolt load for a three-member jointwith side members half the thickness of the main membermay be estimated by the following procedures.
For parallel-to-grain loading, (a) multiply the species smallclear compressive parallel strength (Tables 4–3, 4–4, or 4–5)by 0.50 for softwoods or 0.60 for hardwoods, (b) multiplythis product by the appropriate factor from Figure 7–8 for theL/D ratio of the bolt, and (c) multiply this product by LD.
For perpendicular-to-grain loading, (a) multiply the speciescompression perpendicular-to-grain proportional limit stress(Tables 4–3, 4–4, or 4–5) by the appropriate factor fromFigure 7–10, (b) multiply this product by the appropriatefactor from Figure 7–9, and (c) multiply this product by LD.
Loads at an Angle to the GrainFor loads applied at an angle intermediate between thoseparallel to the grain and perpendicular to the grain, the bolt-bearing stress may be obtained from the nomograph inFigure 7–7.
Rat
io o
f lon
g- to
sho
rt-b
olt
bea
ring
stre
ss (
%)
100
80
60
40
20
0 2 4 6 8 10 12
AB
L/D ratio
Figure 7–8. Variation in bolt-bearing stress at the pro-portional limit parallel to grain with L/D ratio. Curve A,relation obtained from experimental evaluation; curve B,modified relation used for establishing design loads.
Rat
io o
f lon
g- to
sho
rt-b
olt
bea
ring
stre
ss (
%)
100
80
60
40
20
0 2 4 6 8 10 12L/D ratio
A-1A-2B-1B-2
Figure 7–9. Variation in bolt-bearing stress at theproportional limit perpendicular to grain with L/D ratio.Relations obtained from experimental evaluation formaterials with average compression perpendicularstress of 7,860 kPa (1,140 lb/in2) (curve A–1) and3,930 kPa (570 lb/in2) (curve A–2). Curves B–1 and B–2,modified relations used for establishing design loads.
7–15
Steel Side PlatesWhen steel side plates are used, the bolt-bearing stress paral-lel to grain at joint proportional limit is approximately 25%greater than that for wood side plates. The joint deformationat proportional limit is much smaller with steel side plates.If loads at equivalent joint deformation are compared, theload for joints with steel side plates is approximately 75%greater than that for wood side plates. Pre-1991 design crite-ria included increases in connection strength with steel sideplates; post-1991 design criteria include steel side platebehavior in the yield model equations.
For perpendicular-to-grain loading, the same loads are ob-tained for wood and steel side plates.
Bolt QualityBoth the properties of the wood and the quality of the boltare factors in determining the strength of a bolted joint. Thepercentages given in Figures 7–8 and 7–9 for calculatingbearing stress apply to steel machine bolts with a yield stressof 310 MPa (45,000 lb/in2). Figure 7–11 indicates the in-crease in bearing stress parallel to grain for bolts with a yieldstress of 862 MPa (125,00 lb/in2).
Effect of Member ThicknessThe proportional limit load is affected by the ratio of theside member thickness to the main member thickness(Fig. 7–12).
Pre-1991 design values for bolts are based on joints with theside member half the thickness of the main member. Theusual practice in design of bolted joints is to take no increasein design load when the side members are greater than halfthe thickness of the main member. When the side membersare less than half the thickness of the main member, a design
load for a main member that is twice the thickness of the sidemember is used. Post-1991 design values include memberthickness directly in the yield model equations.
Two-Member, Multiple-Member JointsIn pre-1991 design, the proportional limit load was taken ashalf the load for a three-member joint with a main memberthe same thickness as the thinnest member for two-memberjoints.
For four or more members in a joint, the proportional limitload was taken as the sum of the loads for the individualshear planes by treating each shear plane as an equivalenttwo-member joint.
Rat
io o
f bol
t bea
ring
stre
ss to
com
pres
sion
perp
endi
cula
r to
gra
in p
ropo
rtio
nal l
imit
stre
ss
2.6
Bolt diameter (in.)
Bolt diameter (mm)
2.4
2.2
2.0
1.8
1.6
1.4
1.2
1.00
0.5 1.0 2.0 2.50
16 32 48 64
1.5
Figure 7–10. Bearing stress perpendicular to the grainas affected by bolt diameter.
Rat
io o
f lon
g- to
sho
rt-b
olt b
earin
g
stre
ss (
%)
100
80
60
40
20
0 2 4 6 8 10 12L/D ratio
A
B
Figure 7–11. Variation in the proportional limit bolt-bearing stress parallel to grain with L/D ratio. Curve A,bolts with yield stress of 861.84 MPa (125,000 lb/in2);curve B, bolts with yield stress of 310.26 MPa(45,000 lb/in2).
R
atio
to jo
int w
ith s
ide
mem
ber
half
the
thic
knes
s of
mai
n m
embe
r 1.6
1.2
0.8
0.4
0 0.25 0.50 0.75 1.00 1.25 1.50Side member thickness/main member thickness
L/D = 2.67
L/D = 5.33
L/D = 4.00
Figure 7–12. Proportional limit load related to sidemember thickness for three-member joints. Centermember thickness was 50.8 mm (2 in.).
7–16
Post-1991 design for joints with four or more members alsoresults in values per shear plane. Connection strength for anynumber of members is conservatively found by multiplyingthe value for the weakest shear plane by the number ofshear planes.
Spacing, Edge, and End DistanceThe center-to-center distance along the grain should be atleast four times the bolt diameter for parallel-to-grain load-ing. The minimum center-to-center spacing of bolts in theacross-the-grain direction for loads acting through metal sideplates and parallel to the grain need only be sufficient topermit the tightening of the nuts. For wood side plates, thespacing is controlled by the rules applying to loads actingparallel to grain if the design load approaches the bolt-bearing capacity of the side plates. When the design load isless than the bolt-bearing capacity of the side plates, thespacing may be reduced below that required to develop theirmaximum capacity.
When a joint is in tension, the bolt nearest the end of atimber should be at a distance from the end of at least seventimes the bolt diameter for softwoods and five times forhardwoods. When the joint is in compression, the end mar-gin may be four times the bolt diameter for both softwoodsand hardwoods. Any decrease in these spacings and marginswill decrease the load in about the same ratio.
For bolts bearing parallel to the grain, the distance from theedge of a timber to the center of a bolt should be at least 1.5times the bolt diameter. This margin, however, will usuallybe controlled by (a) the common practice of having an edgemargin equal to one-half the distance between bolt rows and(b) the area requirements at the critical section. (The criticalsection is that section of the member taken at right angles tothe direction of load, which gives the maximum stress in themember based on the net area remaining after reductions aremade for bolt holes at that section.) For parallel-to-grainloading in softwoods, the net area remaining at the criticalsection should be at least 80% of the total area in bearingunder all the bolts in the particular joint under consideration;in hardwoods it should be 100%.
For bolts bearing perpendicular to the grain, the marginbetween the edge toward which the bolt pressure is actingand the center of the bolt or bolts nearest this edge should beat least four times the bolt diameter. The margin at theopposite edge is relatively unimportant.
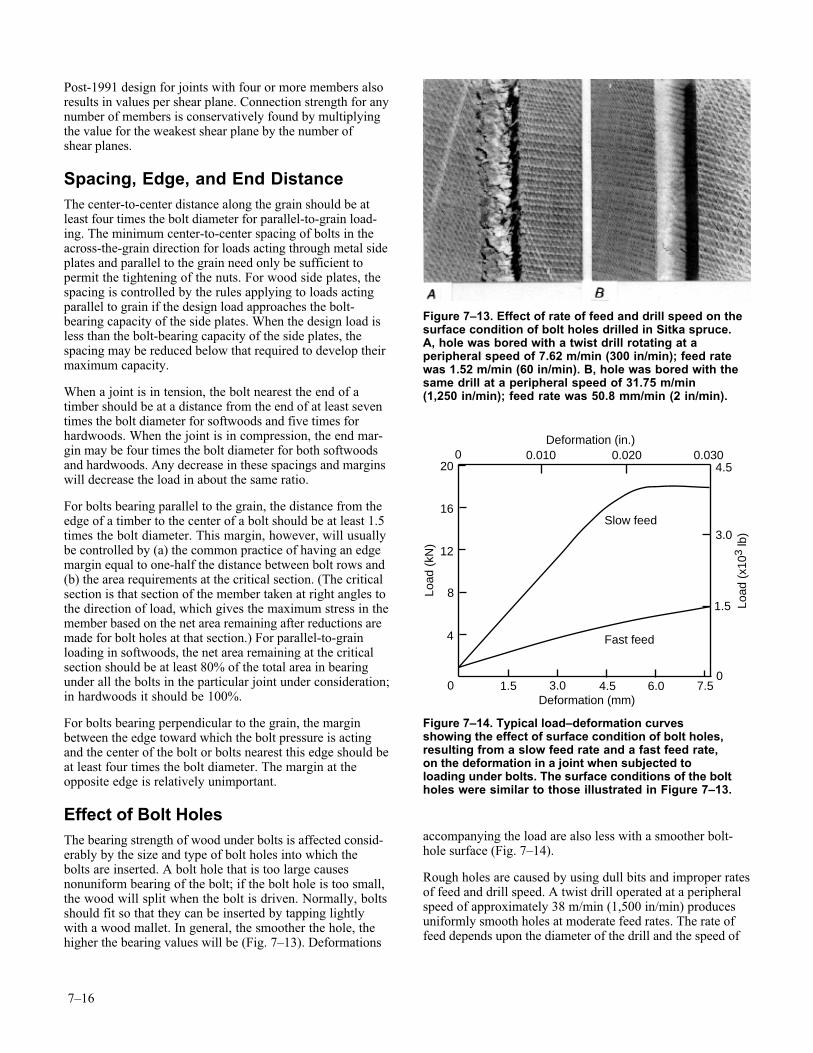
Effect of Bolt HolesThe bearing strength of wood under bolts is affected consid-erably by the size and type of bolt holes into which thebolts are inserted. A bolt hole that is too large causesnonuniform bearing of the bolt; if the bolt hole is too small,the wood will split when the bolt is driven. Normally, boltsshould fit so that they can be inserted by tapping lightlywith a wood mallet. In general, the smoother the hole, thehigher the bearing values will be (Fig. 7–13). Deformations
accompanying the load are also less with a smoother bolt-hole surface (Fig. 7–14).
Rough holes are caused by using dull bits and improper ratesof feed and drill speed. A twist drill operated at a peripheralspeed of approximately 38 m/min (1,500 in/min) producesuniformly smooth holes at moderate feed rates. The rate offeed depends upon the diameter of the drill and the speed of
Figure 7–13. Effect of rate of feed and drill speed on thesurface condition of bolt holes drilled in Sitka spruce.A, hole was bored with a twist drill rotating at aperipheral speed of 7.62 m/min (300 in/min); feed ratewas 1.52 m/min (60 in/min). B, hole was bored with thesame drill at a peripheral speed of 31.75 m/min(1,250 in/min); feed rate was 50.8 mm/min (2 in/min).
4.5
Load
(kN
)
Load
(x1
03 lb
)
20
16
12
8
4
0
3.0
1.5
01.5 3.0 4.5 6.0 7.5
0 0.010 0.020 0.030
Slow feed
Fast feed
Deformation (in.)
Deformation (mm)
Figure 7–14. Typical load–deformation curvesshowing the effect of surface condition of bolt holes,resulting from a slow feed rate and a fast feed rate,on the deformation in a joint when subjected toloading under bolts. The surface conditions of the boltholes were similar to those illustrated in Figure 7–13.
7–17
rotation but should enable the drill to cut rather than tear thewood. The drill should produce shavings, not chips.
Proportional limit loads for joints with bolt holes the samediameter as the bolt will be slightly higher than for jointswith a 1.6-mm (1/16-in.) oversized hole. However, if dryingtakes place after assembly of the joint, the proportional limitload for snug-fitting bolts will be considerably less due tothe effects of shrinkage.
Pre-1991 Allowable LoadsThe following procedures are used to calculate allowable boltloads for joints with wood side members, each half thethickness of the main member.
Parallel to Grain—The starting point for parallel-to-grainbolt values is the maximum green crushing strength for thespecies or group of species. Procedures outlined in ASTMD2555 are used to establish a 5% exclusion value. Theexclusion value is divided by a factor of 1.9 to adjust to a10-year normal duration of load and provide a factor of safety.This value is multiplied by 1.20 to adjust to a seasonedstrength. The resulting value is called the basic bolt-bearingstress parallel to grain.
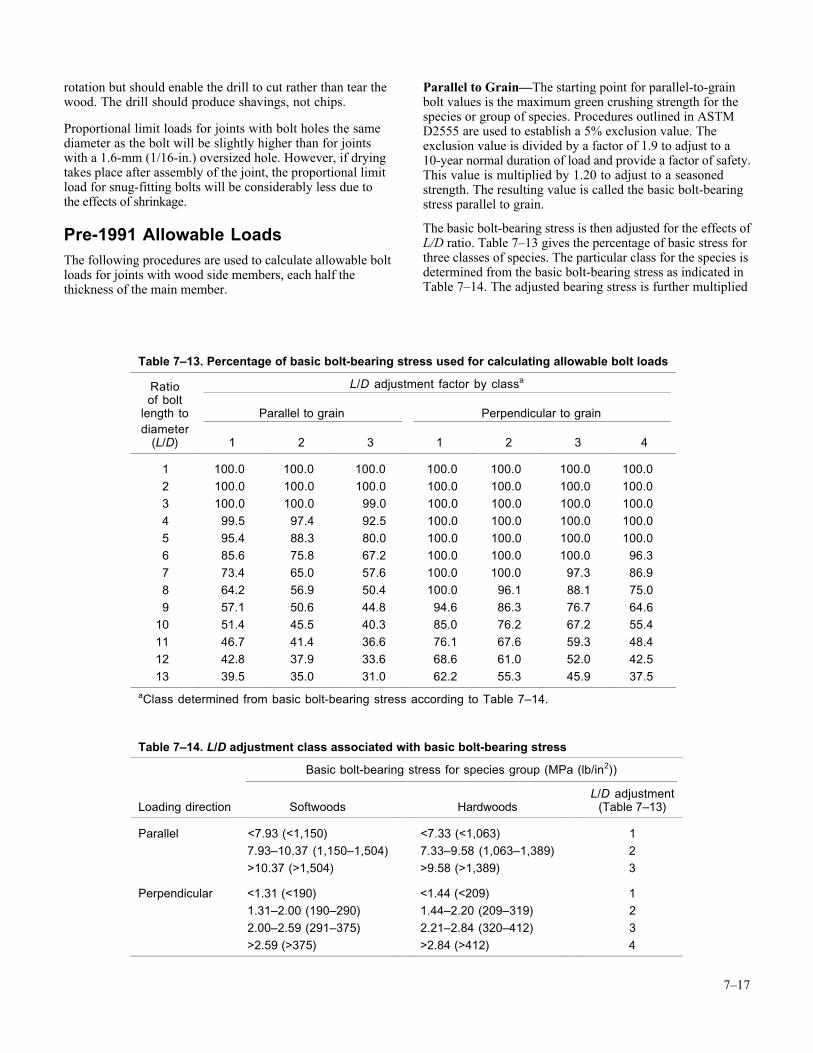
The basic bolt-bearing stress is then adjusted for the effects ofL/D ratio. Table 7–13 gives the percentage of basic stress forthree classes of species. The particular class for the species isdetermined from the basic bolt-bearing stress as indicated inTable 7–14. The adjusted bearing stress is further multiplied
Table 7–13. Percentage of basic bolt-bearing stress used for calculating allowable bolt loads
Ratio L/D adjustment factor by classa
of boltlength to Parallel to grain Perpendicular to graindiameter
(L/D) 1 2 3 1 2 3 4
1 100.0 100.0 100.0 100.0 100.0 100.0 100.0
2 100.0 100.0 100.0 100.0 100.0 100.0 100.0
3 100.0 100.0 99.0 100.0 100.0 100.0 100.0
4 99.5 97.4 92.5 100.0 100.0 100.0 100.0
5 95.4 88.3 80.0 100.0 100.0 100.0 100.0
6 85.6 75.8 67.2 100.0 100.0 100.0 96.3
7 73.4 65.0 57.6 100.0 100.0 97.3 86.9
8 64.2 56.9 50.4 100.0 96.1 88.1 75.0
9 57.1 50.6 44.8 94.6 86.3 76.7 64.6
10 51.4 45.5 40.3 85.0 76.2 67.2 55.4
11 46.7 41.4 36.6 76.1 67.6 59.3 48.4
12 42.8 37.9 33.6 68.6 61.0 52.0 42.5
13 39.5 35.0 31.0 62.2 55.3 45.9 37.5
aClass determined from basic bolt-bearing stress according to Table 7–14.
Table 7–14. L/D adjustment class associated with basic bolt-bearing stress
Basic bolt-bearing stress for species group (MPa (lb/in2))
Loading direction Softwoods HardwoodsL/D adjustment
(Table 7–13)
Parallel <7.93 (<1,150) <7.33 (<1,063) 1
7.93–10.37 (1,150–1,504) 7.33–9.58 (1,063–1,389) 2
>10.37 (>1,504) >9.58 (>1,389) 3
Perpendicular <1.31 (<190) <1.44 (<209) 1
1.31–2.00 (190–290) 1.44–2.20 (209–319) 2
2.00–2.59 (291–375) 2.21–2.84 (320–412) 3
>2.59 (>375) >2.84 (>412) 4
7–18
by a factor of 0.80 to adjust to wood side plates. The allow-able bolt load in pounds is then determined by multiplyingby the projected bolt area, LD.
Perpendicular to Grain—The starting point for perpendicu-lar-to-grain bolt values is the average green proportionallimit stress in compression perpendicular to grain. Proce-dures in ASTM D2555 are used to establish compressionperpendicular values for groups of species. The average pro-portional limit stress is divided by 1.5 for ring position(growth rings neither parallel nor perpendicular to load dur-ing test) and a factor of safety. This value is then multipliedby 1.20 to adjust to a seasoned strength and by 1.10 toadjust to a normal duration of load. The resulting value iscalled the basic bolt-bearing stress perpendicular to grain.
The basic bolt-bearing stress is then adjusted for the effects ofbolt diameter (Table 7–15) and L/D ratio (Table 7–13).The allowable bolt load is then determined by multiplyingthe adjusted basic bolt-bearing stress by the projected boltarea, LD.
Post-1991 Yield ModelThe empirical design approach used prior to 1991 was basedon a tabular value for a single bolt in a wood-to-wood, three-member connection where the side members are each aminimum of one-half the thickness of the main member. Thesingle-bolt value must then be modified for any variationfrom these reference conditions. The theoretical approach,after 1991, is more general and is not limited to thesereference conditions.
The theoretical approach is based on work done in Europe(Johansen 1949) and is referred to as the European YieldModel (EYM). The EYM describes a number of possibleyield modes that can occur in a dowel-type connection(Fig. 7–4). The yield strength of these different modes isdetermined from a static analysis that assumes the wood andthe bolt are both perfectly plastic. The yield mode that re-sults in the lowest yield load for a given geometry is thetheoretical connection yield load.
Equations corresponding to the yield modes for a three-member joint are given in Table 7–16. (Equations for two-member allowable values are given in the AF&PA NationalDesign Specification for Wood Construction) The nominalsingle-bolt value is dependent on the joint geometry(thickness of main and side members), bolt diameter andbending yield strength, dowel bearing strength, and directionof load to the grain. The equations are equally valid for woodor steel side members, which is taken into account by thick-ness and dowel bearing strength parameters. The equationsare also valid for various load-to-grain directions, which aretaken into account by the Kθ and Fe parameter.
The dowel bearing strength is a material property not gener-ally familiar to structural designers. The dowel bearingstrength of the wood members is determined from tests thatrelate species specific gravity and dowel diameter to bearing
strength. Empirical equations for these relationships are asfollows:
Parallel to grain
F Ge = 77 2. (metric) (7–17a)
F Ge = 11 200, (inch–pound) (7–17b)
Perpendicular to grain
F G D-0.5e = 212 0 1 45. . (metric) (7–18a)
F G D-0.5e = 6 100 1 45, . (inch–pound) (7–18b)
where Fe is dowel bearing strength (MPa, lb/in2), G specificgravity based on ovendry weight and volume, and D boltdiameter (mm, in.).
Connector JointsSeveral types of connectors have been devised that increasejoint bearing and shear areas by utilizing rings or platesaround bolts holding joint members together. The primaryload-carrying portions of these joints are the connectors; thebolts usually serve to prevent transverse separation of themembers but do contribute some load-carrying capacity.
The strength of the connector joint depends on the type andsize of the connector, the species of wood, the thickness andwidth of the member, the distance of the connector from theend of the member, the spacing of the connectors, the direc-tion of application of the load with respect to the direction ofthe grain of the wood, and other factors. Loads for woodjoints with steel connectors—split ring (Fig. 7–15) and shearplate (Fig. 7–16)—are discussed in this section. Theseconnectors require closely fitting machined grooves in thewood members.
Parallel-to-Grain LoadingTests have demonstrated that the density of the wood is acontrolling factor in the strength of connector joints. Forsplit-ring connectors, both maximum load and proportionallimit load parallel to grain vary linearly with specific gravity(Figs. 7–17 and 7–18). For shear plates, the maximum loadand proportional limit load vary linearly with specific gravityfor the less dense species (Figs. 7–19 and 7–20). In thehigher density species, the shear strength of the bolts be-comes the controlling factor. These relations were obtainedfor seasoned members, approximately 12% moisture content.
Perpendicular-to-Grain LoadingLoads for perpendicular-to-grain loading have been estab-lished using three-member joints with the side membersloaded parallel to grain. Specific gravity is a good indicatorof perpendicular-to-grain strength of timber connector joints.For split-ring connectors, the proportional limit loads per-pendicular to grain are 58% of the parallel-to-grain propor-tional limit loads. The joint deformation at proportionallimit is 30% to 50% more than for parallel-to-grain loading.
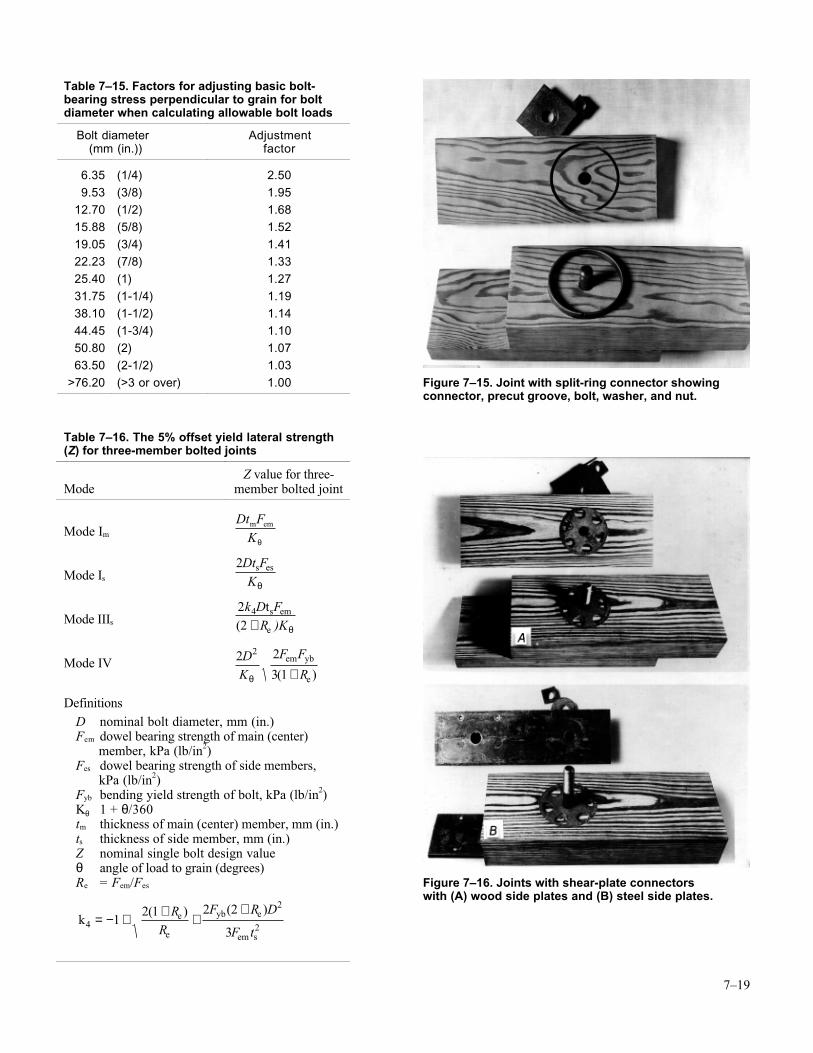
7–19
Table 7–15. Factors for adjusting basic bolt-bearing stress perpendicular to grain for boltdiameter when calculating allowable bolt loads
Bolt diameter Adjustment (mm (in.)) factor
6.35 (1/4) 2.50
9.53 (3/8) 1.95
12.70 (1/2) 1.68
15.88 (5/8) 1.52
19.05 (3/4) 1.41
22.23 (7/8) 1.33
25.40 (1) 1.27
31.75 (1-1/4) 1.19
38.10 (1-1/2) 1.14
44.45 (1-3/4) 1.10
50.80 (2) 1.07
63.50 (2-1/2) 1.03
>76.20 (>3 or over) 1.00
Table 7–16. The 5% offset yield lateral strength(Z) for three-member bolted joints
ModeZ value for three-
member bolted joint
Mode Im
Dt FKm em
θ
Mode Is
2Dt FK
s es
θ
Mode IIIs
22
4k D FR )Kts em
( + e θ
Mode IV
2 2
3 1
2DK
F F
Rθ
em yb
e( )+
DefinitionsD nominal bolt diameter, mm (in.)Fem dowel bearing strength of main (center) member, kPa (lb/in2)Fes dowel bearing strength of side members, kPa (lb/in2)Fyb bending yield strength of bolt, kPa (lb/in2)Kθ 1 + θ/360tm thickness of main (center) member, mm (in.)ts thickness of side member, mm (in.)Z nominal single bolt design valueθ angle of load to grain (degrees)Re = Fem/Fes
k e
e
yb e4
2
21
2 1 2 2
3= − + + +
+( ) ( )RR
F R D
F tem s
Figure 7–15. Joint with split-ring connector showingconnector, precut groove, bolt, washer, and nut.
Figure 7–16. Joints with shear-plate connectorswith (A) wood side plates and (B) steel side plates.
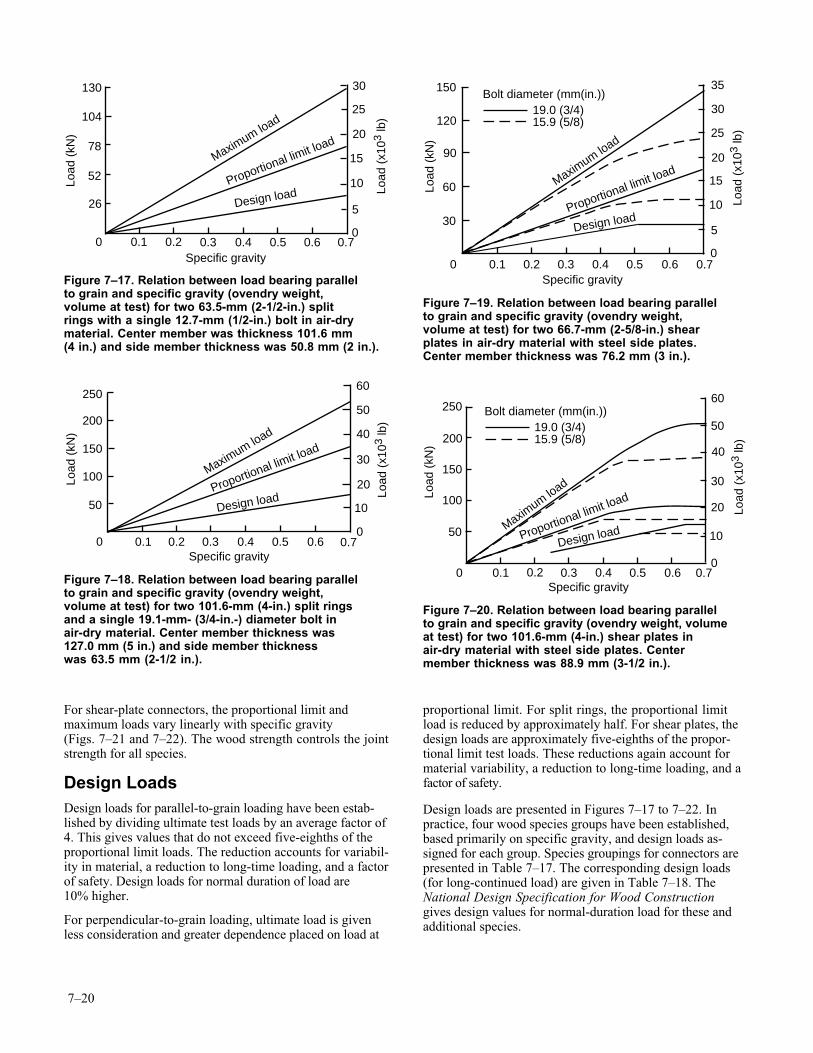
7–20
For shear-plate connectors, the proportional limit andmaximum loads vary linearly with specific gravity(Figs. 7–21 and 7–22). The wood strength controls the jointstrength for all species.
Design LoadsDesign loads for parallel-to-grain loading have been estab-lished by dividing ultimate test loads by an average factor of4. This gives values that do not exceed five-eighths of theproportional limit loads. The reduction accounts for variabil-ity in material, a reduction to long-time loading, and a factorof safety. Design loads for normal duration of load are10% higher.
For perpendicular-to-grain loading, ultimate load is givenless consideration and greater dependence placed on load at
proportional limit. For split rings, the proportional limitload is reduced by approximately half. For shear plates, thedesign loads are approximately five-eighths of the propor-tional limit test loads. These reductions again account formaterial variability, a reduction to long-time loading, and afactor of safety.
Design loads are presented in Figures 7–17 to 7–22. Inpractice, four wood species groups have been established,based primarily on specific gravity, and design loads as-signed for each group. Species groupings for connectors arepresented in Table 7–17. The corresponding design loads(for long-continued load) are given in Table 7–18. TheNational Design Specification for Wood Constructiongives design values for normal-duration load for these andadditional species.
130
Load
(kN
)
Maximum load
Proportional limit load
104
78
52
26
30
25
20
15
10
5
00 0.1 0.2 0.3 0.4 0.5 0.6 0.7
Specific gravity
Load
(x1
03 lb
)
Design load
Figure 7–17. Relation between load bearing parallelto grain and specific gravity (ovendry weight,volume at test) for two 63.5-mm (2-1/2-in.) splitrings with a single 12.7-mm (1/2-in.) bolt in air-drymaterial. Center member was thickness 101.6 mm(4 in.) and side member thickness was 50.8 mm (2 in.).
Load
(kN
)
Maximum load
Proportional limit load
30
20
10
0 0.1 0.2 0.3 0.4 0.5 0.6 0.7Specific gravity
Load
(x1
03 lb
)
0
60
50
40
250
200
150
100
50 Design load
Figure 7–18. Relation between load bearing parallelto grain and specific gravity (ovendry weight,volume at test) for two 101.6-mm (4-in.) split ringsand a single 19.1-mm- (3/4-in.-) diameter bolt inair-dry material. Center member thickness was127.0 mm (5 in.) and side member thicknesswas 63.5 mm (2-1/2 in.).
Load
(kN
)
20
15
5
0 0.1 0.2 0.3 0.4 0.5 0.6 0.7Specific gravity
Load
(x1
03 lb
)
0
35
30
25
150
120
90
60
3010
Maximum lo
ad
Proportional limit load
Design load
Bolt diameter (mm(in.))19.0 (3/4)15.9 (5/8)
Figure 7–19. Relation between load bearing parallelto grain and specific gravity (ovendry weight,volume at test) for two 66.7-mm (2-5/8-in.) shearplates in air-dry material with steel side plates.Center member thickness was 76.2 mm (3 in.).
Load
(kN
)
Maximum lo
ad
Proportional limit load
Design load
30
20
10
0.1 0.2 0.3 0.4 0.5 0.6 0.7Specific gravity
Load
(x1
03 lb
)
0
60
50
40
0
250
200
150
100
50
Bolt diameter (mm(in.))19.0 (3/4)15.9 (5/8)
Figure 7–20. Relation between load bearing parallelto grain and specific gravity (ovendry weight, volumeat test) for two 101.6-mm (4-in.) shear plates inair-dry material with steel side plates. Centermember thickness was 88.9 mm (3-1/2 in.).
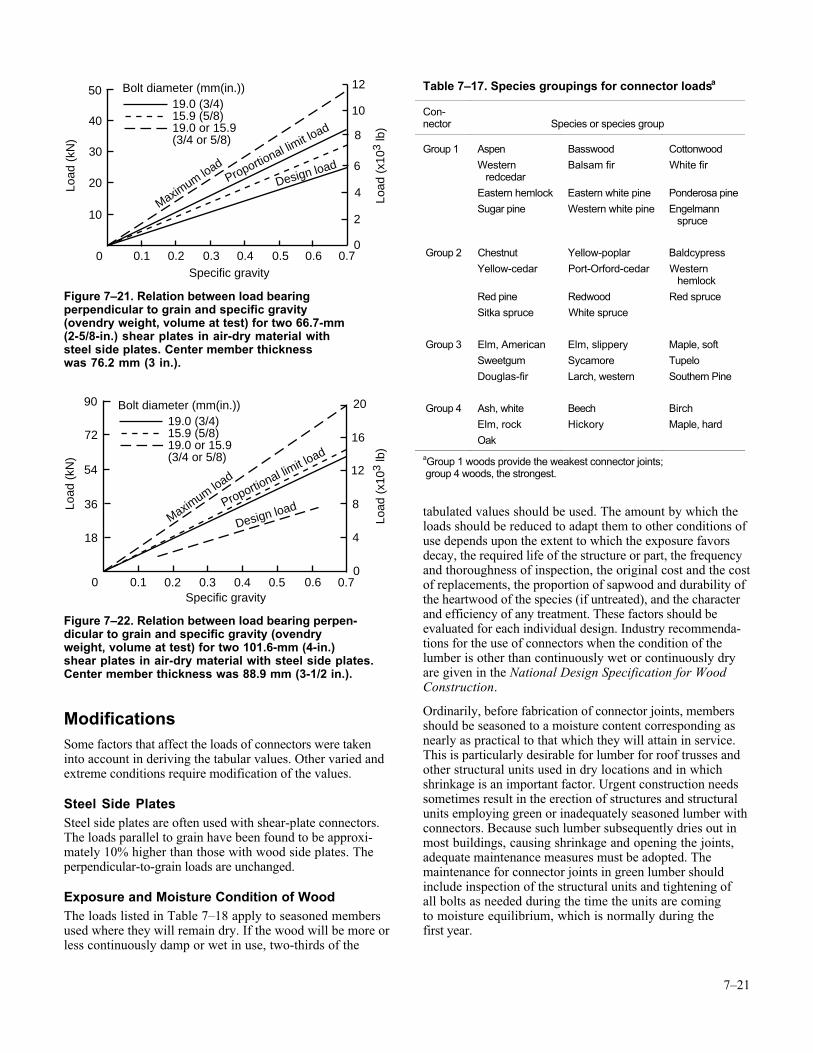
7–21
ModificationsSome factors that affect the loads of connectors were takeninto account in deriving the tabular values. Other varied andextreme conditions require modification of the values.
Steel Side PlatesSteel side plates are often used with shear-plate connectors.The loads parallel to grain have been found to be approxi-mately 10% higher than those with wood side plates. Theperpendicular-to-grain loads are unchanged.
Exposure and Moisture Condition of WoodThe loads listed in Table 7–18 apply to seasoned membersused where they will remain dry. If the wood will be more orless continuously damp or wet in use, two-thirds of the
tabulated values should be used. The amount by which theloads should be reduced to adapt them to other conditions ofuse depends upon the extent to which the exposure favorsdecay, the required life of the structure or part, the frequencyand thoroughness of inspection, the original cost and the costof replacements, the proportion of sapwood and durability ofthe heartwood of the species (if untreated), and the characterand efficiency of any treatment. These factors should beevaluated for each individual design. Industry recommenda-tions for the use of connectors when the condition of thelumber is other than continuously wet or continuously dryare given in the National Design Specification for WoodConstruction.
Ordinarily, before fabrication of connector joints, membersshould be seasoned to a moisture content corresponding asnearly as practical to that which they will attain in service.This is particularly desirable for lumber for roof trusses andother structural units used in dry locations and in whichshrinkage is an important factor. Urgent construction needssometimes result in the erection of structures and structuralunits employing green or inadequately seasoned lumber withconnectors. Because such lumber subsequently dries out inmost buildings, causing shrinkage and opening the joints,adequate maintenance measures must be adopted. Themaintenance for connector joints in green lumber shouldinclude inspection of the structural units and tightening ofall bolts as needed during the time the units are comingto moisture equilibrium, which is normally during thefirst year.
Load
(kN
)
6
4
2
0.1 0.2 0.3 0.4 0.5 0.6 0.7Specific gravity
Load
(x1
03 lb
)
0
12
10
8
0
50
40
30
20
10Maxim
um load
Proportional lim
it load
Design load
Bolt diameter (mm(in.))19.0 (3/4)15.9 (5/8)19.0 or 15.9(3/4 or 5/8)
Figure 7–21. Relation between load bearingperpendicular to grain and specific gravity(ovendry weight, volume at test) for two 66.7-mm(2-5/8-in.) shear plates in air-dry material withsteel side plates. Center member thicknesswas 76.2 mm (3 in.).
Load
(kN
)
0 0.1 0.2 0.3 0.4 0.5 0.6 0.7Specific gravity
Load
(x1
03 lb
)
90
72
54
36
18
8
4
0
20
16
12
Maximum lo
ad
Proportional lim
it load
Design load
Bolt diameter (mm(in.))19.0 (3/4)15.9 (5/8)19.0 or 15.9(3/4 or 5/8)
Figure 7–22. Relation between load bearing perpen-dicular to grain and specific gravity (ovendryweight, volume at test) for two 101.6-mm (4-in.)shear plates in air-dry material with steel side plates.Center member thickness was 88.9 mm (3-1/2 in.).
Table 7–17. Species groupings for connector loadsa
Con-nector Species or species group
Group 1 Aspen Basswood Cottonwood
Western redcedar
Balsam fir White fir
Eastern hemlock Eastern white pine Ponderosa pine
Sugar pine Western white pine Engelmann spruce
Group 2 Chestnut Yellow-poplar Baldcypress
Yellow-cedar Port-Orford-cedar Western hemlock
Red pine Redwood Red spruce
Sitka spruce White spruce
Group 3 Elm, American Elm, slippery Maple, soft
Sweetgum Sycamore Tupelo
Douglas-fir Larch, western Southern Pine
Group 4 Ash, white Beech Birch
Elm, rock Hickory Maple, hard
Oak
aGroup 1 woods provide the weakest connector joints; group 4 woods, the strongest.
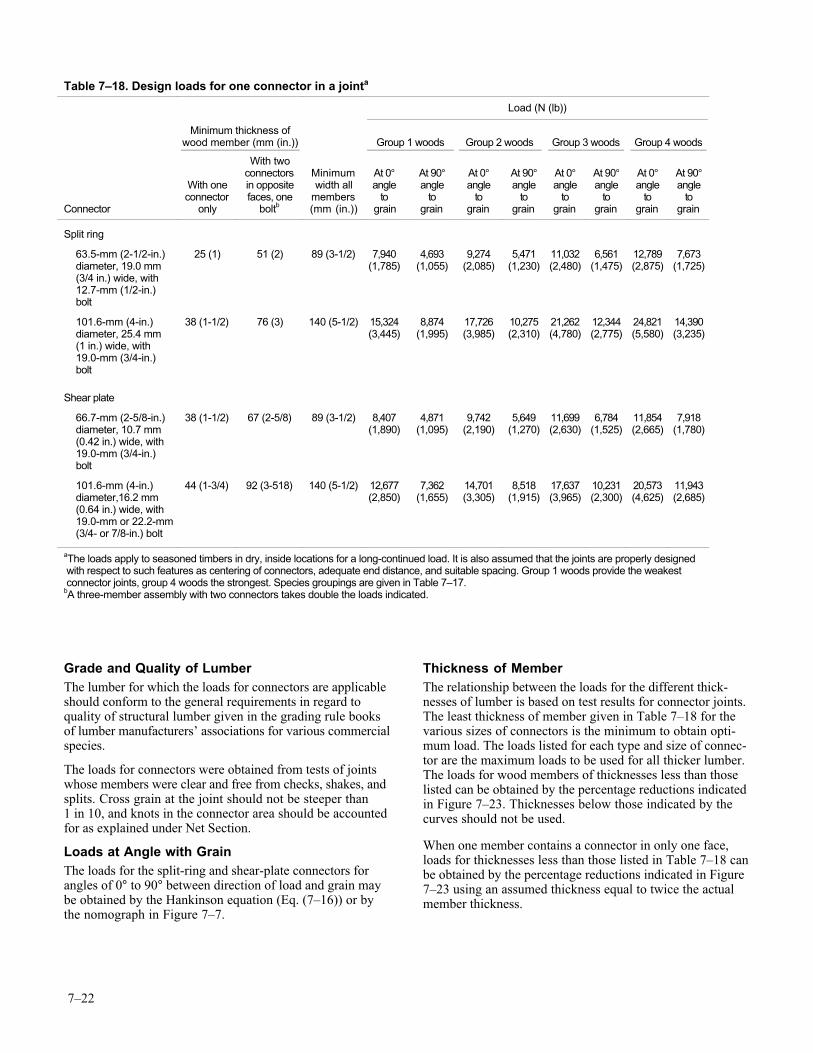
7–22
Grade and Quality of LumberThe lumber for which the loads for connectors are applicableshould conform to the general requirements in regard toquality of structural lumber given in the grading rule booksof lumber manufacturers’ associations for various commercialspecies.
The loads for connectors were obtained from tests of jointswhose members were clear and free from checks, shakes, andsplits. Cross grain at the joint should not be steeper than1 in 10, and knots in the connector area should be accountedfor as explained under Net Section.
Loads at Angle with GrainThe loads for the split-ring and shear-plate connectors forangles of 0° to 90° between direction of load and grain maybe obtained by the Hankinson equation (Eq. (7–16)) or bythe nomograph in Figure 7–7.
Thickness of MemberThe relationship between the loads for the different thick-nesses of lumber is based on test results for connector joints.The least thickness of member given in Table 7–18 for thevarious sizes of connectors is the minimum to obtain opti-mum load. The loads listed for each type and size of connec-tor are the maximum loads to be used for all thicker lumber.The loads for wood members of thicknesses less than thoselisted can be obtained by the percentage reductions indicatedin Figure 7–23. Thicknesses below those indicated by thecurves should not be used.
When one member contains a connector in only one face,loads for thicknesses less than those listed in Table 7–18 canbe obtained by the percentage reductions indicated in Figure7–23 using an assumed thickness equal to twice the actualmember thickness.
Table 7–18. Design loads for one connector in a jointa
Load (N (lb))
Minimum thickness ofwood member (mm (in.)) Group 1 woods Group 2 woods Group 3 woods Group 4 woods
Connector
With oneconnector
only
With twoconnectorsin oppositefaces, one
boltb
Minimumwidth all
members(mm (in.))
At 0°angle
tograin
At 90°angle
tograin
At 0°angle
tograin
At 90°angle
tograin
At 0°angle
tograin
At 90°angle
tograin
At 0°angle
tograin
At 90°angle
tograin
Split ring
63.5-mm (2-1/2-in.)diameter, 19.0 mm(3/4 in.) wide, with12.7-mm (1/2-in.)bolt
25 (1) 51 (2) 89 (3-1/2) 7,940(1,785)
4,693(1,055)
9,274(2,085)
5,471(1,230)
11,032(2,480)
6,561(1,475)
12,789(2,875)
7,673(1,725)
101.6-mm (4-in.)diameter, 25.4 mm(1 in.) wide, with19.0-mm (3/4-in.)bolt
38 (1-1/2) 76 (3) 140 (5-1/2) 15,324(3,445)
8,874(1,995)
17,726(3,985)
10,275(2,310)
21,262(4,780)
12,344(2,775)
24,821(5,580)
14,390(3,235)
Shear plate
66.7-mm (2-5/8-in.)diameter, 10.7 mm(0.42 in.) wide, with19.0-mm (3/4-in.)bolt
38 (1-1/2) 67 (2-5/8) 89 (3-1/2) 8,407(1,890)
4,871(1,095)
9,742(2,190)
5,649(1,270)
11,699(2,630)
6,784(1,525)
11,854(2,665)
7,918(1,780)
101.6-mm (4-in.)diameter,16.2 mm(0.64 in.) wide, with19.0-mm or 22.2-mm(3/4- or 7/8-in.) bolt
44 (1-3/4) 92 (3-518) 140 (5-1/2) 12,677(2,850)
7,362(1,655)
14,701(3,305)
8,518(1,915)
17,637(3,965)
10,231(2,300)
20,573(4,625)
11,943(2,685)
aThe loads apply to seasoned timbers in dry, inside locations for a long-continued load. It is also assumed that the joints are properly designed with respect to such features as centering of connectors, adequate end distance, and suitable spacing. Group 1 woods provide the weakest connector joints, group 4 woods the strongest. Species groupings are given in Table 7–17.bA three-member assembly with two connectors takes double the loads indicated.
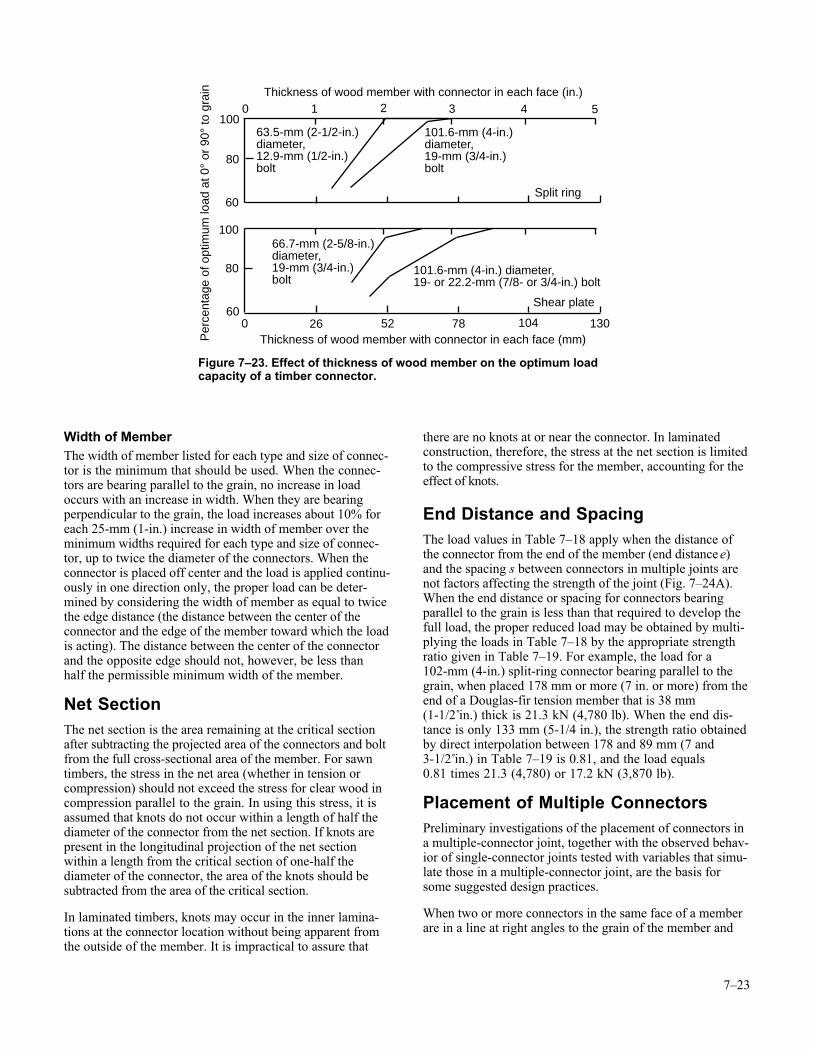
7–23
Width of MemberThe width of member listed for each type and size of connec-tor is the minimum that should be used. When the connec-tors are bearing parallel to the grain, no increase in loadoccurs with an increase in width. When they are bearingperpendicular to the grain, the load increases about 10% foreach 25-mm (1-in.) increase in width of member over theminimum widths required for each type and size of connec-tor, up to twice the diameter of the connectors. When theconnector is placed off center and the load is applied continu-ously in one direction only, the proper load can be deter-mined by considering the width of member as equal to twicethe edge distance (the distance between the center of theconnector and the edge of the member toward which the loadis acting). The distance between the center of the connectorand the opposite edge should not, however, be less thanhalf the permissible minimum width of the member.
Net SectionThe net section is the area remaining at the critical sectionafter subtracting the projected area of the connectors and boltfrom the full cross-sectional area of the member. For sawntimbers, the stress in the net area (whether in tension orcompression) should not exceed the stress for clear wood incompression parallel to the grain. In using this stress, it isassumed that knots do not occur within a length of half thediameter of the connector from the net section. If knots arepresent in the longitudinal projection of the net sectionwithin a length from the critical section of one-half thediameter of the connector, the area of the knots should besubtracted from the area of the critical section.
In laminated timbers, knots may occur in the inner lamina-tions at the connector location without being apparent fromthe outside of the member. It is impractical to assure that
there are no knots at or near the connector. In laminatedconstruction, therefore, the stress at the net section is limitedto the compressive stress for the member, accounting for theeffect of knots.
End Distance and SpacingThe load values in Table 7–18 apply when the distance ofthe connector from the end of the member (end distance e)and the spacing s between connectors in multiple joints arenot factors affecting the strength of the joint (Fig. 7–24A).When the end distance or spacing for connectors bearingparallel to the grain is less than that required to develop thefull load, the proper reduced load may be obtained by multi-plying the loads in Table 7–18 by the appropriate strengthratio given in Table 7–19. For example, the load for a102-mm (4-in.) split-ring connector bearing parallel to thegrain, when placed 178 mm or more (7 in. or more) from theend of a Douglas-fir tension member that is 38 mm(1-1/2 in.) thick is 21.3 kN (4,780 lb). When the end dis-tance is only 133 mm (5-1/4 in.), the strength ratio obtainedby direct interpolation between 178 and 89 mm (7 and3-1/2 in.) in Table 7–19 is 0.81, and the load equals0.81 times 21.3 (4,780) or 17.2 kN (3,870 lb).
Placement of Multiple ConnectorsPreliminary investigations of the placement of connectors ina multiple-connector joint, together with the observed behav-ior of single-connector joints tested with variables that simu-late those in a multiple-connector joint, are the basis forsome suggested design practices.
When two or more connectors in the same face of a memberare in a line at right angles to the grain of the member and
Per
cent
age
of o
ptim
um lo
ad a
t 0°
or 9
0° to
gra
in
Thickness of wood member with connector in each face (mm)
Thickness of wood member with connector in each face (in.)
0 26 52 78 104 130
0 1 2 3 4 5100
80
60
100
80
60
Split ring
Shear plate
101.6-mm (4-in.)diameter,19-mm (3/4-in.)bolt
66.7-mm (2-5/8-in.)diameter,19-mm (3/4-in.)bolt
101.6-mm (4-in.) diameter,19- or 22.2-mm (7/8- or 3/4-in.) bolt
63.5-mm (2-1/2-in.)diameter,12.9-mm (1/2-in.)bolt
Figure 7–23. Effect of thickness of wood member on the optimum loadcapacity of a timber connector.
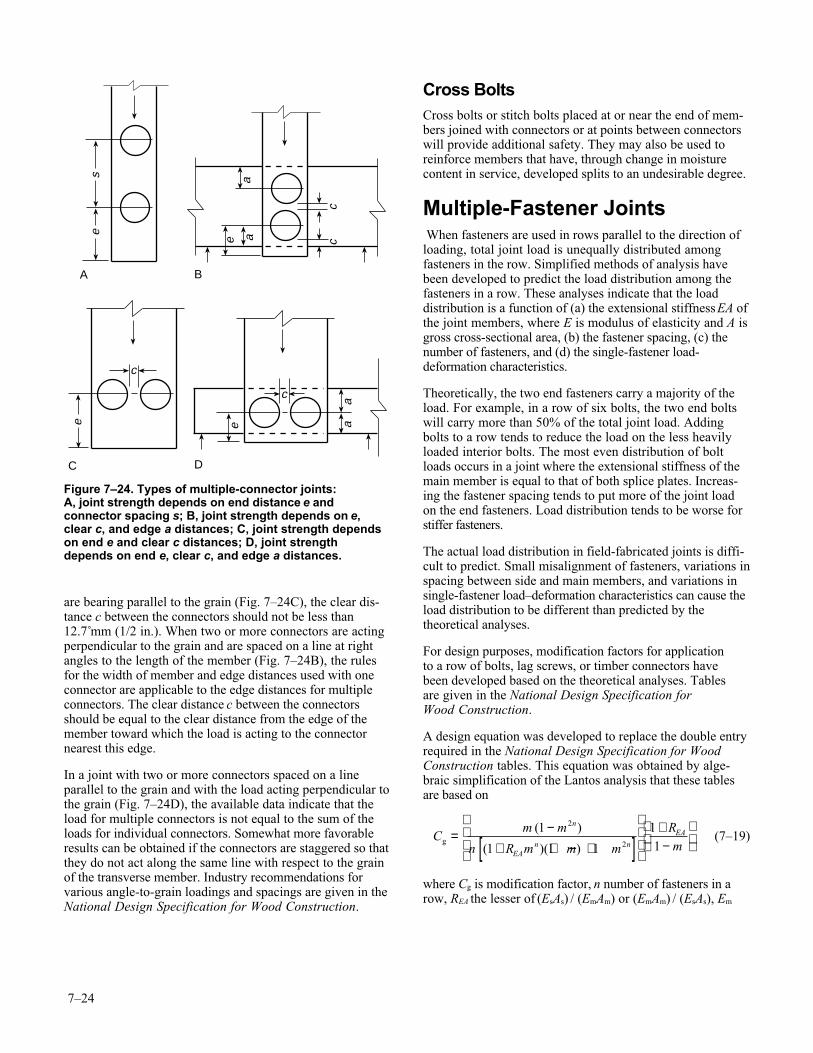
7–24
are bearing parallel to the grain (Fig. 7–24C), the clear dis-tance c between the connectors should not be less than12.7 mm (1/2 in.). When two or more connectors are actingperpendicular to the grain and are spaced on a line at rightangles to the length of the member (Fig. 7–24B), the rulesfor the width of member and edge distances used with oneconnector are applicable to the edge distances for multipleconnectors. The clear distance c between the connectorsshould be equal to the clear distance from the edge of themember toward which the load is acting to the connectornearest this edge.
In a joint with two or more connectors spaced on a lineparallel to the grain and with the load acting perpendicular tothe grain (Fig. 7–24D), the available data indicate that theload for multiple connectors is not equal to the sum of theloads for individual connectors. Somewhat more favorableresults can be obtained if the connectors are staggered so thatthey do not act along the same line with respect to the grainof the transverse member. Industry recommendations forvarious angle-to-grain loadings and spacings are given in theNational Design Specification for Wood Construction.
Cross BoltsCross bolts or stitch bolts placed at or near the end of mem-bers joined with connectors or at points between connectorswill provide additional safety. They may also be used toreinforce members that have, through change in moisturecontent in service, developed splits to an undesirable degree.
Multiple-Fastener Joints When fasteners are used in rows parallel to the direction ofloading, total joint load is unequally distributed amongfasteners in the row. Simplified methods of analysis havebeen developed to predict the load distribution among thefasteners in a row. These analyses indicate that the loaddistribution is a function of (a) the extensional stiffness EA ofthe joint members, where E is modulus of elasticity and A isgross cross-sectional area, (b) the fastener spacing, (c) thenumber of fasteners, and (d) the single-fastener load-deformation characteristics.
Theoretically, the two end fasteners carry a majority of theload. For example, in a row of six bolts, the two end boltswill carry more than 50% of the total joint load. Addingbolts to a row tends to reduce the load on the less heavilyloaded interior bolts. The most even distribution of boltloads occurs in a joint where the extensional stiffness of themain member is equal to that of both splice plates. Increas-ing the fastener spacing tends to put more of the joint loadon the end fasteners. Load distribution tends to be worse forstiffer fasteners.
The actual load distribution in field-fabricated joints is diffi-cult to predict. Small misalignment of fasteners, variations inspacing between side and main members, and variations insingle-fastener load–deformation characteristics can cause theload distribution to be different than predicted by thetheoretical analyses.
For design purposes, modification factors for applicationto a row of bolts, lag screws, or timber connectors havebeen developed based on the theoretical analyses. Tablesare given in the National Design Specification forWood Construction.
A design equation was developed to replace the double entryrequired in the National Design Specification for WoodConstruction tables. This equation was obtained by alge-braic simplification of the Lantos analysis that these tablesare based on
Cm m
n R m m m
Rm
n
EAn n
EAg = −
+ + − +[ ]
+−
( )
( )( )
1
1 1 1
11
2
2 (7–19)
where Cg is modification factor, n number of fasteners in arow, REA the lesser of (EsAs) / (EmAm) or (EmAm) / (EsAs), Em
c
e
c
aa
ee
cc
aae
s
A B
C D
Figure 7–24. Types of multiple-connector joints:A, joint strength depends on end distance e andconnector spacing s; B, joint strength depends on e,clear c, and edge a distances; C, joint strength dependson end e and clear c distances; D, joint strengthdepends on end e, clear c, and edge a distances.
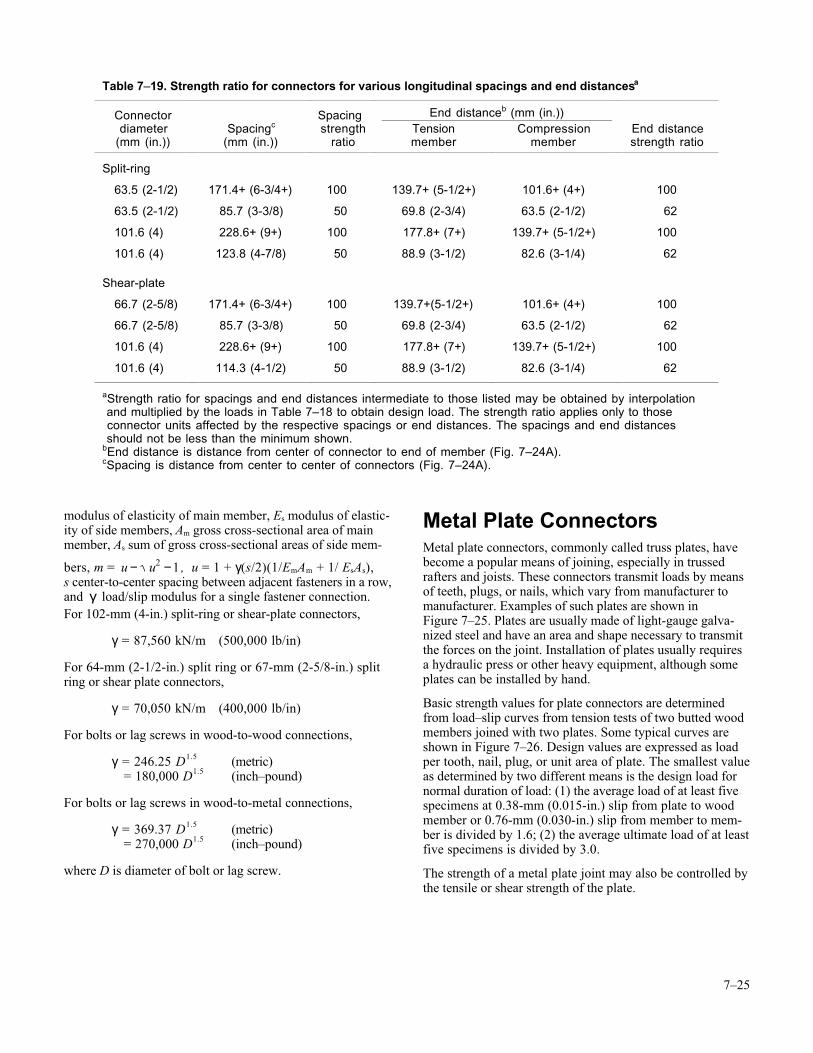
7–25
modulus of elasticity of main member, Es modulus of elastic-ity of side members, Am gross cross-sectional area of mainmember, As sum of gross cross-sectional areas of side mem-
bers, m = u u− −2 1 , u = 1 + γ(s/2)(1/EmAm + 1/ EsAs),s center-to-center spacing between adjacent fasteners in a row,and γ load/slip modulus for a single fastener connection.For 102-mm (4-in.) split-ring or shear-plate connectors,
γ = 87,560 kN/m (500,000 lb/in)
For 64-mm (2-1/2-in.) split ring or 67-mm (2-5/8-in.) splitring or shear plate connectors,
γ = 70,050 kN/m (400,000 lb/in)
For bolts or lag screws in wood-to-wood connections,
γ = 246.25 D1.5 (metric) = 180,000 D1.5 (inch–pound)
For bolts or lag screws in wood-to-metal connections,
γ = 369.37 D1.5 (metric) = 270,000 D1.5 (inch–pound)
where D is diameter of bolt or lag screw.
Metal Plate ConnectorsMetal plate connectors, commonly called truss plates, havebecome a popular means of joining, especially in trussedrafters and joists. These connectors transmit loads by meansof teeth, plugs, or nails, which vary from manufacturer tomanufacturer. Examples of such plates are shown inFigure 7–25. Plates are usually made of light-gauge galva-nized steel and have an area and shape necessary to transmitthe forces on the joint. Installation of plates usually requiresa hydraulic press or other heavy equipment, although someplates can be installed by hand.
Basic strength values for plate connectors are determinedfrom load–slip curves from tension tests of two butted woodmembers joined with two plates. Some typical curves areshown in Figure 7–26. Design values are expressed as loadper tooth, nail, plug, or unit area of plate. The smallest valueas determined by two different means is the design load fornormal duration of load: (1) the average load of at least fivespecimens at 0.38-mm (0.015-in.) slip from plate to woodmember or 0.76-mm (0.030-in.) slip from member to mem-ber is divided by 1.6; (2) the average ultimate load of at leastfive specimens is divided by 3.0.
The strength of a metal plate joint may also be controlled bythe tensile or shear strength of the plate.
Table 7–19. Strength ratio for connectors for various longitudinal spacings and end distancesa
Connector Spacing End distanceb (mm (in.))diameter
(mm (in.))Spacingc
(mm (in.))strength
ratioTensionmember
Compressionmember
End distancestrength ratio
Split-ring
63.5 (2-1/2) 171.4+ (6-3/4+) 100 139.7+ (5-1/2+) 101.6+ (4+) 100
63.5 (2-1/2) 85.7 (3-3/8) 50 69.8 (2-3/4) 63.5 (2-1/2) 62
101.6 (4) 228.6+ (9+) 100 177.8+ (7+) 139.7+ (5-1/2+) 100
101.6 (4) 123.8 (4-7/8) 50 88.9 (3-1/2) 82.6 (3-1/4) 62
Shear-plate
66.7 (2-5/8) 171.4+ (6-3/4+) 100 139.7+(5-1/2+) 101.6+ (4+) 100
66.7 (2-5/8) 85.7 (3-3/8) 50 69.8 (2-3/4) 63.5 (2-1/2) 62
101.6 (4) 228.6+ (9+) 100 177.8+ (7+) 139.7+ (5-1/2+) 100
101.6 (4) 114.3 (4-1/2) 50 88.9 (3-1/2) 82.6 (3-1/4) 62
aStrength ratio for spacings and end distances intermediate to those listed may be obtained by interpolation and multiplied by the loads in Table 7–18 to obtain design load. The strength ratio applies only to those connector units affected by the respective spacings or end distances. The spacings and end distances should not be less than the minimum shown.bEnd distance is distance from center of connector to end of member (Fig. 7–24A).cSpacing is distance from center to center of connectors (Fig. 7–24A).
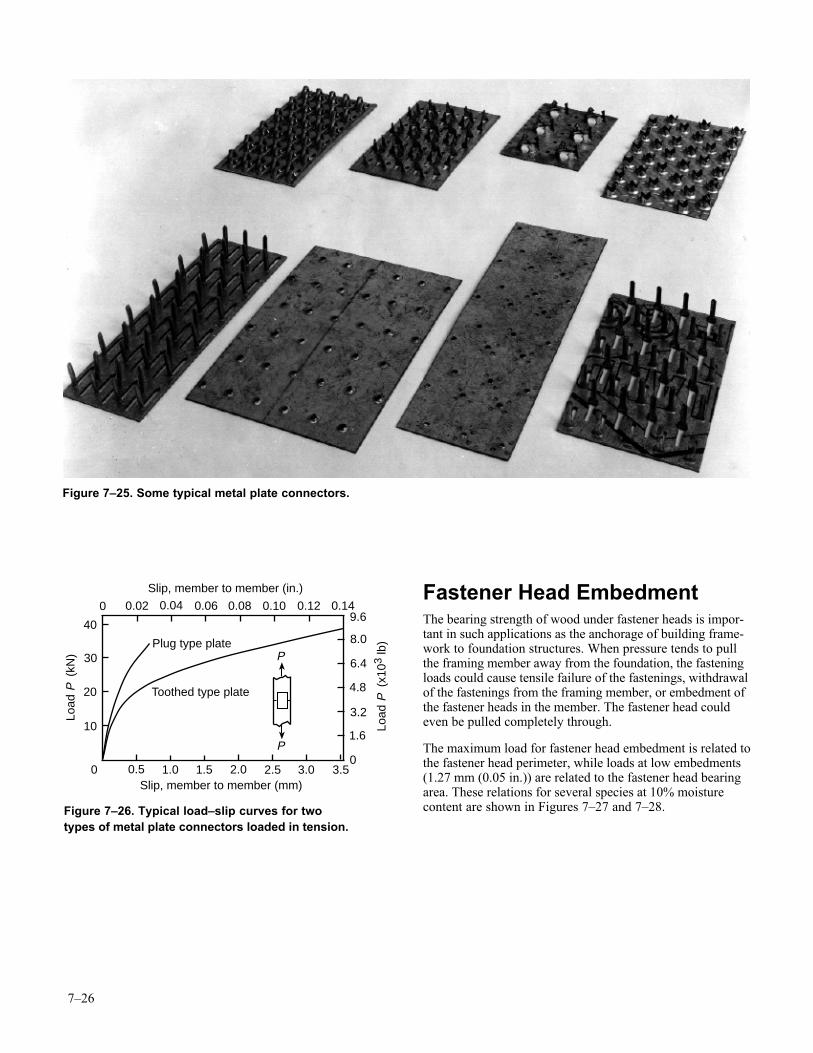
7–26
Fastener Head EmbedmentThe bearing strength of wood under fastener heads is impor-tant in such applications as the anchorage of building frame-work to foundation structures. When pressure tends to pullthe framing member away from the foundation, the fasteningloads could cause tensile failure of the fastenings, withdrawalof the fastenings from the framing member, or embedment ofthe fastener heads in the member. The fastener head couldeven be pulled completely through.
The maximum load for fastener head embedment is related tothe fastener head perimeter, while loads at low embedments(1.27 mm (0.05 in.)) are related to the fastener head bearingarea. These relations for several species at 10% moisturecontent are shown in Figures 7–27 and 7–28.
Figure 7–25. Some typical metal plate connectors.
40
30
20
10
0
9.6
8.0
6.4
4.8
3.2
1.6
0
0
0.5 1.0 1.5 2.0 2.5 3.0 3.5
Slip, member to member (in.)
Slip, member to member (mm)
0.02 0.04 0.06 0.08 0.10 0.12 0.14
Load
P (
kN)
Load
P (
x103
lb)
P
PPlug type plate
Toothed type plate
Figure 7–26. Typical load–slip curves for twotypes of metal plate connectors loaded in tension.
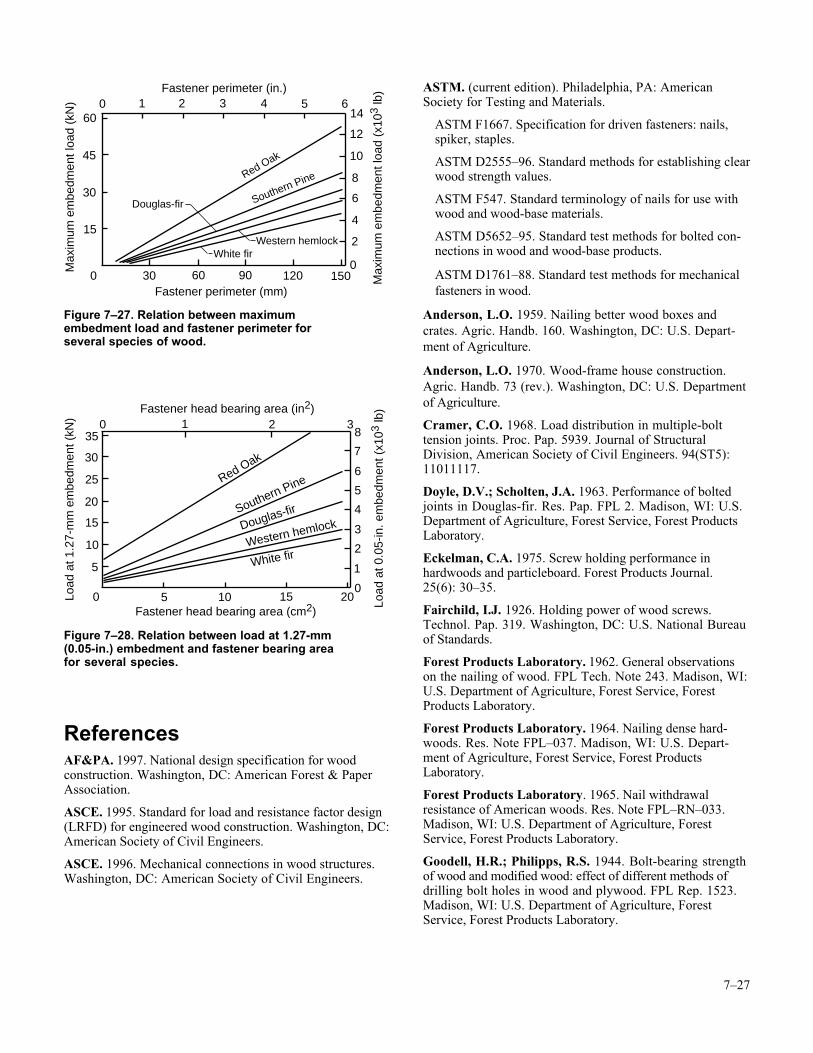
7–27
ReferencesAF&PA. 1997. National design specification for woodconstruction. Washington, DC: American Forest & PaperAssociation.
ASCE. 1995. Standard for load and resistance factor design(LRFD) for engineered wood construction. Washington, DC:American Society of Civil Engineers.
ASCE. 1996. Mechanical connections in wood structures.Washington, DC: American Society of Civil Engineers.
ASTM. (current edition). Philadelphia, PA: AmericanSociety for Testing and Materials.
ASTM F1667. Specification for driven fasteners: nails,spiker, staples.
ASTM D2555–96. Standard methods for establishing clearwood strength values.
ASTM F547. Standard terminology of nails for use withwood and wood-base materials.
ASTM D5652–95. Standard test methods for bolted con-nections in wood and wood-base products.
ASTM D1761–88. Standard test methods for mechanicalfasteners in wood.
Anderson, L.O. 1959. Nailing better wood boxes andcrates. Agric. Handb. 160. Washington, DC: U.S. Depart-ment of Agriculture.
Anderson, L.O. 1970. Wood-frame house construction.Agric. Handb. 73 (rev.). Washington, DC: U.S. Departmentof Agriculture.
Cramer, C.O. 1968. Load distribution in multiple-bolttension joints. Proc. Pap. 5939. Journal of StructuralDivision, American Society of Civil Engineers. 94(ST5):11011117.
Doyle, D.V.; Scholten, J.A. 1963. Performance of boltedjoints in Douglas-fir. Res. Pap. FPL 2. Madison, WI: U.S.Department of Agriculture, Forest Service, Forest ProductsLaboratory.
Eckelman, C.A. 1975. Screw holding performance inhardwoods and particleboard. Forest Products Journal.25(6): 30–35.
Fairchild, I.J. 1926. Holding power of wood screws.Technol. Pap. 319. Washington, DC: U.S. National Bureauof Standards.
Forest Products Laboratory. 1962. General observationson the nailing of wood. FPL Tech. Note 243. Madison, WI:U.S. Department of Agriculture, Forest Service, ForestProducts Laboratory.
Forest Products Laboratory. 1964. Nailing dense hard-woods. Res. Note FPL–037. Madison, WI: U.S. Depart-ment of Agriculture, Forest Service, Forest ProductsLaboratory.
Forest Products Laboratory. 1965. Nail withdrawalresistance of American woods. Res. Note FPL–RN–033.Madison, WI: U.S. Department of Agriculture, ForestService, Forest Products Laboratory.
Goodell, H.R.; Philipps, R.S. 1944. Bolt-bearing strengthof wood and modified wood: effect of different methods ofdrilling bolt holes in wood and plywood. FPL Rep. 1523.Madison, WI: U.S. Department of Agriculture, ForestService, Forest Products Laboratory.
0 30 60 90 120 150
0 1 2 3 4 5 6Fastener perimeter (in.)
Fastener perimeter (mm)
60
45
30
15
Max
imum
em
bedm
ent l
oad
(kN
)
Max
imum
em
bedm
ent l
oad
(x10
3 lb
)
14
12
10
8
6
4
2
0
Red Oak
Southern Pine
Western hemlockWhite fir
Douglas-fir
Figure 7–27. Relation between maximumembedment load and fastener perimeter forseveral species of wood.
0 5 10 15 20
8
7
6
5
4
3
2
1
0
0 2 3
Fastener head bearing area (cm2)
Fastener head bearing area (in2)
35
30
25
20
15
10
5
Load
at 1
.27-
mm
em
bedm
ent (
kN)
Load
at 0
.05-
in. e
mbe
dmen
t (x1
03 lb
)
Red Oak
Southern Pine
Douglas-fir
Western hemlock
White fir
1
Figure 7–28. Relation between load at 1.27-mm(0.05-in.) embedment and fastener bearing areafor several species.
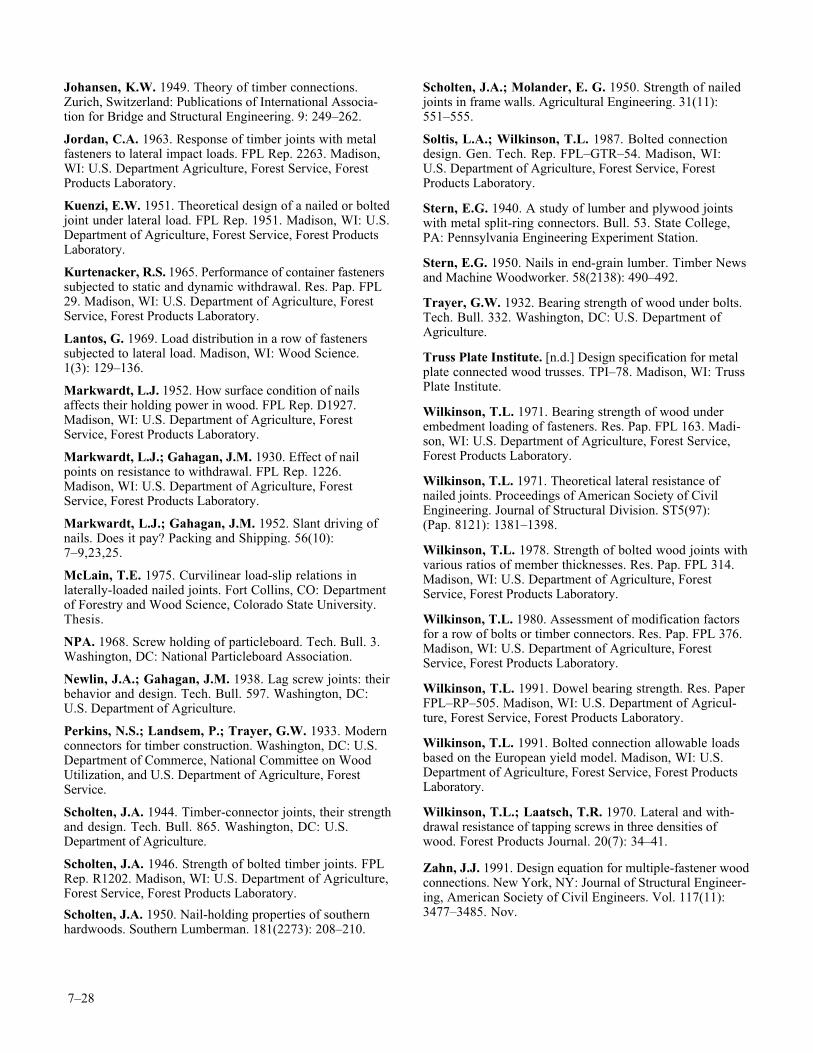
7–28
Johansen, K.W. 1949. Theory of timber connections.Zurich, Switzerland: Publications of International Associa-tion for Bridge and Structural Engineering. 9: 249–262.
Jordan, C.A. 1963. Response of timber joints with metalfasteners to lateral impact loads. FPL Rep. 2263. Madison,WI: U.S. Department Agriculture, Forest Service, ForestProducts Laboratory.
Kuenzi, E.W. 1951. Theoretical design of a nailed or boltedjoint under lateral load. FPL Rep. 1951. Madison, WI: U.S.Department of Agriculture, Forest Service, Forest ProductsLaboratory.
Kurtenacker, R.S. 1965. Performance of container fastenerssubjected to static and dynamic withdrawal. Res. Pap. FPL29. Madison, WI: U.S. Department of Agriculture, ForestService, Forest Products Laboratory.
Lantos, G. 1969. Load distribution in a row of fastenerssubjected to lateral load. Madison, WI: Wood Science.1(3): 129–136.
Markwardt, L.J. 1952. How surface condition of nailsaffects their holding power in wood. FPL Rep. D1927.Madison, WI: U.S. Department of Agriculture, ForestService, Forest Products Laboratory.
Markwardt, L.J.; Gahagan, J.M. 1930. Effect of nailpoints on resistance to withdrawal. FPL Rep. 1226.Madison, WI: U.S. Department of Agriculture, ForestService, Forest Products Laboratory.
Markwardt, L.J.; Gahagan, J.M. 1952. Slant driving ofnails. Does it pay? Packing and Shipping. 56(10):7–9,23,25.
McLain, T.E. 1975. Curvilinear load-slip relations inlaterally-loaded nailed joints. Fort Collins, CO: Departmentof Forestry and Wood Science, Colorado State University.Thesis.
NPA. 1968. Screw holding of particleboard. Tech. Bull. 3.Washington, DC: National Particleboard Association.
Newlin, J.A.; Gahagan, J.M. 1938. Lag screw joints: theirbehavior and design. Tech. Bull. 597. Washington, DC:U.S. Department of Agriculture.
Perkins, N.S.; Landsem, P.; Trayer, G.W. 1933. Modernconnectors for timber construction. Washington, DC: U.S.Department of Commerce, National Committee on WoodUtilization, and U.S. Department of Agriculture, ForestService.
Scholten, J.A. 1944. Timber-connector joints, their strengthand design. Tech. Bull. 865. Washington, DC: U.S.Department of Agriculture.
Scholten, J.A. 1946. Strength of bolted timber joints. FPLRep. R1202. Madison, WI: U.S. Department of Agriculture,Forest Service, Forest Products Laboratory.
Scholten, J.A. 1950. Nail-holding properties of southernhardwoods. Southern Lumberman. 181(2273): 208–210.
Scholten, J.A.; Molander, E. G. 1950. Strength of nailedjoints in frame walls. Agricultural Engineering. 31(11):551–555.
Soltis, L.A.; Wilkinson, T.L. 1987. Bolted connectiondesign. Gen. Tech. Rep. FPL–GTR–54. Madison, WI:U.S. Department of Agriculture, Forest Service, ForestProducts Laboratory.
Stern, E.G. 1940. A study of lumber and plywood jointswith metal split-ring connectors. Bull. 53. State College,PA: Pennsylvania Engineering Experiment Station.
Stern, E.G. 1950. Nails in end-grain lumber. Timber Newsand Machine Woodworker. 58(2138): 490–492.
Trayer, G.W. 1932. Bearing strength of wood under bolts.Tech. Bull. 332. Washington, DC: U.S. Department ofAgriculture.
Truss Plate Institute. [n.d.] Design specification for metalplate connected wood trusses. TPI–78. Madison, WI: TrussPlate Institute.
Wilkinson, T.L. 1971. Bearing strength of wood underembedment loading of fasteners. Res. Pap. FPL 163. Madi-son, WI: U.S. Department of Agriculture, Forest Service,Forest Products Laboratory.
Wilkinson, T.L. 1971. Theoretical lateral resistance ofnailed joints. Proceedings of American Society of CivilEngineering. Journal of Structural Division. ST5(97):(Pap. 8121): 1381–1398.
Wilkinson, T.L. 1978. Strength of bolted wood joints withvarious ratios of member thicknesses. Res. Pap. FPL 314.Madison, WI: U.S. Department of Agriculture, ForestService, Forest Products Laboratory.
Wilkinson, T.L. 1980. Assessment of modification factorsfor a row of bolts or timber connectors. Res. Pap. FPL 376.Madison, WI: U.S. Department of Agriculture, ForestService, Forest Products Laboratory.
Wilkinson, T.L. 1991. Dowel bearing strength. Res. PaperFPL–RP–505. Madison, WI: U.S. Department of Agricul-ture, Forest Service, Forest Products Laboratory.
Wilkinson, T.L. 1991. Bolted connection allowable loadsbased on the European yield model. Madison, WI: U.S.Department of Agriculture, Forest Service, Forest ProductsLaboratory.
Wilkinson, T.L.; Laatsch, T.R. 1970. Lateral and with-drawal resistance of tapping screws in three densities ofwood. Forest Products Journal. 20(7): 34–41.
Zahn, J.J. 1991. Design equation for multiple-fastener woodconnections. New York, NY: Journal of Structural Engineer-ing, American Society of Civil Engineers. Vol. 117(11):3477–3485. Nov.

FromForest Products Laboratory. 1999. Wood handbook—Wood as an engineering material.Gen. Tech. Rep. FPL–GTR–113. Madison, WI: U.S. Department of Agriculture, Forest Service,Forest Products Laboratory. 463 p.
8–1
Chapter 8Structural Analysi s EquationsLawrence A . Soltis
ContentsDeformation Equations 8–1
Axial Load 8–1
Bending 8–1
Combined Bending and Axial Load 8–3
Torsion 8–4
Stress Equations 8–4
Axial Load 8–4
Bending 8–4
Combined Bending and Axial Load 8–7
Torsion 8–8
Stability Equations 8–8
Axial Compression 8–8
Bending 8–9
Interaction of Buckling Modes 8–10
References 8–11
quations for deformation and stress, which are thebasis for tension members and beam and columndesign, are discussed in this chapter. The first two
sections cover tapered members, straight members, andspecial considerations such as notches, slits, and size effect.A third section presents stability criteria for members subjectto buckling and for members subject to special conditions.The equations are based on mechanics principles and are notgiven in the design code format found in Allowable StressDesign or Load and Resistance Factor Design specifications.
Deformation EquationsEquations for deformation of wood members are presented asfunctions of applied loads, moduli of elasticity and rigidity,and member dimensions. They may be solved to determineminimum required cross-sectional dimensions to meet de-formation limitations imposed in design. Average moduli ofelasticity and rigidity are given in Chapter 4. Considerationmust be given to variability in material properties and uncer-tainties in applied loads to control reliability of the design.
Axial LoadThe deformation of an axially loaded member is not usuallyan important design consideration. More important consid-erations will be presented in later sections dealing withcombined loads or stability. Axial load produces a change oflength given by
δ = PL
AE (8–1)
where δ is change of length, L length, A cross-sectional area,E modulus of elasticity (EL when grain runs parallel to mem-ber axis), and P axial force parallel to grain.
BendingStraight Beam DeflectionThe deflection of straight beams that are elastically stressedand have a constant cross section throughout their length isgiven by
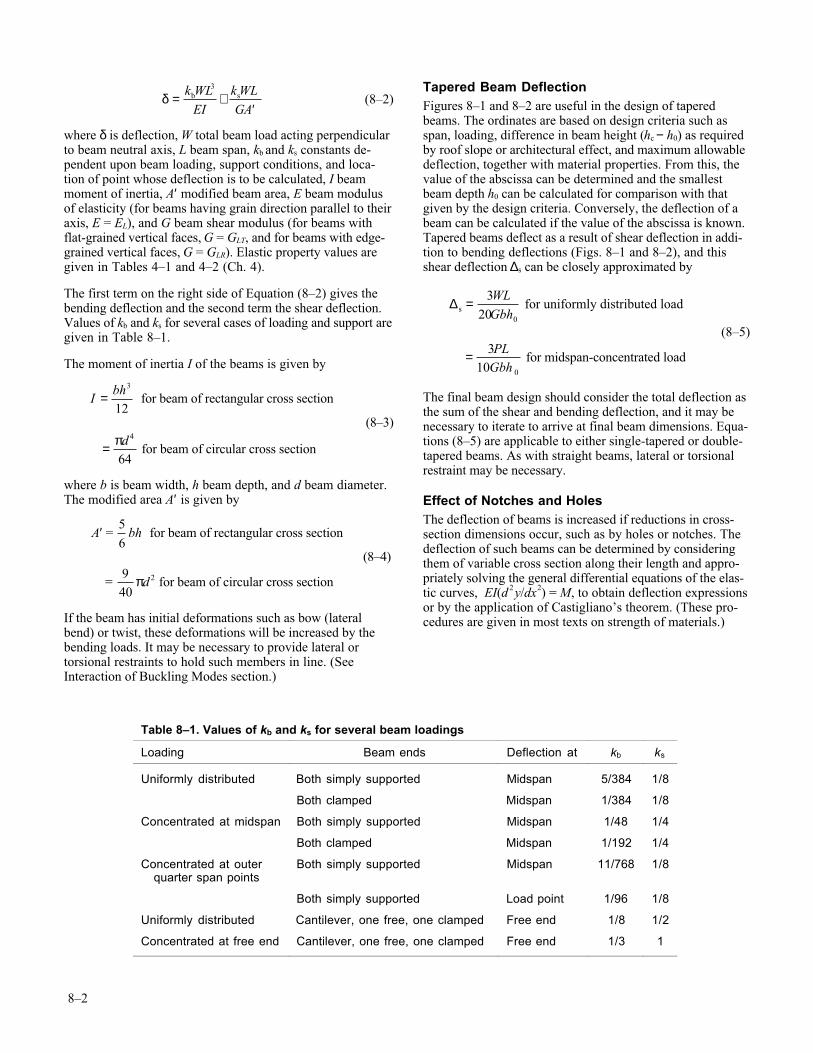
8–2
δ = +
′k WL
EI
k WL
GAb s
3
(8–2)
where δ is deflection, W total beam load acting perpendicularto beam neutral axis, L beam span, kb and ks constants de-pendent upon beam loading, support conditions, and loca-tion of point whose deflection is to be calculated, I beammoment of inertia, A′ modified beam area, E beam modulusof elasticity (for beams having grain direction parallel to theiraxis, E = EL), and G beam shear modulus (for beams withflat-grained vertical faces, G = GLT, and for beams with edge-grained vertical faces, G = GLR). Elastic property values aregiven in Tables 4–1 and 4–2 (Ch. 4).
The first term on the right side of Equation (8–2) gives thebending deflection and the second term the shear deflection.Values of kb and ks for several cases of loading and support aregiven in Table 8–1.
The moment of inertia I of the beams is given by
I
bh=3
12 for beam of rectangular cross section
(8–3)
= πd 4
64 for beam of circular cross section
where b is beam width, h beam depth, and d beam diameter.The modified area A′ is given by
′A = bh
5
6 for beam of rectangular cross section
(8–4)
= d
940
2π for beam of circular cross section
If the beam has initial deformations such as bow (lateralbend) or twist, these deformations will be increased by thebending loads. It may be necessary to provide lateral ortorsional restraints to hold such members in line. (SeeInteraction of Buckling Modes section.)
Tapered Beam DeflectionFigures 8–1 and 8–2 are useful in the design of taperedbeams. The ordinates are based on design criteria such asspan, loading, difference in beam height (hc − h0) as requiredby roof slope or architectural effect, and maximum allowabledeflection, together with material properties. From this, thevalue of the abscissa can be determined and the smallestbeam depth h0 can be calculated for comparison with thatgiven by the design criteria. Conversely, the deflection of abeam can be calculated if the value of the abscissa is known.Tapered beams deflect as a result of shear deflection in addi-tion to bending deflections (Figs. 8–1 and 8–2), and thisshear deflection ∆s can be closely approximated by
∆ s = 3
20 0
WL
Gbh for uniformly distributed load
(8–5)
= 3
10 0
PLGbh
for midspan-concentrated load
The final beam design should consider the total deflection asthe sum of the shear and bending deflection, and it may benecessary to iterate to arrive at final beam dimensions. Equa-tions (8–5) are applicable to either single-tapered or double-tapered beams. As with straight beams, lateral or torsionalrestraint may be necessary.
Effect of Notches and HolesThe deflection of beams is increased if reductions in cross-section dimensions occur, such as by holes or notches. Thedeflection of such beams can be determined by consideringthem of variable cross section along their length and appro-priately solving the general differential equations of the elas-tic curves, EI(d 2 y/dx 2) = M, to obtain deflection expressionsor by the application of Castigliano’s theorem. (These pro-cedures are given in most texts on strength of materials.)
Table 8–1. Values of kb and ks for several beam loadings
Loading Beam ends Deflection at kb ks
Uniformly distributed Both simply supported Midspan 5/384 1/8
Both clamped Midspan 1/384 1/8
Concentrated at midspan Both simply supported Midspan 1/48 1/4
Both clamped Midspan 1/192 1/4
Concentrated at outer quarter span points
Both simply supported Midspan 11/768 1/8
Both simply supported Load point 1/96 1/8
Uniformly distributed Cantilever, one free, one clamped Free end 1/8 1/2
Concentrated at free end Cantilever, one free, one clamped Free end 1/3 1
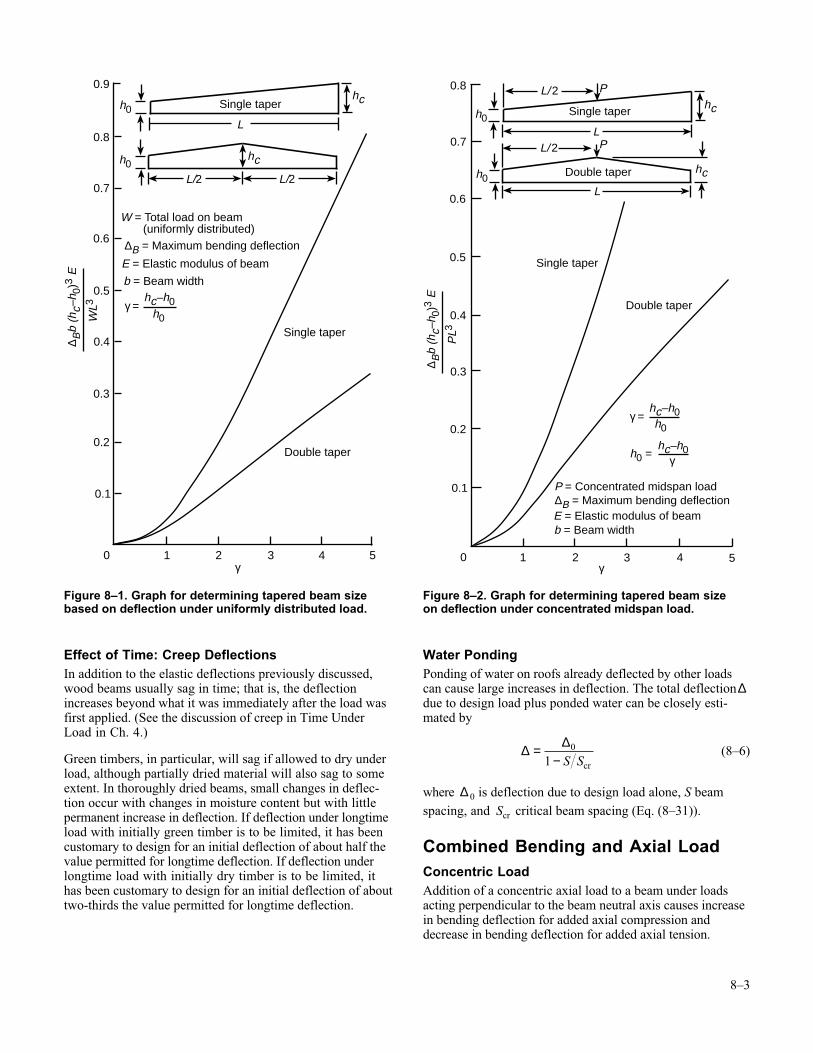
8–3
Effect of Time: Creep DeflectionsIn addition to the elastic deflections previously discussed,wood beams usually sag in time; that is, the deflectionincreases beyond what it was immediately after the load wasfirst applied. (See the discussion of creep in Time UnderLoad in Ch. 4.)
Green timbers, in particular, will sag if allowed to dry underload, although partially dried material will also sag to someextent. In thoroughly dried beams, small changes in deflec-tion occur with changes in moisture content but with littlepermanent increase in deflection. If deflection under longtimeload with initially green timber is to be limited, it has beencustomary to design for an initial deflection of about half thevalue permitted for longtime deflection. If deflection underlongtime load with initially dry timber is to be limited, ithas been customary to design for an initial deflection of abouttwo-thirds the value permitted for longtime deflection.
Water PondingPonding of water on roofs already deflected by other loadscan cause large increases in deflection. The total deflection ∆due to design load plus ponded water can be closely esti-mated by
∆ ∆=
−0
1 S Scr
(8–6)
where ∆ 0 is deflection due to design load alone, S beamspacing, and Scr critical beam spacing (Eq. (8–31)).
Combined Bending and Axial LoadConcentric LoadAddition of a concentric axial load to a beam under loadsacting perpendicular to the beam neutral axis causes increasein bending deflection for added axial compression anddecrease in bending deflection for added axial tension.
∆ Bb
(hc–
h 0)3
E
WL3
γ0 1 2 3 4 5
0.9
0.8
0.7
0.6
0.5
0.4
0.3
0.2
0.1
W = Total load on beam (uniformly distributed)
h0γ =
∆B = Maximum bending deflection
E = Elastic modulus of beam
b = Beam width
Single taperh0
L/2
L
Single taper
Double taper
hc
hc
h0
L/2
hc–h0
Figure 8–1. Graph for determining tapered beam sizebased on deflection under uniformly distributed load.
∆ Bb
(hc–
h 0)3
E
PL3
γ0
0.8
0.7
0.6
0.5
0.4
0.3
0.2
0.1
h0
Single taper
Double taper
hc
h0
Single taper
L
L/ 2
hc
L/ 2
∆B = Maximum bending deflectionE = Elastic modulus of beamb = Beam width
1 2 3 4 5
P
L
P
P = Concentrated midspan load
Double taper
hc–h0h0
h0 =
γ =
γhc–h0
Figure 8–2. Graph for determining tapered beam sizeon deflection under concentrated midspan load.
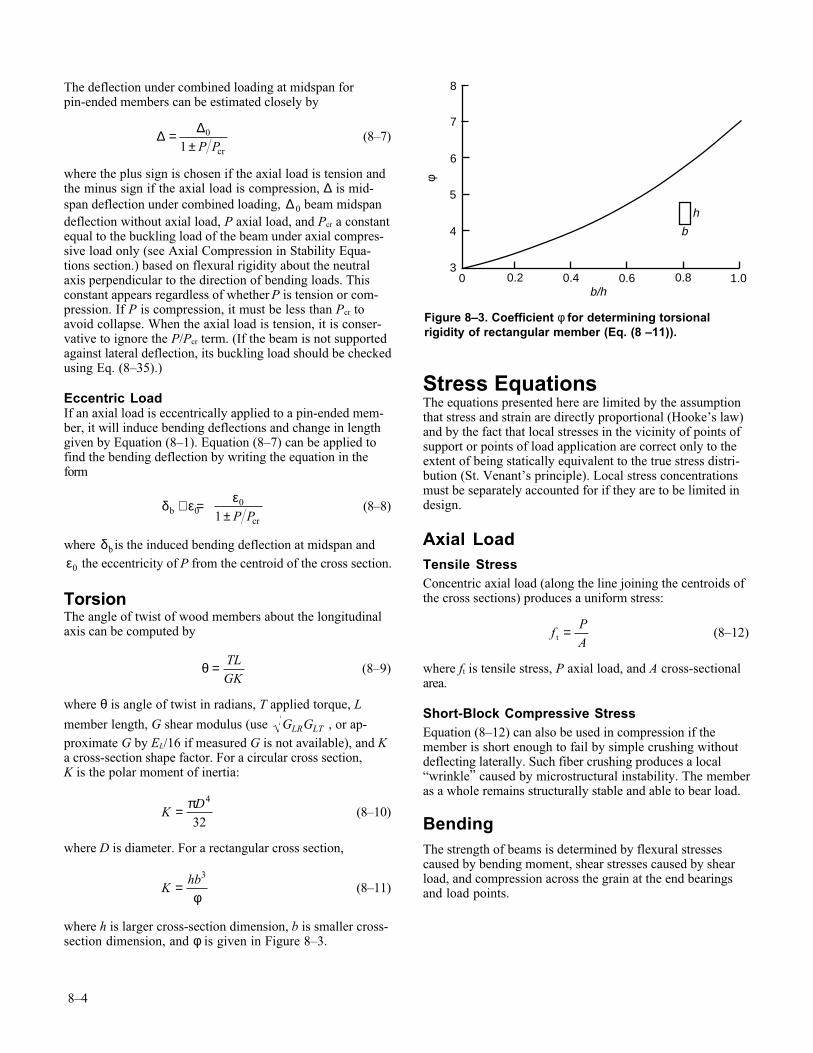
8–4
The deflection under combined loading at midspan forpin-ended members can be estimated closely by
∆ ∆=
±0
1 P Pcr
(8–7)
where the plus sign is chosen if the axial load is tension andthe minus sign if the axial load is compression, ∆ is mid-span deflection under combined loading, ∆ 0 beam midspandeflection without axial load, P axial load, and Pcr a constantequal to the buckling load of the beam under axial compres-sive load only (see Axial Compression in Stability Equa-tions section.) based on flexural rigidity about the neutralaxis perpendicular to the direction of bending loads. Thisconstant appears regardless of whether P is tension or com-pression. If P is compression, it must be less than Pcr toavoid collapse. When the axial load is tension, it is conser-vative to ignore the P/Pcr term. (If the beam is not supportedagainst lateral deflection, its buckling load should be checkedusing Eq. (8–35).)
Eccentric LoadIf an axial load is eccentrically applied to a pin-ended mem-ber, it will induce bending deflections and change in lengthgiven by Equation (8–1). Equation (8–7) can be applied tofind the bending deflection by writing the equation in theform
δ ε ε
bcr
+ =±0
0
1 P P(8–8)
where δb is the induced bending deflection at midspan and
ε0 the eccentricity of P from the centroid of the cross section.
TorsionThe angle of twist of wood members about the longitudinalaxis can be computed by
θ = TL
GK (8–9)
where θ is angle of twist in radians, T applied torque, L
member length, G shear modulus (use G GLR LT , or ap-proximate G by EL/16 if measured G is not available), and Ka cross-section shape factor. For a circular cross section,K is the polar moment of inertia:
K
D= π 4
32 (8–10)
where D is diameter. For a rectangular cross section,
K
hb=3
φ (8–11)
where h is larger cross-section dimension, b is smaller cross-section dimension, and φ is given in Figure 8–3.
Stress EquationsThe equations presented here are limited by the assumptionthat stress and strain are directly proportional (Hooke’s law)and by the fact that local stresses in the vicinity of points ofsupport or points of load application are correct only to theextent of being statically equivalent to the true stress distri-bution (St. Venant’s principle). Local stress concentrationsmust be separately accounted for if they are to be limited indesign.
Axial LoadTensile StressConcentric axial load (along the line joining the centroids ofthe cross sections) produces a uniform stress:
f
PAt = (8–12)
where ft is tensile stress, P axial load, and A cross-sectionalarea.
Short-Block Compressive StressEquation (8–12) can also be used in compression if themember is short enough to fail by simple crushing withoutdeflecting laterally. Such fiber crushing produces a local“wrinkle” caused by microstructural instability. The memberas a whole remains structurally stable and able to bear load.
BendingThe strength of beams is determined by flexural stressescaused by bending moment, shear stresses caused by shearload, and compression across the grain at the end bearingsand load points.
8
7
6
5
4
3
φ
0 0.2 0.4 0.6 0.8 1.0b/h
b
h
Figure 8–3. Coefficient φ for determining torsionalrigidity of rectangular member (Eq. (8 –11)).
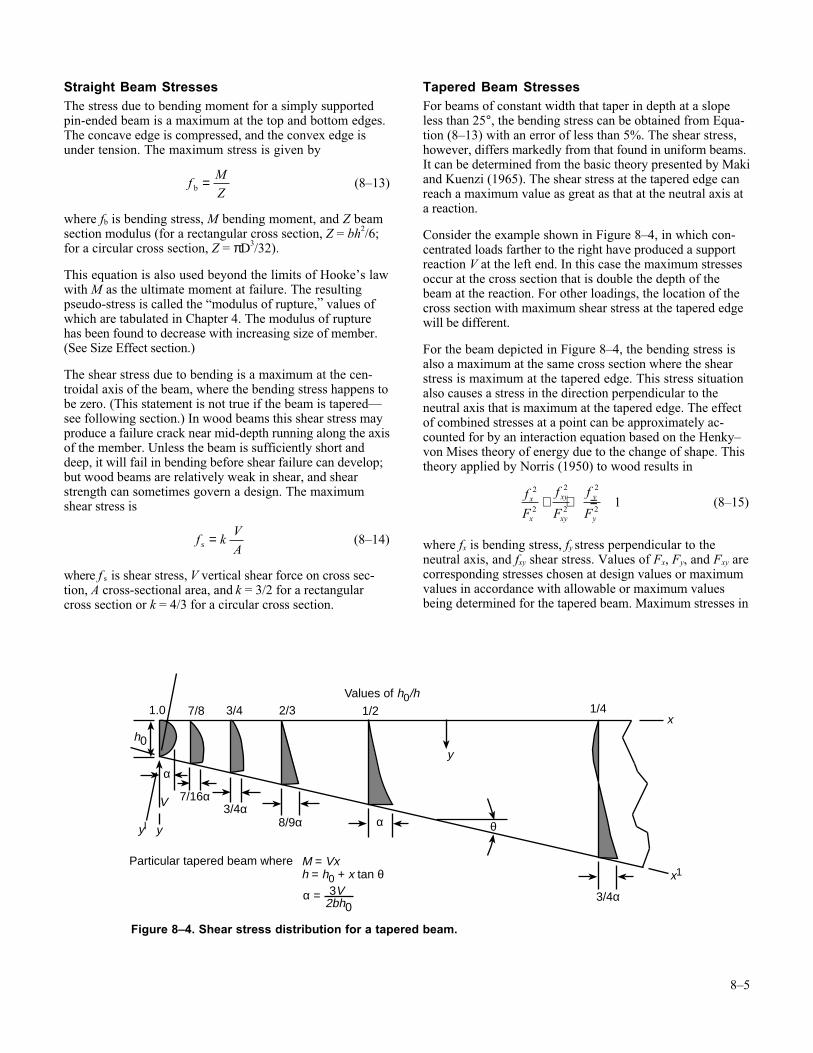
8–5
Straight Beam StressesThe stress due to bending moment for a simply supportedpin-ended beam is a maximum at the top and bottom edges.The concave edge is compressed, and the convex edge isunder tension. The maximum stress is given by
f
MZb = (8–13)
where fb is bending stress, M bending moment, and Z beamsection modulus (for a rectangular cross section, Z = bh2/6;for a circular cross section, Z = πD3/32).
This equation is also used beyond the limits of Hooke’s lawwith M as the ultimate moment at failure. The resultingpseudo-stress is called the “modulus of rupture,” values ofwhich are tabulated in Chapter 4. The modulus of rupturehas been found to decrease with increasing size of member.(See Size Effect section.)
The shear stress due to bending is a maximum at the cen-troidal axis of the beam, where the bending stress happens tobe zero. (This statement is not true if the beam is tapered—see following section.) In wood beams this shear stress mayproduce a failure crack near mid-depth running along the axisof the member. Unless the beam is sufficiently short anddeep, it will fail in bending before shear failure can develop;but wood beams are relatively weak in shear, and shearstrength can sometimes govern a design. The maximumshear stress is
f k
VAs = (8–14)
where f s is shear stress, V vertical shear force on cross sec-tion, A cross-sectional area, and k = 3/2 for a rectangularcross section or k = 4/3 for a circular cross section.
Tapered Beam StressesFor beams of constant width that taper in depth at a slopeless than 25°, the bending stress can be obtained from Equa-tion (8–13) with an error of less than 5%. The shear stress,however, differs markedly from that found in uniform beams.It can be determined from the basic theory presented by Makiand Kuenzi (1965). The shear stress at the tapered edge canreach a maximum value as great as that at the neutral axis ata reaction.
Consider the example shown in Figure 8–4, in which con-centrated loads farther to the right have produced a supportreaction V at the left end. In this case the maximum stressesoccur at the cross section that is double the depth of thebeam at the reaction. For other loadings, the location of thecross section with maximum shear stress at the tapered edgewill be different.
For the beam depicted in Figure 8–4, the bending stress isalso a maximum at the same cross section where the shearstress is maximum at the tapered edge. This stress situationalso causes a stress in the direction perpendicular to theneutral axis that is maximum at the tapered edge. The effectof combined stresses at a point can be approximately ac-counted for by an interaction equation based on the Henky–von Mises theory of energy due to the change of shape. Thistheory applied by Norris (1950) to wood results in
f
F
f
F
f
Fx
x
xy
xy
y
y
2
2
2
2
2
21+ + = (8–15)
where fx is bending stress, fy stress perpendicular to theneutral axis, and fxy shear stress. Values of Fx, Fy, and Fxy arecorresponding stresses chosen at design values or maximumvalues in accordance with allowable or maximum valuesbeing determined for the tapered beam. Maximum stresses in
Values of h0/h1.0 7/8 3/4 2/3 1/2 1/4
V 7/16α3/4α
8/9α
α
α
3/4αα = 3V2bh0
h0
M = Vxh = h0 + x tan θ
θyl y
Particular tapered beam where
y
x1
x
Figure 8–4. Shear stress distribution for a tapered beam.
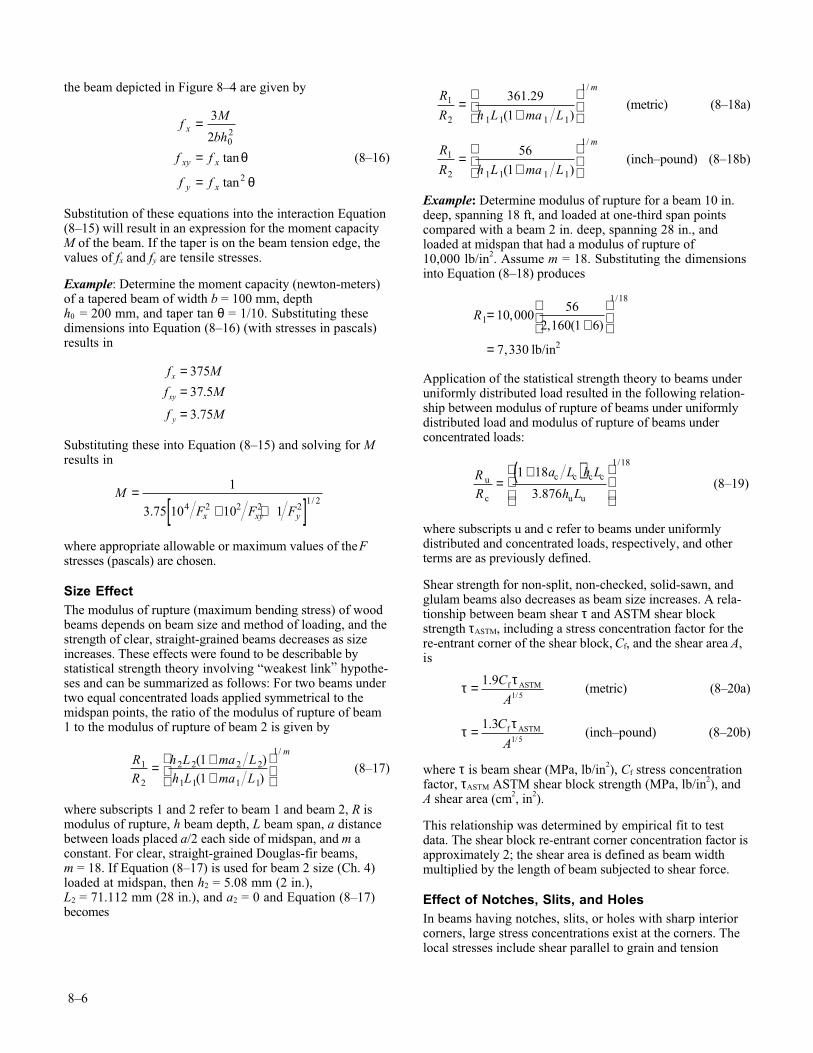
8–6
the beam depicted in Figure 8–4 are given by
fM
bh
f f
f f
x
xy x
y x
=
=
=
3
2 02
2
tan
tan
θ
θ
(8–16)
Substitution of these equations into the interaction Equation(8–15) will result in an expression for the moment capacityM of the beam. If the taper is on the beam tension edge, thevalues of fx and fy are tensile stresses.
Example: Determine the moment capacity (newton-meters)of a tapered beam of width b = 100 mm, depthh0 = 200 mm, and taper tan θ = 1/10. Substituting thesedimensions into Equation (8–16) (with stresses in pascals)results in
f M
f M
f M
x
xy
y
==
=
375
37 5
3 75
.
.
Substituting these into Equation (8–15) and solving for Mresults in
MF F Fx xy y
=+ +[ ]
1
3 75 10 10 14 2 2 2 21 2
./
where appropriate allowable or maximum values of the Fstresses (pascals) are chosen.
Size EffectThe modulus of rupture (maximum bending stress) of woodbeams depends on beam size and method of loading, and thestrength of clear, straight-grained beams decreases as sizeincreases. These effects were found to be describable bystatistical strength theory involving “weakest link” hypothe-ses and can be summarized as follows: For two beams undertwo equal concentrated loads applied symmetrical to themidspan points, the ratio of the modulus of rupture of beam1 to the modulus of rupture of beam 2 is given by
RR
h L ma Lh L ma L
m1
2
2 2 2 2
1 1 1 1
111
= ++
( )( )
/
(8–17)
where subscripts 1 and 2 refer to beam 1 and beam 2, R ismodulus of rupture, h beam depth, L beam span, a distancebetween loads placed a/2 each side of midspan, and m aconstant. For clear, straight-grained Douglas-fir beams,m = 18. If Equation (8–17) is used for beam 2 size (Ch. 4)loaded at midspan, then h2 = 5.08 mm (2 in.),L2 = 71.112 mm (28 in.), and a2 = 0 and Equation (8–17)becomes
R
R h L ma L
m1
2 1 1 1 1
1361 29
1=
+
.
( )
/
(metric) (8–18a)
R
R h L ma L
m1
2 1 1 1 1
156
1=
+
( )
/
(inch–pound) (8–18b)
Example: Determine modulus of rupture for a beam 10 in.deep, spanning 18 ft, and loaded at one-third span pointscompared with a beam 2 in. deep, spanning 28 in., andloaded at midspan that had a modulus of rupture of10,000 lb/in2. Assume m = 18. Substituting the dimensionsinto Equation (8–18) produces
R1
1 18
10 00056
2 160 1 6
7 330
=+
=
,, ( )
,
/
lb/in2
Application of the statistical strength theory to beams underuniformly distributed load resulted in the following relation-ship between modulus of rupture of beams under uniformlydistributed load and modulus of rupture of beams underconcentrated loads:
RR
a L h L
h Lu
c
c c c c
u u
=+( )
1 18
3 876
1 18
.
/
(8–19)
where subscripts u and c refer to beams under uniformlydistributed and concentrated loads, respectively, and otherterms are as previously defined.
Shear strength for non-split, non-checked, solid-sawn, andglulam beams also decreases as beam size increases. A rela-tionship between beam shear τ and ASTM shear blockstrength τASTM, including a stress concentration factor for there-entrant corner of the shear block, Cf, and the shear area A,is
τ τ= 1 9
1 5
./
C
Af ASTM (metric) (8–20a)
τ τ= 1 3
1 5
./
C
Af ASTM (inch–pound) (8–20b)
where τ is beam shear (MPa, lb/in2), Cf stress concentrationfactor, τASTM ASTM shear block strength (MPa, lb/in2), andA shear area (cm2, in2).
This relationship was determined by empirical fit to testdata. The shear block re-entrant corner concentration factor isapproximately 2; the shear area is defined as beam widthmultiplied by the length of beam subjected to shear force.
Effect of Notches, Slits, and HolesIn beams having notches, slits, or holes with sharp interiorcorners, large stress concentrations exist at the corners. Thelocal stresses include shear parallel to grain and tension
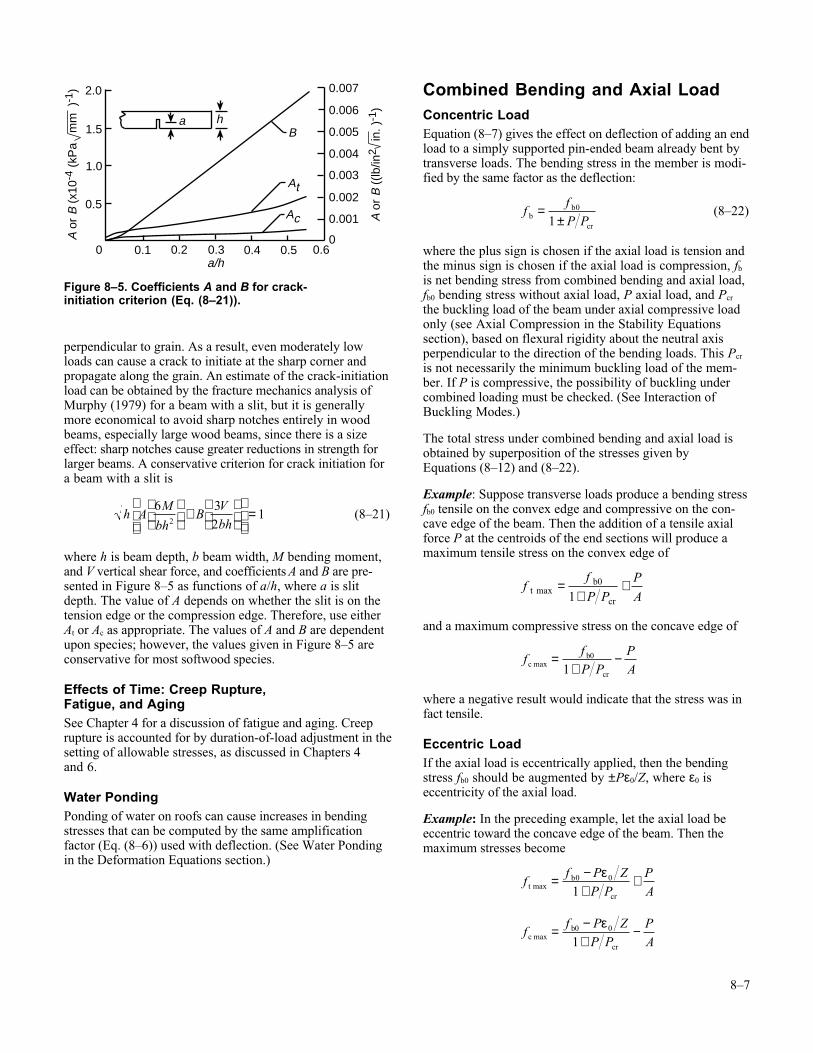
8–7
perpendicular to grain. As a result, even moderately lowloads can cause a crack to initiate at the sharp corner andpropagate along the grain. An estimate of the crack-initiationload can be obtained by the fracture mechanics analysis ofMurphy (1979) for a beam with a slit, but it is generallymore economical to avoid sharp notches entirely in woodbeams, especially large wood beams, since there is a sizeeffect: sharp notches cause greater reductions in strength forlarger beams. A conservative criterion for crack initiation fora beam with a slit is
h A
M
bhB
Vbh
6 32
12
+
= (8–21)
where h is beam depth, b beam width, M bending moment,and V vertical shear force, and coefficients A and B are pre-sented in Figure 8–5 as functions of a/h, where a is slitdepth. The value of A depends on whether the slit is on thetension edge or the compression edge. Therefore, use eitherAt or Ac as appropriate. The values of A and B are dependentupon species; however, the values given in Figure 8–5 areconservative for most softwood species.
Effects of Time: Creep Rupture,Fatigue, and AgingSee Chapter 4 for a discussion of fatigue and aging. Creeprupture is accounted for by duration-of-load adjustment in thesetting of allowable stresses, as discussed in Chapters 4and 6.
Water PondingPonding of water on roofs can cause increases in bendingstresses that can be computed by the same amplificationfactor (Eq. (8–6)) used with deflection. (See Water Pondingin the Deformation Equations section.)
Combined Bending and Axial LoadConcentric LoadEquation (8–7) gives the effect on deflection of adding an endload to a simply supported pin-ended beam already bent bytransverse loads. The bending stress in the member is modi-fied by the same factor as the deflection:
f
fP Pb
b
cr
=±
0
1 (8–22)
where the plus sign is chosen if the axial load is tension andthe minus sign is chosen if the axial load is compression, fb
is net bending stress from combined bending and axial load,fb0 bending stress without axial load, P axial load, and Pcr
the buckling load of the beam under axial compressive loadonly (see Axial Compression in the Stability Equationssection), based on flexural rigidity about the neutral axisperpendicular to the direction of the bending loads. This Pcr
is not necessarily the minimum buckling load of the mem-ber. If P is compressive, the possibility of buckling undercombined loading must be checked. (See Interaction ofBuckling Modes.)
The total stress under combined bending and axial load isobtained by superposition of the stresses given byEquations (8–12) and (8–22).
Example: Suppose transverse loads produce a bending stressfb0 tensile on the convex edge and compressive on the con-cave edge of the beam. Then the addition of a tensile axialforce P at the centroids of the end sections will produce amaximum tensile stress on the convex edge of
f
f
P P
P
Atb
crmax =
++0
1
and a maximum compressive stress on the concave edge of
f
fP P
PAc
b
crmax =
+−0
1
where a negative result would indicate that the stress was infact tensile.
Eccentric LoadIf the axial load is eccentrically applied, then the bendingstress fb0 should be augmented by ±Pε0/Z, where ε0 iseccentricity of the axial load.
Example: In the preceding example, let the axial load beeccentric toward the concave edge of the beam. Then themaximum stresses become
f
f P ZP P
PAt
b
crmax = −
++0 0
1ε
f
f P ZP P
PAc
b
crmax = −
+−0
1ε0
0.0072.0
B
At
Ac
1.5
1.0
0.5
0
ha
0.1 0.2 0.3 0.4 0.5 0.6a/h
A o
r B
(x1
0-4
(kP
a m
m )
-1)
0.006
0.005
0.004
0.003
0.002
0.001
0
A o
r B
((lb
/in2
in.
)-1
)
Figure 8–5. Coefficients A and B for crack-initiation criterion (Eq. (8–21)).
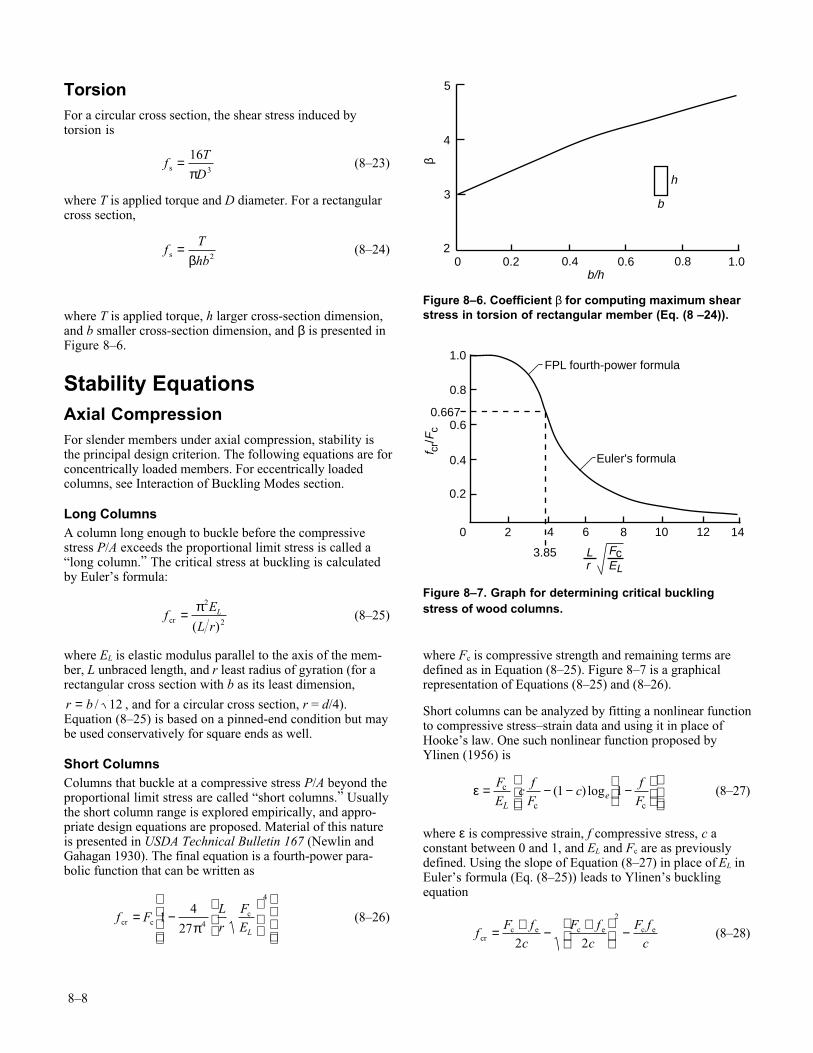
8–8
TorsionFor a circular cross section, the shear stress induced bytorsion is
f
T
Ds = 16
3π (8–23)
where T is applied torque and D diameter. For a rectangularcross section,
f
T
hbs =
β 2 (8–24)
where T is applied torque, h larger cross-section dimension,and b smaller cross-section dimension, and β is presented inFigure 8–6.
Stability EquationsAxial CompressionFor slender members under axial compression, stability isthe principal design criterion. The following equations are forconcentrically loaded members. For eccentrically loadedcolumns, see Interaction of Buckling Modes section.
Long ColumnsA column long enough to buckle before the compressivestress P/A exceeds the proportional limit stress is called a“long column.” The critical stress at buckling is calculatedby Euler’s formula:
f
E
L rL
cr 2( )= π2
(8–25)
where EL is elastic modulus parallel to the axis of the mem-ber, L unbraced length, and r least radius of gyration (for arectangular cross section with b as its least dimension,
r b= / 12 , and for a circular cross section, r = d/4).Equation (8–25) is based on a pinned-end condition but maybe used conservatively for square ends as well.
Short ColumnsColumns that buckle at a compressive stress P/A beyond theproportional limit stress are called “short columns.” Usuallythe short column range is explored empirically, and appro-priate design equations are proposed. Material of this natureis presented in USDA Technical Bulletin 167 (Newlin andGahagan 1930). The final equation is a fourth-power para-bolic function that can be written as
f FLr
FEL
cr cc= −
14
27 4
4
π (8–26)
where Fc is compressive strength and remaining terms aredefined as in Equation (8–25). Figure 8–7 is a graphicalrepresentation of Equations (8–25) and (8–26).
Short columns can be analyzed by fitting a nonlinear functionto compressive stress–strain data and using it in place ofHooke’s law. One such nonlinear function proposed byYlinen (1956) is
ε = − − −
FE
cf
Fc
fFL
ec
cc
( ) log1 1 (8–27)
where ε is compressive strain, f compressive stress, c aconstant between 0 and 1, and EL and Fc are as previouslydefined. Using the slope of Equation (8–27) in place of EL inEuler’s formula (Eq. (8–25)) leads to Ylinen’s bucklingequation
f
F fc
F fc
F fccr
c e c e c e= + − +
−2 2
2
(8–28)
5
4
3
20 0.2 0.4 0.80.6 1.0
b/h
h
b
β
Figure 8–6. Coefficient β for computing maximum shearstress in torsion of rectangular member (Eq. (8 –24)).
1.0
0.8
0.6670.6
0.4
0.2
0 2 4 6 8 10 12 14
3.85
FPL fourth-power formula
Euler's formula
f cr/F
c
FcEL
Lr
Figure 8–7. Graph for determining critical bucklingstress of wood columns.
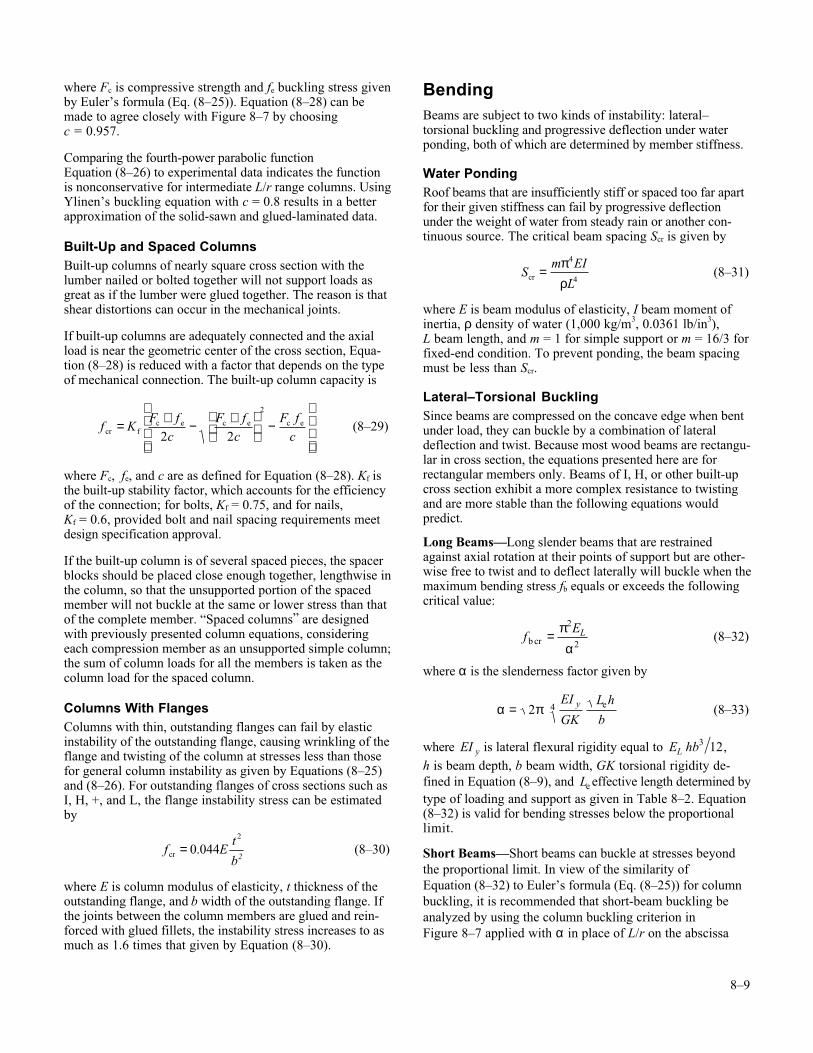
8–9
where Fc is compressive strength and fe buckling stress givenby Euler’s formula (Eq. (8–25)). Equation (8–28) can bemade to agree closely with Figure 8–7 by choosingc = 0.957.
Comparing the fourth-power parabolic functionEquation (8–26) to experimental data indicates the functionis nonconservative for intermediate L/r range columns. UsingYlinen’s buckling equation with c = 0.8 results in a betterapproximation of the solid-sawn and glued-laminated data.
Built-Up and Spaced ColumnsBuilt-up columns of nearly square cross section with thelumber nailed or bolted together will not support loads asgreat as if the lumber were glued together. The reason is thatshear distortions can occur in the mechanical joints.
If built-up columns are adequately connected and the axialload is near the geometric center of the cross section, Equa-tion (8–28) is reduced with a factor that depends on the typeof mechanical connection. The built-up column capacity is
f KF f
cF f
cF f
ccrc e c e c e= + − +
−
f 2 2
2
(8–29)
where Fc, fe, and c are as defined for Equation (8–28). Kf isthe built-up stability factor, which accounts for the efficiencyof the connection; for bolts, Kf = 0.75, and for nails,Kf = 0.6, provided bolt and nail spacing requirements meetdesign specification approval.
If the built-up column is of several spaced pieces, the spacerblocks should be placed close enough together, lengthwise inthe column, so that the unsupported portion of the spacedmember will not buckle at the same or lower stress than thatof the complete member. “Spaced columns” are designedwith previously presented column equations, consideringeach compression member as an unsupported simple column;the sum of column loads for all the members is taken as thecolumn load for the spaced column.
Columns With FlangesColumns with thin, outstanding flanges can fail by elasticinstability of the outstanding flange, causing wrinkling of theflange and twisting of the column at stresses less than thosefor general column instability as given by Equations (8–25)and (8–26). For outstanding flanges of cross sections such asI, H, +, and L, the flange instability stress can be estimatedby
f E
t
b2cr = 0 0442
. (8–30)
where E is column modulus of elasticity, t thickness of theoutstanding flange, and b width of the outstanding flange. Ifthe joints between the column members are glued and rein-forced with glued fillets, the instability stress increases to asmuch as 1.6 times that given by Equation (8–30).
BendingBeams are subject to two kinds of instability: lateral–torsional buckling and progressive deflection under waterponding, both of which are determined by member stiffness.
Water PondingRoof beams that are insufficiently stiff or spaced too far apartfor their given stiffness can fail by progressive deflectionunder the weight of water from steady rain or another con-tinuous source. The critical beam spacing Scr is given by
S
m EI
Lcr =
πρ
4
4 (8–31)
where E is beam modulus of elasticity, I beam moment ofinertia, ρ density of water (1,000 kg/m3, 0.0361 lb/in3),L beam length, and m = 1 for simple support or m = 16/3 forfixed-end condition. To prevent ponding, the beam spacingmust be less than Scr.
Lateral–Torsional BucklingSince beams are compressed on the concave edge when bentunder load, they can buckle by a combination of lateraldeflection and twist. Because most wood beams are rectangu-lar in cross section, the equations presented here are forrectangular members only. Beams of I, H, or other built-upcross section exhibit a more complex resistance to twistingand are more stable than the following equations wouldpredict.
Long Beams—Long slender beams that are restrainedagainst axial rotation at their points of support but are other-wise free to twist and to deflect laterally will buckle when themaximum bending stress fb equals or exceeds the followingcritical value:
f
ELb cr = π
α
2
2 (8–32)
where α is the slenderness factor given by
α π= 2 4
EI
GK
L h
by e (8–33)
where EI y is lateral flexural rigidity equal to E hbL3 12,
h is beam depth, b beam width, GK torsional rigidity de-fined in Equation (8–9), and Le effective length determined bytype of loading and support as given in Table 8–2. Equation(8–32) is valid for bending stresses below the proportionallimit.
Short Beams—Short beams can buckle at stresses beyondthe proportional limit. In view of the similarity ofEquation (8–32) to Euler’s formula (Eq. (8–25)) for columnbuckling, it is recommended that short-beam buckling beanalyzed by using the column buckling criterion inFigure 8–7 applied with α in place of L/r on the abscissa
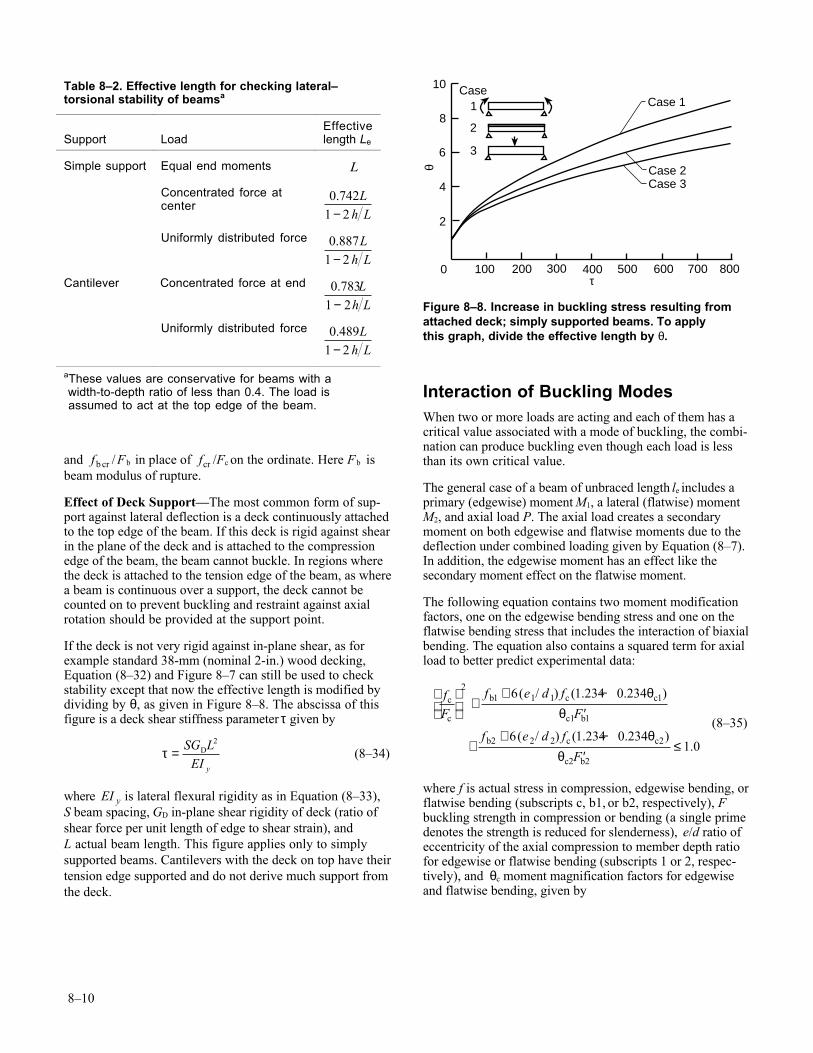
8–10
and fb cr / F b in place of fcr /Fc on the ordinate. Here F b isbeam modulus of rupture.
Effect of Deck Support—The most common form of sup-port against lateral deflection is a deck continuously attachedto the top edge of the beam. If this deck is rigid against shearin the plane of the deck and is attached to the compressionedge of the beam, the beam cannot buckle. In regions wherethe deck is attached to the tension edge of the beam, as wherea beam is continuous over a support, the deck cannot becounted on to prevent buckling and restraint against axialrotation should be provided at the support point.
If the deck is not very rigid against in-plane shear, as forexample standard 38-mm (nominal 2-in.) wood decking,Equation (8–32) and Figure 8–7 can still be used to checkstability except that now the effective length is modified bydividing by θ, as given in Figure 8–8. The abscissa of thisfigure is a deck shear stiffness parameter τ given by
τ = SG L
EI y
D2
(8–34)
where EI y is lateral flexural rigidity as in Equation (8–33),S beam spacing, GD in-plane shear rigidity of deck (ratio ofshear force per unit length of edge to shear strain), andL actual beam length. This figure applies only to simplysupported beams. Cantilevers with the deck on top have theirtension edge supported and do not derive much support fromthe deck.
Interaction of Buckling ModesWhen two or more loads are acting and each of them has acritical value associated with a mode of buckling, the combi-nation can produce buckling even though each load is lessthan its own critical value.
The general case of a beam of unbraced length le includes aprimary (edgewise) moment M1, a lateral (flatwise) momentM2, and axial load P. The axial load creates a secondarymoment on both edgewise and flatwise moments due to thedeflection under combined loading given by Equation (8–7).In addition, the edgewise moment has an effect like thesecondary moment effect on the flatwise moment.
The following equation contains two moment modificationfactors, one on the edgewise bending stress and one on theflatwise bending stress that includes the interaction of biaxialbending. The equation also contains a squared term for axialload to better predict experimental data:
fF
f e d f
F
f e d f
F
c
c
b c
c1
b c
c2
++ −
′
++ −
′≤
21 1 1 1
1
2 2 2 2
2
6 1 234 0 234
6 1 234 0 2341 0
( / ) ( . . )
( / ) ( . . ).
c
b
c
b
θθ
θθ
(8–35)
where f is actual stress in compression, edgewise bending, orflatwise bending (subscripts c, b1, or b2, respectively), Fbuckling strength in compression or bending (a single primedenotes the strength is reduced for slenderness), e/d ratio ofeccentricity of the axial compression to member depth ratiofor edgewise or flatwise bending (subscripts 1 or 2, respec-tively), and θc moment magnification factors for edgewiseand flatwise bending, given by
Table 8–2. Effective length for checking lateral–torsional stability of beamsa
Support LoadEffectivelength Le
Simple support Equal end moments L
Concentrated force atcenter
0.7421 2
Lh L−
Uniformly distributed force
0.8871 2
Lh L−
Cantilever Concentrated force at end
0.7831 2
Lh L−
Uniformly distributed force
0.4891 2
Lh L−
aThese values are conservative for beams with a width-to-depth ratio of less than 0.4. The load is assumed to act at the top edge of the beam.
10
8
6
4
2
0 100 200 300 400 500 600 700 800
θ
τ
1
Case 3Case 2
Case 1
3
2
Case
Figure 8–8. Increase in buckling stress resulting fromattached deck; simply supported beams. To applythis graph, divide the effective length by θ.
8–11
θc
c
cr
S
S11
1= −′′
+
f
Fc
(8–36)
θc
c c2
2
1 1 1
1
16= −
′′+ +
′′
fF
f e d fFc
b
b
( )(8–37)
′′ =F
E
l dc
e
1
1 12
0 822.
( )(8–38)
′′ =F
E
l dc
e
2
2 22
0 822.
( )(8–39)
′′ =F
El
ddb
e1
2
1
1 44.(8–40)
where le is effective length of member and S and Scr a r e previously defined ponding beam spacing.
ReferencesASTM. [current edition]. Standard methods for testing clearspecimens of timber. ASTM D143–94. West Consho-hocken, PA: American Society for Testing and Materials.
Bohannan, B. 1966. Effect of size on bending strength ofwood members. Res. Pap. FPL–RP–56. Madison, WI: U.S.Department of Agriculture, Forest Service, Forest ProductsLaboratory.
Gerhardt, T.D.; Liu, J.Y. 1983. Orthotropic beams undernormal and shear loading. Journal of Engineering Mechanics,ASCE. 109(2): 394–410.
Kuenzi, E.W.; Bohannan, B. 1964. Increases in deflectionand stress caused by ponding of water on roofs. Forest Prod-ucts Journal. 14(9): 421–424.
Liu, J.Y. 1980. Shear strength of wood beams: A Weibullanalysis. Journal of Structural Division, ASCE. 106(ST10):2035– 2052.
Liu, J.Y. 1981. Shear strength of tapered wood beams.Journal of Structural Division, ASCE. 107(ST5): 719–731.
Liu, J.Y. 1982. A Weibull analysis of wood member bend-ing strength. Transactions, American Society of MechanicalEngineers. Journal of Mechanical Design. 104: 572–579.
Liu, J.Y. 1984. Evaluation of the tensor polynomialstrength theory for wood. Journal of Composite Materials.18(3): 216–226. (May).
Liu, J.Y.; Cheng, S. 1979. Analysis of orthotropic beams.Res. Pap. FPL–RP–343. Madison, WI: U.S. Department ofAgriculture, Forest Service, Forest Products Laboratory.
Maki, A C.; Kuenzi, E.W. 1965. Deflection and stresses oftapered wood beams. Res. Pap. FPL–RP–34. Madison, WI:U.S. Department of Agriculture, Forest Service, ForestProducts Laboratory.
Malhorta, S.K.; Sukumar, A.P. 1989. A simplied proce-dure for built-up wood compression members. St. Johns,
New Foundland: Annual conference, Canadian Society forCivil Engineering: 1–18 (June).
Murphy, J.F. 1979. Using fracture mechanics to predictfailure of notched wood beams. In: Proceedings of first inter-national conference on wood fracture; 1978, Aug. 14–16;Banff, AB. Vancouver, BC: Forintek Canada Corporation:159: 161–173.
Newlin, J.A.; Gahagan, J.M. 1930. Tests of large timbercolumns and presentation of the Forest Products Laboratorycolumn formula. Tech. Bull. 167. Madison, WI: U.S.Department of Agriculture, Forest Service, Forest ProductsLaboratory.
Newlin, J.A.; Trayer, G.W. 1924. Deflection of beamswith special reference to shear deformations. Rep. 180.Washington, DC: U.S. National Advisory Committee onAeronautics.
Norris, C.B. 1950. Strength of orthotropic materials sub-jected to combined stresses. Rep. 1816. Madison, WI: U.S.Department of Agriculture, Forest Service, Forest ProductsLaboratory.
Rammer, D.R.; Soltis, L.A. 1994. Experimental shearstrength of glued-laminated beams. Res. Rep. FPL–RP–527.Madison, WI, U.S. Department of Agriculture, Forest Serv-ice, Forest Products Laboratory.
Rammer, D.R.; Soltis, L.A.; Lebow, P.K. 1996. Experi-mental shear strength of unchecked solid sawn Douglas-fir.Res. Pap. FPL–RP–553. Madison, WI: U.S. Department ofAgriculture, Forest Service, Forest Products Laboratory.
Soltis, L.A., Rammer, D.R. 1997. Bending to shear ratioapproach to beam design. Forest Products Journal. 47(1):104–108.
Trayer, G.W. 1930. The torsion of members having sec-tions common in aircraft construction. Rep. 334.Washington, DC: U.S. National Advisory Committee onAeronautics.
Trayer, G.W.; March, H.W. 1931. Elastic instability ofmembers having sections common in aircraft construction.Rep. 382. Washington, DC: U.S. National AdvisoryCommittee on Aeronautics.
Ylinen, A. 1956. A method of determining the bucklingstress and the required cross-sectional area for centrallyloaded straight columns in elastic and inelastic range.Publication of the International Association for Bridge andStructural Engineering. Zurich. Vol. 16.
Zahn, J.J. 1973. Lateral stability of wood beam-and-decksystems. Journal of the Structural Division, ASCE.99(ST7): 1391–1408.
Zahn, J.J. 1986. Design of wood members under combinedloads. Journal of Structural Engineering, ASCE. 112(ST9):2109–2126.
Zahn, J.J. 1988. Combined-load stability criterion for woodbeam-columns. Journal of Structural Engineering, ASCE.114(ST11): 2612–2628.

FromForest Products Laboratory. 1999. Wood handbook—Wood as an engineering material.Gen. Tech. Rep. FPL–GTR–113. Madison, WI: U.S. Department of Agriculture, Forest Service,Forest Products Laboratory. 463 p.
9–1
Chapter 9Adhesive Bonding ofWood MaterialsCharles B. Vick
ContentsAdhesion to Wood 9–1Surface Properties of Wood Adherends 9–2
Extractives on Surfaces 9–3Knife- and Abrasive-Planed Surfaces 9–3Veneer Surfaces 9–4Surfaces of Wood and Nonwood Composite Products 9–5
Physical Properties of Wood Adherends 9–6Density and Porosity 9–6Moisture Content and Dimensional Changes 9–7
Adhesives 9–9Composition 9–9Health and Safety 9–10Strength and Durability 9–10Adhesive Selection 9–12
Bonding Process 9–15Moisture Content Control 9–15Surface Preparation 9–16Adhesive Spreading 9–16Assembly and Pressing 9–16Post-Cure Conditioning 9–18
Bonded Joints 9–18Edge-Grain Joints 9–18End-Grain Joints 9–18End-to-Edge-Grain Joints 9–19Construction Joints 9–19
Testing and Performance 9–20Analytic Chemical and Mechanical Testingof Polymers 9–20Mechanical Testing of Bonded Assemblies 9–20Short- and Long-Term Performance 9–21Product Quality Assurance 9–22
References 9–23
dhesive bonding of wood components has playedan essential role in the development and growth ofthe forest products industry and has been a key
factor in the efficient utilization of our timber resource. Thelargest use of adhesives is in the construction industry. Byfar, the largest amounts of adhesives are used to manufacturebuilding materials, such as plywood, structural flakeboards,particleboards, fiberboards, structural framing and timbers,architectural doors, windows and frames, factory-laminatedwood products, and glass fiber insulation. Adhesives areused in smaller amounts to assemble building materials inresidential and industrial construction, particularly in panel-ized floor and wall systems. Significant amounts are alsoused in nonstructural applications, such as floor coverings,countertops, ceiling and wall tile, trim, and accessories.
Adhesives can effectively transfer and distribute stresses,thereby increasing the strength and stiffness of the composite.Effective transfer of stress from one member to another de-pends on the strength of the links in an imaginary chain of anadhesive-bonded joint. Thus, performance of the bondedjoint depends on how well we understand and control thecomplexity of factors that constitute the individual links—wood, adhesive, and the interphasing regions between—which ultimately determine the strength of the chain.
Adhesion to WoodThe American Society for Testing and Materials (ASTM)defines an adhesive as a substance capable of holdingmaterials together by surface attachment. An adherend is asubstrate held to another substrate by an adhesive. Adhesionis the state in which two surfaces are held together by interfa-cial forces, which may be valence forces, interlocking action,or both. Valence forces are forces of attraction produced bythe interactions of atoms, ions, and molecules that existwithin and at the surfaces of both adhesive and adherend.Interlocking action, also called mechanical bonding, meanssurfaces are held together by an adhesive that has penetratedthe porous surface while it is liquid, then anchored itselfduring solidification. The extent to which valence forces andinterlocking action develop between adhesive polymers andwood adherends is uncertain, but both are generally acknowl-edged as essential for the most effective bonding. Bonding toporous surfaces, such as wood, paper, and textiles, was
9–2
thought to be primarily mechanical, but now there isevidence supporting bonding by primary valence forces. Incontrast, bonding to hard metal surfaces was believed toinvolve only valence forces, but this is no longer the ac-cepted view. Metal surfaces roughened by chemical etchingor made microscopically porous with a layer of oxide arecapable of mechanical interlocking with an adhesive to pro-duce exceptionally strong and durable bonds.
Mechanical interlocking is probably the primary mechanismby which adhesives adhere to porous structures, such aswood. Effective mechanical interlocking takes place whenadhesives penetrate beyond the surface debris and damagedfibers into sound wood two to six cells deep. Deeper penetra-tion into the fine microstructure increases the surface area ofcontact between adhesive and wood for more effective me-chanical interlocking. The most durable structural bonds towood are believed to develop not only when an adhesivepenetrates deeply into cell cavities, but also when an adhe-sive diffuses into cell walls to make molecular-level contactwith the hemicellulosics and cellulosics of wood. If an adhe-sive penetrates deeply enough into sound wood and becomesrigid enough upon curing, the strength of the bond can beexpected to exceed the strength of the wood.
Physical forces of attraction composed of three intermolecularattraction forces are believed to be important to the formationof bonds between adhesive polymers and molecular structuresof wood. Generally called van der Waal’s forces, these in-clude dipole–dipole forces, which are positively and nega-tively charged polar molecules that have strong attractions forother polar molecules; London forces, which include theweaker forces of attraction that nonpolar molecules have foreach other; and hydrogen bonding, a special type of dipole–dipole force that accounts for strong attractions betweenpositively charged hydrogen atoms of one polar molecule andthe electronegative atom of another molecule. Hydrogenbonding forces are important in the interfacial attraction ofpolar adhesive polymers for the hemicellulosics and cellu-losics, which are rich with polar hydroxyl groups. Thesephysical forces of attraction, sometimes referred to as specificadhesion, are particularly important in wetting of watercarriers and adsorption of adhesive polymers onto the mo-lecular structures of wood.
Covalent chemical bonds form when atoms of nonmetalsinteract by sharing electrons to form molecules. The simplestexample of a purely covalent bond is the sharing of electronsby two hydrogen atoms to form hydrogen. These covalentbonds are the strongest of chemical bonds; they are morethan 11 times the strength of the hydrogen bond. Eventhough covalent chemical bonds between adhesive polymerand the molecular structure of wood seem a possibility, thereis no clear evidence that such bonds constitute an importantmechanism in adhesive bonding to wood.
For two wood adherends to be held together with maximumstrength, a liquid adhesive must wet and spread freely tomake intimate contact with both surfaces. Molecules of theadhesive must diffuse over and into each surface to makecontact with the molecular structure of wood so that
intermolecular forces of attraction between adhesive and woodcan become effective. As will be discussed later, wood adher-ends, as well as other materials, differ widely in their attrac-tive energies, bulk properties, surface roughness, and surfacechemistry. Wood surfaces may appear to be smooth and flat,but on microscopic examination, they become peaks, val-leys, and crevices, littered with loose fibers and other debris.Such surface conditions cause gas pockets and blockages thatprevent complete wetting by the adhesive and introducestress concentrations when the adhesive has cured. Thus, theliquid adhesive must have high wettability, coupled with aviscosity that will produce good capillary flow to penetratesound wood structure, while displacing and absorbing air,water, and contaminants at the surface. Pressure is normallyused to enhance wetting by forcing liquid adhesive to flowover the surfaces, displace air blockages, and penetrate tosound wood.
Wetting of a surface occurs when the contact angle (the anglebetween the edge of a drop of adhesive and the surface ofwood) approaches zero. The contact angle approaches zerowhen the surface has high attractive energy, the adhesive hasan affinity for the adherend, and the surface tension of theadhesive is low. If a drop of adhesive spreads to a thin filmapproaching zero contact angle, the adhesive has spread welland made intimate contact with the surface. The differences inwettabilities of various wood surfaces are illustrated by asimple water drop test in Figure 9–1.
The process of adhesion is essentially completed after transi-tion of the adhesive from liquid to solid form. After theviscosity of a liquid adhesive has increased and the adhesivehas solidified to the point where the film effectively resistsshear and tensile forces tending to separate the surfaces, thesurfaces are effectively bonded. An adhesive film changesfrom liquid to solid form by one of three mechanisms, al-though two may be involved in some curing mechanisms.This transition can be a physical change as in thermoplasticadhesives or it can be a chemical change as in thermosettingadhesives. In thermoplastics, the physical change to solidform may occur by either (a) loss of solvent from the adhe-sive through evaporation and diffusion into the wood, or(b) cooling of molten adhesive on a cooler surface. In ther-mosets, the solid form occurs through chemical polymeriza-tion into cross-linked structures that resist softening onheating. Most thermosetting wood adhesives contain wateras a carrier; therefore, water also must be evaporated andabsorbed by the wood so that the adhesive can curecompletely.
Surface Properties ofWood AdherendsBecause adhesives bond by surface attachment, the physicaland chemical conditions of the adherend’s surface isextremely important to satisfactory joint performance.Wood surfaces should be smooth, flat, and free of machinemarks and other surface irregularities, including planer skipsand crushed, torn, and chipped grain. The surface should befree of burnishes, exudates, oils, dirt, and other debris.
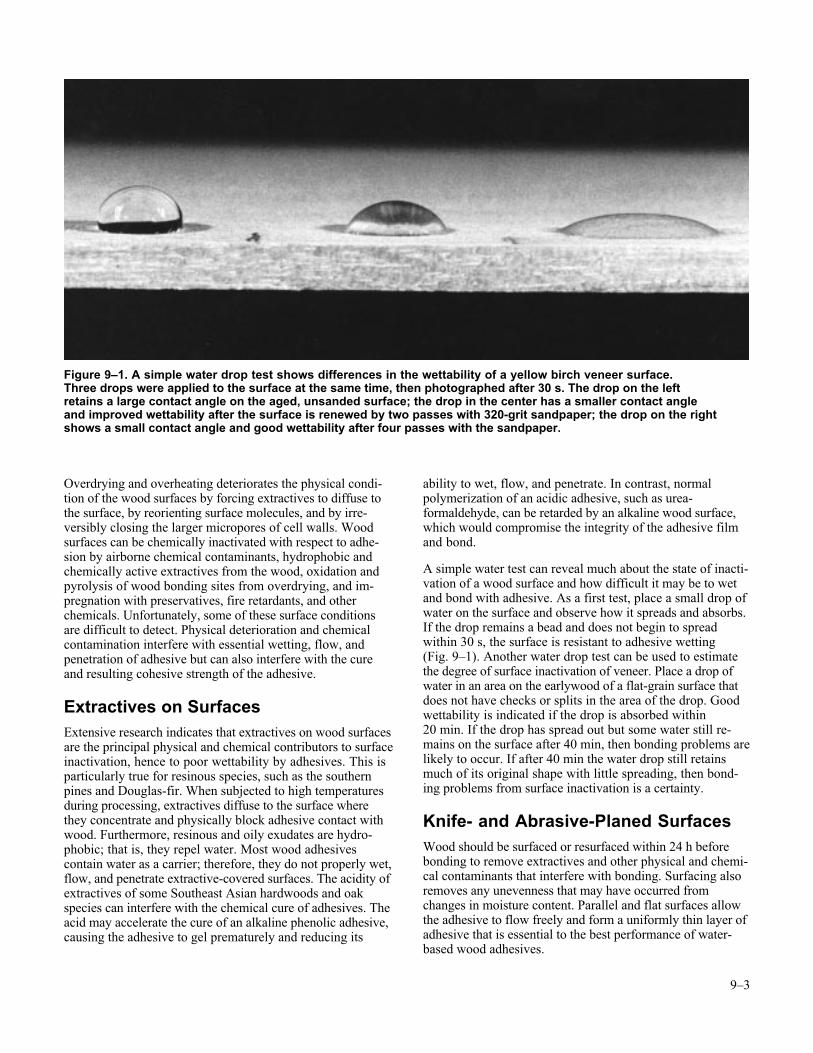
9–3
Overdrying and overheating deteriorates the physical condi-tion of the wood surfaces by forcing extractives to diffuse tothe surface, by reorienting surface molecules, and by irre-versibly closing the larger micropores of cell walls. Woodsurfaces can be chemically inactivated with respect to adhe-sion by airborne chemical contaminants, hydrophobic andchemically active extractives from the wood, oxidation andpyrolysis of wood bonding sites from overdrying, and im-pregnation with preservatives, fire retardants, and otherchemicals. Unfortunately, some of these surface conditionsare difficult to detect. Physical deterioration and chemicalcontamination interfere with essential wetting, flow, andpenetration of adhesive but can also interfere with the cureand resulting cohesive strength of the adhesive.
Extractives on SurfacesExtensive research indicates that extractives on wood surfacesare the principal physical and chemical contributors to surfaceinactivation, hence to poor wettability by adhesives. This isparticularly true for resinous species, such as the southernpines and Douglas-fir. When subjected to high temperaturesduring processing, extractives diffuse to the surface wherethey concentrate and physically block adhesive contact withwood. Furthermore, resinous and oily exudates are hydro-phobic; that is, they repel water. Most wood adhesivescontain water as a carrier; therefore, they do not properly wet,flow, and penetrate extractive-covered surfaces. The acidity ofextractives of some Southeast Asian hardwoods and oakspecies can interfere with the chemical cure of adhesives. Theacid may accelerate the cure of an alkaline phenolic adhesive,causing the adhesive to gel prematurely and reducing its
ability to wet, flow, and penetrate. In contrast, normalpolymerization of an acidic adhesive, such as urea-formaldehyde, can be retarded by an alkaline wood surface,which would compromise the integrity of the adhesive filmand bond.
A simple water test can reveal much about the state of inacti-vation of a wood surface and how difficult it may be to wetand bond with adhesive. As a first test, place a small drop ofwater on the surface and observe how it spreads and absorbs.If the drop remains a bead and does not begin to spreadwithin 30 s, the surface is resistant to adhesive wetting(Fig. 9–1). Another water drop test can be used to estimatethe degree of surface inactivation of veneer. Place a drop ofwater in an area on the earlywood of a flat-grain surface thatdoes not have checks or splits in the area of the drop. Goodwettability is indicated if the drop is absorbed within20 min. If the drop has spread out but some water still re-mains on the surface after 40 min, then bonding problems arelikely to occur. If after 40 min the water drop still retainsmuch of its original shape with little spreading, then bond-ing problems from surface inactivation is a certainty.
Knife- and Abrasive-Planed SurfacesWood should be surfaced or resurfaced within 24 h beforebonding to remove extractives and other physical and chemi-cal contaminants that interfere with bonding. Surfacing alsoremoves any unevenness that may have occurred fromchanges in moisture content. Parallel and flat surfaces allowthe adhesive to flow freely and form a uniformly thin layer ofadhesive that is essential to the best performance of water-based wood adhesives.
Figure 9–1. A simple water drop test shows differences in the wettability of a yellow birch veneer surface.Three drops were applied to the surface at the same time, then photographed after 30 s. The drop on the leftretains a large contact angle on the aged, unsanded surface; the drop in the center has a smaller contact angleand improved wettability after the surface is renewed by two passes with 320-grit sandpaper; the drop on the rightshows a small contact angle and good wettability after four passes with the sandpaper.
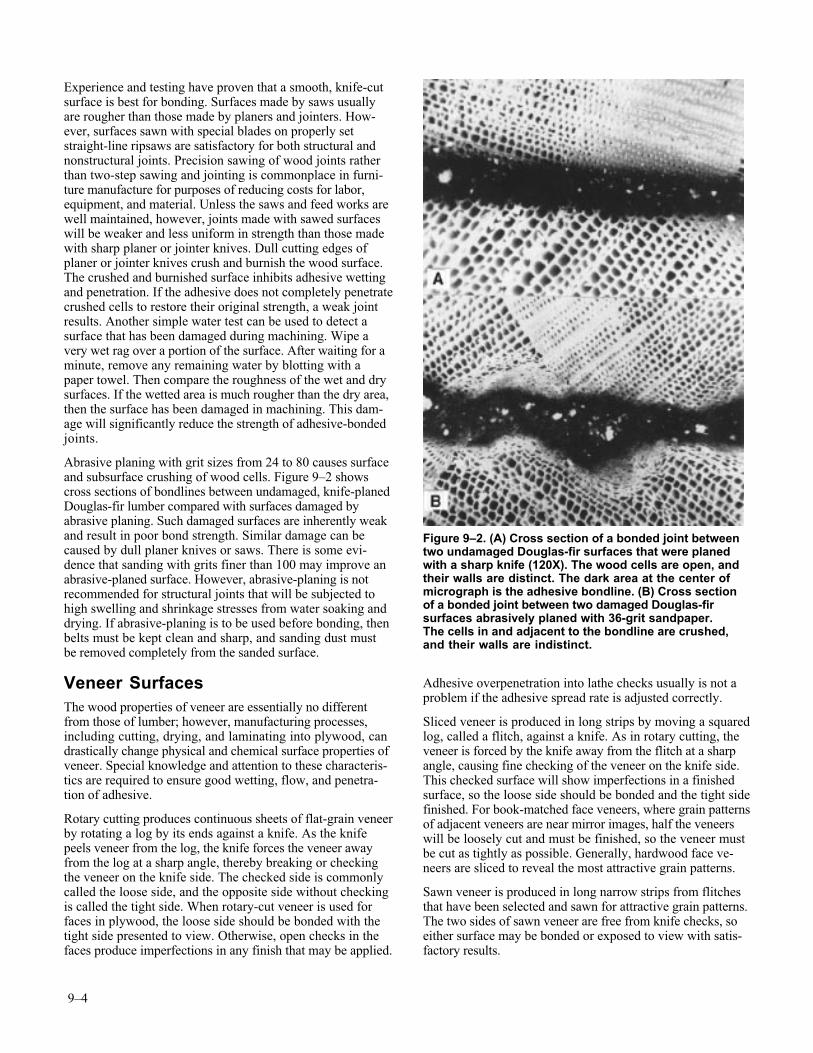
9–4
Experience and testing have proven that a smooth, knife-cutsurface is best for bonding. Surfaces made by saws usuallyare rougher than those made by planers and jointers. How-ever, surfaces sawn with special blades on properly setstraight-line ripsaws are satisfactory for both structural andnonstructural joints. Precision sawing of wood joints ratherthan two-step sawing and jointing is commonplace in furni-ture manufacture for purposes of reducing costs for labor,equipment, and material. Unless the saws and feed works arewell maintained, however, joints made with sawed surfaceswill be weaker and less uniform in strength than those madewith sharp planer or jointer knives. Dull cutting edges ofplaner or jointer knives crush and burnish the wood surface.The crushed and burnished surface inhibits adhesive wettingand penetration. If the adhesive does not completely penetratecrushed cells to restore their original strength, a weak jointresults. Another simple water test can be used to detect asurface that has been damaged during machining. Wipe avery wet rag over a portion of the surface. After waiting for aminute, remove any remaining water by blotting with apaper towel. Then compare the roughness of the wet and drysurfaces. If the wetted area is much rougher than the dry area,then the surface has been damaged in machining. This dam-age will significantly reduce the strength of adhesive-bondedjoints.
Abrasive planing with grit sizes from 24 to 80 causes surfaceand subsurface crushing of wood cells. Figure 9–2 showscross sections of bondlines between undamaged, knife-planedDouglas-fir lumber compared with surfaces damaged byabrasive planing. Such damaged surfaces are inherently weakand result in poor bond strength. Similar damage can becaused by dull planer knives or saws. There is some evi-dence that sanding with grits finer than 100 may improve anabrasive-planed surface. However, abrasive-planing is notrecommended for structural joints that will be subjected tohigh swelling and shrinkage stresses from water soaking anddrying. If abrasive-planing is to be used before bonding, thenbelts must be kept clean and sharp, and sanding dust mustbe removed completely from the sanded surface.
Veneer SurfacesThe wood properties of veneer are essentially no differentfrom those of lumber; however, manufacturing processes,including cutting, drying, and laminating into plywood, candrastically change physical and chemical surface properties ofveneer. Special knowledge and attention to these characteris-tics are required to ensure good wetting, flow, and penetra-tion of adhesive.
Rotary cutting produces continuous sheets of flat-grain veneerby rotating a log by its ends against a knife. As the knifepeels veneer from the log, the knife forces the veneer awayfrom the log at a sharp angle, thereby breaking or checkingthe veneer on the knife side. The checked side is commonlycalled the loose side, and the opposite side without checkingis called the tight side. When rotary-cut veneer is used forfaces in plywood, the loose side should be bonded with thetight side presented to view. Otherwise, open checks in thefaces produce imperfections in any finish that may be applied.
Adhesive overpenetration into lathe checks usually is not aproblem if the adhesive spread rate is adjusted correctly.
Sliced veneer is produced in long strips by moving a squaredlog, called a flitch, against a knife. As in rotary cutting, theveneer is forced by the knife away from the flitch at a sharpangle, causing fine checking of the veneer on the knife side.This checked surface will show imperfections in a finishedsurface, so the loose side should be bonded and the tight sidefinished. For book-matched face veneers, where grain patternsof adjacent veneers are near mirror images, half the veneerswill be loosely cut and must be finished, so the veneer mustbe cut as tightly as possible. Generally, hardwood face ve-neers are sliced to reveal the most attractive grain patterns.
Sawn veneer is produced in long narrow strips from flitchesthat have been selected and sawn for attractive grain patterns.The two sides of sawn veneer are free from knife checks, soeither surface may be bonded or exposed to view with satis-factory results.
Figure 9–2. (A) Cross section of a bonded joint betweentwo undamaged Douglas-fir surfaces that were planedwith a sharp knife (120X). The wood cells are open, andtheir walls are distinct. The dark area at the center ofmicrograph is the adhesive bondline. (B) Cross sectionof a bonded joint between two damaged Douglas-firsurfaces abrasively planed with 36-grit sandpaper.The cells in and adjacent to the bondline are crushed,and their walls are indistinct.
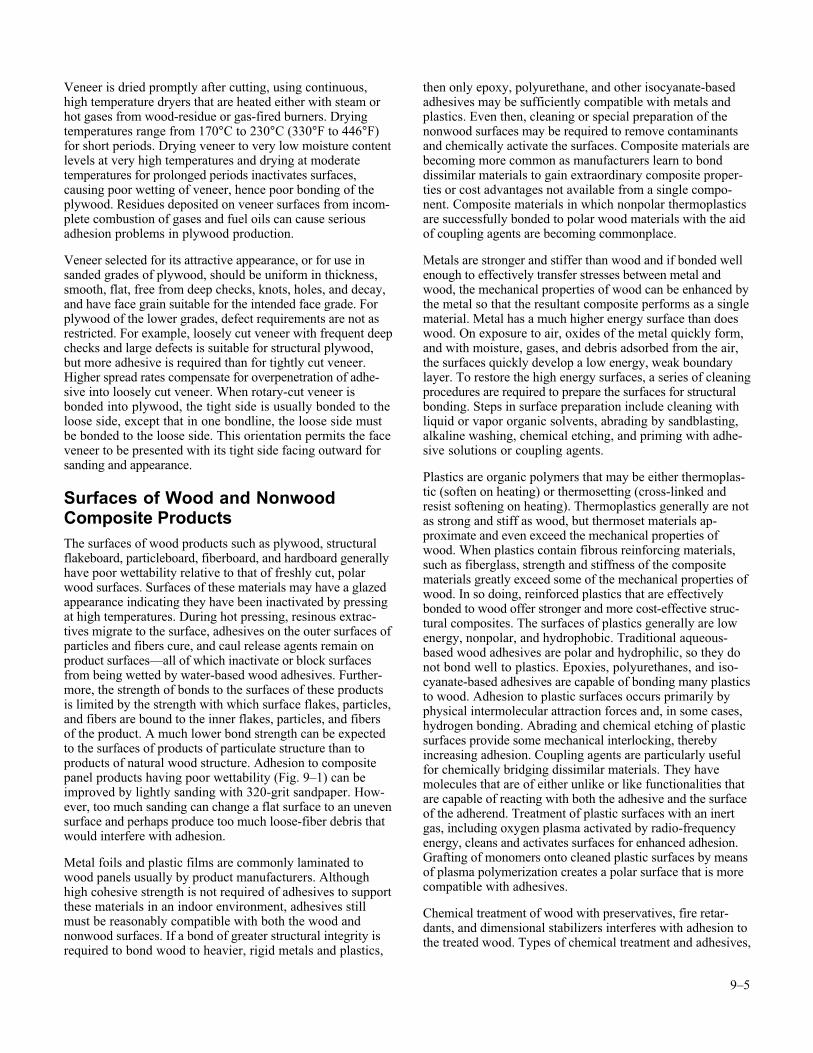
9–5
Veneer is dried promptly after cutting, using continuous,high temperature dryers that are heated either with steam orhot gases from wood-residue or gas-fired burners. Dryingtemperatures range from 170°C to 230°C (330°F to 446°F)for short periods. Drying veneer to very low moisture contentlevels at very high temperatures and drying at moderatetemperatures for prolonged periods inactivates surfaces,causing poor wetting of veneer, hence poor bonding of theplywood. Residues deposited on veneer surfaces from incom-plete combustion of gases and fuel oils can cause seriousadhesion problems in plywood production.
Veneer selected for its attractive appearance, or for use insanded grades of plywood, should be uniform in thickness,smooth, flat, free from deep checks, knots, holes, and decay,and have face grain suitable for the intended face grade. Forplywood of the lower grades, defect requirements are not asrestricted. For example, loosely cut veneer with frequent deepchecks and large defects is suitable for structural plywood,but more adhesive is required than for tightly cut veneer.Higher spread rates compensate for overpenetration of adhe-sive into loosely cut veneer. When rotary-cut veneer isbonded into plywood, the tight side is usually bonded to theloose side, except that in one bondline, the loose side mustbe bonded to the loose side. This orientation permits the faceveneer to be presented with its tight side facing outward forsanding and appearance.
Surfaces of Wood and NonwoodComposite ProductsThe surfaces of wood products such as plywood, structuralflakeboard, particleboard, fiberboard, and hardboard generallyhave poor wettability relative to that of freshly cut, polarwood surfaces. Surfaces of these materials may have a glazedappearance indicating they have been inactivated by pressingat high temperatures. During hot pressing, resinous extrac-tives migrate to the surface, adhesives on the outer surfaces ofparticles and fibers cure, and caul release agents remain onproduct surfaces—all of which inactivate or block surfacesfrom being wetted by water-based wood adhesives. Further-more, the strength of bonds to the surfaces of these productsis limited by the strength with which surface flakes, particles,and fibers are bound to the inner flakes, particles, and fibersof the product. A much lower bond strength can be expectedto the surfaces of products of particulate structure than toproducts of natural wood structure. Adhesion to compositepanel products having poor wettability (Fig. 9–1) can beimproved by lightly sanding with 320-grit sandpaper. How-ever, too much sanding can change a flat surface to an unevensurface and perhaps produce too much loose-fiber debris thatwould interfere with adhesion.
Metal foils and plastic films are commonly laminated towood panels usually by product manufacturers. Althoughhigh cohesive strength is not required of adhesives to supportthese materials in an indoor environment, adhesives stillmust be reasonably compatible with both the wood andnonwood surfaces. If a bond of greater structural integrity isrequired to bond wood to heavier, rigid metals and plastics,
then only epoxy, polyurethane, and other isocyanate-basedadhesives may be sufficiently compatible with metals andplastics. Even then, cleaning or special preparation of thenonwood surfaces may be required to remove contaminantsand chemically activate the surfaces. Composite materials arebecoming more common as manufacturers learn to bonddissimilar materials to gain extraordinary composite proper-ties or cost advantages not available from a single compo-nent. Composite materials in which nonpolar thermoplasticsare successfully bonded to polar wood materials with the aidof coupling agents are becoming commonplace.
Metals are stronger and stiffer than wood and if bonded wellenough to effectively transfer stresses between metal andwood, the mechanical properties of wood can be enhanced bythe metal so that the resultant composite performs as a singlematerial. Metal has a much higher energy surface than doeswood. On exposure to air, oxides of the metal quickly form,and with moisture, gases, and debris adsorbed from the air,the surfaces quickly develop a low energy, weak boundarylayer. To restore the high energy surfaces, a series of cleaningprocedures are required to prepare the surfaces for structuralbonding. Steps in surface preparation include cleaning withliquid or vapor organic solvents, abrading by sandblasting,alkaline washing, chemical etching, and priming with adhe-sive solutions or coupling agents.
Plastics are organic polymers that may be either thermoplas-tic (soften on heating) or thermosetting (cross-linked andresist softening on heating). Thermoplastics generally are notas strong and stiff as wood, but thermoset materials ap-proximate and even exceed the mechanical properties ofwood. When plastics contain fibrous reinforcing materials,such as fiberglass, strength and stiffness of the compositematerials greatly exceed some of the mechanical properties ofwood. In so doing, reinforced plastics that are effectivelybonded to wood offer stronger and more cost-effective struc-tural composites. The surfaces of plastics generally are lowenergy, nonpolar, and hydrophobic. Traditional aqueous-based wood adhesives are polar and hydrophilic, so they donot bond well to plastics. Epoxies, polyurethanes, and iso-cyanate-based adhesives are capable of bonding many plasticsto wood. Adhesion to plastic surfaces occurs primarily byphysical intermolecular attraction forces and, in some cases,hydrogen bonding. Abrading and chemical etching of plasticsurfaces provide some mechanical interlocking, therebyincreasing adhesion. Coupling agents are particularly usefulfor chemically bridging dissimilar materials. They havemolecules that are of either unlike or like functionalities thatare capable of reacting with both the adhesive and the surfaceof the adherend. Treatment of plastic surfaces with an inertgas, including oxygen plasma activated by radio-frequencyenergy, cleans and activates surfaces for enhanced adhesion.Grafting of monomers onto cleaned plastic surfaces by meansof plasma polymerization creates a polar surface that is morecompatible with adhesives.
Chemical treatment of wood with preservatives, fire retar-dants, and dimensional stabilizers interferes with adhesion tothe treated wood. Types of chemical treatment and adhesives,
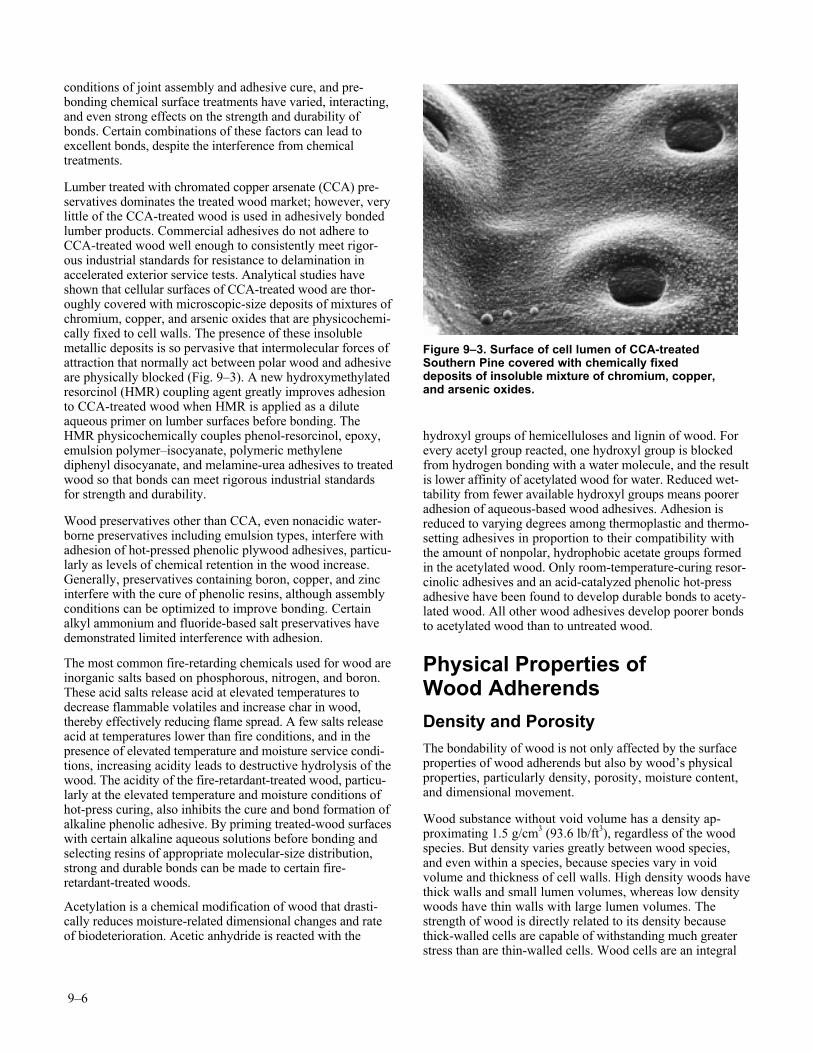
9–6
conditions of joint assembly and adhesive cure, and pre-bonding chemical surface treatments have varied, interacting,and even strong effects on the strength and durability ofbonds. Certain combinations of these factors can lead toexcellent bonds, despite the interference from chemicaltreatments.
Lumber treated with chromated copper arsenate (CCA) pre-servatives dominates the treated wood market; however, verylittle of the CCA-treated wood is used in adhesively bondedlumber products. Commercial adhesives do not adhere toCCA-treated wood well enough to consistently meet rigor-ous industrial standards for resistance to delamination inaccelerated exterior service tests. Analytical studies haveshown that cellular surfaces of CCA-treated wood are thor-oughly covered with microscopic-size deposits of mixtures ofchromium, copper, and arsenic oxides that are physicochemi-cally fixed to cell walls. The presence of these insolublemetallic deposits is so pervasive that intermolecular forces ofattraction that normally act between polar wood and adhesiveare physically blocked (Fig. 9–3). A new hydroxymethylatedresorcinol (HMR) coupling agent greatly improves adhesionto CCA-treated wood when HMR is applied as a diluteaqueous primer on lumber surfaces before bonding. TheHMR physicochemically couples phenol-resorcinol, epoxy,emulsion polymer–isocyanate, polymeric methylenediphenyl disocyanate, and melamine-urea adhesives to treatedwood so that bonds can meet rigorous industrial standardsfor strength and durability.
Wood preservatives other than CCA, even nonacidic water-borne preservatives including emulsion types, interfere withadhesion of hot-pressed phenolic plywood adhesives, particu-larly as levels of chemical retention in the wood increase.Generally, preservatives containing boron, copper, and zincinterfere with the cure of phenolic resins, although assemblyconditions can be optimized to improve bonding. Certainalkyl ammonium and fluoride-based salt preservatives havedemonstrated limited interference with adhesion.
The most common fire-retarding chemicals used for wood areinorganic salts based on phosphorous, nitrogen, and boron.These acid salts release acid at elevated temperatures todecrease flammable volatiles and increase char in wood,thereby effectively reducing flame spread. A few salts releaseacid at temperatures lower than fire conditions, and in thepresence of elevated temperature and moisture service condi-tions, increasing acidity leads to destructive hydrolysis of thewood. The acidity of the fire-retardant-treated wood, particu-larly at the elevated temperature and moisture conditions ofhot-press curing, also inhibits the cure and bond formation ofalkaline phenolic adhesive. By priming treated-wood surfaceswith certain alkaline aqueous solutions before bonding andselecting resins of appropriate molecular-size distribution,strong and durable bonds can be made to certain fire-retardant-treated woods.
Acetylation is a chemical modification of wood that drasti-cally reduces moisture-related dimensional changes and rateof biodeterioration. Acetic anhydride is reacted with the
hydroxyl groups of hemicelluloses and lignin of wood. Forevery acetyl group reacted, one hydroxyl group is blockedfrom hydrogen bonding with a water molecule, and the resultis lower affinity of acetylated wood for water. Reduced wet-tability from fewer available hydroxyl groups means pooreradhesion of aqueous-based wood adhesives. Adhesion isreduced to varying degrees among thermoplastic and thermo-setting adhesives in proportion to their compatibility withthe amount of nonpolar, hydrophobic acetate groups formedin the acetylated wood. Only room-temperature-curing resor-cinolic adhesives and an acid-catalyzed phenolic hot-pressadhesive have been found to develop durable bonds to acety-lated wood. All other wood adhesives develop poorer bondsto acetylated wood than to untreated wood.
Physical Properties ofWood Adherends
Density and Porosity
The bondability of wood is not only affected by the surfaceproperties of wood adherends but also by wood’s physicalproperties, particularly density, porosity, moisture content,and dimensional movement.
Wood substance without void volume has a density ap-proximating 1.5 g/cm3 (93.6 lb/ft3), regardless of the woodspecies. But density varies greatly between wood species,and even within a species, because species vary in voidvolume and thickness of cell walls. High density woods havethick walls and small lumen volumes, whereas low densitywoods have thin walls with large lumen volumes. Thestrength of wood is directly related to its density becausethick-walled cells are capable of withstanding much greaterstress than are thin-walled cells. Wood cells are an integral
Figure 9–3. Surface of cell lumen of CCA-treatedSouthern Pine covered with chemically fixeddeposits of insoluble mixture of chromium, copper,and arsenic oxides.
9–7
part of the wood–adhesive interphasing region; therefore, theadhesive bond must be at least as strong as the wood if thestrength capability of the wood adherend is to be fullyutilized.
The strength of adhesive bonds to wood increases with wooddensity up to a range of 0.7 to 0.8 g/cm3 (43.7 to 49.9 lb/ft3)(moisture content 12%). Above this level, joint strengthdecreases. Although strength increases with wood density,wood failure decreases gradually up to a density rangeof 0.7 to 0.8 g/cm3 (43.7 to 49.9 lb/ft3), then decreases morerapidly above 0.8 g/cm3 (49.9 lb/ft3). As wood density in-creases, high strength joints with high wood failure are moredifficult to achieve consistently. (Wood failure means ruptureof wood fibers during strength tests of adhesive bonds towood. It is usually expressed as a percentage of the totalbonded area of the joint.)
High density woods are difficult to bond for several reasons.Because of thicker cell walls and less lumen volume, adhe-sives do not penetrate easily, so important mechanical inter-locking of adhesives is limited to one or two cells deep.Much greater pressure is required to compress stronger,stiffer, high density wood to bring contact between woodsurface and adhesive. Higher concentrations of extractivesthat may interfere with the cure of adhesives are common inhigh density species, particularly domestic oaks and im-ported tropical hardwoods. The severe stresses produced byhigh density species as they change dimensions with changesin moisture content also contribute heavily to bondingdifficulties.
Density is perhaps a crude indicator, but as previously noted,it is useful for estimating the bondability of a great variety ofwood species. Table 9–1 categorizes commonly used domes-tic and imported species according to their relative ease ofbonding. The categories for domestic woods are based on theaverage strength of side-grain joints of lumber as determinedin laboratory tests and industrial experience. The laboratorytests included animal, casein, starch, urea-formaldehyde, andresorcinol-formaldehyde adhesives. The categories for im-ported woods are based on information found in the literatureon bond strength, species properties, extractives content, andindustrial experience. In most cases, the amount of dataavailable for categorizing imported woods is not equivalentto that for domestic woods. However, a species that bondspoorly with one adhesive may develop much better bondswith another adhesive. A similar type of adhesive but withsomewhat different working, penetration, curing, and evenstrength properties can often dramatically improve bond-ability of a given species. Adhesive suppliers will quiteoften adjust adhesive formulations to solve specificadhesion problems.
The void volume of wood, which can range from 46% to80% of total volume, strongly affects the depth and directionthat an adhesive flows. To attain the highest joint strength,the adhesive must penetrate and mechanically interlockseveral cells deep into sound, undamaged cell structure. In
wood, porosity varies according to the grain direction. It ismost porous on end-grain surfaces, being many times greaterthan on radial or tangential surfaces. Adhesives penetratedeeply into open fibers and vessels along the grain, so deeplythat overpenetration occurs when pressure is applied to end-grain surfaces. This is a primary reason why it is so difficultto form strong, load-bearing bondlines in butt joints. Acrossthe grain, porosity is limited because of fewer pathways inwhich adhesive can flow, so overpenetration under pressuregenerally is not a problem with a properly formulatedadhesive.
The porosity of hardwoods and softwoods, both as speciesgroups and as species within a group, varies greatly, whichdramatically affects the amount and direction of adhesiveflow. Highly porous softwoods, such as the southern pines,have fiber lumens that are interconnected by open pits. Pitsare the small openings between fibers that permit lateraltransfer of fluids in living trees. They form a complex capil-lary system that also allows adhesives to penetrate deeply,even in tangential and radial directions. The relatively largevessels in hardwoods have no end walls, so adhesive canpenetrate indefinitely along the end grain. The remainingfibers have relatively few pits for lateral transfer of adhesive,except that hardwoods, such as the red oaks, have radiallyoriented rays that can allow excessive flow and overpenetra-tion. Although adhesives for hardwoods and softwoodsgenerally differ by chemical type according to product mar-kets, adhesives must be specifically formulated for hardwoodsor softwoods, including specific species within the groups, orhave adjustable working properties for specific manufacturingsituations.
Moisture Content andDimensional ChangesWater occurs naturally in living trees—as free water in celllumens and as adsorbed water within cell walls. Total watercontent of wood can range well above 200% (based on oven-dry weight), but when the free water is removed from celllumens by drying, approximately 30% remains bound withincell walls. Water has strong molecular attraction to wood,primarily through hydrogen bonding with hydroxyl groupsof wood cellulosics. Therefore, cell walls remain saturatedwith moisture (called the fiber saturation point) until themoisture content of the surrounding air falls below that ofsaturated cell walls. Actual moisture content at fiber satura-tion (roughly 30%) varies, depending on species, tree, tem-perature, and pressure. This is the critical point at whichwood begins to shrink. If wood has dried below the fibersaturation point, then regains moisture, the wood will swell.These dimensional changes differ with the three principaldirections, or grain directions in wood, that is, longitudinal,radial, and tangential, with intermediate changes varyingwith the angle between the principal directions. Longitudinaldimensional change along the grain is least and amounts toless than 1% in drying from fiber saturation point to oven-dry. Dimensional change is greatest across the grain, but the
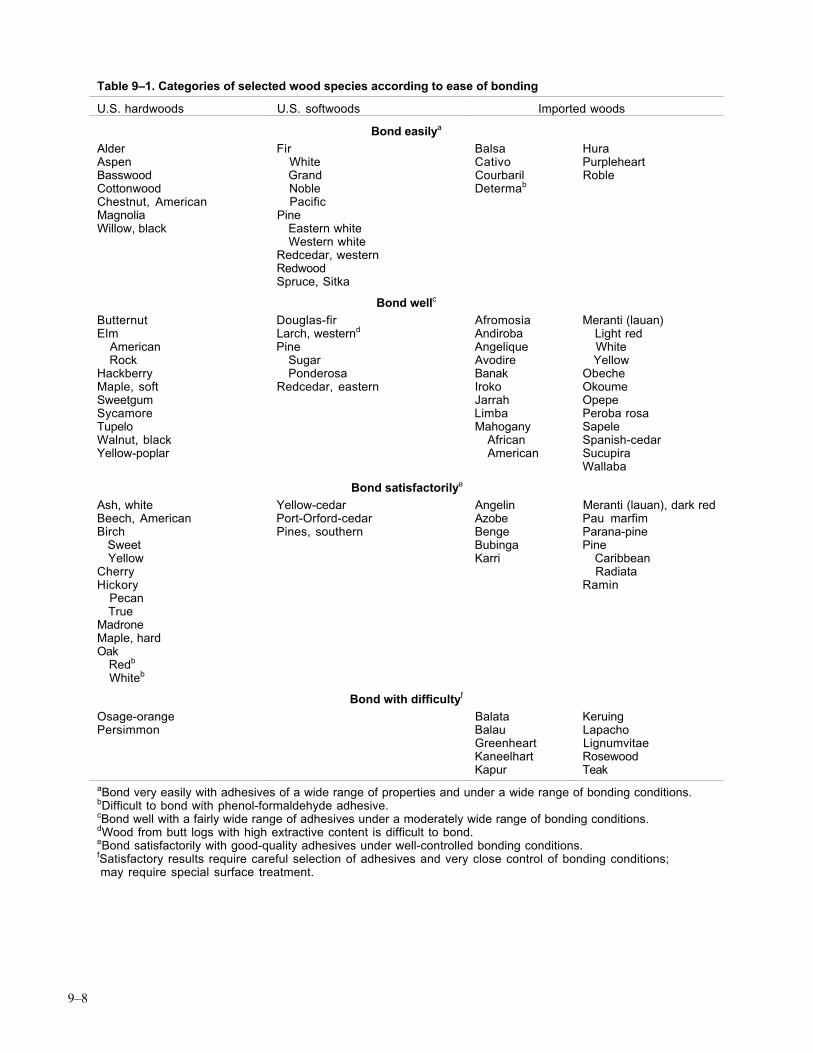
9–8
Table 9–1. Categories of selected wood species according to ease of bonding
U.S. hardwoods U.S. softwoods Imported woods
Bond easilya
Alder Fir Balsa HuraAspen White Cativo PurpleheartBasswood Grand Courbaril RobleCottonwood Noble Determab
Chestnut, American PacificMagnolia PineWillow, black Eastern white
Western whiteRedcedar, westernRedwoodSpruce, Sitka
Bond wellc
Butternut Douglas-fir Afromosia Meranti (lauan)Elm Larch, westernd Andiroba Light red American Pine Angelique White Rock Sugar Avodire YellowHackberry Ponderosa Banak ObecheMaple, soft Redcedar, eastern Iroko OkoumeSweetgum Jarrah OpepeSycamore Limba Peroba rosaTupelo Mahogany SapeleWalnut, black African Spanish-cedarYellow-poplar American Sucupira
Wallaba
Bond satisfactorilye
Ash, white Yellow-cedar Angelin Meranti (lauan), dark redBeech, American Port-Orford-cedar Azobe Pau marfimBirch Pines, southern Benge Parana-pine Sweet Bubinga Pine Yellow Karri CaribbeanCherry RadiataHickory Ramin Pecan TrueMadroneMaple, hardOak Redb
Whiteb
Bond with difficultyf
Osage-orange Balata KeruingPersimmon Balau Lapacho
Greenheart LignumvitaeKaneelhart RosewoodKapur Teak
aBond very easily with adhesives of a wide range of properties and under a wide range of bonding conditions.bDifficult to bond with phenol-formaldehyde adhesive.cBond well with a fairly wide range of adhesives under a moderately wide range of bonding conditions.dWood from butt logs with high extractive content is difficult to bond.eBond satisfactorily with good-quality adhesives under well-controlled bonding conditions.fSatisfactory results require careful selection of adhesives and very close control of bonding conditions; may require special surface treatment.
9–9
amounts differ with the direction; dimensional change varieswith and within species. As a rule of thumb, tangentialdimensional change is about twice that of the radial direc-tion; but again, there are variations by species. (See Ch. 3for a detailed discussion of wood moisture relations.)
Dimensional changes that accompany changes in moisturecontent have broad-ranging and significant consequences onperformance of bonded joints. As wood in bonded assembliesswells and shrinks, stresses develop that can be great enoughto rupture adhesive bond and wood. Ruptures may developwhen adjacent pieces of wood in a bonded joint differ in graindirection and shrinkage coefficients, for example, radial grainbonded to tangential grain, or in the worst case, longitudinalgrain bonded to either tangential or radial grain. Even ifmoisture content levels in adjacent pieces are equal, butchanging, stresses could be severe. Moreover, if moisturecontent in one piece is at equilibrium with surrounding air,that is, stable, but the other piece with differing grain direc-tion is shrinking as it approaches equilibrium moisturecontent (EMC), then resultant stresses would be com-pounded and almost sure to rupture either the adhesive bondor the wood, whichever is weaker. Some wood adhesives areelastic enough to yield to stresses so that fracture does notoccur. Structural wood adhesives have greater moduli ofelasticity than wood and can effectively transfer stresses fromone adherend to the other without failure. However, ifstresses are great enough from extraordinary moisture contentchanges within adjacent pieces of wood of differing shrinkagecoefficients, then fracture in either wood or a poor bond isalmost inevitable. Severe stresses on bondlines can beminimized by bonding pieces of wood with compatible graindirections of low shrinkage coefficients at a uniform moisturecontent equivalent to that which the bonded assembly willencounter in service.
The amount of moisture in wood combined with water inadhesive will greatly influence the wetting, flow, penetration,and even cure of aqueous wood adhesives. In general, theseadhesives bond satisfactorily across moisture content levelsranging from 6% to 14% and even below and above thisrange when adhesives are formulated for specialized process-ing. The optimum moisture content range for bonding aspecific product with a specific adhesive is determined frompractical experience and product performance. Aqueous adhe-sives tend to dry out when applied to wood below 6% mois-ture content. Wood absorbs water from the adhesive soquickly that adhesive flow and penetration into the wood isdrastically inhibited, even under high pressure. Wood maybecome so dry below 3% moisture content that it temporar-ily resists wetting by the adhesive because insufficient waterremains bound to the wood to establish intermolecular attrac-tion forces with water in the adhesive.
When wood contains excess amounts of moisture, then lesswater and adhesive can be absorbed by the wood. This leadsto excessive adhesive mobility, followed by squeeze-outwhen pressure is applied. Control of moisture content isparticularly critical to bonding in hot presses becauseexcess moisture increases adhesive mobility, followed by
overpenetration of the adhesive. Furthermore, high vaporpressure builds internally as water boils, and on release ofplaten pressure, sudden release of internal pressure actuallyseparates laminates along the bondlines, called blows. Evenif blows do not occur, excess moisture within thermosettingadhesives can prevent complete cross-linking with accompa-nying weakened adhesive film and bond. Appropriate mois-ture content levels of wood for bonding by hot-press methodsare well known, as are target moisture content levels forsatisfactory service of wood products throughout the UnitedStates. However, control of moisture content in bondingwood materials is not easily achieved. This is discussed inthe Moisture Content Control section.
AdhesivesCompositionOrganic polymers of either natural or synthetic origin are themajor chemical ingredients in all formulations of woodadhesives. According to ASTM, a polymer is a compoundformed by the reaction of simple molecules having functionalgroups that permit their combination to proceed to highermolecular weights under suitable conditions. Polysaccharidesand proteins are high molecular weight natural polymersderived from plants and animals. Animal, blood, hide,casein, starch, soybean, dextrin, and cellulosic adhesives areall derived from the natural polymers found in these indicatedsources. They have been used as adhesives for centuries andare still in use today, although they have been replacedmostly by adhesives made with synthetic polymers. The firstwood adhesives based on synthetic polymers were producedcommercially during the 1930s. This marked the beginningof fundamental changes in composition of adhesives fromnatural to synthesized polymers. These adhesives could notonly be stronger, more rigid, and more durable than wood,but also have much greater resistance to water than adhesivesfrom natural polymers.
Synthetic polymers are chemically designed and formulatedinto adhesives to perform a great variety of bonding func-tions. Whether the base polymer is thermoplastic or thermo-setting has a major influence on how an adhesive will per-form in service. Thermoplastics are long-chain polymersthat soften and flow on heating, then harden again by cool-ing. They generally have less resistance to heat, moisture,and long-term static loading than do thermosetting poly-mers. Common wood adhesives that are based on thermo-plastic polymers include polyvinyl acetate emulsions, elas-tomerics, contacts, and hot-melts. Thermosetting polymersmake excellent structural adhesives because they undergoirreversible chemical change, and on reheating, they do notsoften and flow again. They form cross-linked polymers thathave high strength, have resistance to moisture and otherchemicals, and are rigid enough to support high, long-termstatic loads without deforming. Phenolic, resorcinolic,melamine, isocyanate, urea, and epoxy are examples of typesof wood adhesives that are based on thermosetting polymers.
9–10
A formulation of wood adhesive consists of a mixture ofseveral chemically active and inert materials that vary inproportion with the basic adhesive polymer, which enhancesperformance, whether it be working characteristics, strengthproperties, shelf life, or durability. Solvents disperse ordissolve adhesive polymers, act as carriers of polymer andadditives, aid wetting, and control flow and penetration ofthe adhesive. Water is used as the carrier for most woodadhesives, primarily because water readily absorbs intowood, is inexpensive, and is free of toxicity problems. Adhe-sive polymers can be brought into intimate, even molecular,contact with wood by water as the carrier. Organic solventsare used with elastomeric and contact adhesives, althoughwater-based adhesive systems have lower toxicity and flam-mability. Fillers of both organic and inorganic origins con-tribute to rheological control of the fluid system, particularlyin reducing the spreading and penetrating of the adhesive intowood. Reinforcing fibers, mostly inert and of organic origins,can enhance an adhesive film’s mechanical properties, espe-cially toughness, impact resistance, and shrinkage. Extendersare filler-like organic materials that may have sufficientchemical activity to improve adhesion to a small degree, butthey are used primarily to control flow and other workingcharacteristics, without excess sacrifice of adhesion capabil-ity, as is the case with most fillers.
Certain chemicals and polymeric systems plasticize adhesivepolymers, and others are used to enhance tackiness. Plasti-cizers, such as dibutyl phthalate, are used to soften brittlevinyl acetate homopolymer in polyvinyl acetate emulsionadhesives, which facilitates diffusion of adhesive and forma-tion of a flexible adhesive film from the emulsion at andbelow room temperature. Phenolic polymers are used astackifiers and adhesion promoters in neoprene and nitrilerubber contact adhesives. Reactive polymeric fortifiers, suchas melamine-formaldehyde, can be substituted in limitedproportions in urea-formaldehyde adhesives to improveresistance to moisture and heat. Phenol-formaldehyde may besubstituted for resorcinol-formaldehyde to reduce adhesivecosts, without sacrificing adhesive strength and durability.
Catalysts are chemicals used to accelerate the rate of chemicalreaction of polymeric components. Acids, bases, salts, perox-ides, and sulfur compounds are a few examples of catalysts.Catalysts do not become a part of the reacted compound;they simply increase the rate of reaction. Hardeners are addedto base polymers as reactive components, and they do be-come a part of the reacted compound. Examples are an aminehardener added to epoxy and formaldehyde added to resorci-nol—all produce cross-linking reactions to solidify the adhe-sive. Other chemicals, such as antioxidants, acid scavengers,preservatives, wetting agents, defoamers, even colorants, maybe added to control or eliminate some of the less desirablecharacteristics of certain adhesive formulations.
Health and SafetyWood adhesives contain chemicals that are toxic to people ifthey are exposed to sufficient concentrations for prolongedperiods. Generally, it is accepted that wood adhesives in a
cured state do not present toxicity problems. A notableexception is urea-formaldehyde adhesive, which can releaselow concentrations of formaldehyde from bonded wood prod-ucts under certain service conditions. Formaldehyde is atoxic gas that can react with proteins of the body to causeirritation and, in some cases, inflammation of membranes ofeyes, nose, and throat. It is a suspected carcinogen, based onlaboratory experiments with rats. Considerable research hasled to new adhesive formulations with significantly reducedlevels of formaldehyde emissions in both manufacturingoperations and bonded wood products. Phenol-formaldehydeadhesives, which are used to manufacture plywood, flake-board, and fiberglass insulation, also contain formaldehyde.However, formaldehyde is efficiently consumed in the curingreaction, and the highly durable phenol-formaldehyde, resor-cinol-formaldehyde, and phenol-resorcinol-formaldehydepolymers do not chemically break down in service to releasetoxic gas.
Diisocyanates are highly reactive chemicals that polymerizerapidly on contact with strong alkali, mineral acids, andwater. Polymeric methylene diphenyl diisocyanate (PMDI)adhesives develop strong and durable bonds to wood, sothey are now widely used to manufacture composite woodproducts. They are potentially hazardous if mishandled, butthe low vapor pressure of PMDI adhesives coupled withadequate ventilation to remove airborne PMDI on dust parti-cles, permits manufacturing plants to operate safely. Properlycured PMDI adhesives are not considered hazardous inbonded wood products.
Construction and contact adhesives contain organic solventsthat have low flash points. If these adhesives are used inunventilated areas where concentrations build to dangerouslyhigh levels, explosions can occur with an ignition source.Some adhesive producers now offer less flammable formula-tions based on chlorinated solvents. Organic solvents inthese adhesives are toxic, but by following the manufac-turer’s handling and use instructions, coupled with adequateventilation, harmful effects can be avoided.
Health and safety regulations require that toxic and hazardouschemicals be identified and visibly labeled to warn of theirdangers. Material safety data sheets (MSDS) or instructionsare provided with adhesive products to advise of properhandling procedures, protective gear and clothing, and proce-dures for dealing with spills and fire, as well as to offer guid-ance for first-aid and professional treatment of injuries. Thestatements made in this section concerning safety of adhe-sives and effects on the health of the user are general and notmeant to be all inclusive. The user should consult theMSDS and follow the manufacturer’s instructions and pre-cautions before using any adhesive.
Strength and DurabilityThe ability of an adhesive to transfer load from one memberof an assembly to another and to maintain integrity of theassembly under the expected conditions of service willgovern the choice of adhesive for a given application.
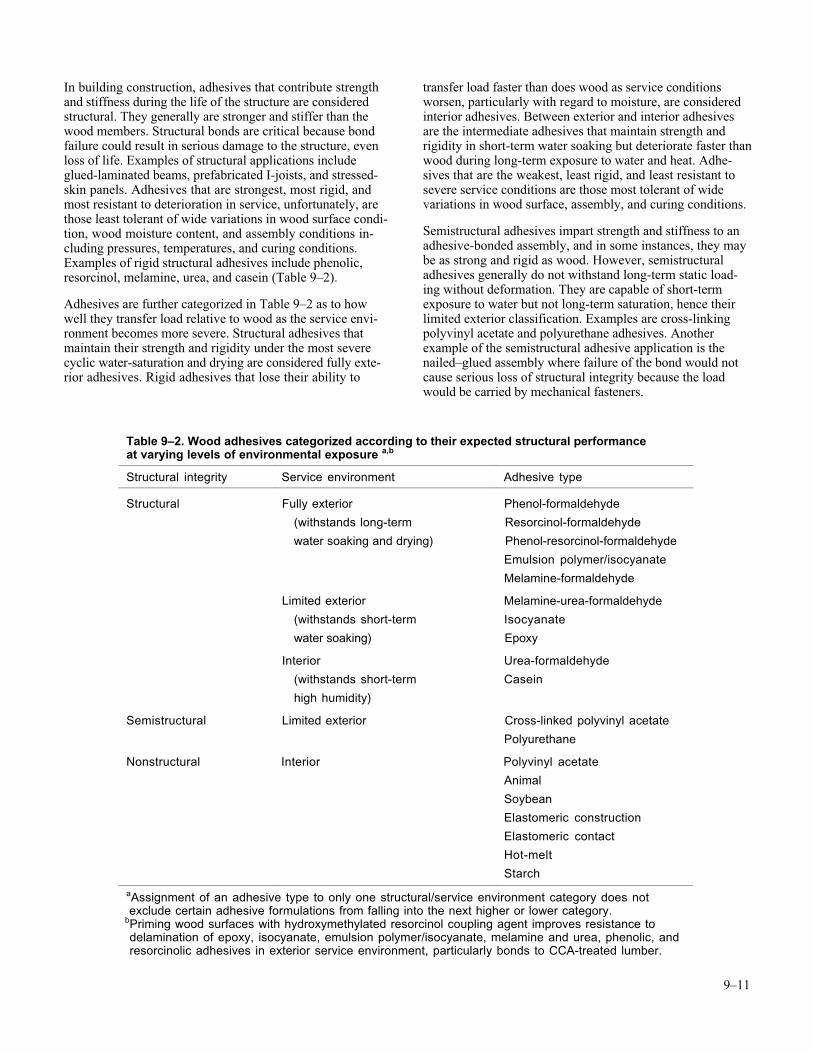
9–11
In building construction, adhesives that contribute strengthand stiffness during the life of the structure are consideredstructural. They generally are stronger and stiffer than thewood members. Structural bonds are critical because bondfailure could result in serious damage to the structure, evenloss of life. Examples of structural applications includeglued-laminated beams, prefabricated I-joists, and stressed-skin panels. Adhesives that are strongest, most rigid, andmost resistant to deterioration in service, unfortunately, arethose least tolerant of wide variations in wood surface condi-tion, wood moisture content, and assembly conditions in-cluding pressures, temperatures, and curing conditions.Examples of rigid structural adhesives include phenolic,resorcinol, melamine, urea, and casein (Table 9–2).
Adhesives are further categorized in Table 9–2 as to howwell they transfer load relative to wood as the service envi-ronment becomes more severe. Structural adhesives thatmaintain their strength and rigidity under the most severecyclic water-saturation and drying are considered fully exte-rior adhesives. Rigid adhesives that lose their ability to
transfer load faster than does wood as service conditionsworsen, particularly with regard to moisture, are consideredinterior adhesives. Between exterior and interior adhesivesare the intermediate adhesives that maintain strength andrigidity in short-term water soaking but deteriorate faster thanwood during long-term exposure to water and heat. Adhe-sives that are the weakest, least rigid, and least resistant tosevere service conditions are those most tolerant of widevariations in wood surface, assembly, and curing conditions.
Semistructural adhesives impart strength and stiffness to anadhesive-bonded assembly, and in some instances, they maybe as strong and rigid as wood. However, semistructuraladhesives generally do not withstand long-term static load-ing without deformation. They are capable of short-termexposure to water but not long-term saturation, hence theirlimited exterior classification. Examples are cross-linkingpolyvinyl acetate and polyurethane adhesives. Anotherexample of the semistructural adhesive application is thenailed–glued assembly where failure of the bond would notcause serious loss of structural integrity because the loadwould be carried by mechanical fasteners.
Table 9–2. Wood adhesives categorized according to their expected structural performanceat varying levels of environmental exposure a,b
Structural integrity Service environment Adhesive type
Structural Fully exterior Phenol-formaldehyde
(withstands long-term Resorcinol-formaldehyde
water soaking and drying) Phenol-resorcinol-formaldehyde
Emulsion polymer/isocyanate
Melamine-formaldehyde
Limited exterior Melamine-urea-formaldehyde
(withstands short-term Isocyanate
water soaking) Epoxy
Interior Urea-formaldehyde
(withstands short-term Casein
high humidity)
Semistructural Limited exterior Cross-linked polyvinyl acetate
Polyurethane
Nonstructural Interior Polyvinyl acetate
Animal
Soybean
Elastomeric construction
Elastomeric contact
Hot-melt
Starch
aAssignment of an adhesive type to only one structural/service environment category does not exclude certain adhesive formulations from falling into the next higher or lower category.bPriming wood surfaces with hydroxymethylated resorcinol coupling agent improves resistance to delamination of epoxy, isocyanate, emulsion polymer/isocyanate, melamine and urea, phenolic, and resorcinolic adhesives in exterior service environment, particularly bonds to CCA-treated lumber.
9–12
Nonstructural adhesives typically support the dead weight ofthe material being bonded and can equal the strength andrigidity of wood in the dry condition. However, on exposureto water or high humidity, nonstructural adhesives quicklylose their load transfer ability. Examples are adhesives usedfor bonding wall tiles and fixtures.
Elastomeric construction adhesives are categorized as non-structural. However, they are used normally for field assem-bly of panelized floor and wall systems in the light-frameconstruction industry. Nails are used in the assembly so thatif failure did occur in the adhesive bond, the structural loadwould be carried by nails. The adhesive enables the nailedassembly to act as a composite with increased stiffness. Withnails providing structural safety in this application, elas-tomeric adhesives could be included in the semistructuralcategory.
Some adhesives listed in Table 9–2 could be included easilyin more than one category because they can be formulated fora broad range of applications. Isocyanate and polyurethaneadhesives are examples. Polymeric methylene diphenyldiisocyanates of low molecular weight develop highly dura-ble bonds in structural flakeboards, although flakeboardproducts deteriorate from swelling and shrinkage stresses.One-part polyurethane adhesives have highly durable adhe-sive films, but as molecular weight increases, adhesion toporous wood generally decreases and bonds become increas-ingly susceptible to deterioration from swelling and shrink-age stresses. Polyurethane adhesives liberate carbon dioxideon reaction with water. As a result, they foam, and in thickbondlines, polyurethane bonds become more deformableunder static loading. Two-part polyurethanes can be formu-lated for rigidity, depending on the degree of structuralloading required.
Adhesive SelectionAdhesive selection begins by considering the types of woodadhesives, along with their strength and durability, prepara-tion and use characteristics, and typical applications, asshown in abbreviated form in Table 9–3. Their relativestrength and durability are categorized into levels of struc-tural integrity (Table 9–2) and were discussed previously.Adhesive selection for a wood product manufacturer maybegin as a cooperative effort between the manufacturer and anadhesive supplier. Together, they completely review theproduct, its intended service environment, and all productionprocesses and equipment before choosing an appropriateadhesive. Whatever the approach to adhesive selection mightbe, the following general discussion should be helpful.
A broad array of adhesive types, with significant variationswithin each type, are available for bonding wood materials,even for bonding wood to nonwood materials. The selectionprocess begins with determining which adhesives are com-patible with the physical and chemical properties of theadherends, particularly their surface properties. The polar,aqueous wood adhesive must be capable of wetting the usu-ally polar wood surface, within its normal variations in
hydrophilicity. As the adhesive wets, it must have flowproperties that enable it to spread over surfaces of variableroughness and to penetrate wood structures that differ inporosity, with respect to grain orientation at the bondline.The adhesive must make molecular contact with the ligno-cellulosics of wood and penetrate deeply enough to mechani-cally interlock with the wood’s cell structure. Metals andplastics cannot be penetrated, so these materials generallycannot be bonded with aqueous wood adhesives. However,nonaqueous, 100% solids adhesives, including epoxy, isocy-anate, and polyurethane, are capable of sound bonds to non-wood and wood materials.
The structural integrity expected of the adhesive bond underanticipated service loads in the presence of expected envi-ronmental exposure conditions should be one of the foremostconsiderations. To intelligently select an adhesive for a givenbonded assembly, it is necessary to have an approximation ofthe nature, direction, level, and duration of loading that theassembly and bondlines must withstand. Furthermore, it isessential to know the range and duration of temperature andmoisture content levels to which bondlines will be sub-jected. For example, prolonged exposure to high moisturecontent levels will significantly reduce the load-carryingability of any adhesive in a wood joint. Failure to give fullconsideration to these factors could risk structural failure ofthe bonded assembly, even severe personal injury.
There may be need for tradeoffs between bonding require-ments of adhesives and their resistance to stress, duration ofload, and service environment. Adhesives that are the strong-est, most rigid, and durable are generally those least tolerantof bonding conditions, including wood moisture content,surface roughness, cleanliness, inactivation, grain orientation,bondline thickness, and pressure and temperature of cure.Adhesives that are the weakest, least rigid, and least resistantto service conditions are those most tolerant of bondingconditions. Many adhesives are positioned between theseextremes of bonding requirements and performance(Tables 9–2 and 9–3).
When a group of adhesives with suitable performance capa-bilities for a particular bonded assembly has been deter-mined, the user also must choose within that group an adhe-sive that can be mixed, applied, and cured with availableequipment or consider the cost of purchasing equipment tomeet specific working properties of another adhesive. Impor-tant working properties must be considered when makingcost decisions. The working life of an adhesive is the timebetween mixing and the end of its useful life when it be-comes too viscous to properly wet and flow over a surface.
If an adhesive requires mixing with a hardener or catalyst,then mixing and application equipment appropriate for theworking life must be considered. Given the consistency of anadhesive, specific types of application equipment are re-quired. Depending on the size of the spreading operation, theequipment can range from brush to roll-spreader to extruderto spray to meter-mixed extrusion. Wood adhesives, includ-ing phenolic, melamine, urea, and isocyanate adhesives,
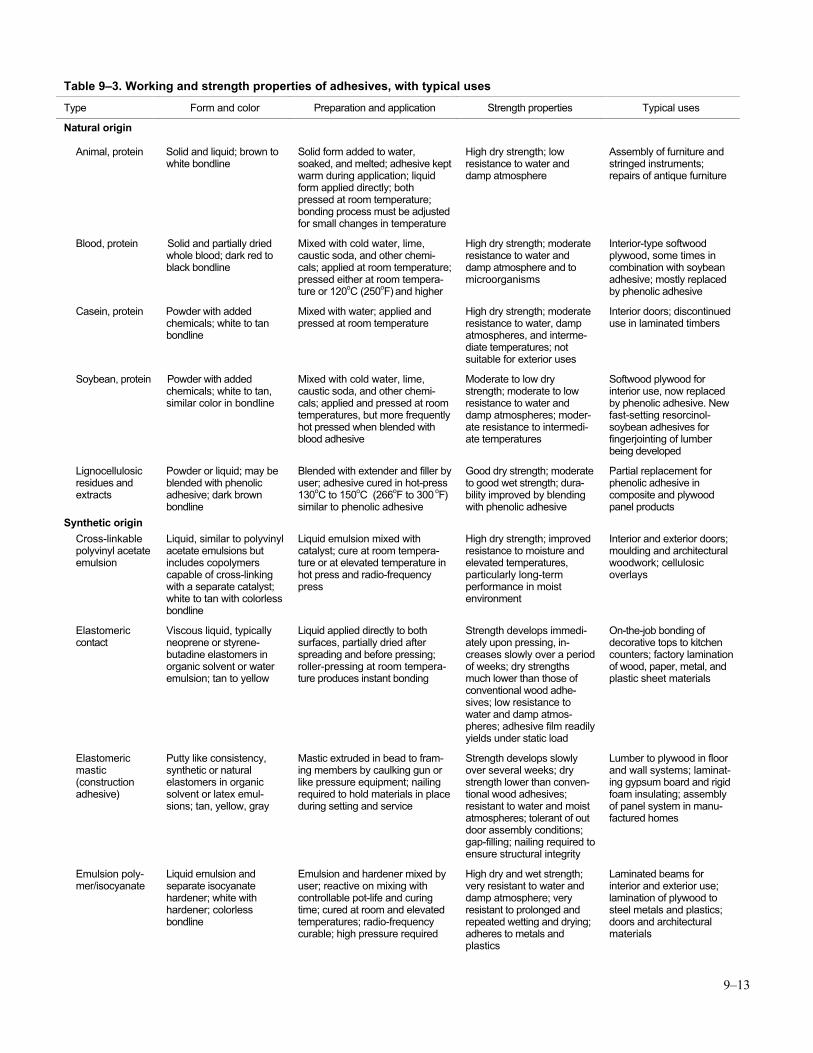
9–13
Table 9–3. Working and strength properties of adhesives, with typical uses
Type Form and color Preparation and application Strength properties Typical uses
Natural origin
Animal, protein Solid and liquid; brown towhite bondline
Solid form added to water,soaked, and melted; adhesive keptwarm during application; liquidform applied directly; bothpressed at room temperature;bonding process must be adjustedfor small changes in temperature
High dry strength; lowresistance to water anddamp atmosphere
Assembly of furniture andstringed instruments;repairs of antique furniture
Blood, protein Solid and partially driedwhole blood; dark red toblack bondline
Mixed with cold water, lime,caustic soda, and other chemi-cals; applied at room temperature;pressed either at room tempera-ture or 120oC (250oF) and higher
High dry strength; moderateresistance to water anddamp atmosphere and tomicroorganisms
Interior-type softwoodplywood, some times incombination with soybeanadhesive; mostly replacedby phenolic adhesive
Casein, protein Powder with addedchemicals; white to tanbondline
Mixed with water; applied andpressed at room temperature
High dry strength; moderateresistance to water, dampatmospheres, and interme-diate temperatures; notsuitable for exterior uses
Interior doors; discontinueduse in laminated timbers
Soybean, protein Powder with addedchemicals; white to tan,similar color in bondline
Mixed with cold water, lime,caustic soda, and other chemi-cals; applied and pressed at roomtemperatures, but more frequentlyhot pressed when blended withblood adhesive
Moderate to low drystrength; moderate to lowresistance to water anddamp atmospheres; moder-ate resistance to intermedi-ate temperatures
Softwood plywood forinterior use, now replacedby phenolic adhesive. Newfast-setting resorcinol-soybean adhesives forfingerjointing of lumberbeing developed
Lignocellulosicresidues andextracts
Powder or liquid; may beblended with phenolicadhesive; dark brownbondline
Blended with extender and filler byuser; adhesive cured in hot-press130oC to 150oC (266oF to 300 oF)similar to phenolic adhesive
Good dry strength; moderateto good wet strength; dura-bility improved by blendingwith phenolic adhesive
Partial replacement forphenolic adhesive incomposite and plywoodpanel products
Synthetic origin
Cross-linkablepolyvinyl acetateemulsion
Liquid, similar to polyvinylacetate emulsions butincludes copolymerscapable of cross-linkingwith a separate catalyst;white to tan with colorlessbondline
Liquid emulsion mixed withcatalyst; cure at room tempera-ture or at elevated temperature inhot press and radio-frequencypress
High dry strength; improvedresistance to moisture andelevated temperatures,particularly long-termperformance in moistenvironment
Interior and exterior doors;moulding and architecturalwoodwork; cellulosicoverlays
Elastomericcontact
Viscous liquid, typicallyneoprene or styrene-butadine elastomers inorganic solvent or wateremulsion; tan to yellow
Liquid applied directly to bothsurfaces, partially dried afterspreading and before pressing;roller-pressing at room tempera-ture produces instant bonding
Strength develops immedi-ately upon pressing, in-creases slowly over a periodof weeks; dry strengthsmuch lower than those ofconventional wood adhe-sives; low resistance towater and damp atmos-pheres; adhesive film readilyyields under static load
On-the-job bonding ofdecorative tops to kitchencounters; factory laminationof wood, paper, metal, andplastic sheet materials
Elastomericmastic(constructionadhesive)
Putty like consistency,synthetic or naturalelastomers in organicsolvent or latex emul-sions; tan, yellow, gray
Mastic extruded in bead to fram-ing members by caulking gun orlike pressure equipment; nailingrequired to hold materials in placeduring setting and service
Strength develops slowlyover several weeks; drystrength lower than conven-tional wood adhesives;resistant to water and moistatmospheres; tolerant of outdoor assembly conditions;gap-filling; nailing required toensure structural integrity
Lumber to plywood in floorand wall systems; laminat-ing gypsum board and rigidfoam insulating; assemblyof panel system in manu-factured homes
Emulsion poly-mer/isocyanate
Liquid emulsion andseparate isocyanatehardener; white withhardener; colorlessbondline
Emulsion and hardener mixed byuser; reactive on mixing withcontrollable pot-life and curingtime; cured at room and elevatedtemperatures; radio-frequencycurable; high pressure required
High dry and wet strength;very resistant to water anddamp atmosphere; veryresistant to prolonged andrepeated wetting and drying;adheres to metals andplastics
Laminated beams forinterior and exterior use;lamination of plywood tosteel metals and plastics;doors and architecturalmaterials
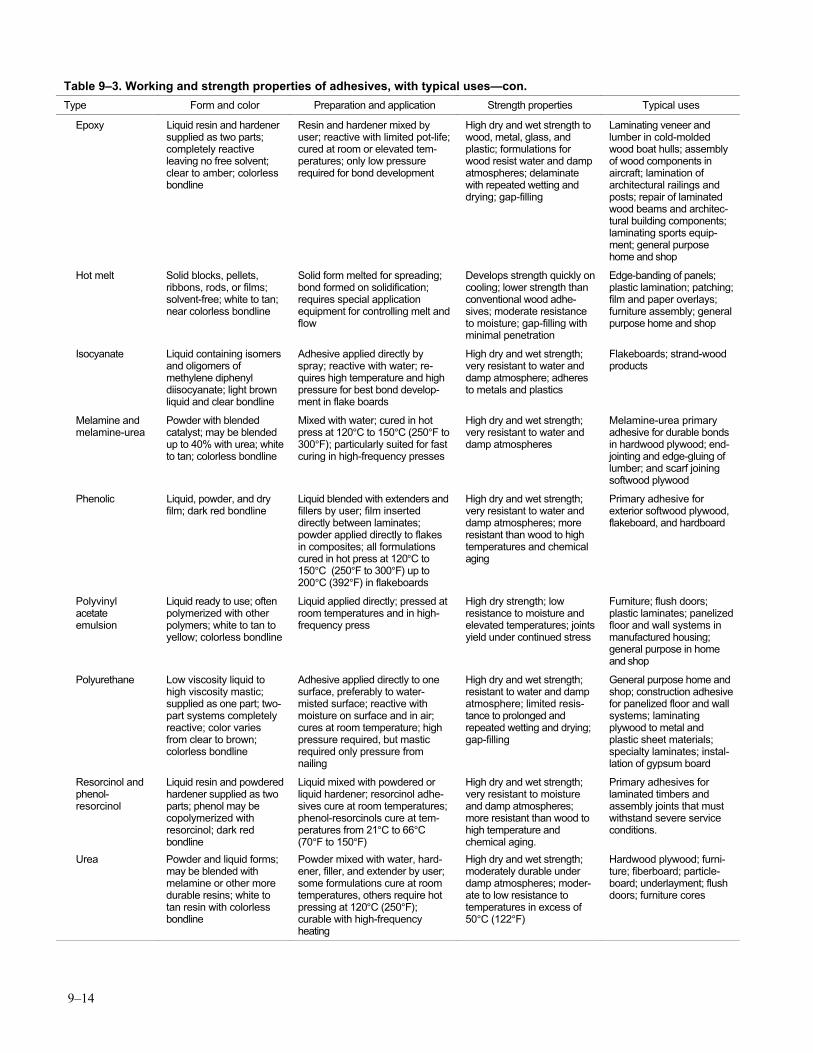
9–14
Table 9–3. Working and strength properties of adhesives, with typical uses—con.
Type Form and color Preparation and application Strength properties Typical uses
Epoxy Liquid resin and hardenersupplied as two parts;completely reactiveleaving no free solvent;clear to amber; colorlessbondline
Resin and hardener mixed byuser; reactive with limited pot-life;cured at room or elevated tem-peratures; only low pressurerequired for bond development
High dry and wet strength towood, metal, glass, andplastic; formulations forwood resist water and dampatmospheres; delaminatewith repeated wetting anddrying; gap-filling
Laminating veneer andlumber in cold-moldedwood boat hulls; assemblyof wood components inaircraft; lamination ofarchitectural railings andposts; repair of laminatedwood beams and architec-tural building components;laminating sports equip-ment; general purposehome and shop
Hot melt Solid blocks, pellets,ribbons, rods, or films;solvent-free; white to tan;near colorless bondline
Solid form melted for spreading;bond formed on solidification;requires special applicationequipment for controlling melt andflow
Develops strength quickly oncooling; lower strength thanconventional wood adhe-sives; moderate resistanceto moisture; gap-filling withminimal penetration
Edge-banding of panels;plastic lamination; patching;film and paper overlays;furniture assembly; generalpurpose home and shop
Isocyanate Liquid containing isomersand oligomers ofmethylene diphenyldiisocyanate; light brownliquid and clear bondline
Adhesive applied directly byspray; reactive with water; re-quires high temperature and highpressure for best bond develop-ment in flake boards
High dry and wet strength;very resistant to water anddamp atmosphere; adheresto metals and plastics
Flakeboards; strand-woodproducts
Melamine andmelamine-urea
Powder with blendedcatalyst; may be blendedup to 40% with urea; whiteto tan; colorless bondline
Mixed with water; cured in hotpress at 120°C to 150°C (250°F to300°F); particularly suited for fastcuring in high-frequency presses
High dry and wet strength;very resistant to water anddamp atmospheres
Melamine-urea primaryadhesive for durable bondsin hardwood plywood; end-jointing and edge-gluing oflumber; and scarf joiningsoftwood plywood
Phenolic Liquid, powder, and dryfilm; dark red bondline
Liquid blended with extenders andfillers by user; film inserteddirectly between laminates;powder applied directly to flakesin composites; all formulationscured in hot press at 120°C to150°C (250°F to 300°F) up to200°C (392°F) in flakeboards
High dry and wet strength;very resistant to water anddamp atmospheres; moreresistant than wood to hightemperatures and chemicalaging
Primary adhesive forexterior softwood plywood,flakeboard, and hardboard
Polyvinylacetateemulsion
Liquid ready to use; oftenpolymerized with otherpolymers; white to tan toyellow; colorless bondline
Liquid applied directly; pressed atroom temperatures and in high-frequency press
High dry strength; lowresistance to moisture andelevated temperatures; jointsyield under continued stress
Furniture; flush doors;plastic laminates; panelizedfloor and wall systems inmanufactured housing;general purpose in homeand shop
Polyurethane Low viscosity liquid tohigh viscosity mastic;supplied as one part; two-part systems completelyreactive; color variesfrom clear to brown;colorless bondline
Adhesive applied directly to onesurface, preferably to water-misted surface; reactive withmoisture on surface and in air;cures at room temperature; highpressure required, but masticrequired only pressure fromnailing
High dry and wet strength;resistant to water and dampatmosphere; limited resis-tance to prolonged andrepeated wetting and drying;gap-filling
General purpose home andshop; construction adhesivefor panelized floor and wallsystems; laminatingplywood to metal andplastic sheet materials;specialty laminates; instal-lation of gypsum board
Resorcinol andphenol-resorcinol
Liquid resin and powderedhardener supplied as twoparts; phenol may becopolymerized withresorcinol; dark redbondline
Liquid mixed with powdered orliquid hardener; resorcinol adhe-sives cure at room temperatures;phenol-resorcinols cure at tem-peratures from 21°C to 66°C(70°F to 150°F)
High dry and wet strength;very resistant to moistureand damp atmospheres;more resistant than wood tohigh temperature andchemical aging.
Primary adhesives forlaminated timbers andassembly joints that mustwithstand severe serviceconditions.
Urea Powder and liquid forms;may be blended withmelamine or other moredurable resins; white totan resin with colorlessbondline
Powder mixed with water, hard-ener, filler, and extender by user;some formulations cure at roomtemperatures, others require hotpressing at 120°C (250°F);curable with high-frequencyheating
High dry and wet strength;moderately durable underdamp atmospheres; moder-ate to low resistance totemperatures in excess of50°C (122°F)
Hardwood plywood; furni-ture; fiberboard; particle-board; underlayment; flushdoors; furniture cores
9–15
must be cured at high temperatures and require expensive,heated presses. Some of these can be cured within minutes inexpensive high frequency heated presses. Cold presses orclamps are satisfactory for room-temperature-curing adhe-sives, although the long curing time in production can be aconstraint. Even after hot or cold pressing, adhesive bondsmust remain undisturbed until most of the curing hasoccurred.
There are other important considerations, particularly infurniture and interior millwork, where appearance is all-important. Adhesive color, ability to absorb stains andfinishes, and freedom from bleeding and staining are criticalfactors. The urea-formaldehyde and polyvinyl acetate adhe-sives used in the furniture industry are formulated to give atan or colorless joint with good acceptance of stain.
Ease and simplicity of use can also be important factors.One-part adhesives, like liquid animal, polyvinyl acetate,hot-melt, and phenol-formaldehyde film, are the simplest touse because there is no chance for error in weighing andmixing components. Water-dispersed and film adhesives areeasy to clean up, whereas films are the least messy. Two-,three-, or multiple-part adhesives require careful measuringand mixing of components. They often require special sol-vents for cleanup after bonding. Frequently, adhesives aretoxic to the skin or give off toxic fumes. Formaldehydehardener for resorcinol, phenol, melamine, and urea adhesivesis an irritant to many people. Amine hardeners in someepoxy adhesives are strong skin sensitizers.
The cost of an adhesive and related application equipmentmust be balanced against comparable cost factors for substi-tuted adhesives. In recent years, the cost of organic solventsand the cost of recovering volatiles to prevent air pollutionhave increased. Substituted water-based systems can becheaper due to low cost of the solvent; however, grain raisingof the wood and slower drying must be considered because oftheir effects on performance and overall cost.
Bonding ProcessThe bonding process involves a great number of factors thatdetermine how successfully an adhesive bond will ultimatelyperform in service. The better these factors are understoodand controlled, the fewer bonding problems will be encoun-tered, along with their attendant expense. It is not necessaryto be an adhesive expert to manufacture acceptable bonds,although more knowledge is always helpful. However, it isessential that the user follow the instructions of the adhesivesupplier during the entire bonding process. The supplier hasextensive technical knowledge of an adhesive’s composition,working characteristics, and performance properties, which isreinforced by the experience of customers.
Moisture Content ControlAfter adhesive selection, the next most important factorcontributing to trouble-free service of adhesive bonds is
control of wood moisture content before and during thebonding process. Moisture content strongly affects the finalstrength and durability of joints, development of surfacechecks in the wood, and dimensional stability of the bondedassembly. Large changes in the moisture content comparedwith that at the time of bonding will cause shrinking orswelling stresses that can seriously weaken both wood andjoints and can cause warping, twisting, and surface irregulari-ties. Wood should not be bonded at high moisture content,particularly high density hardwoods that have large coeffi-cients of shrinkage, unless the in-service moisture content isalso expected to be high. The wood should be dry enough sothat even if moisture is added during bonding, the moisturecontent is at about the level expected for the assemblyin service.
Determining the proper moisture content for bonding de-pends primarily on the amount of moisture that is containedin the wood and adhesive and whether or not the adhesivecuring process involves heating. For example, if boards arebonded at room temperature, the final moisture content iscontrolled mainly by the moisture content of the wood. In alumber laminate, the number of bondlines are so few that awaterborne adhesive adds only 1% to 2% to the total mois-ture content of the laminate. However, if several pieces ofveneer are bonded at room temperature, the moisture addedby the adhesive in many bondlines can significantly increasethe moisture content of the wood well above the target in-service level. Thus, thickness of the laminates, number oflaminates, density of the wood, water content of the adhe-sive, quantity of adhesive spread, and hot or cold pressingall have a cumulative effect on the moisture content of thewood. During hot pressing, a moderate amount of waterevaporates from the laminate as it is removed from the press.However, to minimize plastic flow of the hot and moistwood and prevent steam blisters or blows, the total moisturecontent of the assembly should not exceed 10% during hotpressing. A lumber moisture content of 6% to 7%, assuming1% to 2% will be added by aqueous adhesives, is satisfactoryfor cold pressing of furniture and interior millwork. Lumberbeing laminated for exterior use should contain 10% to12% moisture before bonding. A moisture content of 3% to5% in veneer at the time of hot pressing is satisfactory forhardwood plywood intended for furniture and interior mill-work and for softwood plywood intended for constructionand industrial uses.
Lumber that has been kiln dried to the approximate averagemoisture content intended for bonding may still be at differ-ent moisture content levels between boards and within indi-vidual boards. Large differences in the moisture contentbetween adjacent boards bonded together result in consider-able stress on the common joint as the boards equalizetoward a common moisture content. Best results are achievedwhen differences are not greater than about 5% for lowerdensity species and 2% for high density species.
The moisture content of wood in bonded products should betargeted to the EMC that the product will experience in
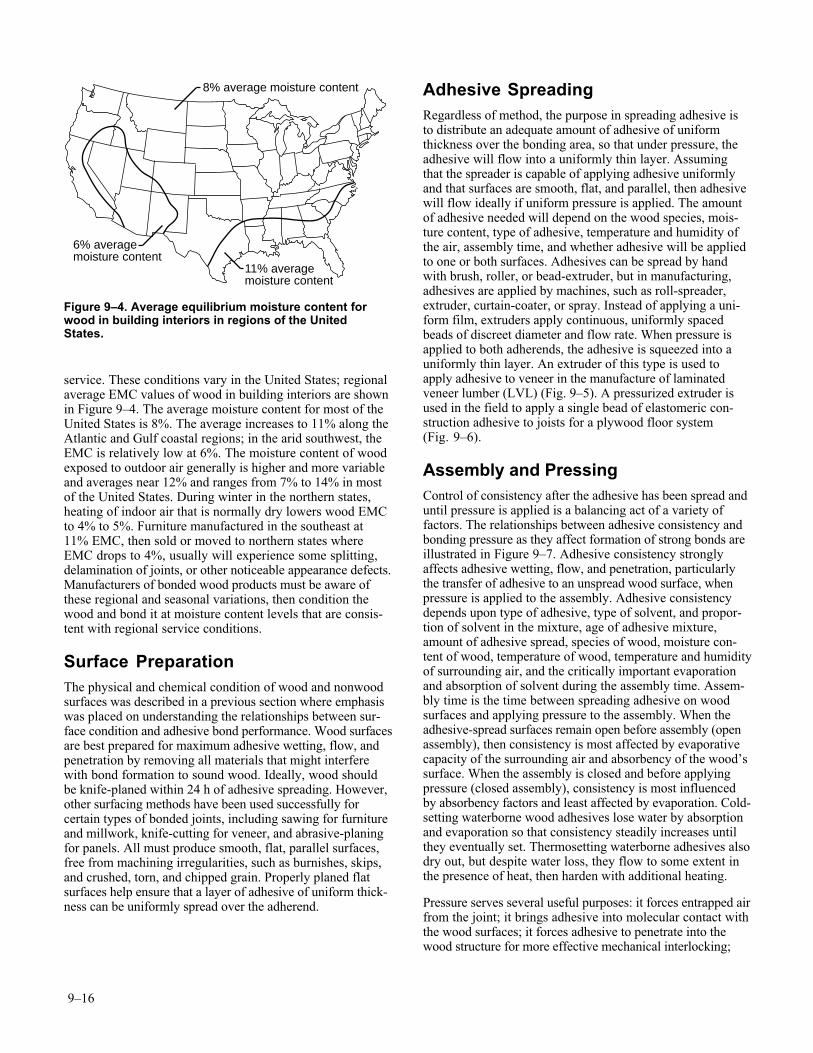
9–16
service. These conditions vary in the United States; regionalaverage EMC values of wood in building interiors are shownin Figure 9–4. The average moisture content for most of theUnited States is 8%. The average increases to 11% along theAtlantic and Gulf coastal regions; in the arid southwest, theEMC is relatively low at 6%. The moisture content of woodexposed to outdoor air generally is higher and more variableand averages near 12% and ranges from 7% to 14% in mostof the United States. During winter in the northern states,heating of indoor air that is normally dry lowers wood EMCto 4% to 5%. Furniture manufactured in the southeast at11% EMC, then sold or moved to northern states whereEMC drops to 4%, usually will experience some splitting,delamination of joints, or other noticeable appearance defects.Manufacturers of bonded wood products must be aware ofthese regional and seasonal variations, then condition thewood and bond it at moisture content levels that are consis-tent with regional service conditions.
Surface PreparationThe physical and chemical condition of wood and nonwoodsurfaces was described in a previous section where emphasiswas placed on understanding the relationships between sur-face condition and adhesive bond performance. Wood surfacesare best prepared for maximum adhesive wetting, flow, andpenetration by removing all materials that might interferewith bond formation to sound wood. Ideally, wood shouldbe knife-planed within 24 h of adhesive spreading. However,other surfacing methods have been used successfully forcertain types of bonded joints, including sawing for furnitureand millwork, knife-cutting for veneer, and abrasive-planingfor panels. All must produce smooth, flat, parallel surfaces,free from machining irregularities, such as burnishes, skips,and crushed, torn, and chipped grain. Properly planed flatsurfaces help ensure that a layer of adhesive of uniform thick-ness can be uniformly spread over the adherend.
Adhesive SpreadingRegardless of method, the purpose in spreading adhesive isto distribute an adequate amount of adhesive of uniformthickness over the bonding area, so that under pressure, theadhesive will flow into a uniformly thin layer. Assumingthat the spreader is capable of applying adhesive uniformlyand that surfaces are smooth, flat, and parallel, then adhesivewill flow ideally if uniform pressure is applied. The amountof adhesive needed will depend on the wood species, mois-ture content, type of adhesive, temperature and humidity ofthe air, assembly time, and whether adhesive will be appliedto one or both surfaces. Adhesives can be spread by handwith brush, roller, or bead-extruder, but in manufacturing,adhesives are applied by machines, such as roll-spreader,extruder, curtain-coater, or spray. Instead of applying a uni-form film, extruders apply continuous, uniformly spacedbeads of discreet diameter and flow rate. When pressure isapplied to both adherends, the adhesive is squeezed into auniformly thin layer. An extruder of this type is used toapply adhesive to veneer in the manufacture of laminatedveneer lumber (LVL) (Fig. 9–5). A pressurized extruder isused in the field to apply a single bead of elastomeric con-struction adhesive to joists for a plywood floor system(Fig. 9–6).
Assembly and PressingControl of consistency after the adhesive has been spread anduntil pressure is applied is a balancing act of a variety offactors. The relationships between adhesive consistency andbonding pressure as they affect formation of strong bonds areillustrated in Figure 9–7. Adhesive consistency stronglyaffects adhesive wetting, flow, and penetration, particularlythe transfer of adhesive to an unspread wood surface, whenpressure is applied to the assembly. Adhesive consistencydepends upon type of adhesive, type of solvent, and propor-tion of solvent in the mixture, age of adhesive mixture,amount of adhesive spread, species of wood, moisture con-tent of wood, temperature of wood, temperature and humidityof surrounding air, and the critically important evaporationand absorption of solvent during the assembly time. Assem-bly time is the time between spreading adhesive on woodsurfaces and applying pressure to the assembly. When theadhesive-spread surfaces remain open before assembly (openassembly), then consistency is most affected by evaporativecapacity of the surrounding air and absorbency of the wood’ssurface. When the assembly is closed and before applyingpressure (closed assembly), consistency is most influencedby absorbency factors and least affected by evaporation. Cold-setting waterborne wood adhesives lose water by absorptionand evaporation so that consistency steadily increases untilthey eventually set. Thermosetting waterborne adhesives alsodry out, but despite water loss, they flow to some extent inthe presence of heat, then harden with additional heating.
Pressure serves several useful purposes: it forces entrapped airfrom the joint; it brings adhesive into molecular contact withthe wood surfaces; it forces adhesive to penetrate into thewood structure for more effective mechanical interlocking;
6% averagemoisture content
8% average moisture content
11% averagemoisture content
Figure 9–4. Average equilibrium moisture content forwood in building interiors in regions of the UnitedStates.
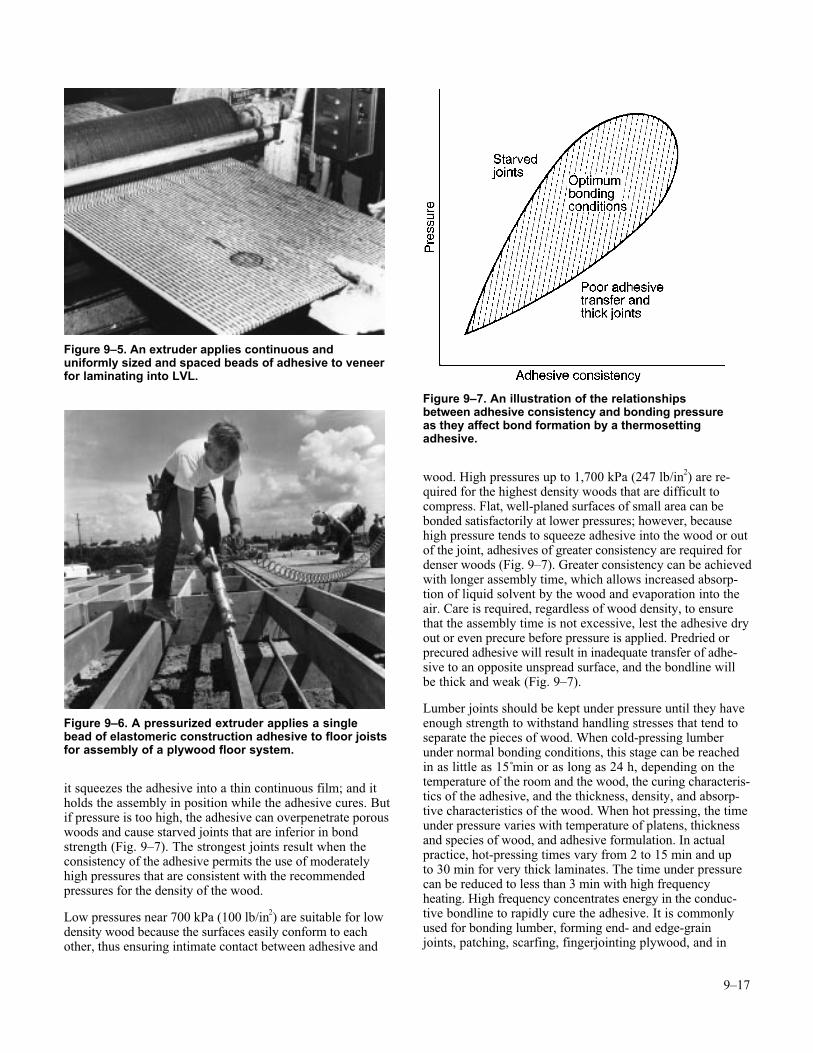
9–17
it squeezes the adhesive into a thin continuous film; and itholds the assembly in position while the adhesive cures. Butif pressure is too high, the adhesive can overpenetrate porouswoods and cause starved joints that are inferior in bondstrength (Fig. 9–7). The strongest joints result when theconsistency of the adhesive permits the use of moderatelyhigh pressures that are consistent with the recommendedpressures for the density of the wood.
Low pressures near 700 kPa (100 lb/in2) are suitable for lowdensity wood because the surfaces easily conform to eachother, thus ensuring intimate contact between adhesive and
wood. High pressures up to 1,700 kPa (247 lb/in2) are re-quired for the highest density woods that are difficult tocompress. Flat, well-planed surfaces of small area can bebonded satisfactorily at lower pressures; however, becausehigh pressure tends to squeeze adhesive into the wood or outof the joint, adhesives of greater consistency are required fordenser woods (Fig. 9–7). Greater consistency can be achievedwith longer assembly time, which allows increased absorp-tion of liquid solvent by the wood and evaporation into theair. Care is required, regardless of wood density, to ensurethat the assembly time is not excessive, lest the adhesive dryout or even precure before pressure is applied. Predried orprecured adhesive will result in inadequate transfer of adhe-sive to an opposite unspread surface, and the bondline willbe thick and weak (Fig. 9–7).
Lumber joints should be kept under pressure until they haveenough strength to withstand handling stresses that tend toseparate the pieces of wood. When cold-pressing lumberunder normal bonding conditions, this stage can be reachedin as little as 15 min or as long as 24 h, depending on thetemperature of the room and the wood, the curing characteris-tics of the adhesive, and the thickness, density, and absorp-tive characteristics of the wood. When hot pressing, the timeunder pressure varies with temperature of platens, thicknessand species of wood, and adhesive formulation. In actualpractice, hot-pressing times vary from 2 to 15 min and upto 30 min for very thick laminates. The time under pressurecan be reduced to less than 3 min with high frequencyheating. High frequency concentrates energy in the conduc-tive bondline to rapidly cure the adhesive. It is commonlyused for bonding lumber, forming end- and edge-grainjoints, patching, scarfing, fingerjointing plywood, and in
Figure 9–5. An extruder applies continuous anduniformly sized and spaced beads of adhesive to veneerfor laminating into LVL.
Figure 9–6. A pressurized extruder applies a singlebead of elastomeric construction adhesive to floor joistsfor assembly of a plywood floor system.
Figure 9–7. An illustration of the relationshipsbetween adhesive consistency and bonding pressureas they affect bond formation by a thermosettingadhesive.
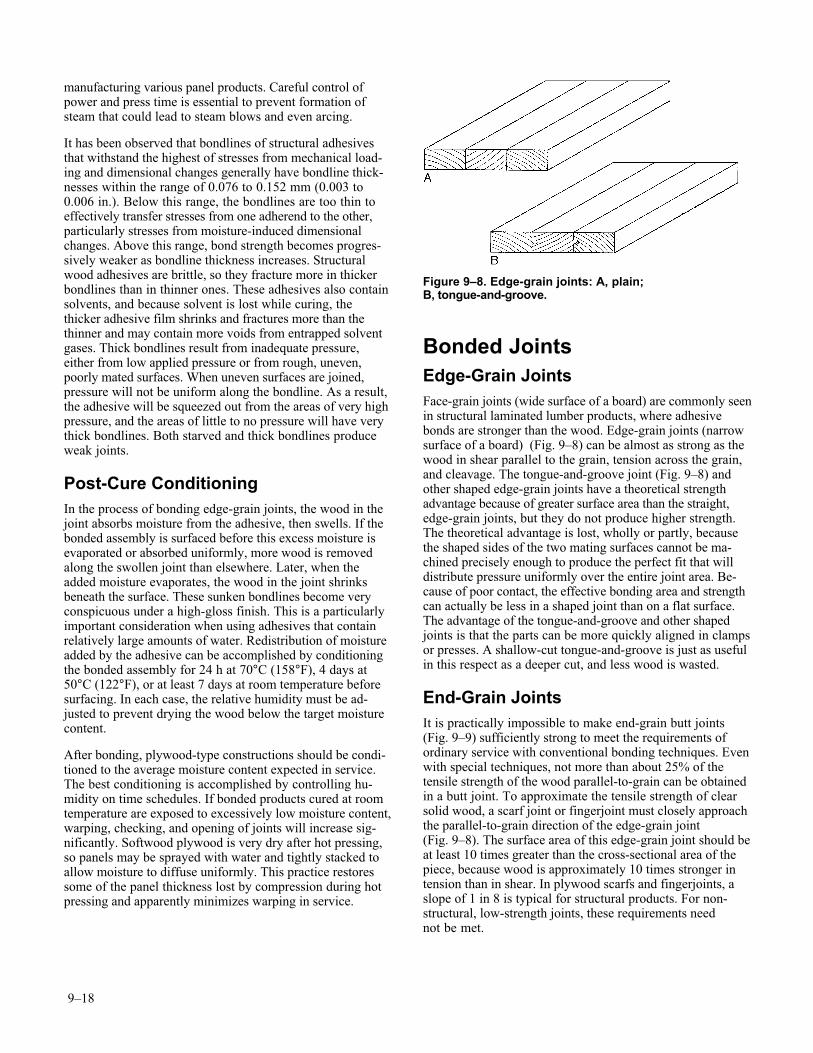
9–18
manufacturing various panel products. Careful control ofpower and press time is essential to prevent formation ofsteam that could lead to steam blows and even arcing.
It has been observed that bondlines of structural adhesivesthat withstand the highest of stresses from mechanical load-ing and dimensional changes generally have bondline thick-nesses within the range of 0.076 to 0.152 mm (0.003 to0.006 in.). Below this range, the bondlines are too thin toeffectively transfer stresses from one adherend to the other,particularly stresses from moisture-induced dimensionalchanges. Above this range, bond strength becomes progres-sively weaker as bondline thickness increases. Structuralwood adhesives are brittle, so they fracture more in thickerbondlines than in thinner ones. These adhesives also containsolvents, and because solvent is lost while curing, thethicker adhesive film shrinks and fractures more than thethinner and may contain more voids from entrapped solventgases. Thick bondlines result from inadequate pressure,either from low applied pressure or from rough, uneven,poorly mated surfaces. When uneven surfaces are joined,pressure will not be uniform along the bondline. As a result,the adhesive will be squeezed out from the areas of very highpressure, and the areas of little to no pressure will have verythick bondlines. Both starved and thick bondlines produceweak joints.
Post-Cure ConditioningIn the process of bonding edge-grain joints, the wood in thejoint absorbs moisture from the adhesive, then swells. If thebonded assembly is surfaced before this excess moisture isevaporated or absorbed uniformly, more wood is removedalong the swollen joint than elsewhere. Later, when theadded moisture evaporates, the wood in the joint shrinksbeneath the surface. These sunken bondlines become veryconspicuous under a high-gloss finish. This is a particularlyimportant consideration when using adhesives that containrelatively large amounts of water. Redistribution of moistureadded by the adhesive can be accomplished by conditioningthe bonded assembly for 24 h at 70°C (158°F), 4 days at50°C (122°F), or at least 7 days at room temperature beforesurfacing. In each case, the relative humidity must be ad-justed to prevent drying the wood below the target moisturecontent.
After bonding, plywood-type constructions should be condi-tioned to the average moisture content expected in service.The best conditioning is accomplished by controlling hu-midity on time schedules. If bonded products cured at roomtemperature are exposed to excessively low moisture content,warping, checking, and opening of joints will increase sig-nificantly. Softwood plywood is very dry after hot pressing,so panels may be sprayed with water and tightly stacked toallow moisture to diffuse uniformly. This practice restoressome of the panel thickness lost by compression during hotpressing and apparently minimizes warping in service.
Bonded JointsEdge-Grain JointsFace-grain joints (wide surface of a board) are commonly seenin structural laminated lumber products, where adhesivebonds are stronger than the wood. Edge-grain joints (narrowsurface of a board) (Fig. 9–8) can be almost as strong as thewood in shear parallel to the grain, tension across the grain,and cleavage. The tongue-and-groove joint (Fig. 9–8) andother shaped edge-grain joints have a theoretical strengthadvantage because of greater surface area than the straight,edge-grain joints, but they do not produce higher strength.The theoretical advantage is lost, wholly or partly, becausethe shaped sides of the two mating surfaces cannot be ma-chined precisely enough to produce the perfect fit that willdistribute pressure uniformly over the entire joint area. Be-cause of poor contact, the effective bonding area and strengthcan actually be less in a shaped joint than on a flat surface.The advantage of the tongue-and-groove and other shapedjoints is that the parts can be more quickly aligned in clampsor presses. A shallow-cut tongue-and-groove is just as usefulin this respect as a deeper cut, and less wood is wasted.
End-Grain JointsIt is practically impossible to make end-grain butt joints(Fig. 9–9) sufficiently strong to meet the requirements ofordinary service with conventional bonding techniques. Evenwith special techniques, not more than about 25% of thetensile strength of the wood parallel-to-grain can be obtainedin a butt joint. To approximate the tensile strength of clearsolid wood, a scarf joint or fingerjoint must closely approachthe parallel-to-grain direction of the edge-grain joint(Fig. 9–8). The surface area of this edge-grain joint should beat least 10 times greater than the cross-sectional area of thepiece, because wood is approximately 10 times stronger intension than in shear. In plywood scarfs and fingerjoints, aslope of 1 in 8 is typical for structural products. For non-structural, low-strength joints, these requirements neednot be met.
Figure 9–8. Edge-grain joints: A, plain;B, tongue-and-groove.
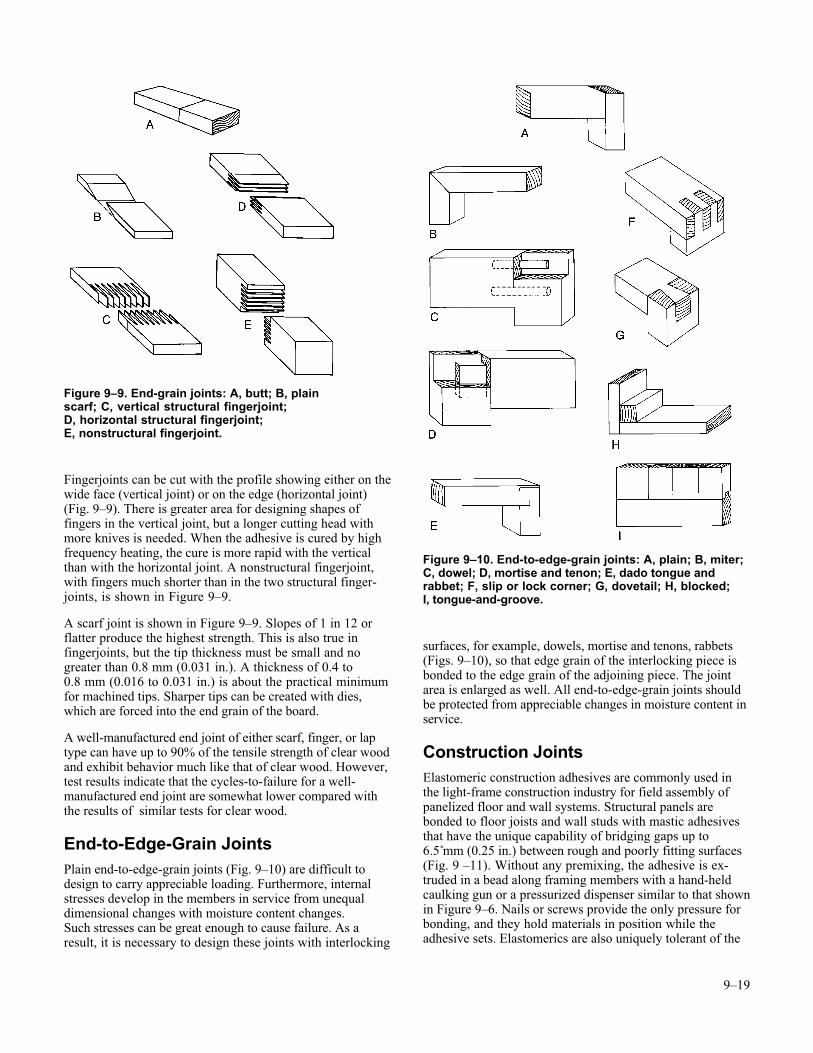
9–19
Fingerjoints can be cut with the profile showing either on thewide face (vertical joint) or on the edge (horizontal joint)(Fig. 9–9). There is greater area for designing shapes offingers in the vertical joint, but a longer cutting head withmore knives is needed. When the adhesive is cured by highfrequency heating, the cure is more rapid with the verticalthan with the horizontal joint. A nonstructural fingerjoint,with fingers much shorter than in the two structural finger-joints, is shown in Figure 9–9.
A scarf joint is shown in Figure 9–9. Slopes of 1 in 12 orflatter produce the highest strength. This is also true infingerjoints, but the tip thickness must be small and nogreater than 0.8 mm (0.031 in.). A thickness of 0.4 to0.8 mm (0.016 to 0.031 in.) is about the practical minimumfor machined tips. Sharper tips can be created with dies,which are forced into the end grain of the board.
A well-manufactured end joint of either scarf, finger, or laptype can have up to 90% of the tensile strength of clear woodand exhibit behavior much like that of clear wood. However,test results indicate that the cycles-to-failure for a well-manufactured end joint are somewhat lower compared withthe results of similar tests for clear wood.
End-to-Edge-Grain JointsPlain end-to-edge-grain joints (Fig. 9–10) are difficult todesign to carry appreciable loading. Furthermore, internalstresses develop in the members in service from unequaldimensional changes with moisture content changes.Such stresses can be great enough to cause failure. As aresult, it is necessary to design these joints with interlocking
surfaces, for example, dowels, mortise and tenons, rabbets(Figs. 9–10), so that edge grain of the interlocking piece isbonded to the edge grain of the adjoining piece. The jointarea is enlarged as well. All end-to-edge-grain joints shouldbe protected from appreciable changes in moisture content inservice.
Construction JointsElastomeric construction adhesives are commonly used inthe light-frame construction industry for field assembly ofpanelized floor and wall systems. Structural panels arebonded to floor joists and wall studs with mastic adhesivesthat have the unique capability of bridging gaps up to6.5 mm (0.25 in.) between rough and poorly fitting surfaces(Fig. 9 –11). Without any premixing, the adhesive is ex-truded in a bead along framing members with a hand-heldcaulking gun or a pressurized dispenser similar to that shownin Figure 9–6. Nails or screws provide the only pressure forbonding, and they hold materials in position while theadhesive sets. Elastomerics are also uniquely tolerant of the
Figure 9–9. End-grain joints: A, butt; B, plainscarf; C, vertical structural fingerjoint;D, horizontal structural fingerjoint;E, nonstructural fingerjoint.
Figure 9–10. End-to-edge-grain joints: A, plain; B, miter;C, dowel; D, mortise and tenon; E, dado tongue andrabbet; F, slip or lock corner; G, dovetail; H, blocked;I, tongue-and-groove.
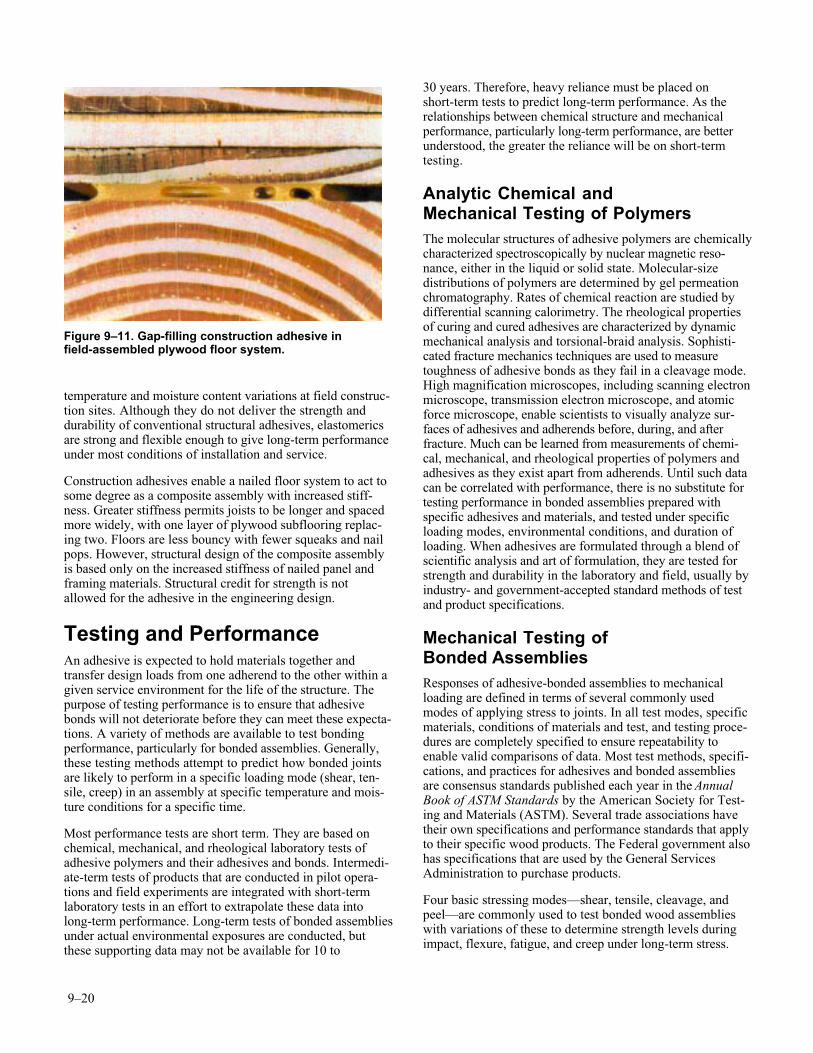
9–20
temperature and moisture content variations at field construc-tion sites. Although they do not deliver the strength anddurability of conventional structural adhesives, elastomericsare strong and flexible enough to give long-term performanceunder most conditions of installation and service.
Construction adhesives enable a nailed floor system to act tosome degree as a composite assembly with increased stiff-ness. Greater stiffness permits joists to be longer and spacedmore widely, with one layer of plywood subflooring replac-ing two. Floors are less bouncy with fewer squeaks and nailpops. However, structural design of the composite assemblyis based only on the increased stiffness of nailed panel andframing materials. Structural credit for strength is notallowed for the adhesive in the engineering design.
Testing and PerformanceAn adhesive is expected to hold materials together andtransfer design loads from one adherend to the other within agiven service environment for the life of the structure. Thepurpose of testing performance is to ensure that adhesivebonds will not deteriorate before they can meet these expecta-tions. A variety of methods are available to test bondingperformance, particularly for bonded assemblies. Generally,these testing methods attempt to predict how bonded jointsare likely to perform in a specific loading mode (shear, ten-sile, creep) in an assembly at specific temperature and mois-ture conditions for a specific time.
Most performance tests are short term. They are based onchemical, mechanical, and rheological laboratory tests ofadhesive polymers and their adhesives and bonds. Intermedi-ate-term tests of products that are conducted in pilot opera-tions and field experiments are integrated with short-termlaboratory tests in an effort to extrapolate these data intolong-term performance. Long-term tests of bonded assembliesunder actual environmental exposures are conducted, butthese supporting data may not be available for 10 to
30 years. Therefore, heavy reliance must be placed onshort-term tests to predict long-term performance. As therelationships between chemical structure and mechanicalperformance, particularly long-term performance, are betterunderstood, the greater the reliance will be on short-termtesting.
Analytic Chemical andMechanical Testing of PolymersThe molecular structures of adhesive polymers are chemicallycharacterized spectroscopically by nuclear magnetic reso-nance, either in the liquid or solid state. Molecular-sizedistributions of polymers are determined by gel permeationchromatography. Rates of chemical reaction are studied bydifferential scanning calorimetry. The rheological propertiesof curing and cured adhesives are characterized by dynamicmechanical analysis and torsional-braid analysis. Sophisti-cated fracture mechanics techniques are used to measuretoughness of adhesive bonds as they fail in a cleavage mode.High magnification microscopes, including scanning electronmicroscope, transmission electron microscope, and atomicforce microscope, enable scientists to visually analyze sur-faces of adhesives and adherends before, during, and afterfracture. Much can be learned from measurements of chemi-cal, mechanical, and rheological properties of polymers andadhesives as they exist apart from adherends. Until such datacan be correlated with performance, there is no substitute fortesting performance in bonded assemblies prepared withspecific adhesives and materials, and tested under specificloading modes, environmental conditions, and duration ofloading. When adhesives are formulated through a blend ofscientific analysis and art of formulation, they are tested forstrength and durability in the laboratory and field, usually byindustry- and government-accepted standard methods of testand product specifications.
Mechanical Testing ofBonded AssembliesResponses of adhesive-bonded assemblies to mechanicalloading are defined in terms of several commonly usedmodes of applying stress to joints. In all test modes, specificmaterials, conditions of materials and test, and testing proce-dures are completely specified to ensure repeatability toenable valid comparisons of data. Most test methods, specifi-cations, and practices for adhesives and bonded assembliesare consensus standards published each year in the AnnualBook of ASTM Standards by the American Society for Test-ing and Materials (ASTM). Several trade associations havetheir own specifications and performance standards that applyto their specific wood products. The Federal government alsohas specifications that are used by the General ServicesAdministration to purchase products.
Four basic stressing modes—shear, tensile, cleavage, andpeel—are commonly used to test bonded wood assemblieswith variations of these to determine strength levels duringimpact, flexure, fatigue, and creep under long-term stress.
Figure 9–11. Gap-filling construction adhesive infield-assembled plywood floor system.
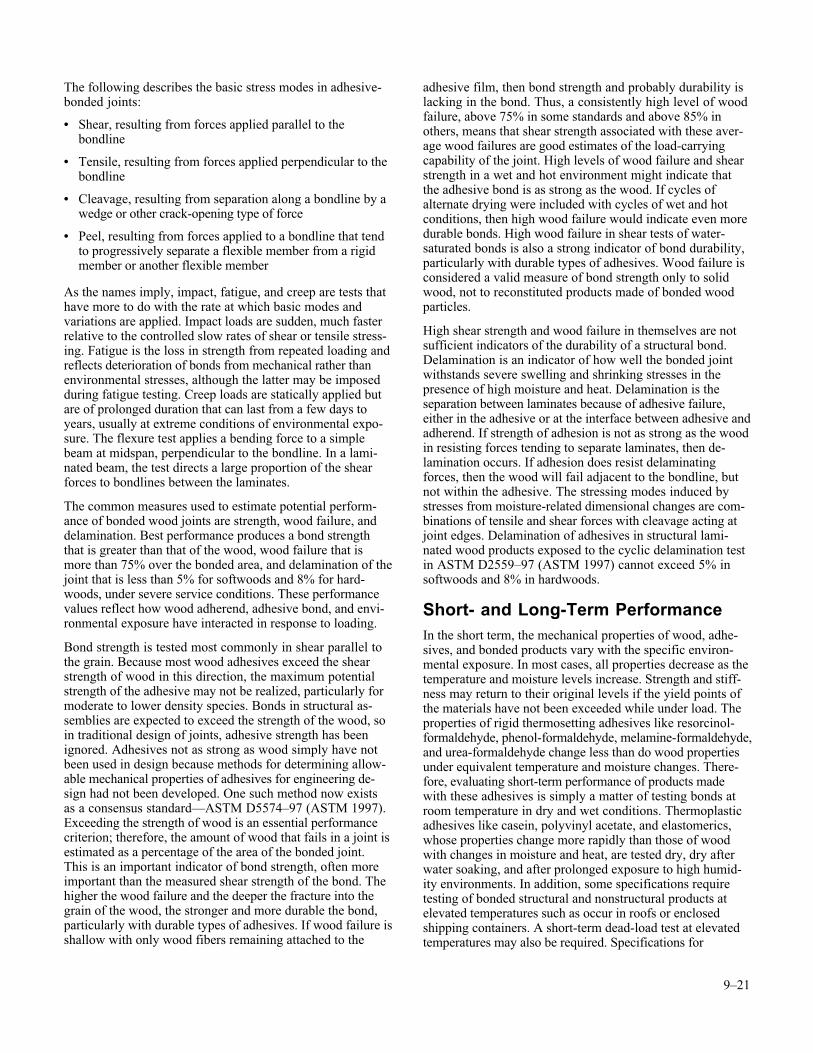
9–21
The following describes the basic stress modes in adhesive-bonded joints:
• Shear, resulting from forces applied parallel to thebondline
• Tensile, resulting from forces applied perpendicular to thebondline
• Cleavage, resulting from separation along a bondline by awedge or other crack-opening type of force
• Peel, resulting from forces applied to a bondline that tendto progressively separate a flexible member from a rigidmember or another flexible member
As the names imply, impact, fatigue, and creep are tests thathave more to do with the rate at which basic modes andvariations are applied. Impact loads are sudden, much fasterrelative to the controlled slow rates of shear or tensile stress-ing. Fatigue is the loss in strength from repeated loading andreflects deterioration of bonds from mechanical rather thanenvironmental stresses, although the latter may be imposedduring fatigue testing. Creep loads are statically applied butare of prolonged duration that can last from a few days toyears, usually at extreme conditions of environmental expo-sure. The flexure test applies a bending force to a simplebeam at midspan, perpendicular to the bondline. In a lami-nated beam, the test directs a large proportion of the shearforces to bondlines between the laminates.
The common measures used to estimate potential perform-ance of bonded wood joints are strength, wood failure, anddelamination. Best performance produces a bond strengththat is greater than that of the wood, wood failure that ismore than 75% over the bonded area, and delamination of thejoint that is less than 5% for softwoods and 8% for hard-woods, under severe service conditions. These performancevalues reflect how wood adherend, adhesive bond, and envi-ronmental exposure have interacted in response to loading.
Bond strength is tested most commonly in shear parallel tothe grain. Because most wood adhesives exceed the shearstrength of wood in this direction, the maximum potentialstrength of the adhesive may not be realized, particularly formoderate to lower density species. Bonds in structural as-semblies are expected to exceed the strength of the wood, soin traditional design of joints, adhesive strength has beenignored. Adhesives not as strong as wood simply have notbeen used in design because methods for determining allow-able mechanical properties of adhesives for engineering de-sign had not been developed. One such method now existsas a consensus standard—ASTM D5574–97 (ASTM 1997).Exceeding the strength of wood is an essential performancecriterion; therefore, the amount of wood that fails in a joint isestimated as a percentage of the area of the bonded joint.This is an important indicator of bond strength, often moreimportant than the measured shear strength of the bond. Thehigher the wood failure and the deeper the fracture into thegrain of the wood, the stronger and more durable the bond,particularly with durable types of adhesives. If wood failure isshallow with only wood fibers remaining attached to the
adhesive film, then bond strength and probably durability islacking in the bond. Thus, a consistently high level of woodfailure, above 75% in some standards and above 85% inothers, means that shear strength associated with these aver-age wood failures are good estimates of the load-carryingcapability of the joint. High levels of wood failure and shearstrength in a wet and hot environment might indicate thatthe adhesive bond is as strong as the wood. If cycles ofalternate drying were included with cycles of wet and hotconditions, then high wood failure would indicate even moredurable bonds. High wood failure in shear tests of water-saturated bonds is also a strong indicator of bond durability,particularly with durable types of adhesives. Wood failure isconsidered a valid measure of bond strength only to solidwood, not to reconstituted products made of bonded woodparticles.
High shear strength and wood failure in themselves are notsufficient indicators of the durability of a structural bond.Delamination is an indicator of how well the bonded jointwithstands severe swelling and shrinking stresses in thepresence of high moisture and heat. Delamination is theseparation between laminates because of adhesive failure,either in the adhesive or at the interface between adhesive andadherend. If strength of adhesion is not as strong as the woodin resisting forces tending to separate laminates, then de-lamination occurs. If adhesion does resist delaminatingforces, then the wood will fail adjacent to the bondline, butnot within the adhesive. The stressing modes induced bystresses from moisture-related dimensional changes are com-binations of tensile and shear forces with cleavage acting atjoint edges. Delamination of adhesives in structural lami-nated wood products exposed to the cyclic delamination testin ASTM D2559–97 (ASTM 1997) cannot exceed 5% insoftwoods and 8% in hardwoods.
Short- and Long-Term PerformanceIn the short term, the mechanical properties of wood, adhe-sives, and bonded products vary with the specific environ-mental exposure. In most cases, all properties decrease as thetemperature and moisture levels increase. Strength and stiff-ness may return to their original levels if the yield points ofthe materials have not been exceeded while under load. Theproperties of rigid thermosetting adhesives like resorcinol-formaldehyde, phenol-formaldehyde, melamine-formaldehyde,and urea-formaldehyde change less than do wood propertiesunder equivalent temperature and moisture changes. There-fore, evaluating short-term performance of products madewith these adhesives is simply a matter of testing bonds atroom temperature in dry and wet conditions. Thermoplasticadhesives like casein, polyvinyl acetate, and elastomerics,whose properties change more rapidly than those of woodwith changes in moisture and heat, are tested dry, dry afterwater soaking, and after prolonged exposure to high humid-ity environments. In addition, some specifications requiretesting of bonded structural and nonstructural products atelevated temperatures such as occur in roofs or enclosedshipping containers. A short-term dead-load test at elevatedtemperatures may also be required. Specifications for
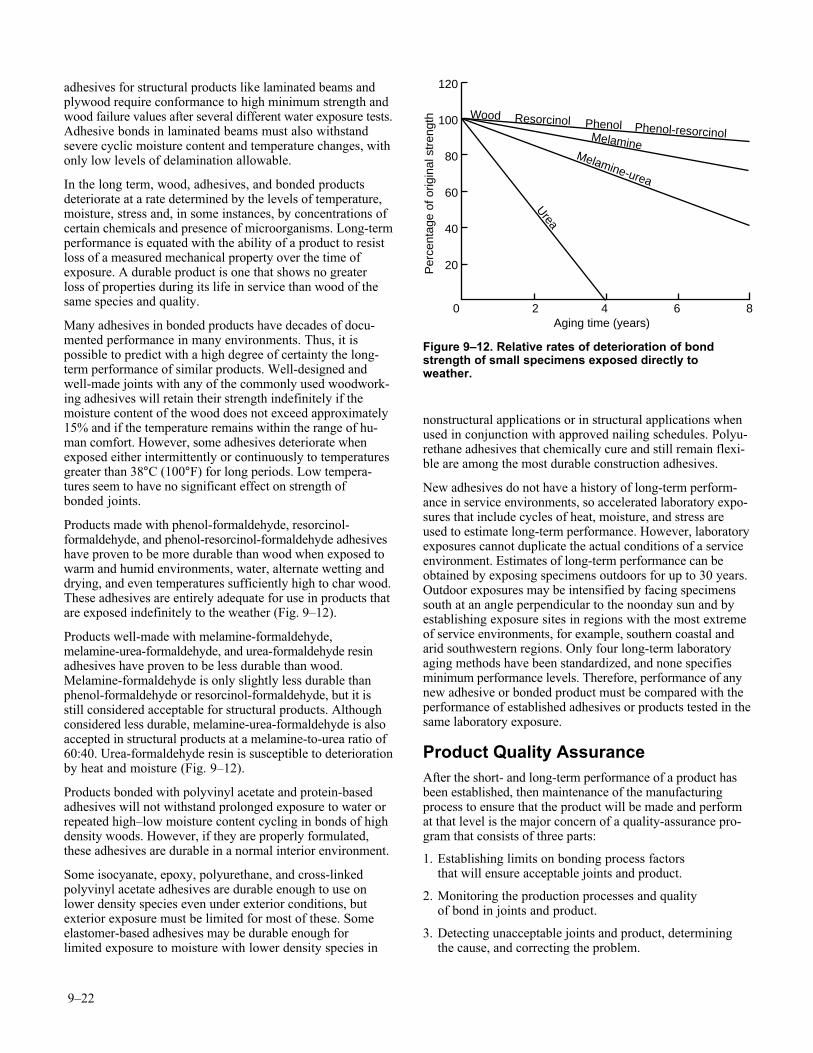
9–22
adhesives for structural products like laminated beams andplywood require conformance to high minimum strength andwood failure values after several different water exposure tests.Adhesive bonds in laminated beams must also withstandsevere cyclic moisture content and temperature changes, withonly low levels of delamination allowable.
In the long term, wood, adhesives, and bonded productsdeteriorate at a rate determined by the levels of temperature,moisture, stress and, in some instances, by concentrations ofcertain chemicals and presence of microorganisms. Long-termperformance is equated with the ability of a product to resistloss of a measured mechanical property over the time ofexposure. A durable product is one that shows no greaterloss of properties during its life in service than wood of thesame species and quality.
Many adhesives in bonded products have decades of docu-mented performance in many environments. Thus, it ispossible to predict with a high degree of certainty the long-term performance of similar products. Well-designed andwell-made joints with any of the commonly used woodwork-ing adhesives will retain their strength indefinitely if themoisture content of the wood does not exceed approximately15% and if the temperature remains within the range of hu-man comfort. However, some adhesives deteriorate whenexposed either intermittently or continuously to temperaturesgreater than 38°C (100°F) for long periods. Low tempera-tures seem to have no significant effect on strength ofbonded joints.
Products made with phenol-formaldehyde, resorcinol-formaldehyde, and phenol-resorcinol-formaldehyde adhesiveshave proven to be more durable than wood when exposed towarm and humid environments, water, alternate wetting anddrying, and even temperatures sufficiently high to char wood.These adhesives are entirely adequate for use in products thatare exposed indefinitely to the weather (Fig. 9–12).
Products well-made with melamine-formaldehyde,melamine-urea-formaldehyde, and urea-formaldehyde resinadhesives have proven to be less durable than wood.Melamine-formaldehyde is only slightly less durable thanphenol-formaldehyde or resorcinol-formaldehyde, but it isstill considered acceptable for structural products. Althoughconsidered less durable, melamine-urea-formaldehyde is alsoaccepted in structural products at a melamine-to-urea ratio of60:40. Urea-formaldehyde resin is susceptible to deteriorationby heat and moisture (Fig. 9–12).
Products bonded with polyvinyl acetate and protein-basedadhesives will not withstand prolonged exposure to water orrepeated high–low moisture content cycling in bonds of highdensity woods. However, if they are properly formulated,these adhesives are durable in a normal interior environment.
Some isocyanate, epoxy, polyurethane, and cross-linkedpolyvinyl acetate adhesives are durable enough to use onlower density species even under exterior conditions, butexterior exposure must be limited for most of these. Someelastomer-based adhesives may be durable enough forlimited exposure to moisture with lower density species in
nonstructural applications or in structural applications whenused in conjunction with approved nailing schedules. Polyu-rethane adhesives that chemically cure and still remain flexi-ble are among the most durable construction adhesives.
New adhesives do not have a history of long-term perform-ance in service environments, so accelerated laboratory expo-sures that include cycles of heat, moisture, and stress areused to estimate long-term performance. However, laboratoryexposures cannot duplicate the actual conditions of a serviceenvironment. Estimates of long-term performance can beobtained by exposing specimens outdoors for up to 30 years.Outdoor exposures may be intensified by facing specimenssouth at an angle perpendicular to the noonday sun and byestablishing exposure sites in regions with the most extremeof service environments, for example, southern coastal andarid southwestern regions. Only four long-term laboratoryaging methods have been standardized, and none specifiesminimum performance levels. Therefore, performance of anynew adhesive or bonded product must be compared with theperformance of established adhesives or products tested in thesame laboratory exposure.
Product Quality AssuranceAfter the short- and long-term performance of a product hasbeen established, then maintenance of the manufacturingprocess to ensure that the product will be made and performat that level is the major concern of a quality-assurance pro-gram that consists of three parts:
1. Establishing limits on bonding process factorsthat will ensure acceptable joints and product.
2. Monitoring the production processes and qualityof bond in joints and product.
3. Detecting unacceptable joints and product, determiningthe cause, and correcting the problem.
Urea
Melamine-urea
Melamine
Phenol Phenol-resorcinolResorcinolWood
Per
cent
age
of o
rigin
al s
tren
gth
120
100
80
60
40
20
0 2 4 6 8Aging time (years)
Figure 9–12. Relative rates of deterioration of bondstrength of small specimens exposed directly toweather.
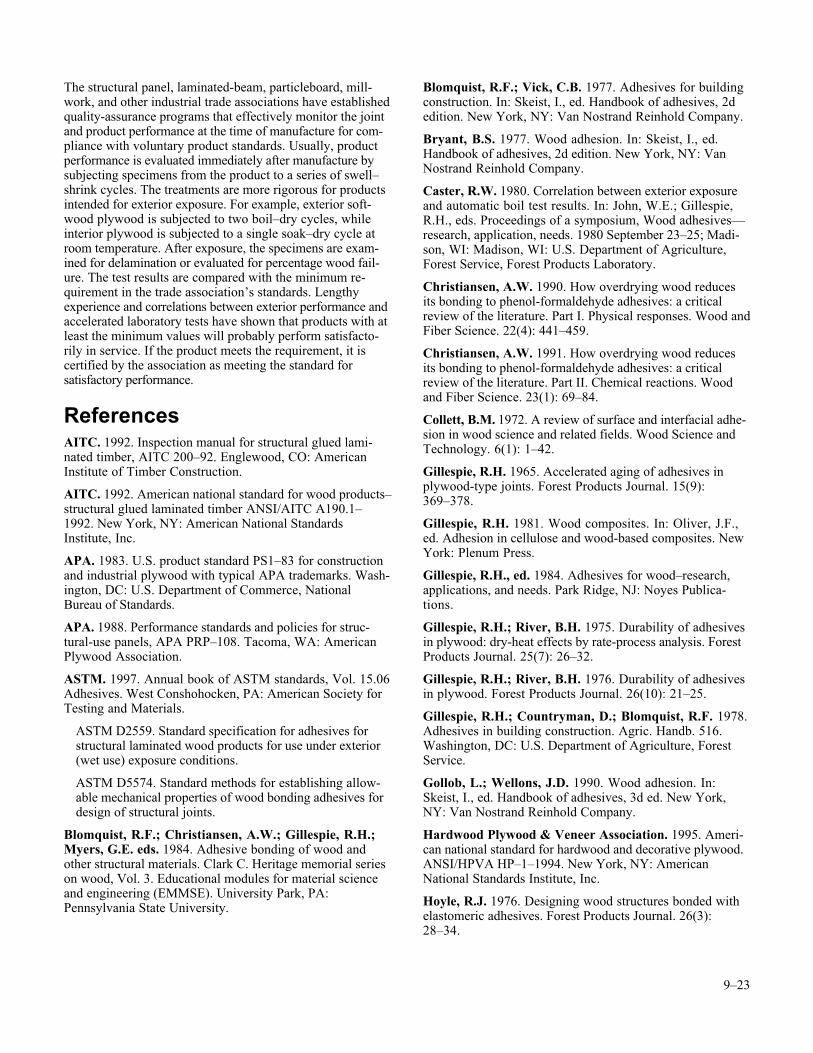
9–23
The structural panel, laminated-beam, particleboard, mill-work, and other industrial trade associations have establishedquality-assurance programs that effectively monitor the jointand product performance at the time of manufacture for com-pliance with voluntary product standards. Usually, productperformance is evaluated immediately after manufacture bysubjecting specimens from the product to a series of swell–shrink cycles. The treatments are more rigorous for productsintended for exterior exposure. For example, exterior soft-wood plywood is subjected to two boil–dry cycles, whileinterior plywood is subjected to a single soak–dry cycle atroom temperature. After exposure, the specimens are exam-ined for delamination or evaluated for percentage wood fail-ure. The test results are compared with the minimum re-quirement in the trade association’s standards. Lengthyexperience and correlations between exterior performance andaccelerated laboratory tests have shown that products with atleast the minimum values will probably perform satisfacto-rily in service. If the product meets the requirement, it iscertified by the association as meeting the standard forsatisfactory performance.
ReferencesAITC. 1992. Inspection manual for structural glued lami-nated timber, AITC 200–92. Englewood, CO: AmericanInstitute of Timber Construction.
AITC. 1992. American national standard for wood products–structural glued laminated timber ANSI/AITC A190.1–1992. New York, NY: American National StandardsInstitute, Inc.
APA. 1983. U.S. product standard PS1–83 for constructionand industrial plywood with typical APA trademarks. Wash-ington, DC: U.S. Department of Commerce, NationalBureau of Standards.
APA. 1988. Performance standards and policies for struc-tural-use panels, APA PRP–108. Tacoma, WA: AmericanPlywood Association.
ASTM. 1997. Annual book of ASTM standards, Vol. 15.06Adhesives. West Conshohocken, PA: American Society forTesting and Materials.
ASTM D2559. Standard specification for adhesives forstructural laminated wood products for use under exterior(wet use) exposure conditions.
ASTM D5574. Standard methods for establishing allow-able mechanical properties of wood bonding adhesives fordesign of structural joints.
Blomquist, R.F.; Christiansen, A.W.; Gillespie, R.H.;Myers, G.E. eds. 1984. Adhesive bonding of wood andother structural materials. Clark C. Heritage memorial serieson wood, Vol. 3. Educational modules for material scienceand engineering (EMMSE). University Park, PA:Pennsylvania State University.
Blomquist, R.F.; Vick, C.B. 1977. Adhesives for buildingconstruction. In: Skeist, I., ed. Handbook of adhesives, 2dedition. New York, NY: Van Nostrand Reinhold Company.
Bryant, B.S. 1977. Wood adhesion. In: Skeist, I., ed.Handbook of adhesives, 2d edition. New York, NY: VanNostrand Reinhold Company.
Caster, R.W. 1980. Correlation between exterior exposureand automatic boil test results. In: John, W.E.; Gillespie,R.H., eds. Proceedings of a symposium, Wood adhesives—research, application, needs. 1980 September 23–25; Madi-son, WI: Madison, WI: U.S. Department of Agriculture,Forest Service, Forest Products Laboratory.
Christiansen, A.W. 1990. How overdrying wood reducesits bonding to phenol-formaldehyde adhesives: a criticalreview of the literature. Part I. Physical responses. Wood andFiber Science. 22(4): 441–459.
Christiansen, A.W. 1991. How overdrying wood reducesits bonding to phenol-formaldehyde adhesives: a criticalreview of the literature. Part II. Chemical reactions. Woodand Fiber Science. 23(1): 69–84.
Collett, B.M. 1972. A review of surface and interfacial adhe-sion in wood science and related fields. Wood Science andTechnology. 6(1): 1–42.
Gillespie, R.H. 1965. Accelerated aging of adhesives inplywood-type joints. Forest Products Journal. 15(9):369–378.
Gillespie, R.H. 1981. Wood composites. In: Oliver, J.F.,ed. Adhesion in cellulose and wood-based composites. NewYork: Plenum Press.
Gillespie, R.H., ed. 1984. Adhesives for wood–research,applications, and needs. Park Ridge, NJ: Noyes Publica-tions.
Gillespie, R.H.; River, B.H. 1975. Durability of adhesivesin plywood: dry-heat effects by rate-process analysis. ForestProducts Journal. 25(7): 26–32.
Gillespie, R.H.; River, B.H. 1976. Durability of adhesivesin plywood. Forest Products Journal. 26(10): 21–25.
Gillespie, R.H.; Countryman, D.; Blomquist, R.F. 1978.Adhesives in building construction. Agric. Handb. 516.Washington, DC: U.S. Department of Agriculture, ForestService.
Gollob, L.; Wellons, J.D. 1990. Wood adhesion. In:Skeist, I., ed. Handbook of adhesives, 3d ed. New York,NY: Van Nostrand Reinhold Company.
Hardwood Plywood & Veneer Association. 1995. Ameri-can national standard for hardwood and decorative plywood.ANSI/HPVA HP–1–1994. New York, NY: AmericanNational Standards Institute, Inc.
Hoyle, R.J. 1976. Designing wood structures bonded withelastomeric adhesives. Forest Products Journal. 26(3):28–34.
9–24
Jarvi, R.A. 1967. Exterior glues for plywood. ForestProducts Journal. 17(1): 37–42.
Jokerst, R.W. 1981. Finger-jointed wood products. Res.Pap. FPL–RP–382. Madison, WI: U.S. Department ofAgriculture, Forest Service, Forest Products Laboratory.
Lambuth, A.L. 1977. Bonding tropical hardwoods withphenolic adhesives. In: Proceedings, IUFRO meeting onprocessing of tropical hardwoods. 1977 October; Merida,Venezuela: Laboratorio Nacional de Productos Forestales.
Landrock, A.H. 1985. Adhesives technology handbook.Park Ridge, NJ: Noyes Publications.
Marra, A.A. 1992. Technology of wood bonding-principalsin practice. New York, NY: Van Nostrand Reinhold.
McGee, W.D.; Hoyle, R.J. 1974. Design method for elas-tomeric adhesive bonded wood joist-deck systems. Woodand Fiber Science. 6(2): 144–155.
Miller, R.S. 1990. Adhesives for building construction. In:Skeist, I., ed. Handbook of adhesives, 3d ed. New York,NY: Van Nostrand Reinhold Company.
Murmanis, L.; River, B.H.; Stewart, H.A. 1986. Surfaceand subsurface characteristics related to abrasive-planingconditions. Wood and Fiber Science. 18(1): 107–117.
National Particleboard Association. 1993. Particleboard.ANSI A208.1–1993 New York, NY: American NationalStandards Institute.
Pizzi, A., ed. 1983. Wood adhesives chemistry and technol-ogy. New York, NY: Marcel Dekker, Inc.
Pizzi, A., ed. 1989. Wood adhesives chemistry and technol-ogy, Vol. 2. New York, NY: Marcel Dekker, Inc.
Pizzi, A. 1994. Advanced wood adhesives technology. NewYork, NY: Marcel Dekker, Inc.
Pizzi, A.; Mittal, K.L. 1994. Handbook of adhesive tech-nology. New York, NY: Marcel Dekker, Inc.
River, B.H. 1973. Mastic construction adhesives in fireexposure. Res. Pap. FPL–RP–198. Madison, WI: U.S.Department of Agriculture, Forest Service, Forest ProductsLaboratory.
River, B.H. 1981. Behavior of construction adhesives underlong-term load. Res. Pap. FPL–RP–400. Madison, WI:U.S. Department of Agriculture, Forest Service, ForestProducts Laboratory.
River, B.H. 1984. Accelerated, real-time aging for 4construction adhesives. Adhesives Age. (2) 16–21.
River, B.H. 1994. Fracture of adhesive-bonded wood joints.In: Pizzi, A; Mittal, K.L., eds. Handbook of adhesive tech-nology. New York, NY: Marcel Dekker, Inc.
River, B.H.; Okkonen, E.A. 1991. Delamination of edge-glued wood panels–moisture effects. Res. Note FPL–RN–0259. Madison, WI: U.S. Department of Agriculture, ForestService, Forest Products Laboratory.
River, B.H.; Gillespie, R.H.; Vick, C.B. 1991. Wood asan adherend. In: Minford, J.D., ed. Treatise on adhesion andadhesives. New York, NY: Marcel Dekker, Inc. Vol. 7.
Selbo, M.L. 1975. Adhesive bonding of wood. Tech. Bull.1512. Washington, DC: U.S. Department of Agriculture,Forest Service.
Sellers, T., Jr. 1985. Plywood and adhesive technology.New York, NY: Marcel Dekker, Inc.
Skeist, I., ed. 1977. Handbook of adhesives. 2d ed. NewYork, NY: Van Nostrand Reinhold.
Skeist, I., ed. 1990. Handbook of adhesives. 3d ed..New York: Van Nostrand Reinhold.
Snogren, R.C. 1974. Handbook of surface preparation. NewYork, NY: Palmerton Publishing.
Vick, C.B. 1971. Elastomeric adhesives for field-gluingplywood floors. Forest Products Journal. 21(8): 34–42.
Vick, C.B.; Rowell, R.M. 1990. Adhesive bonding ofacetylated wood. Gildford, Surry, England: InternationalJournal of Adhesion and Adhesives. 10(4): 263–272.
Vick, C.B.; DeGroot, R.C.; Youngquist, J. 1990. Com-patibility of nonacidic waterborne preservatives with phenol-formaldehyde adhesive. Forest Products Journal.40(2): 16–22.
Vick, C.B. 1994. Phenolic adhesive bonds to aspen veneerstreated with amino-resin fire retardants. Forest ProductsJournal. 44(1): 33–40.
Vick, C.B. 1995. Coupling agent improves durability ofPRF bonds to CCA-treated Southern Pine. Forest ProductsJournal. 45(3): 78–84.
Vick, C.B. 1996. Hydroxymethylated resorcinol couplingagent for enhanced adhesion of epoxy and other thermosettingadhesives to wood. In: Christiansen, A.W.; Conner, A.H.,eds. Wood adhesives 1995. Proceedings of a symposium;1995, June 29–30; Portland, OR. Proc. 7296. Madison, WI:Forest Products Society.

FromForest Products Laboratory. 1999. Wood handbook—Wood as an engineering material.Gen. Tech. Rep. FPL–GTR–113. Madison, WI: U.S. Department of Agriculture, Forest Service,Forest Products Laboratory. 463 p.
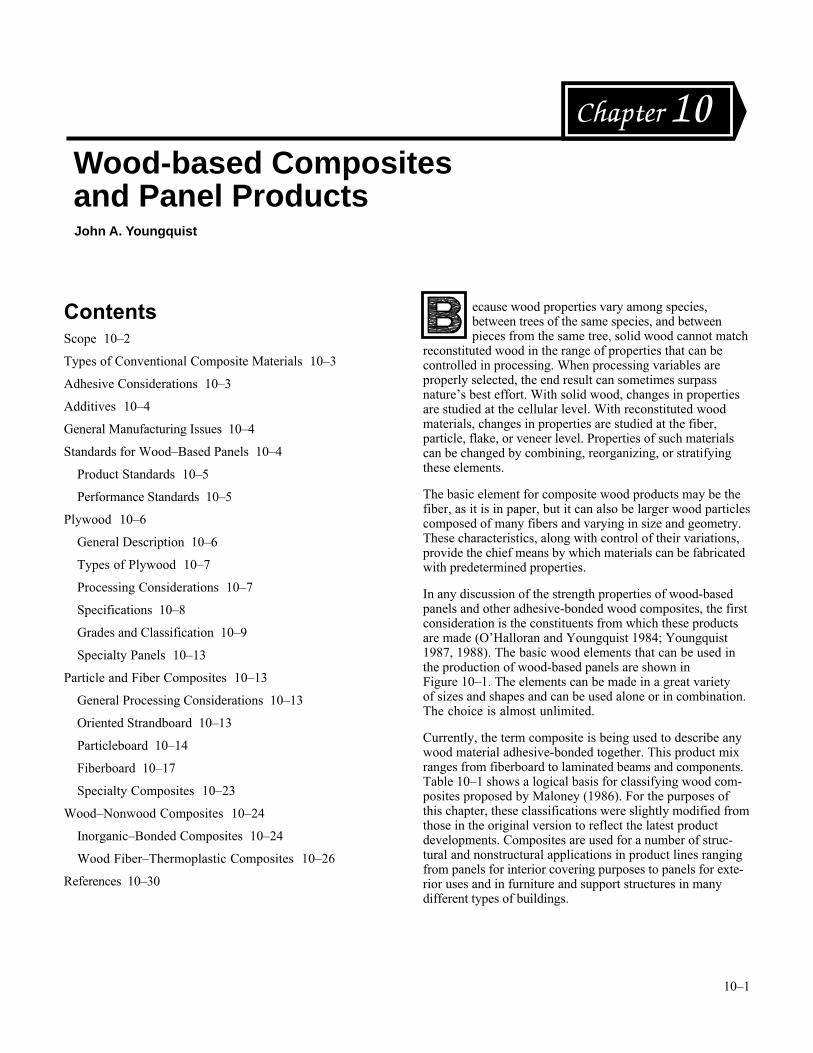
10–1
Wood-based Compositesand Panel ProductsJohn A . Youngquist
Chapter 10
ContentsScope 10–2
Types of Conventional Composite Materials 10–3
Adhesive Considerations 10–3
Additives 10–4
General Manufacturing Issues 10–4
Standards for Wood–Based Panels 10–4
Product Standards 10–5
Performance Standards 10–5
Plywood 10–6
General Description 10–6
Types of Plywood 10–7
Processing Considerations 10–7
Specifications 10–8
Grades and Classification 10–9
Specialty Panels 10–13
Particle and Fiber Composites 10–13
General Processing Considerations 10–13
Oriented Strandboard 10–13
Particleboard 10–14
Fiberboard 10–17
Specialty Composites 10–23
Wood–Nonwood Composites 10–24
Inorganic–Bonded Composites 10–24
Wood Fiber–Thermoplastic Composites 10–26
References 10–30
ecause wood properties vary among species,between trees of the same species, and betweenpieces from the same tree, solid wood cannot match
reconstituted wood in the range of properties that can becontrolled in processing. When processing variables areproperly selected, the end result can sometimes surpassnature’s best effort. With solid wood, changes in propertiesare studied at the cellular level. With reconstituted woodmaterials, changes in properties are studied at the fiber,particle, flake, or veneer level. Properties of such materialscan be changed by combining, reorganizing, or stratifyingthese elements.
The basic element for composite wood products may be thefiber, as it is in paper, but it can also be larger wood particlescomposed of many fibers and varying in size and geometry.These characteristics, along with control of their variations,provide the chief means by which materials can be fabricatedwith predetermined properties.
In any discussion of the strength properties of wood-basedpanels and other adhesive-bonded wood composites, the firstconsideration is the constituents from which these productsare made (O’Halloran and Youngquist 1984; Youngquist1987, 1988). The basic wood elements that can be used inthe production of wood-based panels are shown inFigure 10–1. The elements can be made in a great varietyof sizes and shapes and can be used alone or in combination.The choice is almost unlimited.
Currently, the term composite is being used to describe anywood material adhesive-bonded together. This product mixranges from fiberboard to laminated beams and components.Table 10–1 shows a logical basis for classifying wood com-posites proposed by Maloney (1986). For the purposes ofthis chapter, these classifications were slightly modified fromthose in the original version to reflect the latest productdevelopments. Composites are used for a number of struc-tural and nonstructural applications in product lines rangingfrom panels for interior covering purposes to panels for exte-rior uses and in furniture and support structures in manydifferent types of buildings.
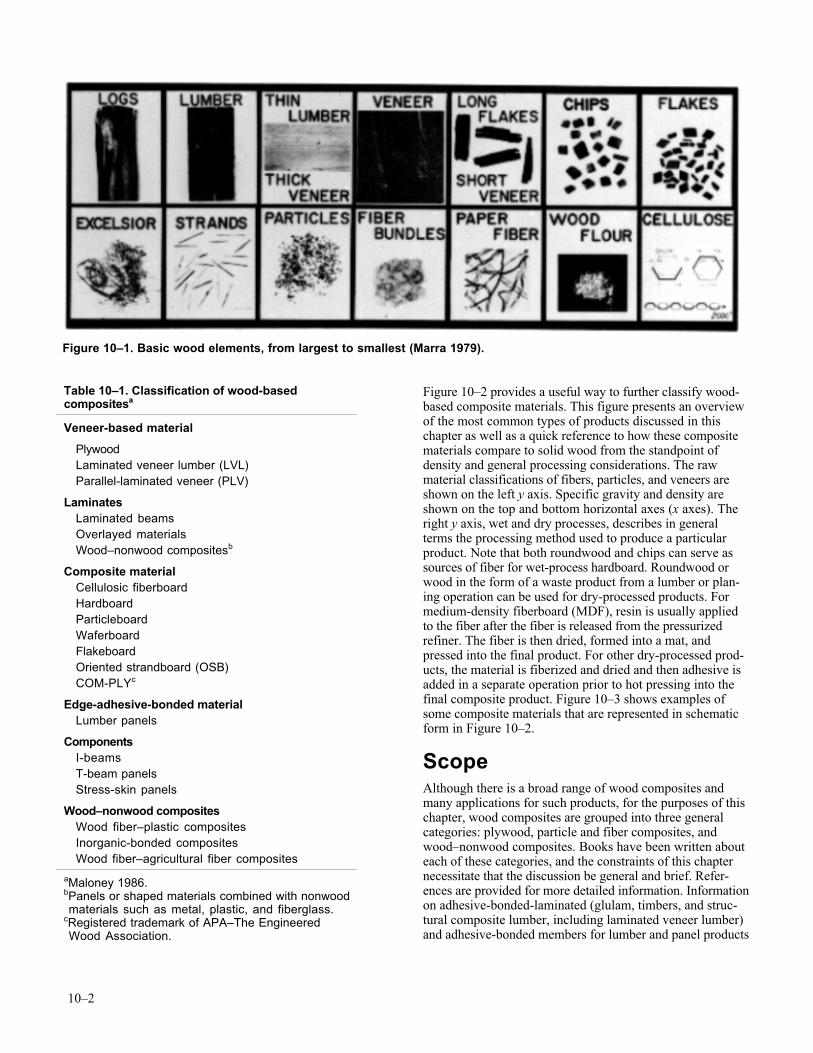
10–2
Figure 10–2 provides a useful way to further classify wood-based composite materials. This figure presents an overviewof the most common types of products discussed in thischapter as well as a quick reference to how these compositematerials compare to solid wood from the standpoint ofdensity and general processing considerations. The rawmaterial classifications of fibers, particles, and veneers areshown on the left y axis. Specific gravity and density areshown on the top and bottom horizontal axes (x axes). Theright y axis, wet and dry processes, describes in generalterms the processing method used to produce a particularproduct. Note that both roundwood and chips can serve assources of fiber for wet-process hardboard. Roundwood orwood in the form of a waste product from a lumber or plan-ing operation can be used for dry-processed products. Formedium-density fiberboard (MDF), resin is usually appliedto the fiber after the fiber is released from the pressurizedrefiner. The fiber is then dried, formed into a mat, andpressed into the final product. For other dry-processed prod-ucts, the material is fiberized and dried and then adhesive isadded in a separate operation prior to hot pressing into thefinal composite product. Figure 10–3 shows examples ofsome composite materials that are represented in schematicform in Figure 10–2.
ScopeAlthough there is a broad range of wood composites andmany applications for such products, for the purposes of thischapter, wood composites are grouped into three generalcategories: plywood, particle and fiber composites, andwood–nonwood composites. Books have been written abouteach of these categories, and the constraints of this chapternecessitate that the discussion be general and brief. Refer-ences are provided for more detailed information. Informationon adhesive-bonded-laminated (glulam, timbers, and struc-tural composite lumber, including laminated veneer lumber)and adhesive-bonded members for lumber and panel products
Figure 10–1. Basic wood elements, from largest to smallest (Marra 1979).
Table 10–1. Classification of wood-basedcompositesa
Veneer-based material
PlywoodLaminated veneer lumber (LVL)Parallel-laminated veneer (PLV)
LaminatesLaminated beamsOverlayed materialsWood–nonwood compositesb
Composite materialCellulosic fiberboardHardboardParticleboardWaferboardFlakeboardOriented strandboard (OSB)COM-PLYc
Edge-adhesive-bonded materialLumber panels
ComponentsI-beamsT-beam panelsStress-skin panels
Wood–nonwood compositesWood fiber–plastic compositesInorganic-bonded compositesWood fiber–agricultural fiber composites
aMaloney 1986.bPanels or shaped materials combined with nonwood materials such as metal, plastic, and fiberglass.cRegistered trademark of APA–The Engineered Wood Association.
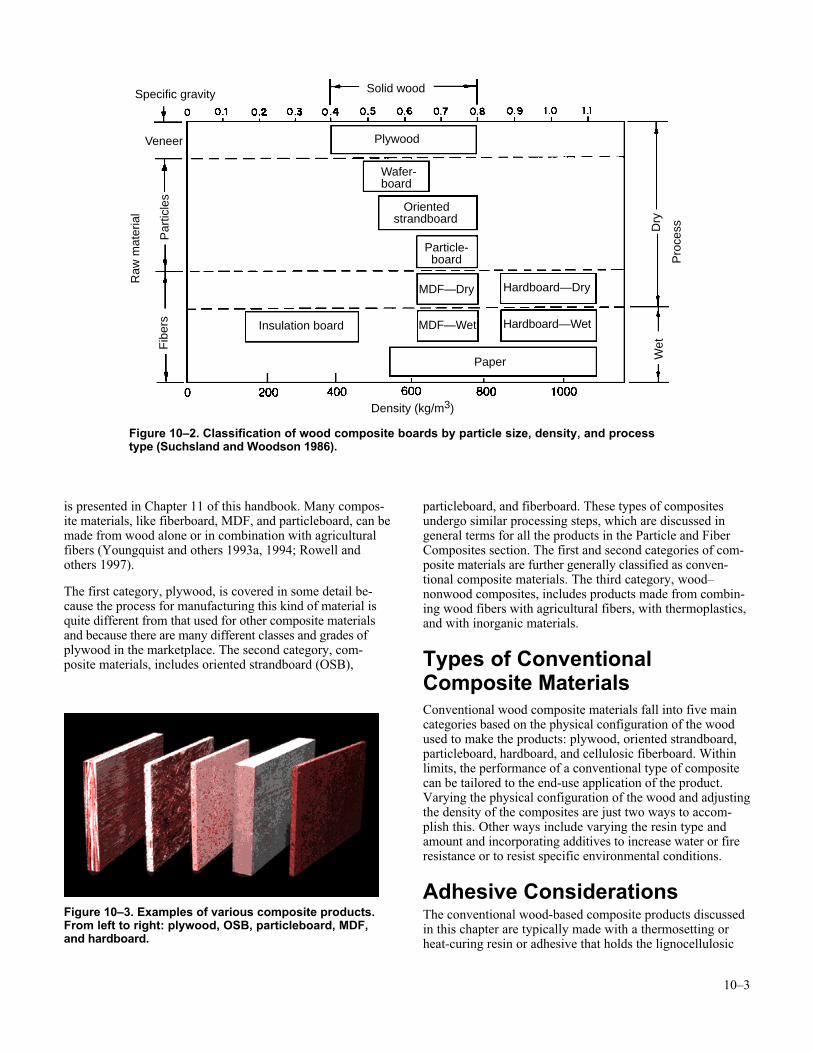
10–3
is presented in Chapter 11 of this handbook. Many compos-ite materials, like fiberboard, MDF, and particleboard, can bemade from wood alone or in combination with agriculturalfibers (Youngquist and others 1993a, 1994; Rowell andothers 1997).
The first category, plywood, is covered in some detail be-cause the process for manufacturing this kind of material isquite different from that used for other composite materialsand because there are many different classes and grades ofplywood in the marketplace. The second category, com-posite materials, includes oriented strandboard (OSB),
particleboard, and fiberboard. These types of compositesundergo similar processing steps, which are discussed ingeneral terms for all the products in the Particle and FiberComposites section. The first and second categories of com-posite materials are further generally classified as conven-tional composite materials. The third category, wood–nonwood composites, includes products made from combin-ing wood fibers with agricultural fibers, with thermoplastics,and with inorganic materials.
Types of ConventionalComposite MaterialsConventional wood composite materials fall into five maincategories based on the physical configuration of the woodused to make the products: plywood, oriented strandboard,particleboard, hardboard, and cellulosic fiberboard. Withinlimits, the performance of a conventional type of compositecan be tailored to the end-use application of the product.Varying the physical configuration of the wood and adjustingthe density of the composites are just two ways to accom-plish this. Other ways include varying the resin type andamount and incorporating additives to increase water or fireresistance or to resist specific environmental conditions.
Adhesive ConsiderationsThe conventional wood-based composite products discussedin this chapter are typically made with a thermosetting orheat-curing resin or adhesive that holds the lignocellulosic
Hardboard—Dry
Hardboard—Wet
Paper
Insulation board
Plywood
Orientedstrandboard
Wafer-board
MDF—Dry
MDF—Wet
Particle-board
Solid woodSpecific gravity
Raw
mat
eria
l
Wet
Dry
Pro
cess
Par
ticle
s
Veneer
Fib
ers
Density (kg/m3)
Figure 10–2. Classification of wood composite boards by particle size, density, and processtype (Suchsland and Woodson 1986).
Figure 10–3. Examples of various composite products.From left to right: plywood, OSB, particleboard, MDF,and hardboard.
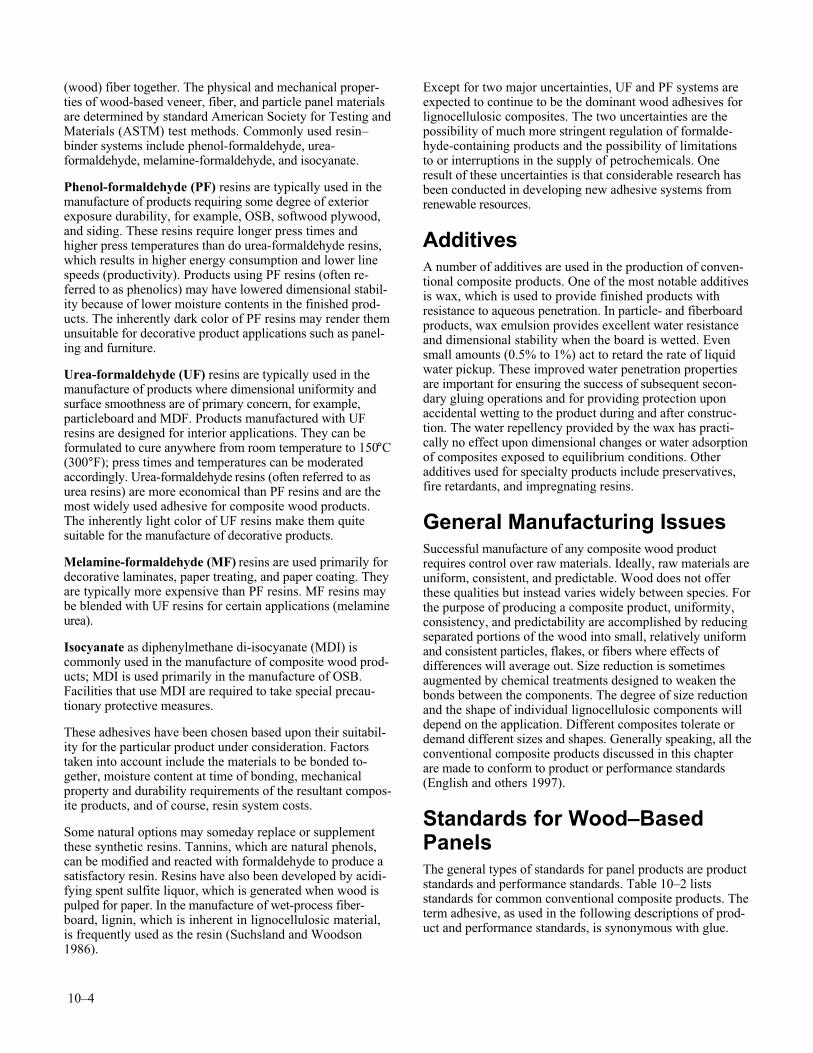
10–4
(wood) fiber together. The physical and mechanical proper-ties of wood-based veneer, fiber, and particle panel materialsare determined by standard American Society for Testing andMaterials (ASTM) test methods. Commonly used resin–binder systems include phenol-formaldehyde, urea-formaldehyde, melamine-formaldehyde, and isocyanate.
Phenol-formaldehyde (PF) resins are typically used in themanufacture of products requiring some degree of exteriorexposure durability, for example, OSB, softwood plywood,and siding. These resins require longer press times andhigher press temperatures than do urea-formaldehyde resins,which results in higher energy consumption and lower linespeeds (productivity). Products using PF resins (often re-ferred to as phenolics) may have lowered dimensional stabil-ity because of lower moisture contents in the finished prod-ucts. The inherently dark color of PF resins may render themunsuitable for decorative product applications such as panel-ing and furniture.
Urea-formaldehyde (UF) resins are typically used in themanufacture of products where dimensional uniformity andsurface smoothness are of primary concern, for example,particleboard and MDF. Products manufactured with UFresins are designed for interior applications. They can beformulated to cure anywhere from room temperature to 150°C(300°F); press times and temperatures can be moderatedaccordingly. Urea-formaldehyde resins (often referred to asurea resins) are more economical than PF resins and are themost widely used adhesive for composite wood products.The inherently light color of UF resins make them quitesuitable for the manufacture of decorative products.
Melamine-formaldehyde (MF) resins are used primarily fordecorative laminates, paper treating, and paper coating. Theyare typically more expensive than PF resins. MF resins maybe blended with UF resins for certain applications (melamineurea).
Isocyanate as diphenylmethane di-isocyanate (MDI) iscommonly used in the manufacture of composite wood prod-ucts; MDI is used primarily in the manufacture of OSB.Facilities that use MDI are required to take special precau-tionary protective measures.
These adhesives have been chosen based upon their suitabil-ity for the particular product under consideration. Factorstaken into account include the materials to be bonded to-gether, moisture content at time of bonding, mechanicalproperty and durability requirements of the resultant compos-ite products, and of course, resin system costs.
Some natural options may someday replace or supplementthese synthetic resins. Tannins, which are natural phenols,can be modified and reacted with formaldehyde to produce asatisfactory resin. Resins have also been developed by acidi-fying spent sulfite liquor, which is generated when wood ispulped for paper. In the manufacture of wet-process fiber-board, lignin, which is inherent in lignocellulosic material,is frequently used as the resin (Suchsland and Woodson1986).
Except for two major uncertainties, UF and PF systems areexpected to continue to be the dominant wood adhesives forlignocellulosic composites. The two uncertainties are thepossibility of much more stringent regulation of formalde-hyde-containing products and the possibility of limitationsto or interruptions in the supply of petrochemicals. Oneresult of these uncertainties is that considerable research hasbeen conducted in developing new adhesive systems fromrenewable resources.
AdditivesA number of additives are used in the production of conven-tional composite products. One of the most notable additivesis wax, which is used to provide finished products withresistance to aqueous penetration. In particle- and fiberboardproducts, wax emulsion provides excellent water resistanceand dimensional stability when the board is wetted. Evensmall amounts (0.5% to 1%) act to retard the rate of liquidwater pickup. These improved water penetration propertiesare important for ensuring the success of subsequent secon-dary gluing operations and for providing protection uponaccidental wetting to the product during and after construc-tion. The water repellency provided by the wax has practi-cally no effect upon dimensional changes or water adsorptionof composites exposed to equilibrium conditions. Otheradditives used for specialty products include preservatives,fire retardants, and impregnating resins.
General Manufacturing IssuesSuccessful manufacture of any composite wood productrequires control over raw materials. Ideally, raw materials areuniform, consistent, and predictable. Wood does not offerthese qualities but instead varies widely between species. Forthe purpose of producing a composite product, uniformity,consistency, and predictability are accomplished by reducingseparated portions of the wood into small, relatively uniformand consistent particles, flakes, or fibers where effects ofdifferences will average out. Size reduction is sometimesaugmented by chemical treatments designed to weaken thebonds between the components. The degree of size reductionand the shape of individual lignocellulosic components willdepend on the application. Different composites tolerate ordemand different sizes and shapes. Generally speaking, all theconventional composite products discussed in this chapterare made to conform to product or performance standards(English and others 1997).
Standards for Wood–BasedPanelsThe general types of standards for panel products are productstandards and performance standards. Table 10–2 listsstandards for common conventional composite products. Theterm adhesive, as used in the following descriptions of prod-uct and performance standards, is synonymous with glue.
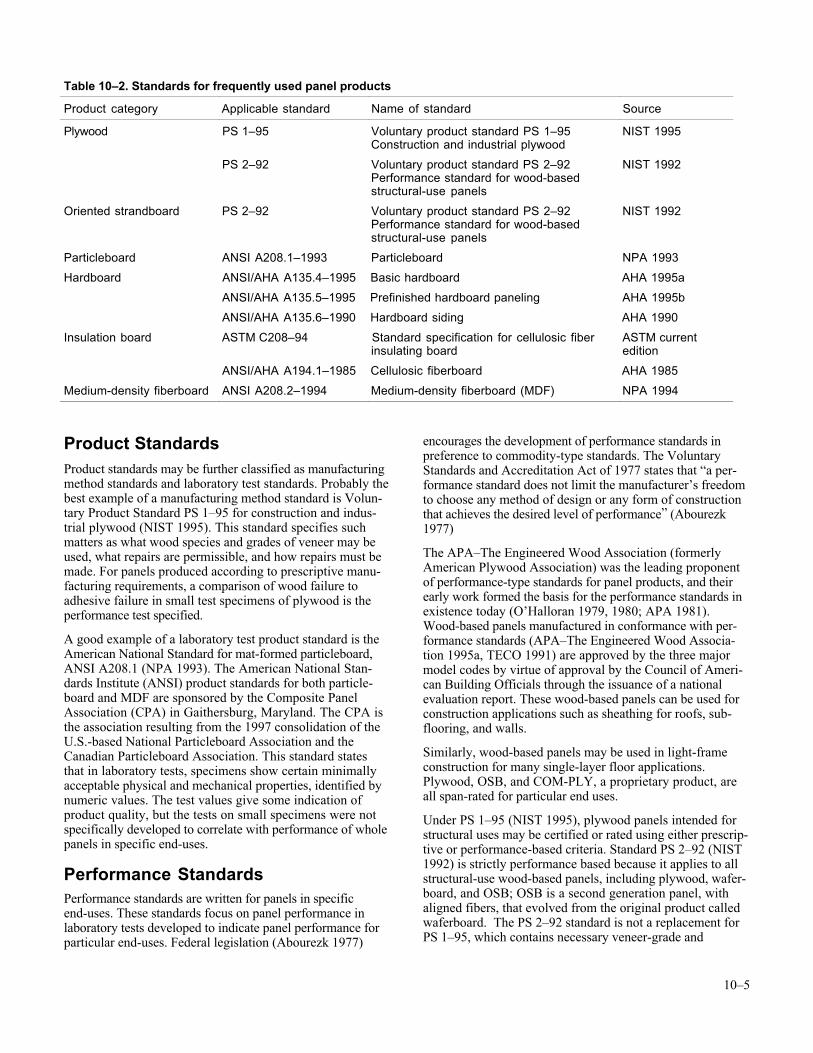
10–5
Product StandardsProduct standards may be further classified as manufacturingmethod standards and laboratory test standards. Probably thebest example of a manufacturing method standard is Volun-tary Product Standard PS 1–95 for construction and indus-trial plywood (NIST 1995). This standard specifies suchmatters as what wood species and grades of veneer may beused, what repairs are permissible, and how repairs must bemade. For panels produced according to prescriptive manu-facturing requirements, a comparison of wood failure toadhesive failure in small test specimens of plywood is theperformance test specified.
A good example of a laboratory test product standard is theAmerican National Standard for mat-formed particleboard,ANSI A208.1 (NPA 1993). The American National Stan-dards Institute (ANSI) product standards for both particle-board and MDF are sponsored by the Composite PanelAssociation (CPA) in Gaithersburg, Maryland. The CPA isthe association resulting from the 1997 consolidation of theU.S.-based National Particleboard Association and theCanadian Particleboard Association. This standard statesthat in laboratory tests, specimens show certain minimallyacceptable physical and mechanical properties, identified bynumeric values. The test values give some indication ofproduct quality, but the tests on small specimens were notspecifically developed to correlate with performance of wholepanels in specific end-uses.
Performance StandardsPerformance standards are written for panels in specificend-uses. These standards focus on panel performance inlaboratory tests developed to indicate panel performance forparticular end-uses. Federal legislation (Abourezk 1977)
encourages the development of performance standards inpreference to commodity-type standards. The VoluntaryStandards and Accreditation Act of 1977 states that “a per-formance standard does not limit the manufacturer’s freedomto choose any method of design or any form of constructionthat achieves the desired level of performance” (Abourezk1977)
The APA–The Engineered Wood Association (formerlyAmerican Plywood Association) was the leading proponentof performance-type standards for panel products, and theirearly work formed the basis for the performance standards inexistence today (O’Halloran 1979, 1980; APA 1981).Wood-based panels manufactured in conformance with per-formance standards (APA–The Engineered Wood Associa-tion 1995a, TECO 1991) are approved by the three majormodel codes by virtue of approval by the Council of Ameri-can Building Officials through the issuance of a nationalevaluation report. These wood-based panels can be used forconstruction applications such as sheathing for roofs, sub-flooring, and walls.
Similarly, wood-based panels may be used in light-frameconstruction for many single-layer floor applications.Plywood, OSB, and COM-PLY, a proprietary product, areall span-rated for particular end uses.
Under PS 1–95 (NIST 1995), plywood panels intended forstructural uses may be certified or rated using either prescrip-tive or performance-based criteria. Standard PS 2–92 (NIST1992) is strictly performance based because it applies to allstructural-use wood-based panels, including plywood, wafer-board, and OSB; OSB is a second generation panel, withaligned fibers, that evolved from the original product calledwaferboard. The PS 2–92 standard is not a replacement forPS 1–95, which contains necessary veneer-grade and
Table 10–2. Standards for frequently used panel products
Product category Applicable standard Name of standard Source
Plywood PS 1–95 Voluntary product standard PS 1–95Construction and industrial plywood
NIST 1995
PS 2–92 Voluntary product standard PS 2–92Performance standard for wood-basedstructural-use panels
NIST 1992
Oriented strandboard PS 2–92 Voluntary product standard PS 2–92Performance standard for wood-basedstructural-use panels
NIST 1992
Particleboard ANSI A208.1–1993 Particleboard NPA 1993
Hardboard ANSI/AHA A135.4–1995 Basic hardboard AHA 1995a
ANSI/AHA A135.5–1995 Prefinished hardboard paneling AHA 1995b
ANSI/AHA A135.6–1990 Hardboard siding AHA 1990
Insulation board ASTM C208–94 Standard specification for cellulosic fiberinsulating board
ASTM currentedition
ANSI/AHA A194.1–1985 Cellulosic fiberboard AHA 1985
Medium-density fiberboard ANSI A208.2–1994 Medium-density fiberboard (MDF) NPA 1994
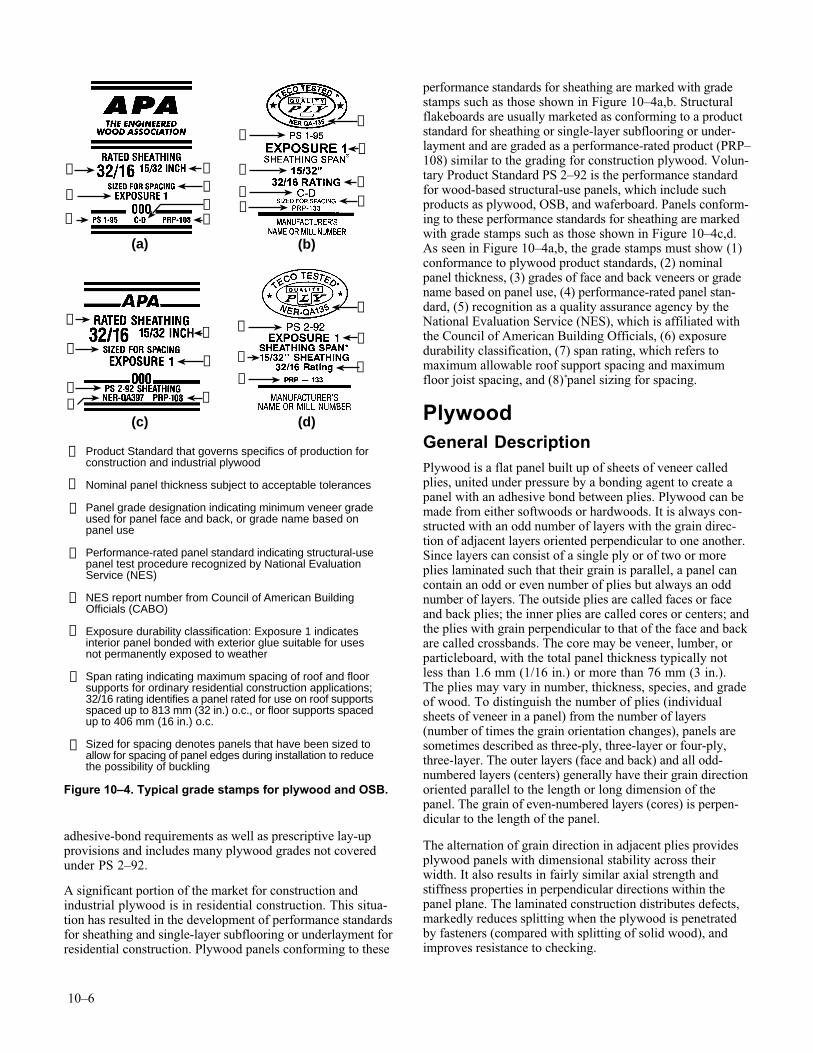
10–6
adhesive-bond requirements as well as prescriptive lay-upprovisions and includes many plywood grades not coveredunder PS 2–92.
A significant portion of the market for construction andindustrial plywood is in residential construction. This situa-tion has resulted in the development of performance standardsfor sheathing and single-layer subflooring or underlayment forresidential construction. Plywood panels conforming to these
performance standards for sheathing are marked with gradestamps such as those shown in Figure 10–4a,b. Structuralflakeboards are usually marketed as conforming to a productstandard for sheathing or single-layer subflooring or under-layment and are graded as a performance-rated product (PRP–108) similar to the grading for construction plywood. Volun-tary Product Standard PS 2–92 is the performance standardfor wood-based structural-use panels, which include suchproducts as plywood, OSB, and waferboard. Panels conform-ing to these performance standards for sheathing are markedwith grade stamps such as those shown in Figure 10–4c,d.As seen in Figure 10–4a,b, the grade stamps must show (1)conformance to plywood product standards, (2) nominalpanel thickness, (3) grades of face and back veneers or gradename based on panel use, (4) performance-rated panel stan-dard, (5) recognition as a quality assurance agency by theNational Evaluation Service (NES), which is affiliated withthe Council of American Building Officials, (6) exposuredurability classification, (7) span rating, which refers tomaximum allowable roof support spacing and maximumfloor joist spacing, and (8) panel sizing for spacing.
PlywoodGeneral DescriptionPlywood is a flat panel built up of sheets of veneer calledplies, united under pressure by a bonding agent to create apanel with an adhesive bond between plies. Plywood can bemade from either softwoods or hardwoods. It is always con-structed with an odd number of layers with the grain direc-tion of adjacent layers oriented perpendicular to one another.Since layers can consist of a single ply or of two or moreplies laminated such that their grain is parallel, a panel cancontain an odd or even number of plies but always an oddnumber of layers. The outside plies are called faces or faceand back plies; the inner plies are called cores or centers; andthe plies with grain perpendicular to that of the face and backare called crossbands. The core may be veneer, lumber, orparticleboard, with the total panel thickness typically notless than 1.6 mm (1/16 in.) or more than 76 mm (3 in.).The plies may vary in number, thickness, species, and gradeof wood. To distinguish the number of plies (individualsheets of veneer in a panel) from the number of layers(number of times the grain orientation changes), panels aresometimes described as three-ply, three-layer or four-ply,three-layer. The outer layers (face and back) and all odd-numbered layers (centers) generally have their grain directionoriented parallel to the length or long dimension of thepanel. The grain of even-numbered layers (cores) is perpen-dicular to the length of the panel.
The alternation of grain direction in adjacent plies providesplywood panels with dimensional stability across theirwidth. It also results in fairly similar axial strength andstiffness properties in perpendicular directions within thepanel plane. The laminated construction distributes defects,markedly reduces splitting when the plywood is penetratedby fasteners (compared with splitting of solid wood), andimproves resistance to checking.
❶
❷
❸❹
❽
(a)
❶
❷
❹❺
❽
(c)
(b)
(d)
❶
❷
❸❹ ❽
❺
❶
❷
❹
❺
❼
➏
➏
➏
❼
➏
❼
❼
Product Standard that governs specifics of production forconstruction and industrial plywood
Nominal panel thickness subject to acceptable tolerances
Panel grade designation indicating minimum veneer gradeused for panel face and back, or grade name based onpanel use
Performance-rated panel standard indicating structural-usepanel test procedure recognized by National EvaluationService (NES)
NES report number from Council of American BuildingOfficials (CABO)
Exposure durability classification: Exposure 1 indicatesinterior panel bonded with exterior glue suitable for usesnot permanently exposed to weather
Span rating indicating maximum spacing of roof and floorsupports for ordinary residential construction applications;32/16 rating identifies a panel rated for use on roof supportsspaced up to 813 mm (32 in.) o.c., or floor supports spacedup to 406 mm (16 in.) o.c.
Sized for spacing denotes panels that have been sized toallow for spacing of panel edges during installation to reducethe possibility of buckling
❶
❷
❸
❹
❽
❺
➏
❼
Figure 10–4. Typical grade stamps for plywood and OSB.
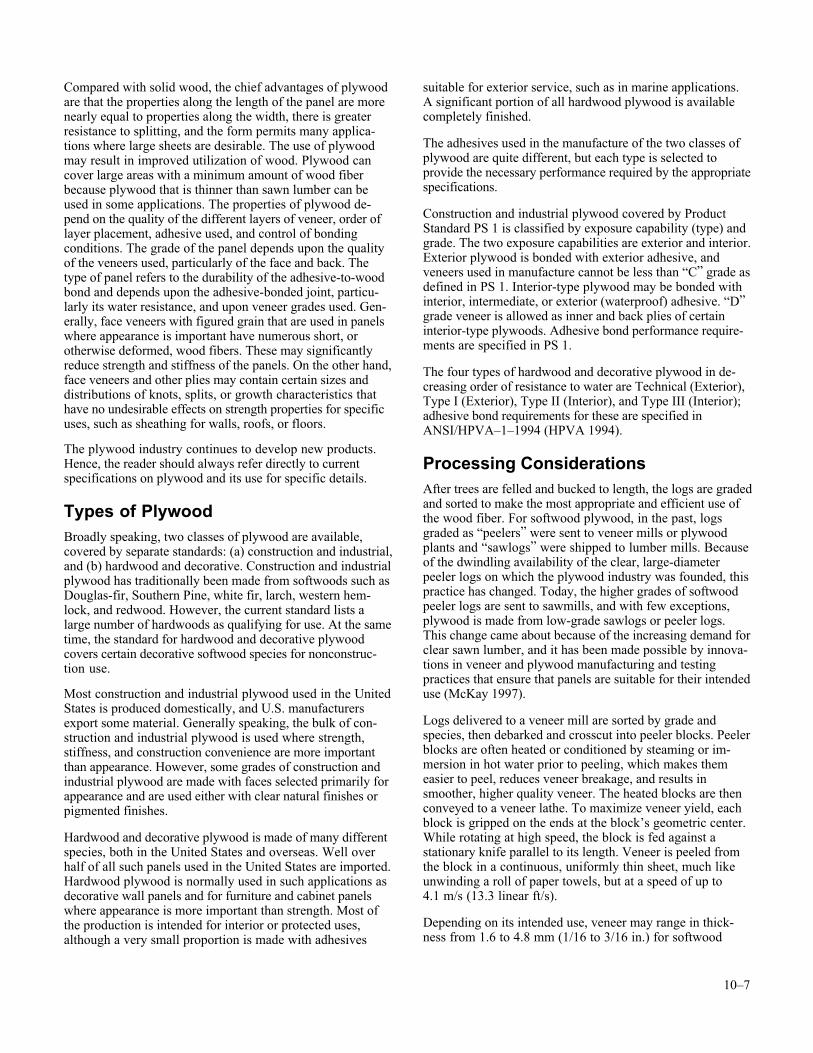
10–7
Compared with solid wood, the chief advantages of plywoodare that the properties along the length of the panel are morenearly equal to properties along the width, there is greaterresistance to splitting, and the form permits many applica-tions where large sheets are desirable. The use of plywoodmay result in improved utilization of wood. Plywood cancover large areas with a minimum amount of wood fiberbecause plywood that is thinner than sawn lumber can beused in some applications. The properties of plywood de-pend on the quality of the different layers of veneer, order oflayer placement, adhesive used, and control of bondingconditions. The grade of the panel depends upon the qualityof the veneers used, particularly of the face and back. Thetype of panel refers to the durability of the adhesive-to-woodbond and depends upon the adhesive-bonded joint, particu-larly its water resistance, and upon veneer grades used. Gen-erally, face veneers with figured grain that are used in panelswhere appearance is important have numerous short, orotherwise deformed, wood fibers. These may significantlyreduce strength and stiffness of the panels. On the other hand,face veneers and other plies may contain certain sizes anddistributions of knots, splits, or growth characteristics thathave no undesirable effects on strength properties for specificuses, such as sheathing for walls, roofs, or floors.
The plywood industry continues to develop new products.Hence, the reader should always refer directly to currentspecifications on plywood and its use for specific details.
Types of PlywoodBroadly speaking, two classes of plywood are available,covered by separate standards: (a) construction and industrial,and (b) hardwood and decorative. Construction and industrialplywood has traditionally been made from softwoods such asDouglas-fir, Southern Pine, white fir, larch, western hem-lock, and redwood. However, the current standard lists alarge number of hardwoods as qualifying for use. At the sametime, the standard for hardwood and decorative plywoodcovers certain decorative softwood species for nonconstruc-tion use.
Most construction and industrial plywood used in the UnitedStates is produced domestically, and U.S. manufacturersexport some material. Generally speaking, the bulk of con-struction and industrial plywood is used where strength,stiffness, and construction convenience are more importantthan appearance. However, some grades of construction andindustrial plywood are made with faces selected primarily forappearance and are used either with clear natural finishes orpigmented finishes.
Hardwood and decorative plywood is made of many differentspecies, both in the United States and overseas. Well overhalf of all such panels used in the United States are imported.Hardwood plywood is normally used in such applications asdecorative wall panels and for furniture and cabinet panelswhere appearance is more important than strength. Most ofthe production is intended for interior or protected uses,although a very small proportion is made with adhesives
suitable for exterior service, such as in marine applications.A significant portion of all hardwood plywood is availablecompletely finished.
The adhesives used in the manufacture of the two classes ofplywood are quite different, but each type is selected toprovide the necessary performance required by the appropriatespecifications.
Construction and industrial plywood covered by ProductStandard PS 1 is classified by exposure capability (type) andgrade. The two exposure capabilities are exterior and interior.Exterior plywood is bonded with exterior adhesive, andveneers used in manufacture cannot be less than “C” grade asdefined in PS 1. Interior-type plywood may be bonded withinterior, intermediate, or exterior (waterproof) adhesive. “D”grade veneer is allowed as inner and back plies of certaininterior-type plywoods. Adhesive bond performance require-ments are specified in PS 1.
The four types of hardwood and decorative plywood in de-creasing order of resistance to water are Technical (Exterior),Type I (Exterior), Type II (Interior), and Type III (Interior);adhesive bond requirements for these are specified inANSI/HPVA–1–1994 (HPVA 1994).
Processing ConsiderationsAfter trees are felled and bucked to length, the logs are gradedand sorted to make the most appropriate and efficient use ofthe wood fiber. For softwood plywood, in the past, logsgraded as “peelers” were sent to veneer mills or plywoodplants and “sawlogs” were shipped to lumber mills. Becauseof the dwindling availability of the clear, large-diameterpeeler logs on which the plywood industry was founded, thispractice has changed. Today, the higher grades of softwoodpeeler logs are sent to sawmills, and with few exceptions,plywood is made from low-grade sawlogs or peeler logs.This change came about because of the increasing demand forclear sawn lumber, and it has been made possible by innova-tions in veneer and plywood manufacturing and testingpractices that ensure that panels are suitable for their intendeduse (McKay 1997).
Logs delivered to a veneer mill are sorted by grade andspecies, then debarked and crosscut into peeler blocks. Peelerblocks are often heated or conditioned by steaming or im-mersion in hot water prior to peeling, which makes themeasier to peel, reduces veneer breakage, and results insmoother, higher quality veneer. The heated blocks are thenconveyed to a veneer lathe. To maximize veneer yield, eachblock is gripped on the ends at the block’s geometric center.While rotating at high speed, the block is fed against astationary knife parallel to its length. Veneer is peeled fromthe block in a continuous, uniformly thin sheet, much likeunwinding a roll of paper towels, but at a speed of up to4.1 m/s (13.3 linear ft/s).
Depending on its intended use, veneer may range in thick-ness from 1.6 to 4.8 mm (1/16 to 3/16 in.) for softwood
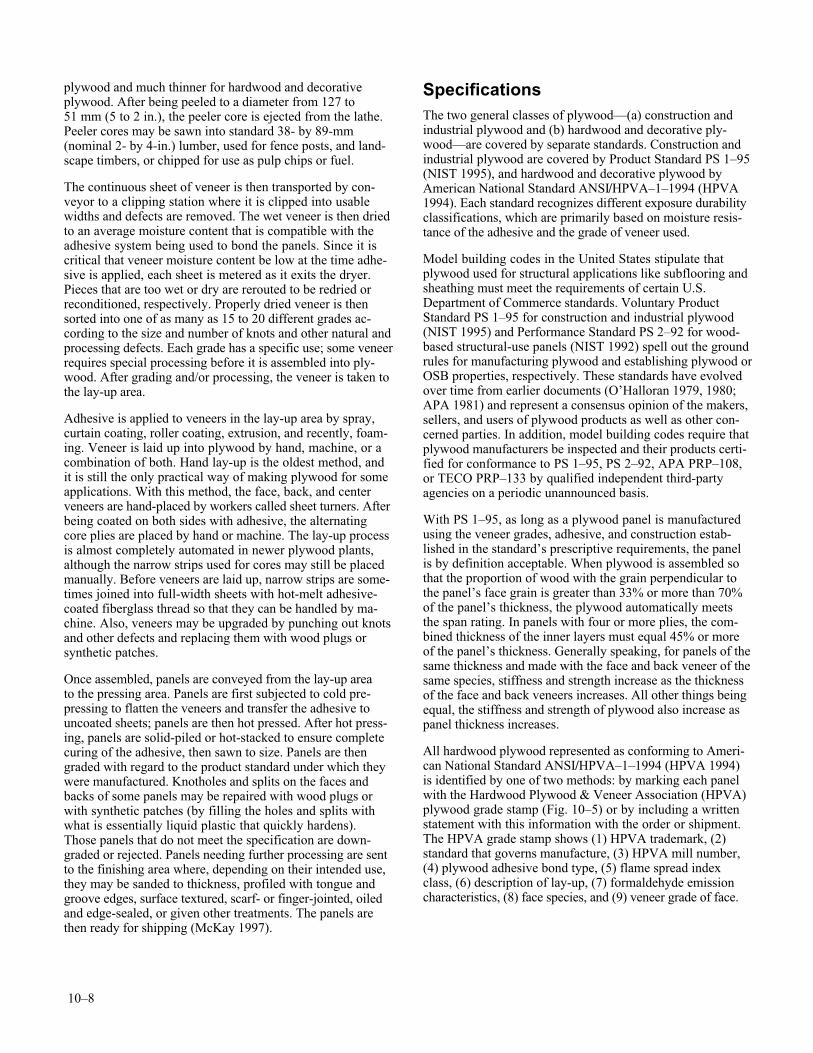
10–8
plywood and much thinner for hardwood and decorativeplywood. After being peeled to a diameter from 127 to51 mm (5 to 2 in.), the peeler core is ejected from the lathe.Peeler cores may be sawn into standard 38- by 89-mm(nominal 2- by 4-in.) lumber, used for fence posts, and land-scape timbers, or chipped for use as pulp chips or fuel.
The continuous sheet of veneer is then transported by con-veyor to a clipping station where it is clipped into usablewidths and defects are removed. The wet veneer is then driedto an average moisture content that is compatible with theadhesive system being used to bond the panels. Since it iscritical that veneer moisture content be low at the time adhe-sive is applied, each sheet is metered as it exits the dryer.Pieces that are too wet or dry are rerouted to be redried orreconditioned, respectively. Properly dried veneer is thensorted into one of as many as 15 to 20 different grades ac-cording to the size and number of knots and other natural andprocessing defects. Each grade has a specific use; some veneerrequires special processing before it is assembled into ply-wood. After grading and/or processing, the veneer is taken tothe lay-up area.
Adhesive is applied to veneers in the lay-up area by spray,curtain coating, roller coating, extrusion, and recently, foam-ing. Veneer is laid up into plywood by hand, machine, or acombination of both. Hand lay-up is the oldest method, andit is still the only practical way of making plywood for someapplications. With this method, the face, back, and centerveneers are hand-placed by workers called sheet turners. Afterbeing coated on both sides with adhesive, the alternatingcore plies are placed by hand or machine. The lay-up processis almost completely automated in newer plywood plants,although the narrow strips used for cores may still be placedmanually. Before veneers are laid up, narrow strips are some-times joined into full-width sheets with hot-melt adhesive-coated fiberglass thread so that they can be handled by ma-chine. Also, veneers may be upgraded by punching out knotsand other defects and replacing them with wood plugs orsynthetic patches.
Once assembled, panels are conveyed from the lay-up areato the pressing area. Panels are first subjected to cold pre-pressing to flatten the veneers and transfer the adhesive touncoated sheets; panels are then hot pressed. After hot press-ing, panels are solid-piled or hot-stacked to ensure completecuring of the adhesive, then sawn to size. Panels are thengraded with regard to the product standard under which theywere manufactured. Knotholes and splits on the faces andbacks of some panels may be repaired with wood plugs orwith synthetic patches (by filling the holes and splits withwhat is essentially liquid plastic that quickly hardens).Those panels that do not meet the specification are down-graded or rejected. Panels needing further processing are sentto the finishing area where, depending on their intended use,they may be sanded to thickness, profiled with tongue andgroove edges, surface textured, scarf- or finger-jointed, oiledand edge-sealed, or given other treatments. The panels arethen ready for shipping (McKay 1997).
SpecificationsThe two general classes of plywood—(a) construction andindustrial plywood and (b) hardwood and decorative ply-wood—are covered by separate standards. Construction andindustrial plywood are covered by Product Standard PS 1–95(NIST 1995), and hardwood and decorative plywood byAmerican National Standard ANSI/HPVA–1–1994 (HPVA1994). Each standard recognizes different exposure durabilityclassifications, which are primarily based on moisture resis-tance of the adhesive and the grade of veneer used.
Model building codes in the United States stipulate thatplywood used for structural applications like subflooring andsheathing must meet the requirements of certain U.S.Department of Commerce standards. Voluntary ProductStandard PS 1–95 for construction and industrial plywood(NIST 1995) and Performance Standard PS 2–92 for wood-based structural-use panels (NIST 1992) spell out the groundrules for manufacturing plywood and establishing plywood orOSB properties, respectively. These standards have evolvedover time from earlier documents (O’Halloran 1979, 1980;APA 1981) and represent a consensus opinion of the makers,sellers, and users of plywood products as well as other con-cerned parties. In addition, model building codes require thatplywood manufacturers be inspected and their products certi-fied for conformance to PS 1–95, PS 2–92, APA PRP–108,or TECO PRP–133 by qualified independent third-partyagencies on a periodic unannounced basis.
With PS 1–95, as long as a plywood panel is manufacturedusing the veneer grades, adhesive, and construction estab-lished in the standard’s prescriptive requirements, the panelis by definition acceptable. When plywood is assembled sothat the proportion of wood with the grain perpendicular tothe panel’s face grain is greater than 33% or more than 70%of the panel’s thickness, the plywood automatically meetsthe span rating. In panels with four or more plies, the com-bined thickness of the inner layers must equal 45% or moreof the panel’s thickness. Generally speaking, for panels of thesame thickness and made with the face and back veneer of thesame species, stiffness and strength increase as the thicknessof the face and back veneers increases. All other things beingequal, the stiffness and strength of plywood also increase aspanel thickness increases.
All hardwood plywood represented as conforming to Ameri-can National Standard ANSI/HPVA–1–1994 (HPVA 1994)is identified by one of two methods: by marking each panelwith the Hardwood Plywood & Veneer Association (HPVA)plywood grade stamp (Fig. 10–5) or by including a writtenstatement with this information with the order or shipment.The HPVA grade stamp shows (1) HPVA trademark, (2)standard that governs manufacture, (3) HPVA mill number,(4) plywood adhesive bond type, (5) flame spread indexclass, (6) description of lay-up, (7) formaldehyde emissioncharacteristics, (8) face species, and (9) veneer grade of face.
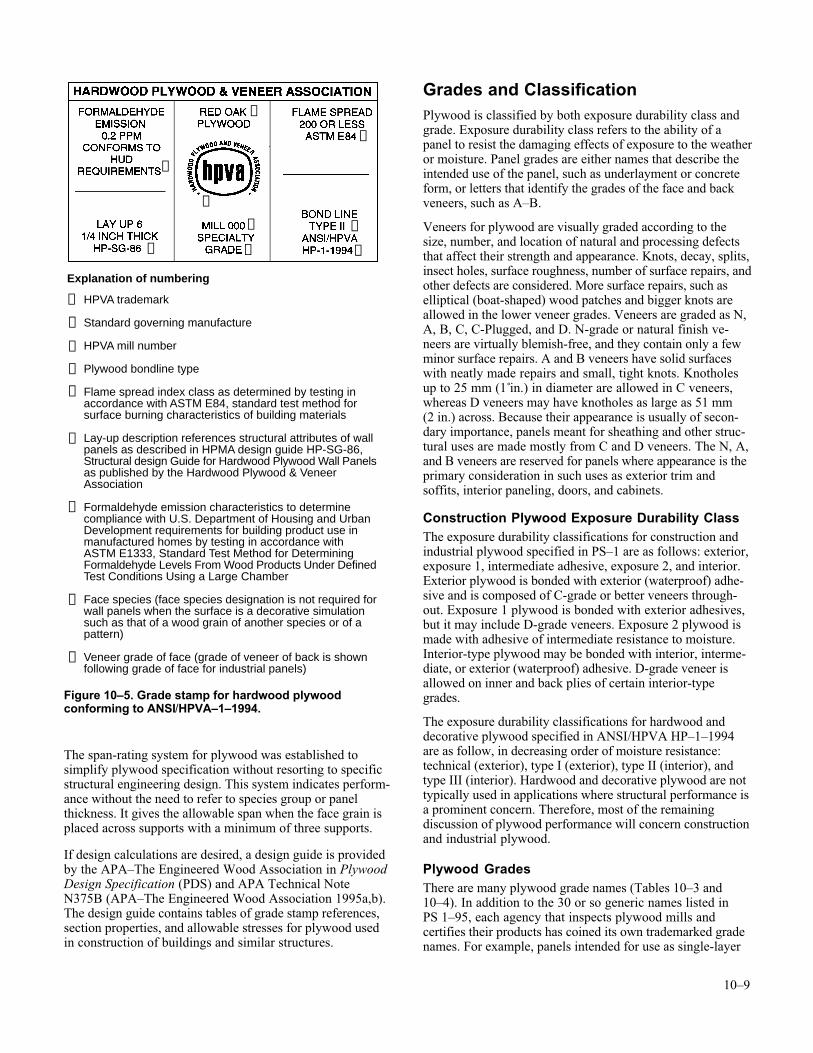
10–9
The span-rating system for plywood was established tosimplify plywood specification without resorting to specificstructural engineering design. This system indicates perform-ance without the need to refer to species group or panelthickness. It gives the allowable span when the face grain isplaced across supports with a minimum of three supports.
If design calculations are desired, a design guide is providedby the APA–The Engineered Wood Association in PlywoodDesign Specification (PDS) and APA Technical NoteN375B (APA–The Engineered Wood Association 1995a,b).The design guide contains tables of grade stamp references,section properties, and allowable stresses for plywood usedin construction of buildings and similar structures.
Grades and ClassificationPlywood is classified by both exposure durability class andgrade. Exposure durability class refers to the ability of apanel to resist the damaging effects of exposure to the weatheror moisture. Panel grades are either names that describe theintended use of the panel, such as underlayment or concreteform, or letters that identify the grades of the face and backveneers, such as A–B.
Veneers for plywood are visually graded according to thesize, number, and location of natural and processing defectsthat affect their strength and appearance. Knots, decay, splits,insect holes, surface roughness, number of surface repairs, andother defects are considered. More surface repairs, such aselliptical (boat-shaped) wood patches and bigger knots areallowed in the lower veneer grades. Veneers are graded as N,A, B, C, C-Plugged, and D. N-grade or natural finish ve-neers are virtually blemish-free, and they contain only a fewminor surface repairs. A and B veneers have solid surfaceswith neatly made repairs and small, tight knots. Knotholesup to 25 mm (1 in.) in diameter are allowed in C veneers,whereas D veneers may have knotholes as large as 51 mm(2 in.) across. Because their appearance is usually of secon-dary importance, panels meant for sheathing and other struc-tural uses are made mostly from C and D veneers. The N, A,and B veneers are reserved for panels where appearance is theprimary consideration in such uses as exterior trim andsoffits, interior paneling, doors, and cabinets.
Construction Plywood Exposure Durability ClassThe exposure durability classifications for construction andindustrial plywood specified in PS–1 are as follows: exterior,exposure 1, intermediate adhesive, exposure 2, and interior.Exterior plywood is bonded with exterior (waterproof) adhe-sive and is composed of C-grade or better veneers through-out. Exposure 1 plywood is bonded with exterior adhesives,but it may include D-grade veneers. Exposure 2 plywood ismade with adhesive of intermediate resistance to moisture.Interior-type plywood may be bonded with interior, interme-diate, or exterior (waterproof) adhesive. D-grade veneer isallowed on inner and back plies of certain interior-typegrades.
The exposure durability classifications for hardwood anddecorative plywood specified in ANSI/HPVA HP–1–1994are as follow, in decreasing order of moisture resistance:technical (exterior), type I (exterior), type II (interior), andtype III (interior). Hardwood and decorative plywood are nottypically used in applications where structural performance isa prominent concern. Therefore, most of the remainingdiscussion of plywood performance will concern constructionand industrial plywood.
Plywood GradesThere are many plywood grade names (Tables 10–3 and10–4). In addition to the 30 or so generic names listed inPS 1–95, each agency that inspects plywood mills andcertifies their products has coined its own trademarked gradenames. For example, panels intended for use as single-layer
❾
❶
❷
❸ ❹
❽
❺
➏
❼
Explanation of numbering
HPVA trademark
Standard governing manufacture
HPVA mill number
Plywood bondline type
Flame spread index class as determined by testing inaccordance with ASTM E84, standard test method forsurface burning characteristics of building materials
Lay-up description references structural attributes of wallpanels as described in HPMA design guide HP-SG-86,Structural design Guide for Hardwood Plywood Wall Panelsas published by the Hardwood Plywood & VeneerAssociation
Formaldehyde emission characteristics to determinecompliance with U.S. Department of Housing and UrbanDevelopment requirements for building product use inmanufactured homes by testing in accordance withASTM E1333, Standard Test Method for DeterminingFormaldehyde Levels From Wood Products Under DefinedTest Conditions Using a Large Chamber
Face species (face species designation is not required forwall panels when the surface is a decorative simulationsuch as that of a wood grain of another species or of apattern)
Veneer grade of face (grade of veneer of back is shownfollowing grade of face for industrial panels)
❾
❷
❸
❹
➏
❶
❽
❺
❼
Figure 10–5. Grade stamp for hardwood plywoodconforming to ANSI/HPVA–1–1994.
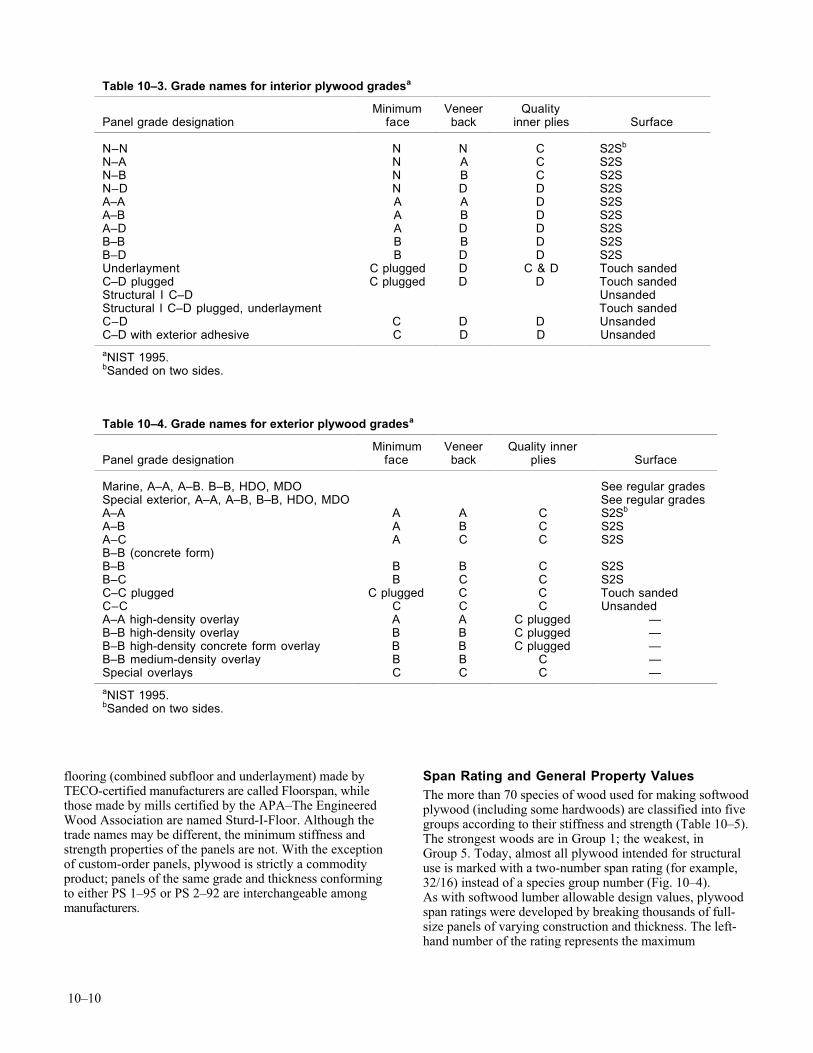
10–10
flooring (combined subfloor and underlayment) made byTECO-certified manufacturers are called Floorspan, whilethose made by mills certified by the APA–The EngineeredWood Association are named Sturd-I-Floor. Although thetrade names may be different, the minimum stiffness andstrength properties of the panels are not. With the exceptionof custom-order panels, plywood is strictly a commodityproduct; panels of the same grade and thickness conformingto either PS 1–95 or PS 2–92 are interchangeable amongmanufacturers.
Span Rating and General Property ValuesThe more than 70 species of wood used for making softwoodplywood (including some hardwoods) are classified into fivegroups according to their stiffness and strength (Table 10–5).The strongest woods are in Group 1; the weakest, inGroup 5. Today, almost all plywood intended for structuraluse is marked with a two-number span rating (for example,32/16) instead of a species group number (Fig. 10–4).As with softwood lumber allowable design values, plywoodspan ratings were developed by breaking thousands of full-size panels of varying construction and thickness. The left-hand number of the rating represents the maximum
Table 10–3. Grade names for interior plywood gradesa
Panel grade designationMinimum
faceVeneerback
Qualityinner plies Surface
N–N N N C S2Sb
N–A N A C S2SN–B N B C S2SN–D N D D S2SA–A A A D S2SA–B A B D S2SA–D A D D S2SB–B B B D S2SB–D B D D S2SUnderlayment C plugged D C & D Touch sandedC–D plugged C plugged D D Touch sandedStructural I C–D UnsandedStructural I C–D plugged, underlayment Touch sandedC–D C D D UnsandedC–D with exterior adhesive C D D Unsanded
aNIST 1995.bSanded on two sides.
Table 10–4. Grade names for exterior plywood gradesa
Panel grade designationMinimum
faceVeneerback
Quality innerplies Surface
Marine, A–A, A–B. B–B, HDO, MDO See regular gradesSpecial exterior, A–A, A–B, B–B, HDO, MDO See regular gradesA–A A A C S2Sb
A–B A B C S2SA–C A C C S2SB–B (concrete form)B–B B B C S2SB–C B C C S2SC–C plugged C plugged C C Touch sandedC–C C C C UnsandedA–A high-density overlay A A C plugged —B–B high-density overlay B B C plugged —B–B high-density concrete form overlay B B C plugged —B–B medium-density overlay B B C —Special overlays C C C —
aNIST 1995.bSanded on two sides.
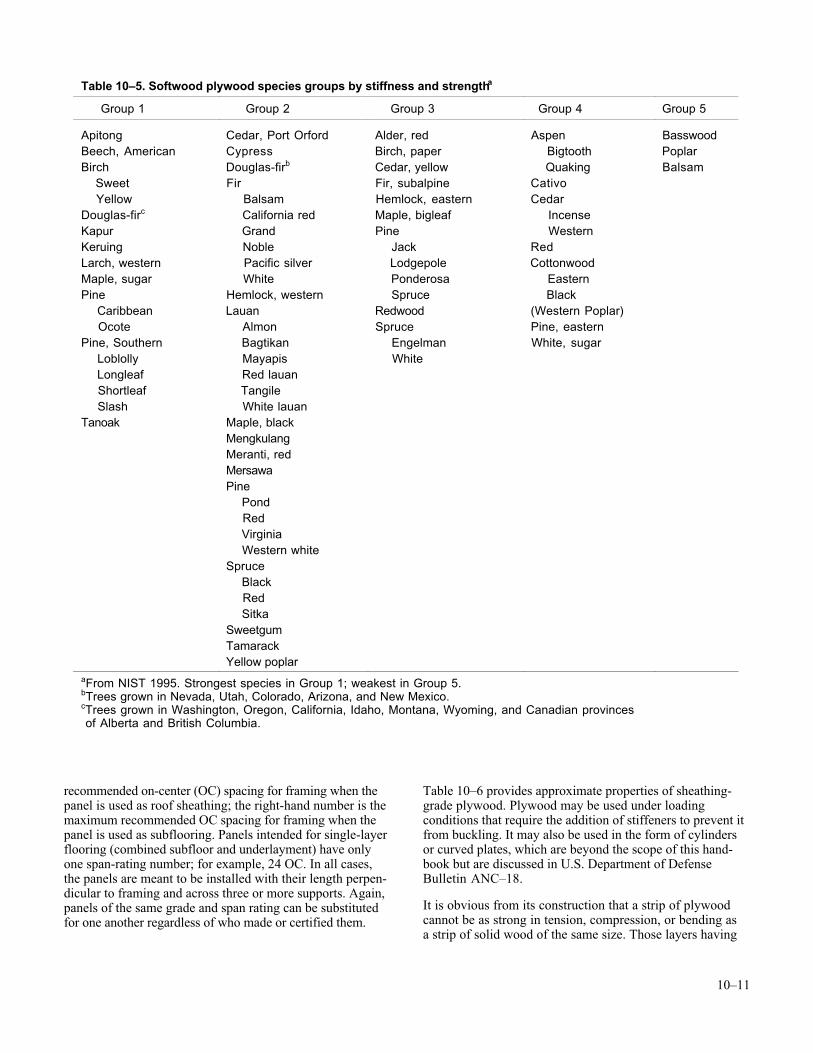
10–11
recommended on-center (OC) spacing for framing when thepanel is used as roof sheathing; the right-hand number is themaximum recommended OC spacing for framing when thepanel is used as subflooring. Panels intended for single-layerflooring (combined subfloor and underlayment) have onlyone span-rating number; for example, 24 OC. In all cases,the panels are meant to be installed with their length perpen-dicular to framing and across three or more supports. Again,panels of the same grade and span rating can be substitutedfor one another regardless of who made or certified them.
Table 10–6 provides approximate properties of sheathing-grade plywood. Plywood may be used under loadingconditions that require the addition of stiffeners to prevent itfrom buckling. It may also be used in the form of cylindersor curved plates, which are beyond the scope of this hand-book but are discussed in U.S. Department of DefenseBulletin ANC–18.
It is obvious from its construction that a strip of plywoodcannot be as strong in tension, compression, or bending asa strip of solid wood of the same size. Those layers having
Table 10–5. Softwood plywood species groups by stiffness and strengtha
Group 1 Group 2 Group 3 Group 4 Group 5
Apitong Cedar, Port Orford Alder, red Aspen BasswoodBeech, American Cypress Birch, paper Bigtooth PoplarBirch Douglas-firb Cedar, yellow Quaking Balsam Sweet Fir Fir, subalpine Cativo Yellow Balsam Hemlock, eastern CedarDouglas-firc California red Maple, bigleaf IncenseKapur Grand Pine WesternKeruing Noble Jack RedLarch, western Pacific silver Lodgepole CottonwoodMaple, sugar White Ponderosa EasternPine Hemlock, western Spruce Black Caribbean Lauan Redwood (Western Poplar) Ocote Almon Spruce Pine, easternPine, Southern Bagtikan Engelman White, sugar Loblolly Mayapis White Longleaf Red lauan Shortleaf Tangile Slash White lauanTanoak Maple, black
MengkulangMeranti, redMersawaPine Pond Red Virginia Western whiteSpruce Black Red SitkaSweetgumTamarackYellow poplar
aFrom NIST 1995. Strongest species in Group 1; weakest in Group 5.bTrees grown in Nevada, Utah, Colorado, Arizona, and New Mexico.cTrees grown in Washington, Oregon, California, Idaho, Montana, Wyoming, and Canadian provinces of Alberta and British Columbia.
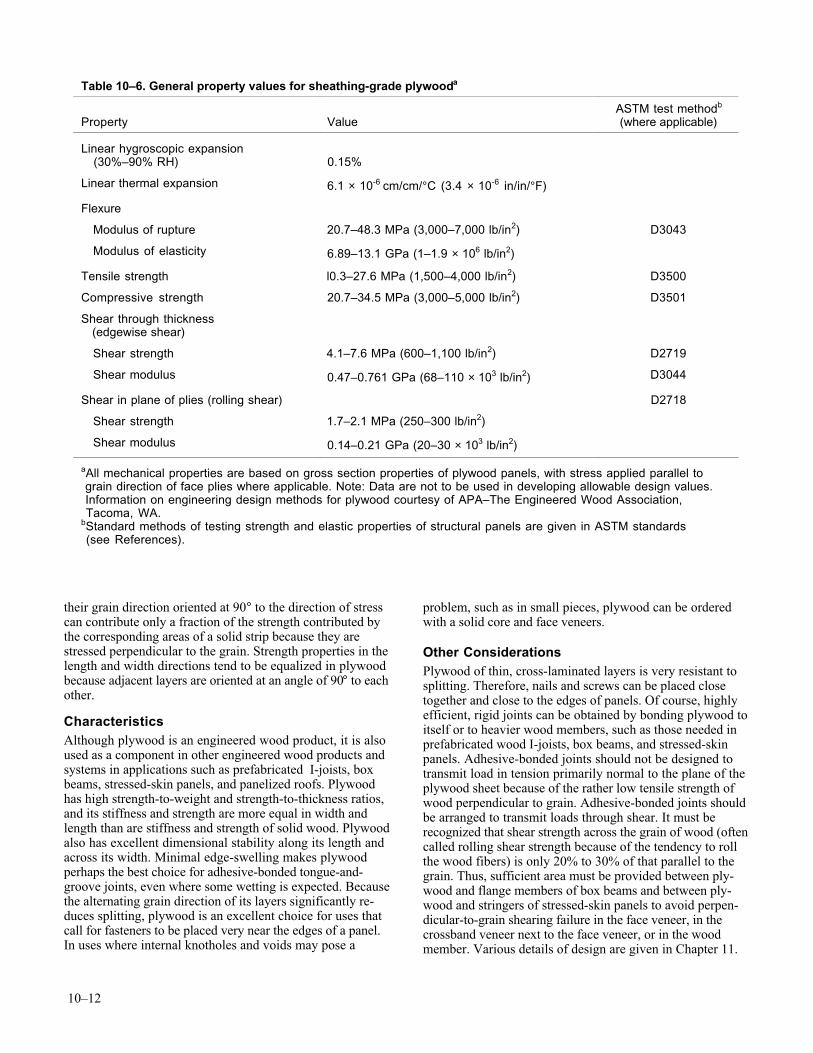
10–12
their grain direction oriented at 90° to the direction of stresscan contribute only a fraction of the strength contributed bythe corresponding areas of a solid strip because they arestressed perpendicular to the grain. Strength properties in thelength and width directions tend to be equalized in plywoodbecause adjacent layers are oriented at an angle of 90° to eachother.
CharacteristicsAlthough plywood is an engineered wood product, it is alsoused as a component in other engineered wood products andsystems in applications such as prefabricated I-joists, boxbeams, stressed-skin panels, and panelized roofs. Plywoodhas high strength-to-weight and strength-to-thickness ratios,and its stiffness and strength are more equal in width andlength than are stiffness and strength of solid wood. Plywoodalso has excellent dimensional stability along its length andacross its width. Minimal edge-swelling makes plywoodperhaps the best choice for adhesive-bonded tongue-and-groove joints, even where some wetting is expected. Becausethe alternating grain direction of its layers significantly re-duces splitting, plywood is an excellent choice for uses thatcall for fasteners to be placed very near the edges of a panel.In uses where internal knotholes and voids may pose a
problem, such as in small pieces, plywood can be orderedwith a solid core and face veneers.
Other ConsiderationsPlywood of thin, cross-laminated layers is very resistant tosplitting. Therefore, nails and screws can be placed closetogether and close to the edges of panels. Of course, highlyefficient, rigid joints can be obtained by bonding plywood toitself or to heavier wood members, such as those needed inprefabricated wood I-joists, box beams, and stressed-skinpanels. Adhesive-bonded joints should not be designed totransmit load in tension primarily normal to the plane of theplywood sheet because of the rather low tensile strength ofwood perpendicular to grain. Adhesive-bonded joints shouldbe arranged to transmit loads through shear. It must berecognized that shear strength across the grain of wood (oftencalled rolling shear strength because of the tendency to rollthe wood fibers) is only 20% to 30% of that parallel to thegrain. Thus, sufficient area must be provided between ply-wood and flange members of box beams and between ply-wood and stringers of stressed-skin panels to avoid perpen-dicular-to-grain shearing failure in the face veneer, in thecrossband veneer next to the face veneer, or in the woodmember. Various details of design are given in Chapter 11.
Table 10–6. General property values for sheathing-grade plywooda
Property ValueASTM test methodb
(where applicable)
Linear hygroscopic expansion (30%–90% RH) 0.15%
Linear thermal expansion 6.1 × 10⁻⁶ cm/cm/°C (3.4 × 10⁻⁶ in/in/°F)
Flexure
Modulus of rupture 20.7–48.3 MPa (3,000–7,000 lb/in2) D3043
Modulus of elasticity 6.89–13.1 GPa (1–1.9 × 10⁶ lb/in2)
Tensile strength l0.3–27.6 MPa (1,500–4,000 lb/in2) D3500
Compressive strength 20.7–34.5 MPa (3,000–5,000 lb/in2) D3501
Shear through thickness (edgewise shear)
Shear strength 4.1–7.6 MPa (600–1,100 lb/in2) D2719
Shear modulus 0.47–0.761 GPa (68–110 × 103 lb/in2) D3044
Shear in plane of plies (rolling shear) D2718
Shear strength 1.7–2.1 MPa (250–300 lb/in2)
Shear modulus 0.14–0.21 GPa (20–30 × 103 lb/in2)
aAll mechanical properties are based on gross section properties of plywood panels, with stress applied parallel to grain direction of face plies where applicable. Note: Data are not to be used in developing allowable design values. Information on engineering design methods for plywood courtesy of APA–The Engineered Wood Association, Tacoma, WA.bStandard methods of testing strength and elastic properties of structural panels are given in ASTM standards (see References).
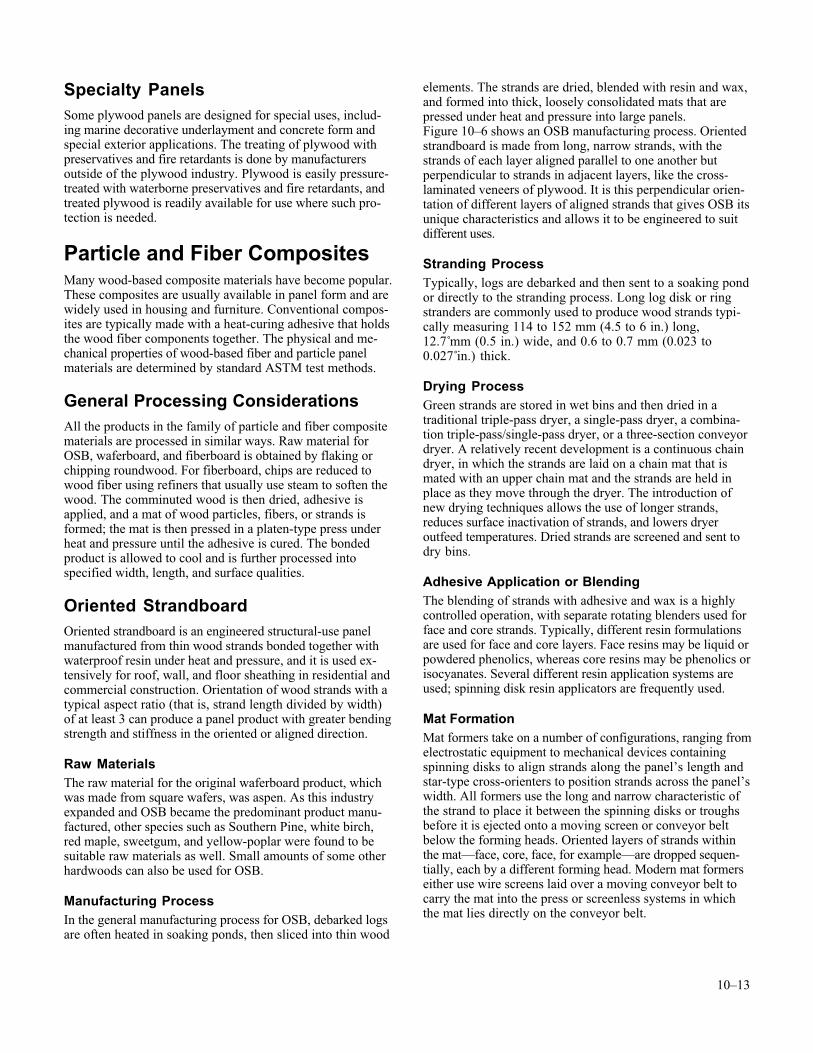
10–13
Specialty PanelsSome plywood panels are designed for special uses, includ-ing marine decorative underlayment and concrete form andspecial exterior applications. The treating of plywood withpreservatives and fire retardants is done by manufacturersoutside of the plywood industry. Plywood is easily pressure-treated with waterborne preservatives and fire retardants, andtreated plywood is readily available for use where such pro-tection is needed.
Particle and Fiber CompositesMany wood-based composite materials have become popular.These composites are usually available in panel form and arewidely used in housing and furniture. Conventional compos-ites are typically made with a heat-curing adhesive that holdsthe wood fiber components together. The physical and me-chanical properties of wood-based fiber and particle panelmaterials are determined by standard ASTM test methods.
General Processing ConsiderationsAll the products in the family of particle and fiber compositematerials are processed in similar ways. Raw material forOSB, waferboard, and fiberboard is obtained by flaking orchipping roundwood. For fiberboard, chips are reduced towood fiber using refiners that usually use steam to soften thewood. The comminuted wood is then dried, adhesive isapplied, and a mat of wood particles, fibers, or strands isformed; the mat is then pressed in a platen-type press underheat and pressure until the adhesive is cured. The bondedproduct is allowed to cool and is further processed intospecified width, length, and surface qualities.
Oriented StrandboardOriented strandboard is an engineered structural-use panelmanufactured from thin wood strands bonded together withwaterproof resin under heat and pressure, and it is used ex-tensively for roof, wall, and floor sheathing in residential andcommercial construction. Orientation of wood strands with atypical aspect ratio (that is, strand length divided by width)of at least 3 can produce a panel product with greater bendingstrength and stiffness in the oriented or aligned direction.
Raw MaterialsThe raw material for the original waferboard product, whichwas made from square wafers, was aspen. As this industryexpanded and OSB became the predominant product manu-factured, other species such as Southern Pine, white birch,red maple, sweetgum, and yellow-poplar were found to besuitable raw materials as well. Small amounts of some otherhardwoods can also be used for OSB.
Manufacturing ProcessIn the general manufacturing process for OSB, debarked logsare often heated in soaking ponds, then sliced into thin wood
elements. The strands are dried, blended with resin and wax,and formed into thick, loosely consolidated mats that arepressed under heat and pressure into large panels.Figure 10–6 shows an OSB manufacturing process. Orientedstrandboard is made from long, narrow strands, with thestrands of each layer aligned parallel to one another butperpendicular to strands in adjacent layers, like the cross-laminated veneers of plywood. It is this perpendicular orien-tation of different layers of aligned strands that gives OSB itsunique characteristics and allows it to be engineered to suitdifferent uses.
Stranding ProcessTypically, logs are debarked and then sent to a soaking pondor directly to the stranding process. Long log disk or ringstranders are commonly used to produce wood strands typi-cally measuring 114 to 152 mm (4.5 to 6 in.) long,12.7 mm (0.5 in.) wide, and 0.6 to 0.7 mm (0.023 to0.027 in.) thick.
Drying ProcessGreen strands are stored in wet bins and then dried in atraditional triple-pass dryer, a single-pass dryer, a combina-tion triple-pass/single-pass dryer, or a three-section conveyordryer. A relatively recent development is a continuous chaindryer, in which the strands are laid on a chain mat that ismated with an upper chain mat and the strands are held inplace as they move through the dryer. The introduction ofnew drying techniques allows the use of longer strands,reduces surface inactivation of strands, and lowers dryeroutfeed temperatures. Dried strands are screened and sent todry bins.
Adhesive Application or BlendingThe blending of strands with adhesive and wax is a highlycontrolled operation, with separate rotating blenders used forface and core strands. Typically, different resin formulationsare used for face and core layers. Face resins may be liquid orpowdered phenolics, whereas core resins may be phenolics orisocyanates. Several different resin application systems areused; spinning disk resin applicators are frequently used.
Mat FormationMat formers take on a number of configurations, ranging fromelectrostatic equipment to mechanical devices containingspinning disks to align strands along the panel’s length andstar-type cross-orienters to position strands across the panel’swidth. All formers use the long and narrow characteristic ofthe strand to place it between the spinning disks or troughsbefore it is ejected onto a moving screen or conveyor beltbelow the forming heads. Oriented layers of strands withinthe mat—face, core, face, for example—are dropped sequen-tially, each by a different forming head. Modern mat formerseither use wire screens laid over a moving conveyor belt tocarry the mat into the press or screenless systems in whichthe mat lies directly on the conveyor belt.
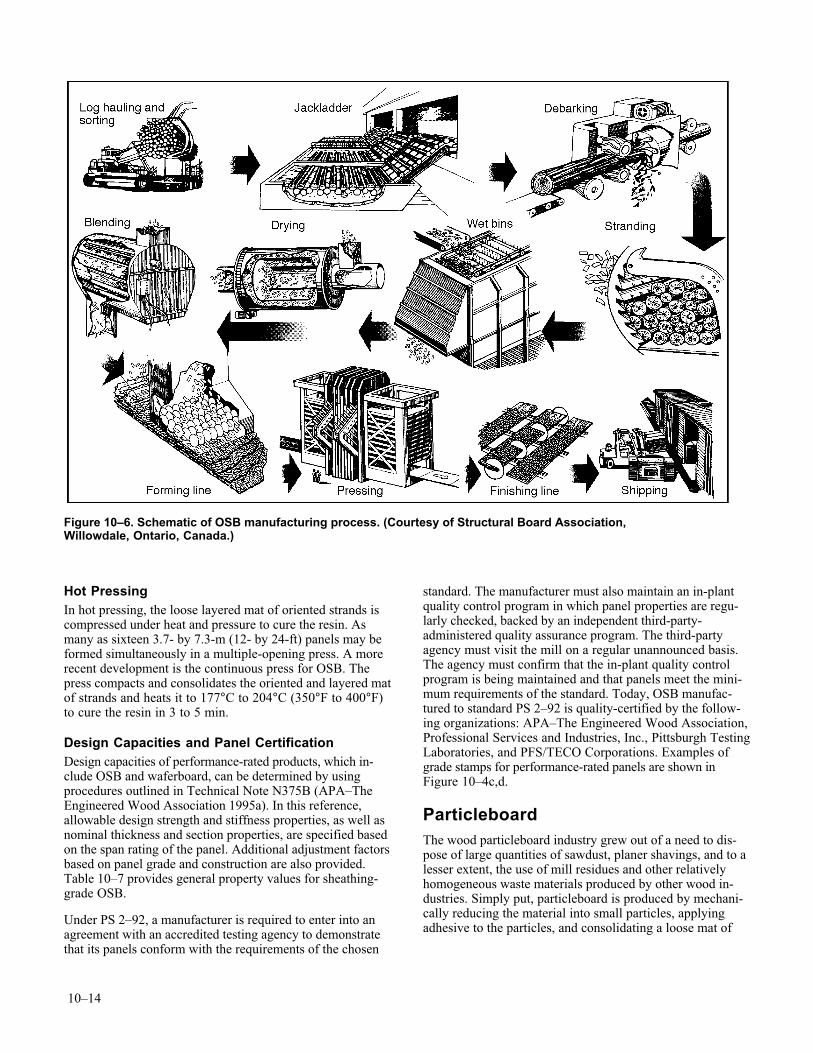
10–14
Hot PressingIn hot pressing, the loose layered mat of oriented strands iscompressed under heat and pressure to cure the resin. Asmany as sixteen 3.7- by 7.3-m (12- by 24-ft) panels may beformed simultaneously in a multiple-opening press. A morerecent development is the continuous press for OSB. Thepress compacts and consolidates the oriented and layered matof strands and heats it to 177°C to 204°C (350°F to 400°F)to cure the resin in 3 to 5 min.
Design Capacities and Panel CertificationDesign capacities of performance-rated products, which in-clude OSB and waferboard, can be determined by usingprocedures outlined in Technical Note N375B (APA–TheEngineered Wood Association 1995a). In this reference,allowable design strength and stiffness properties, as well asnominal thickness and section properties, are specified basedon the span rating of the panel. Additional adjustment factorsbased on panel grade and construction are also provided.Table 10–7 provides general property values for sheathing-grade OSB.
Under PS 2–92, a manufacturer is required to enter into anagreement with an accredited testing agency to demonstratethat its panels conform with the requirements of the chosen
standard. The manufacturer must also maintain an in-plantquality control program in which panel properties are regu-larly checked, backed by an independent third-party-administered quality assurance program. The third-partyagency must visit the mill on a regular unannounced basis.The agency must confirm that the in-plant quality controlprogram is being maintained and that panels meet the mini-mum requirements of the standard. Today, OSB manufac-tured to standard PS 2–92 is quality-certified by the follow-ing organizations: APA–The Engineered Wood Association,Professional Services and Industries, Inc., Pittsburgh TestingLaboratories, and PFS/TECO Corporations. Examples ofgrade stamps for performance-rated panels are shown inFigure 10–4c,d.
ParticleboardThe wood particleboard industry grew out of a need to dis-pose of large quantities of sawdust, planer shavings, and to alesser extent, the use of mill residues and other relativelyhomogeneous waste materials produced by other wood in-dustries. Simply put, particleboard is produced by mechani-cally reducing the material into small particles, applyingadhesive to the particles, and consolidating a loose mat of
Figure 10–6. Schematic of OSB manufacturing process. (Courtesy of Structural Board Association,Willowdale, Ontario, Canada.)
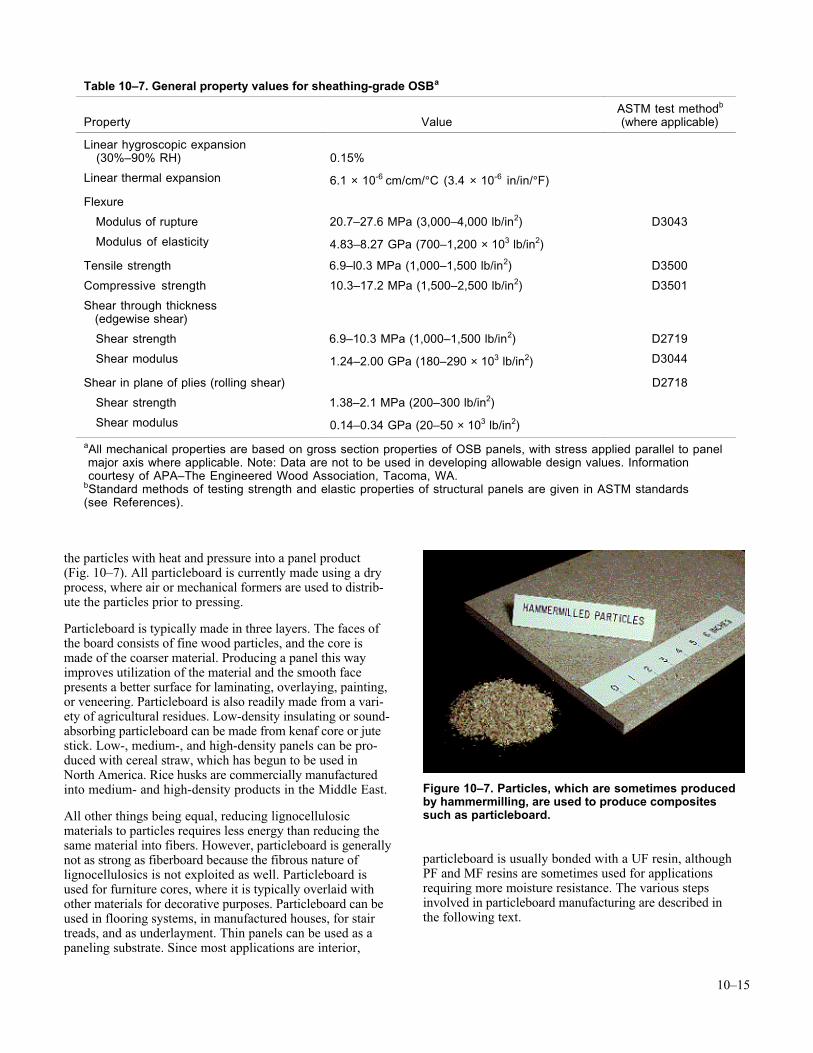
10–15
the particles with heat and pressure into a panel product(Fig. 10–7). All particleboard is currently made using a dryprocess, where air or mechanical formers are used to distrib-ute the particles prior to pressing.
Particleboard is typically made in three layers. The faces ofthe board consists of fine wood particles, and the core ismade of the coarser material. Producing a panel this wayimproves utilization of the material and the smooth facepresents a better surface for laminating, overlaying, painting,or veneering. Particleboard is also readily made from a vari-ety of agricultural residues. Low-density insulating or sound-absorbing particleboard can be made from kenaf core or jutestick. Low-, medium-, and high-density panels can be pro-duced with cereal straw, which has begun to be used inNorth America. Rice husks are commercially manufacturedinto medium- and high-density products in the Middle East.
All other things being equal, reducing lignocellulosicmaterials to particles requires less energy than reducing thesame material into fibers. However, particleboard is generallynot as strong as fiberboard because the fibrous nature oflignocellulosics is not exploited as well. Particleboard isused for furniture cores, where it is typically overlaid withother materials for decorative purposes. Particleboard can beused in flooring systems, in manufactured houses, for stairtreads, and as underlayment. Thin panels can be used as apaneling substrate. Since most applications are interior,
Figure 10–7. Particles, which are sometimes producedby hammermilling, are used to produce compositessuch as particleboard.
particleboard is usually bonded with a UF resin, althoughPF and MF resins are sometimes used for applicationsrequiring more moisture resistance. The various stepsinvolved in particleboard manufacturing are described inthe following text.
Table 10–7. General property values for sheathing-grade OSBa
Property ValueASTM test methodb
(where applicable)
Linear hygroscopic expansion (30%–90% RH) 0.15%
Linear thermal expansion 6.1 × 10⁻⁶ cm/cm/°C (3.4 × 10⁻⁶ in/in/°F)
Flexure
Modulus of rupture 20.7–27.6 MPa (3,000–4,000 lb/in2) D3043
Modulus of elasticity 4.83–8.27 GPa (700–1,200 × 103 lb/in2)
Tensile strength 6.9–l0.3 MPa (1,000–1,500 lb/in2) D3500
Compressive strength 10.3–17.2 MPa (1,500–2,500 lb/in2) D3501
Shear through thickness (edgewise shear)
Shear strength 6.9–10.3 MPa (1,000–1,500 lb/in2) D2719
Shear modulus 1.24–2.00 GPa (180–290 × 103 lb/in2) D3044
Shear in plane of plies (rolling shear) D2718
Shear strength 1.38–2.1 MPa (200–300 lb/in2)
Shear modulus 0.14–0.34 GPa (20–50 × 103 lb/in2)
aAll mechanical properties are based on gross section properties of OSB panels, with stress applied parallel to panel major axis where applicable. Note: Data are not to be used in developing allowable design values. Information courtesy of APA–The Engineered Wood Association, Tacoma, WA.bStandard methods of testing strength and elastic properties of structural panels are given in ASTM standards(see References).
10–16
Particle PreparationStandard particleboard plants based on particulate materialuse combinations of hogs, chippers, hammermills, ringflakers, ring mills, and attrition mills. To obtain particle-boards with good strength, smooth surfaces, and equal swel-ling, manufacturers ideally use a homogeneous material witha high degree of slenderness (long, thin particles), no over-size particles, no splinters, and no dust. Depending on themanufacturing process, the specifications for the ideal particlesize are different. For a graduated board, wider tolerances areacceptable. For a three-layer board, the core particles shouldbe longer and surface particles shorter, thinner, and smaller.For a five-layer or multi-layer board, the furnish for the in-termediate layer between surface and core should have longand thin particles for building a good carrier for the finesurface and to give the boards high bending strength andstiffness.
Particle Classification and ConveyingVery small particles increase furnish surface area and thusincrease resin requirements. Oversized particles can adverselyaffect the quality of the final product because of internal flawsin the particles. While some particles are classified throughthe use of air streams, screen classification methods are themost common. In screen classification, the particles are fedover a vibrating flat screen or a series of screens. The screensmay be wire cloth, plates with holes or slots, or plates set onedge.
The two basic methods of conveying particles are by me-chanical means and by air. The choice of conveying methoddepends upon the size of the particles. In air conveying, careshould be taken that the material does not pass throughmany fans, which reduces the size of the particles. In sometypes of flakes, damp conditions are maintained to reducebreak-up of particles during conveying.
Particle DryingThe furnish drying operation is a critical step in the process-ing of composite products. The raw materials for these prod-ucts do not usually arrive at the plant at a low enough mois-ture content for immediate use. Furnish that arrives at theplant can range from 10% to 200% moisture content. For usewith liquid resins, for example, the furnish must be reducedto about 2% to 7% moisture content.
The moisture content of particles is critical during hot-pressing operations. Thus, it is essential to carefully selectproper dryers and control equipment. The moisture contentof the material depends on whether resin is to be added dryor in the form of a solution or emulsion. The moisture con-tent of materials leaving the dryers is usually in the range of4% to 8%. The main methods used to dry particles arerotary, disk, and suspension drying.
A triple-pass rotary dryer consists of a large horizontal rotat-ing drum that is heated by either steam or direct heat. Oper-ating temperatures depend on the moisture content of theincoming furnish. The drum is set at a slight angle, and
material is fed into the high end and discharged at the lowend. A series of flights forces the furnish to flow from one endto the other three times before being discharged. The rotarymovement of the drum moves the material from input tooutput.
Addition of Resins and WaxFrequently used resins for particleboard include urea-formaldehyde and, to a much lesser extent, phenol-formaldehyde, melamine-formaldehyde, and isocyanates. Thetype and amount of resin used for particleboard depend on thetype of product desired. Based on the weight of dry resinsolids and ovendry weight of the particles, the resin contentcan range between 4% and 10%, but usually ranges between6% and 9% for UF resins. The resin content of the outer facelayers is usually slightly higher than that of the core layer.Urea-formaldehyde resin is usually introduced in water solu-tions containing about 50% to 65% solids. Besides resin,paraffin or microcrystalline wax emulsion is added to im-prove short-term moisture resistance. The amount of waxranges from 0.3% to 1% based on the ovendry weight of theparticles.
Mat FormationAfter the particles have been prepared, they must be laid intoan even and consistent mat to be pressed into a panel. Thisis typically accomplished in a batch mode or by continuousformation. The batch system employs a caul or tray onwhich a deckle frame is placed. The mat is formed by theback-and-forth movement of the tray or hopper feeder. Themat is usually cold pressed to reduce mat thickness prior tohot pressing. The production of three-layer boards requiresthree or more forming stations. The two outer layers consistof particles that differ in geometry from those in the core. Theresin content of the outer layers is usually higher (about 8%to 15%) than that of the core (about 4% to 8%).
In continuous mat-forming systems, the particles are distrib-uted in one or several layers on traveling cauls or on a mov-ing belt. Mat thickness is controlled volumetrically. Thetwo outer face layers usually consist of particles that differ ingeometry from those in the core. Continuous-formed mats areoften pre-pressed, with either a single-opening platen or acontinuous press. Pre-pressing reduces mat height and helpsto consolidate the mat for pressing.
Hot PressingAfter pre-pressing, the mats are hot-pressed into panels.Presses can be divided into platen and continuous types.Further development in the industry has made possible theconstruction of presses for producing increasingly larger panelsizes in both single- and multi-opening presses. Both ofthese types of presses can be as wide as 3.7 m (12 ft). Multi-opening presses can be as long as 10 m (33 ft) and single-opening presses, up to 30.5 m (100 ft) long. Hot-press tem-peratures for UF resins usually range from 140°C to 165°C(284°F to 325°F). Pressure depends on a number of factors,but it is usually in the range of 1.37 to 3.43 MPa (199 to498 lb/in2) for medium-density boards. Upon entering the
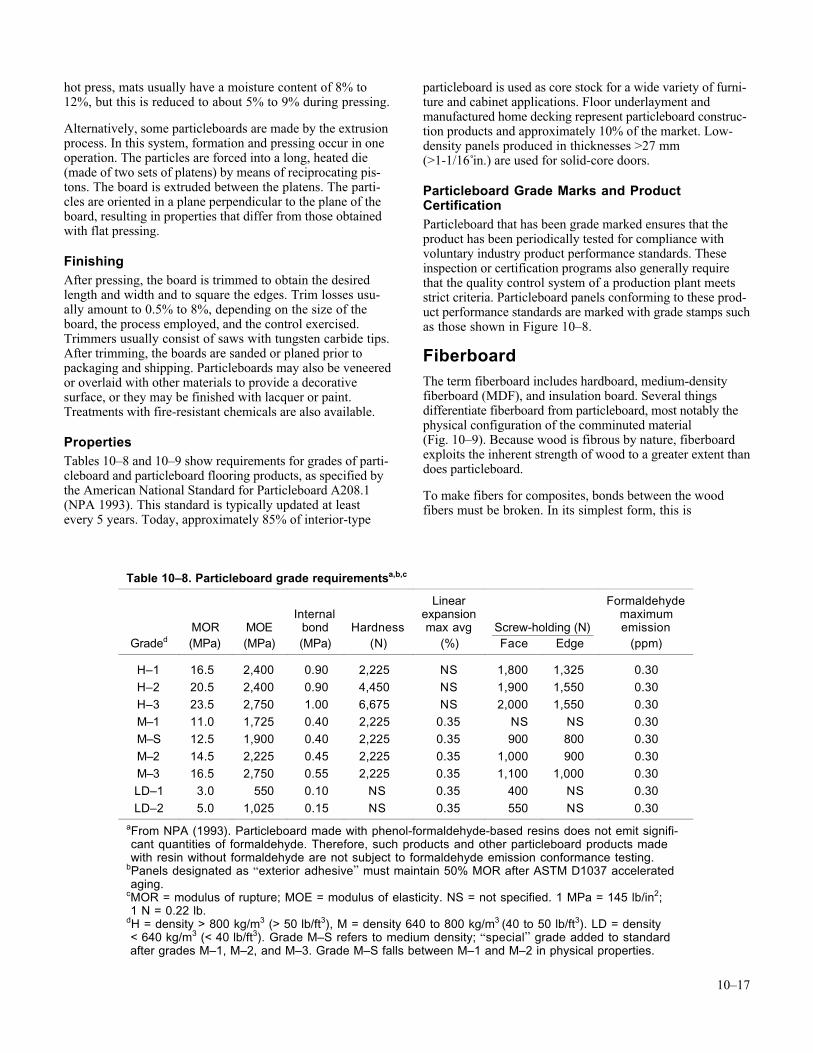
10–17
hot press, mats usually have a moisture content of 8% to12%, but this is reduced to about 5% to 9% during pressing.
Alternatively, some particleboards are made by the extrusionprocess. In this system, formation and pressing occur in oneoperation. The particles are forced into a long, heated die(made of two sets of platens) by means of reciprocating pis-tons. The board is extruded between the platens. The parti-cles are oriented in a plane perpendicular to the plane of theboard, resulting in properties that differ from those obtainedwith flat pressing.
FinishingAfter pressing, the board is trimmed to obtain the desiredlength and width and to square the edges. Trim losses usu-ally amount to 0.5% to 8%, depending on the size of theboard, the process employed, and the control exercised.Trimmers usually consist of saws with tungsten carbide tips.After trimming, the boards are sanded or planed prior topackaging and shipping. Particleboards may also be veneeredor overlaid with other materials to provide a decorativesurface, or they may be finished with lacquer or paint.Treatments with fire-resistant chemicals are also available.
PropertiesTables 10–8 and 10–9 show requirements for grades of parti-cleboard and particleboard flooring products, as specified bythe American National Standard for Particleboard A208.1(NPA 1993). This standard is typically updated at leastevery 5 years. Today, approximately 85% of interior-type
particleboard is used as core stock for a wide variety of furni-ture and cabinet applications. Floor underlayment andmanufactured home decking represent particleboard construc-tion products and approximately 10% of the market. Low-density panels produced in thicknesses >27 mm(>1-1/16 in.) are used for solid-core doors.
Particleboard Grade Marks and ProductCertificationParticleboard that has been grade marked ensures that theproduct has been periodically tested for compliance withvoluntary industry product performance standards. Theseinspection or certification programs also generally requirethat the quality control system of a production plant meetsstrict criteria. Particleboard panels conforming to these prod-uct performance standards are marked with grade stamps suchas those shown in Figure 10–8.
FiberboardThe term fiberboard includes hardboard, medium-densityfiberboard (MDF), and insulation board. Several thingsdifferentiate fiberboard from particleboard, most notably thephysical configuration of the comminuted material(Fig. 10–9). Because wood is fibrous by nature, fiberboardexploits the inherent strength of wood to a greater extent thandoes particleboard.
To make fibers for composites, bonds between the woodfibers must be broken. In its simplest form, this is
Table 10–8. Particleboard grade requirementsa,b,c
Linear FormaldehydeInternal expansion maximum
MOR MOE bond Hardness max avg Screw-holding (N) emissionGraded (MPa) (MPa) (MPa) (N) (%) Face Edge (ppm)
H–1 16.5 2,400 0.90 2,225 NS 1,800 1,325 0.30
H–2 20.5 2,400 0.90 4,450 NS 1,900 1,550 0.30
H–3 23.5 2,750 1.00 6,675 NS 2,000 1,550 0.30
M–1 11.0 1,725 0.40 2,225 0.35 NS NS 0.30
M–S 12.5 1,900 0.40 2,225 0.35 900 800 0.30
M–2 14.5 2,225 0.45 2,225 0.35 1,000 900 0.30
M–3 16.5 2,750 0.55 2,225 0.35 1,100 1,000 0.30
LD–1 3.0 550 0.10 NS 0.35 400 NS 0.30
LD–2 5.0 1,025 0.15 NS 0.35 550 NS 0.30
aFrom NPA (1993). Particleboard made with phenol-formaldehyde-based resins does not emit signifi- cant quantities of formaldehyde. Therefore, such products and other particleboard products made with resin without formaldehyde are not subject to formaldehyde emission conformance testing.bPanels designated as “exterior adhesive” must maintain 50% MOR after ASTM D1037 accelerated aging.cMOR = modulus of rupture; MOE = modulus of elasticity. NS = not specified. 1 MPa = 145 lb/in2; 1 N = 0.22 lb.dH = density > 800 kg/m3 (> 50 lb/ft3), M = density 640 to 800 kg/m3 (40 to 50 lb/ft3). LD = density < 640 kg/m3 (< 40 lb/ft3). Grade M–S refers to medium density; “special” grade added to standard after grades M–1, M–2, and M–3. Grade M–S falls between M–1 and M–2 in physical properties.
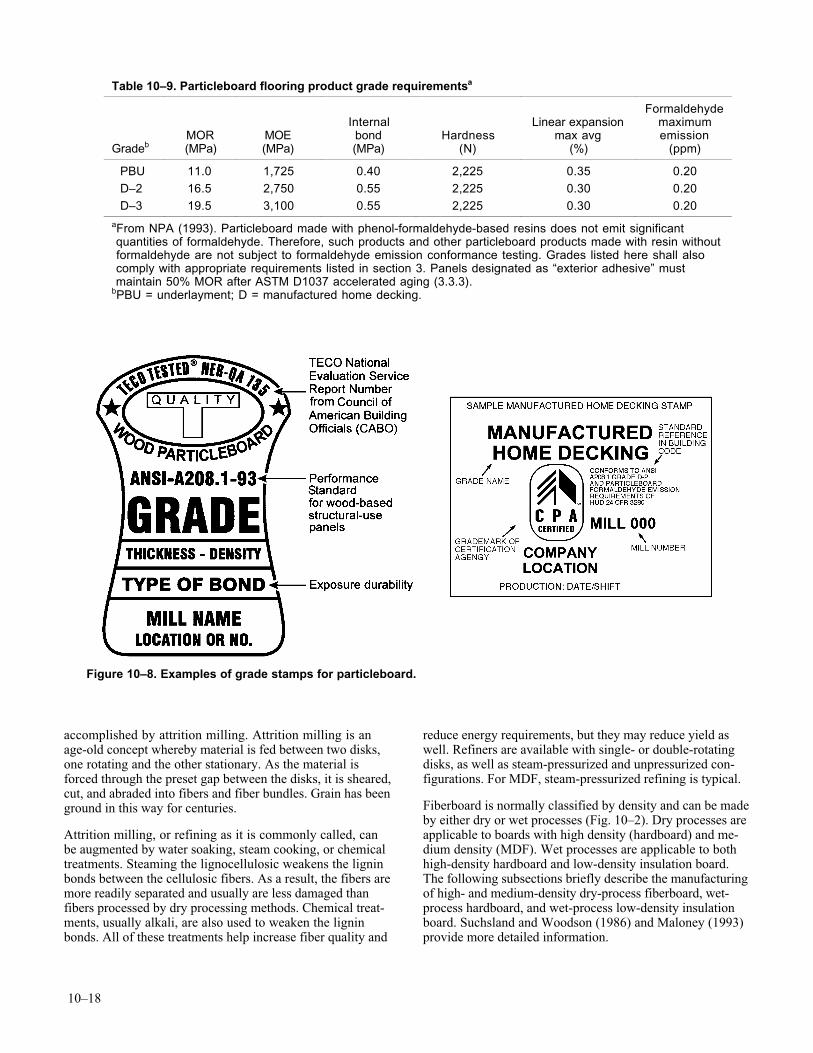
10–18
accomplished by attrition milling. Attrition milling is anage-old concept whereby material is fed between two disks,one rotating and the other stationary. As the material isforced through the preset gap between the disks, it is sheared,cut, and abraded into fibers and fiber bundles. Grain has beenground in this way for centuries.
Attrition milling, or refining as it is commonly called, canbe augmented by water soaking, steam cooking, or chemicaltreatments. Steaming the lignocellulosic weakens the ligninbonds between the cellulosic fibers. As a result, the fibers aremore readily separated and usually are less damaged thanfibers processed by dry processing methods. Chemical treat-ments, usually alkali, are also used to weaken the ligninbonds. All of these treatments help increase fiber quality and
reduce energy requirements, but they may reduce yield aswell. Refiners are available with single- or double-rotatingdisks, as well as steam-pressurized and unpressurized con-figurations. For MDF, steam-pressurized refining is typical.
Fiberboard is normally classified by density and can be madeby either dry or wet processes (Fig. 10–2). Dry processes areapplicable to boards with high density (hardboard) and me-dium density (MDF). Wet processes are applicable to bothhigh-density hardboard and low-density insulation board.The following subsections briefly describe the manufacturingof high- and medium-density dry-process fiberboard, wet-process hardboard, and wet-process low-density insulationboard. Suchsland and Woodson (1986) and Maloney (1993)provide more detailed information.
Table 10–9. Particleboard flooring product grade requirementsa
Formaldehyde
MOR MOEInternalbond Hardness
Linear expansionmax avg
maximumemission
Gradeb (MPa) (MPa) (MPa) (N) (%) (ppm)
PBU 11.0 1,725 0.40 2,225 0.35 0.20
D–2 16.5 2,750 0.55 2,225 0.30 0.20
D–3 19.5 3,100 0.55 2,225 0.30 0.20
aFrom NPA (1993). Particleboard made with phenol-formaldehyde-based resins does not emit significant quantities of formaldehyde. Therefore, such products and other particleboard products made with resin without formaldehyde are not subject to formaldehyde emission conformance testing. Grades listed here shall also comply with appropriate requirements listed in section 3. Panels designated as “exterior adhesive” must maintain 50% MOR after ASTM D1037 accelerated aging (3.3.3).bPBU = underlayment; D = manufactured home decking.
Figure 10–8. Examples of grade stamps for particleboard.
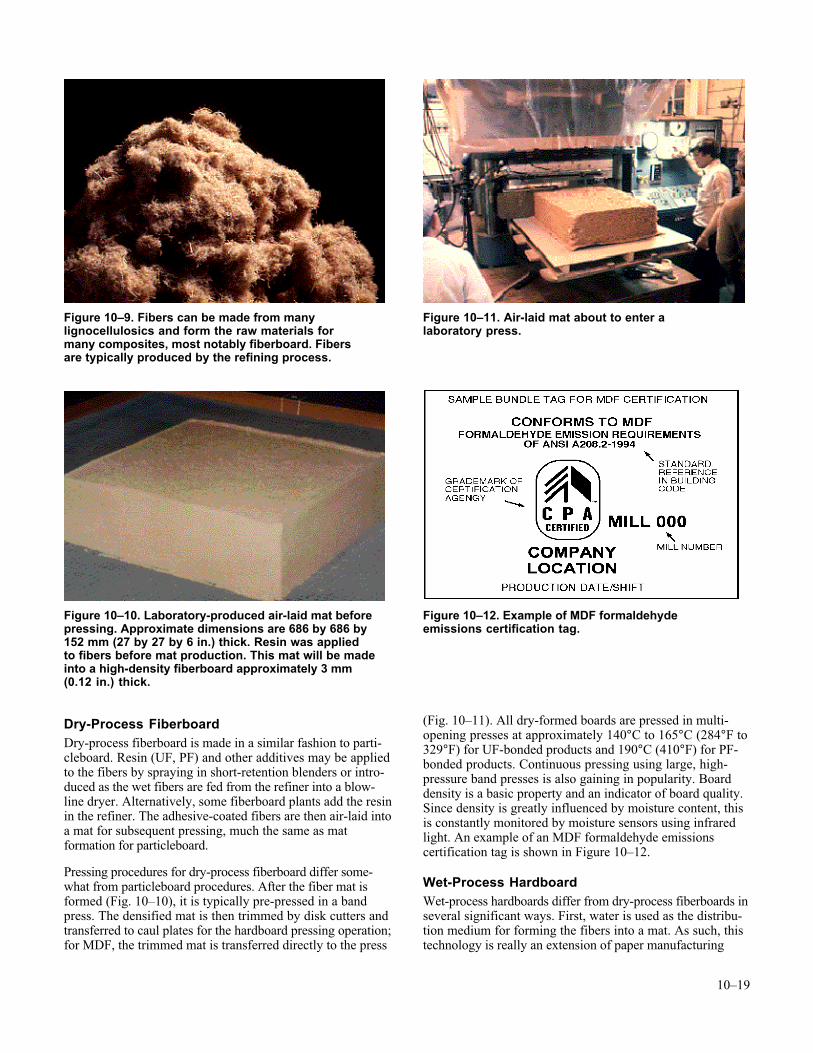
10–19
Dry-Process FiberboardDry-process fiberboard is made in a similar fashion to parti-cleboard. Resin (UF, PF) and other additives may be appliedto the fibers by spraying in short-retention blenders or intro-duced as the wet fibers are fed from the refiner into a blow-line dryer. Alternatively, some fiberboard plants add the resinin the refiner. The adhesive-coated fibers are then air-laid intoa mat for subsequent pressing, much the same as matformation for particleboard.
Pressing procedures for dry-process fiberboard differ some-what from particleboard procedures. After the fiber mat isformed (Fig. 10–10), it is typically pre-pressed in a bandpress. The densified mat is then trimmed by disk cutters andtransferred to caul plates for the hardboard pressing operation;for MDF, the trimmed mat is transferred directly to the press
(Fig. 10–11). All dry-formed boards are pressed in multi-opening presses at approximately 140°C to 165°C (284°F to329°F) for UF-bonded products and 190°C (410°F) for PF-bonded products. Continuous pressing using large, high-pressure band presses is also gaining in popularity. Boarddensity is a basic property and an indicator of board quality.Since density is greatly influenced by moisture content, thisis constantly monitored by moisture sensors using infraredlight. An example of an MDF formaldehyde emissionscertification tag is shown in Figure 10–12.
Wet-Process HardboardWet-process hardboards differ from dry-process fiberboards inseveral significant ways. First, water is used as the distribu-tion medium for forming the fibers into a mat. As such, thistechnology is really an extension of paper manufacturing
Figure 10–9. Fibers can be made from manylignocellulosics and form the raw materials formany composites, most notably fiberboard. Fibersare typically produced by the refining process.
Figure 10–10. Laboratory-produced air-laid mat beforepressing. Approximate dimensions are 686 by 686 by152 mm (27 by 27 by 6 in.) thick. Resin was appliedto fibers before mat production. This mat will be madeinto a high-density fiberboard approximately 3 mm(0.12 in.) thick.
Figure 10–11. Air-laid mat about to enter alaboratory press.
Figure 10–12. Example of MDF formaldehydeemissions certification tag.
10–20
technology. Secondly, some wet-process boards are madewithout additional binders. If the lignocellulosic containssufficient lignin and if lignin is retained during the refiningoperation, lignin can serve as the binder. Under heat andpressure, lignin will flow and act as a thermosetting adhe-sive, enhancing the naturally occurring hydrogen bonds.
Refining is an important step for developing strength in wet-process hardboards. The refining operation must also yield afiber of high “freeness;” that is, it must be easy to removewater from the fibrous mat. The mat is typically formed on aFourdrinier wire, like papermaking, or on cylinder formers.The wet process employs a continuously traveling meshscreen, onto which the soupy pulp flows rapidly andsmoothly. Water is drawn off through the screen and thenthrough a series of press rolls, which use a wringing actionto remove additional water.
Wet-process hardboards are pressed in multi-opening pressesheated by steam. The press cycle consists of three phases andlasts 6 to 15 min. The first phase is conducted at high pres-sure, and it removes most of the water while bringing theboard to the desired thickness. The primary purpose of thesecond phase is to remove water vapor. The final phase isrelatively short and results in the final cure. A maximumpressure of about 5 MPa (725 lb/in2) is used. Heat is essen-tial during pressing to induce fiber-to-fiber bond. A hightemperature of up to 210°C (410°F) is used to increase pro-duction by causing faster evaporation of the water. Lack ofsufficient moisture removal during pressing adversely affectsstrength and may result in “springback” or blistering.
Post-Treatment of Wet- andDry-Process HardboardSeveral treatments are used to increase the dimensionalstability and mechanical performance of hardboard. Heattreatment, tempering, and humidification may be done singu-larly or in conjunction with one another.
Heat treatment—exposure of pressed fiberboard to dry heat—improves dimensional stability and mechanical properties,reduces water adsorption, and improves interfiber bonding.
Tempering is the heat treatment of pressed boards, precededby the addition of oil. Tempering improves board surfacehardness and is sometimes done on various types of wet-formed hardboards. It also improves resistance to abrasion,scratching, scarring, and water. The most common oils usedinclude linseed oil, tung oil, and tall oil.
Humidification is the addition of water to bring the boardmoisture content into equilibrium with the air. Initially, apressed board has almost no moisture content. When theboard is exposed to air, it expands linearly by taking on 3%to 7% moisture. Continuous or progressive humidifiers arecommonly used for this purpose. Air of high humidity isforced through the stacks where it provides water vapor to theboards. The entire process is controlled by a dry-bulb-wet-bulb controller. Another method involves spraying water onthe back side of the board.
Insulation BoardInsulation boards are low-density, wet-laid panel productsused for insulation, sound deadening, carpet underlayment,and similar applications. In the manufacture of insulationboard, the need for refining and screening is a function of theraw material available, the equipment used, and the desiredend-product. Insulation boards typically do not use a binder,and they rely on hydrogen bonds to hold the board compo-nents together. Sizing agents are usually added to the furnish(about 1%) to provide the finished board with a modestdegree of water resistance and dimensional stability. Sizingagents include rosin, starch, paraffin, cumarone, resin,asphalt, and asphalt emulsions.
Like the manufacture of wet-process hardboard, insulationboard manufacture is a modification of papermaking. A thickfibrous sheet is made from a low-consistency pulp suspen-sion in a process known as wet felting. Felting can be ac-complished through use of a deckle box, Fourdrinier screen,or cylinder screen. A deckle box is a bottomless frame that isplaced over a screen. A measured amount of stock is put inthe box to form one sheet; vacuum is then applied to removemost of the water. The use of Fourdrinier screen for felting issimilar to that for papermaking, except that line speeds arereduced to 1.5 to 15 m/min (5 to 49 ft/min).
Insulation board is usually cold-pressed to remove most ofthe free water after the mat is formed. The wet mats are thendried to the final moisture content. Dryers may be a continu-ous tunnel or a multi-deck arrangement. The board is gener-ally dried in stages at temperatures ranging from 120°C to190°C (248°F to 374°F). Typically, about 2 to 4 h arerequired to reduce moisture content to about 1% to 3%.
After drying, some boards are treated for various applications.Boards may be given tongue-and-groove or shiplap edges orcan be grooved to produce a plank effect. Other boards arelaminated by means of asphalt to produce roof insulation.
Properties and Applications
Medium-Density Fiberboard—Minimum property re-quirements, as specified by the American National Standardfor MDF, A208.2 (NPA 1994) are given in Table 10–10.This standard is typically updated every 5 years or less. Thefurniture industry is by far the dominant MDF market. Me-dium-density fiberboard is frequently used in place of solidwood, plywood, and particleboard in many furniture applica-tions. It is also used for interior door skins, mouldings, andinterior trim components (Youngquist and others 1997).
Hardboard—Table 10–11 provides basic hardboard physi-cal properties (ANSI/AHA A135.4–1995 (AHA 1995a)) forselected products. The uses for hardboard can generally begrouped as construction, furniture and furnishings, cabinetand store work, appliances, and automotive and rollingstock. Typical hardboard products are prefinished paneling(ANSI/AHA A135.5–1995 (AHA 1995b)), house siding(ANSI/AHA A135.6–1990 (AHA 1990)), floor underlay-ment, and concrete form board. Table 10–12 shows physical
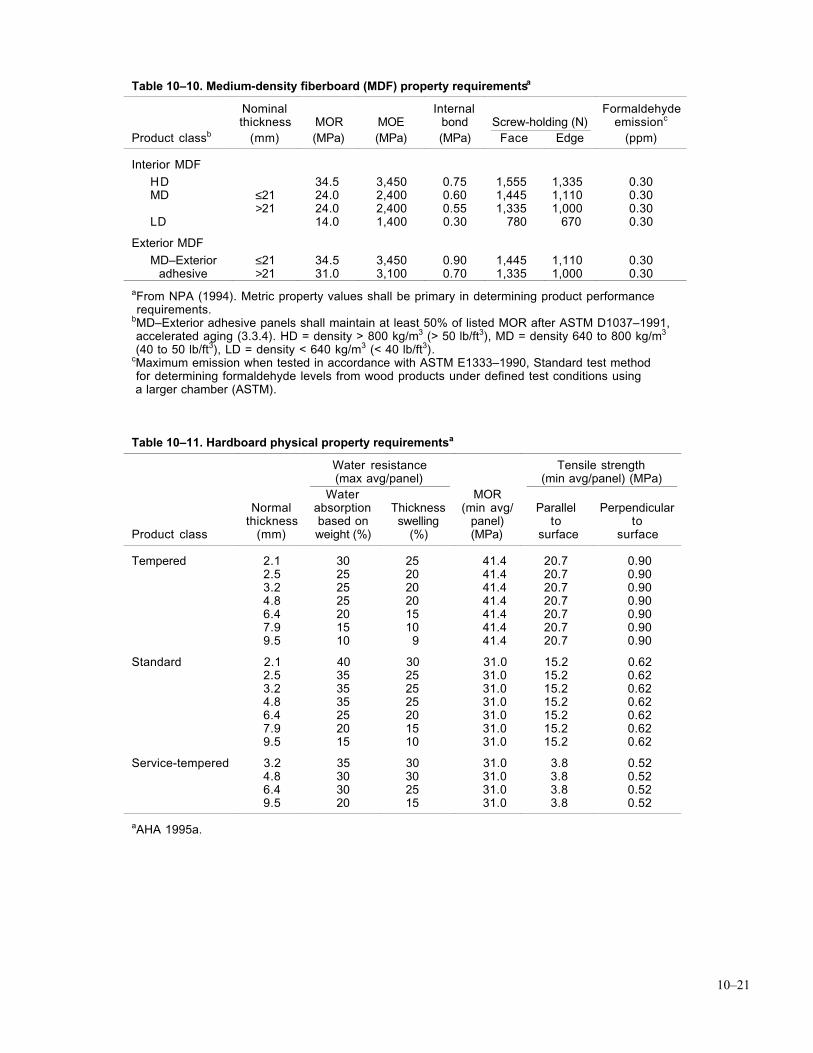
10–21
Table 10–10. Medium-density fiberboard (MDF) property requirementsa
Nominal Internal Formaldehydethickness MOR MOE bond Screw-holding (N) emissionc
Product classb (mm) (MPa) (MPa) (MPa) Face Edge (ppm)
Interior MDF
HD 34.5 3,450 0.75 1,555 1,335 0.30MD ≤21 24.0 2,400 0.60 1,445 1,110 0.30
>21 24.0 2,400 0.55 1,335 1,000 0.30LD 14.0 1,400 0.30 780 670 0.30
Exterior MDF
MD–Exterior adhesive
≤21>21
34.531.0
3,4503,100
0.900.70
1,4451,335
1,1101,000
0.300.30
aFrom NPA (1994). Metric property values shall be primary in determining product performance requirements.bMD–Exterior adhesive panels shall maintain at least 50% of listed MOR after ASTM D1037–1991, accelerated aging (3.3.4). HD = density > 800 kg/m3 (> 50 lb/ft3), MD = density 640 to 800 kg/m3
(40 to 50 lb/ft3), LD = density < 640 kg/m3 (< 40 lb/ft3).cMaximum emission when tested in accordance with ASTM E1333–1990, Standard test method for determining formaldehyde levels from wood products under defined test conditions using a larger chamber (ASTM).
Table 10–11. Hardboard physical property requirementsa
Water resistance(max avg/panel)
Tensile strength(min avg/panel) (MPa)
Product class
Normalthickness
(mm)
Waterabsorptionbased onweight (%)
Thicknessswelling
(%)
MOR(min avg/
panel)(MPa)
Parallelto
surface
Perpendicularto
surface
Tempered 2.1 30 25 41.4 20.7 0.902.5 25 20 41.4 20.7 0.903.2 25 20 41.4 20.7 0.904.8 25 20 41.4 20.7 0.906.4 20 15 41.4 20.7 0.907.9 15 10 41.4 20.7 0.909.5 10 9 41.4 20.7 0.90
Standard 2.1 40 30 31.0 15.2 0.622.5 35 25 31.0 15.2 0.623.2 35 25 31.0 15.2 0.624.8 35 25 31.0 15.2 0.626.4 25 20 31.0 15.2 0.627.9 20 15 31.0 15.2 0.629.5 15 10 31.0 15.2 0.62
Service-tempered 3.2 35 30 31.0 3.8 0.524.8 30 30 31.0 3.8 0.526.4 30 25 31.0 3.8 0.529.5 20 15 31.0 3.8 0.52
aAHA 1995a.
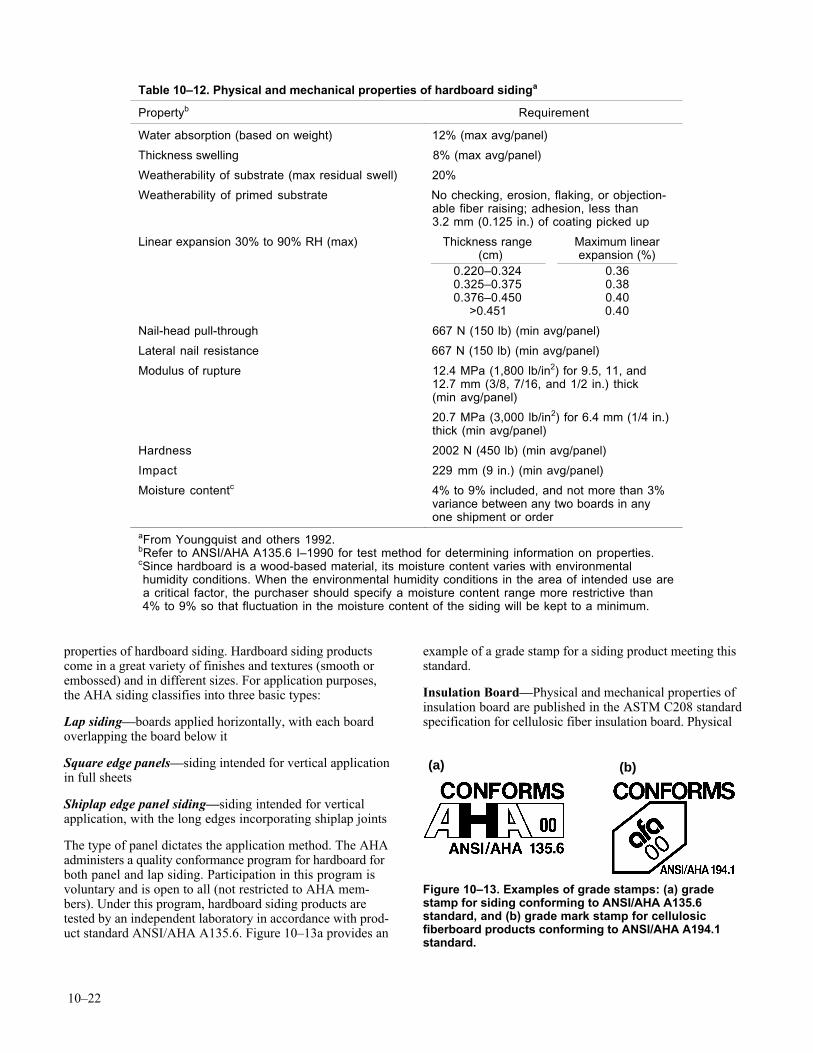
10–22
properties of hardboard siding. Hardboard siding productscome in a great variety of finishes and textures (smooth orembossed) and in different sizes. For application purposes,the AHA siding classifies into three basic types:
Lap siding—boards applied horizontally, with each boardoverlapping the board below it
Square edge panels—siding intended for vertical applicationin full sheets
Shiplap edge panel siding—siding intended for verticalapplication, with the long edges incorporating shiplap joints
The type of panel dictates the application method. The AHAadministers a quality conformance program for hardboard forboth panel and lap siding. Participation in this program isvoluntary and is open to all (not restricted to AHA mem-bers). Under this program, hardboard siding products aretested by an independent laboratory in accordance with prod-uct standard ANSI/AHA A135.6. Figure 10–13a provides an
example of a grade stamp for a siding product meeting thisstandard.
Insulation Board—Physical and mechanical properties ofinsulation board are published in the ASTM C208 standardspecification for cellulosic fiber insulation board. Physical
Table 10–12. Physical and mechanical properties of hardboard sidinga
Propertyb Requirement
Water absorption (based on weight) 12% (max avg/panel)
Thickness swelling 8% (max avg/panel)
Weatherability of substrate (max residual swell) 20%
Weatherability of primed substrate No checking, erosion, flaking, or objection-able fiber raising; adhesion, less than3.2 mm (0.125 in.) of coating picked up
Linear expansion 30% to 90% RH (max) Thickness range (cm)
Maximum linearexpansion (%)
0.220–0.324 0.360.325–0.375 0.380.376–0.450 0.40
>0.451 0.40
Nail-head pull-through 667 N (150 lb) (min avg/panel)
Lateral nail resistance 667 N (150 lb) (min avg/panel)
Modulus of rupture 12.4 MPa (1,800 lb/in2) for 9.5, 11, and12.7 mm (3/8, 7/16, and 1/2 in.) thick(min avg/panel)
20.7 MPa (3,000 lb/in2) for 6.4 mm (1/4 in.)thick (min avg/panel)
Hardness 2002 N (450 lb) (min avg/panel)
Impact 229 mm (9 in.) (min avg/panel)
Moisture contentc 4% to 9% included, and not more than 3%variance between any two boards in anyone shipment or order
aFrom Youngquist and others 1992.bRefer to ANSI/AHA A135.6 I–1990 for test method for determining information on properties.cSince hardboard is a wood-based material, its moisture content varies with environmental humidity conditions. When the environmental humidity conditions in the area of intended use are a critical factor, the purchaser should specify a moisture content range more restrictive than 4% to 9% so that fluctuation in the moisture content of the siding will be kept to a minimum.
(a) (b)
Figure 10–13. Examples of grade stamps: (a) gradestamp for siding conforming to ANSI/AHA A135.6standard, and (b) grade mark stamp for cellulosicfiberboard products conforming to ANSI/AHA A194.1standard.
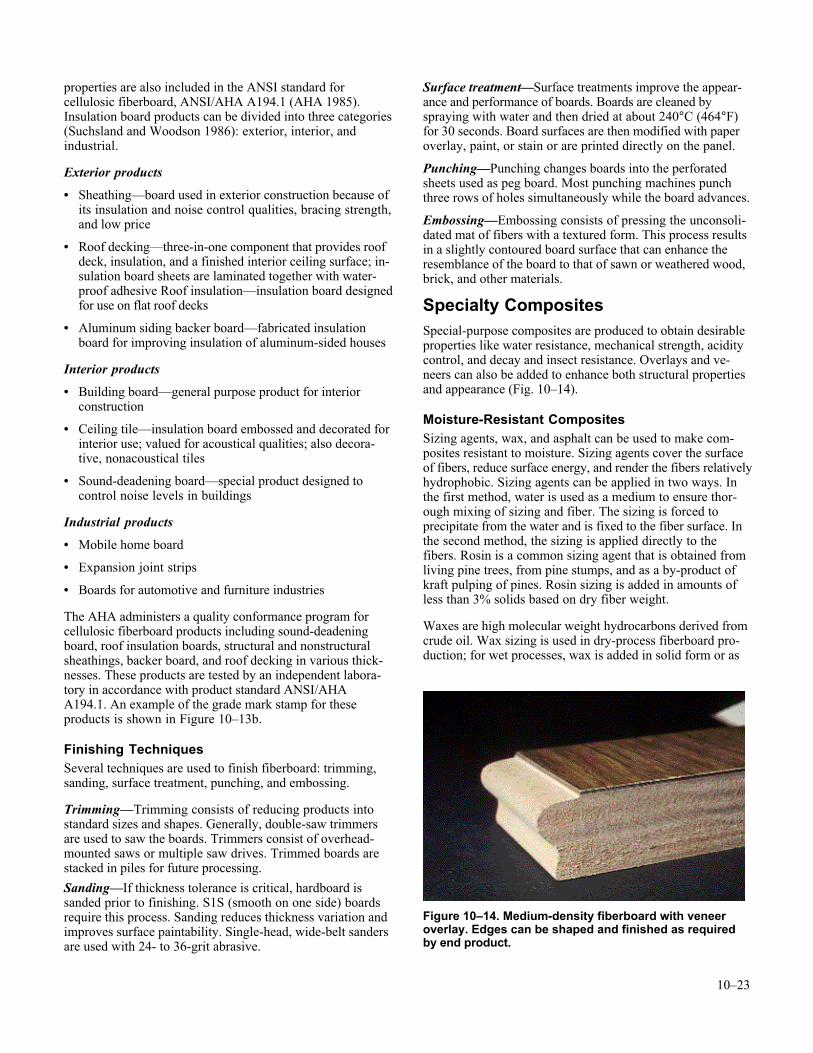
10–23
properties are also included in the ANSI standard forcellulosic fiberboard, ANSI/AHA A194.1 (AHA 1985).Insulation board products can be divided into three categories(Suchsland and Woodson 1986): exterior, interior, andindustrial.
Exterior products
• Sheathing—board used in exterior construction because ofits insulation and noise control qualities, bracing strength,and low price
• Roof decking—three-in-one component that provides roofdeck, insulation, and a finished interior ceiling surface; in-sulation board sheets are laminated together with water-proof adhesive Roof insulation—insulation board designedfor use on flat roof decks
• Aluminum siding backer board—fabricated insulationboard for improving insulation of aluminum-sided houses
Interior products
• Building board—general purpose product for interiorconstruction
• Ceiling tile—insulation board embossed and decorated forinterior use; valued for acoustical qualities; also decora-tive, nonacoustical tiles
• Sound-deadening board—special product designed tocontrol noise levels in buildings
Industrial products
• Mobile home board
• Expansion joint strips
• Boards for automotive and furniture industries
The AHA administers a quality conformance program forcellulosic fiberboard products including sound-deadeningboard, roof insulation boards, structural and nonstructuralsheathings, backer board, and roof decking in various thick-nesses. These products are tested by an independent labora-tory in accordance with product standard ANSI/AHAA194.1. An example of the grade mark stamp for theseproducts is shown in Figure 10–13b.
Finishing TechniquesSeveral techniques are used to finish fiberboard: trimming,sanding, surface treatment, punching, and embossing.
Trimming—Trimming consists of reducing products intostandard sizes and shapes. Generally, double-saw trimmersare used to saw the boards. Trimmers consist of overhead-mounted saws or multiple saw drives. Trimmed boards arestacked in piles for future processing.
Sanding—If thickness tolerance is critical, hardboard issanded prior to finishing. S1S (smooth on one side) boardsrequire this process. Sanding reduces thickness variation andimproves surface paintability. Single-head, wide-belt sandersare used with 24- to 36-grit abrasive.
Surface treatment—Surface treatments improve the appear-ance and performance of boards. Boards are cleaned byspraying with water and then dried at about 240°C (464°F)for 30 seconds. Board surfaces are then modified with paperoverlay, paint, or stain or are printed directly on the panel.
Punching—Punching changes boards into the perforatedsheets used as peg board. Most punching machines punchthree rows of holes simultaneously while the board advances.
Embossing—Embossing consists of pressing the unconsoli-dated mat of fibers with a textured form. This process resultsin a slightly contoured board surface that can enhance theresemblance of the board to that of sawn or weathered wood,brick, and other materials.
Specialty CompositesSpecial-purpose composites are produced to obtain desirableproperties like water resistance, mechanical strength, aciditycontrol, and decay and insect resistance. Overlays and ve-neers can also be added to enhance both structural propertiesand appearance (Fig. 10–14).
Moisture-Resistant CompositesSizing agents, wax, and asphalt can be used to make com-posites resistant to moisture. Sizing agents cover the surfaceof fibers, reduce surface energy, and render the fibers relativelyhydrophobic. Sizing agents can be applied in two ways. Inthe first method, water is used as a medium to ensure thor-ough mixing of sizing and fiber. The sizing is forced toprecipitate from the water and is fixed to the fiber surface. Inthe second method, the sizing is applied directly to thefibers. Rosin is a common sizing agent that is obtained fromliving pine trees, from pine stumps, and as a by-product ofkraft pulping of pines. Rosin sizing is added in amounts ofless than 3% solids based on dry fiber weight.
Waxes are high molecular weight hydrocarbons derived fromcrude oil. Wax sizing is used in dry-process fiberboard pro-duction; for wet processes, wax is added in solid form or as
Figure 10–14. Medium-density fiberboard with veneeroverlay. Edges can be shaped and finished as requiredby end product.
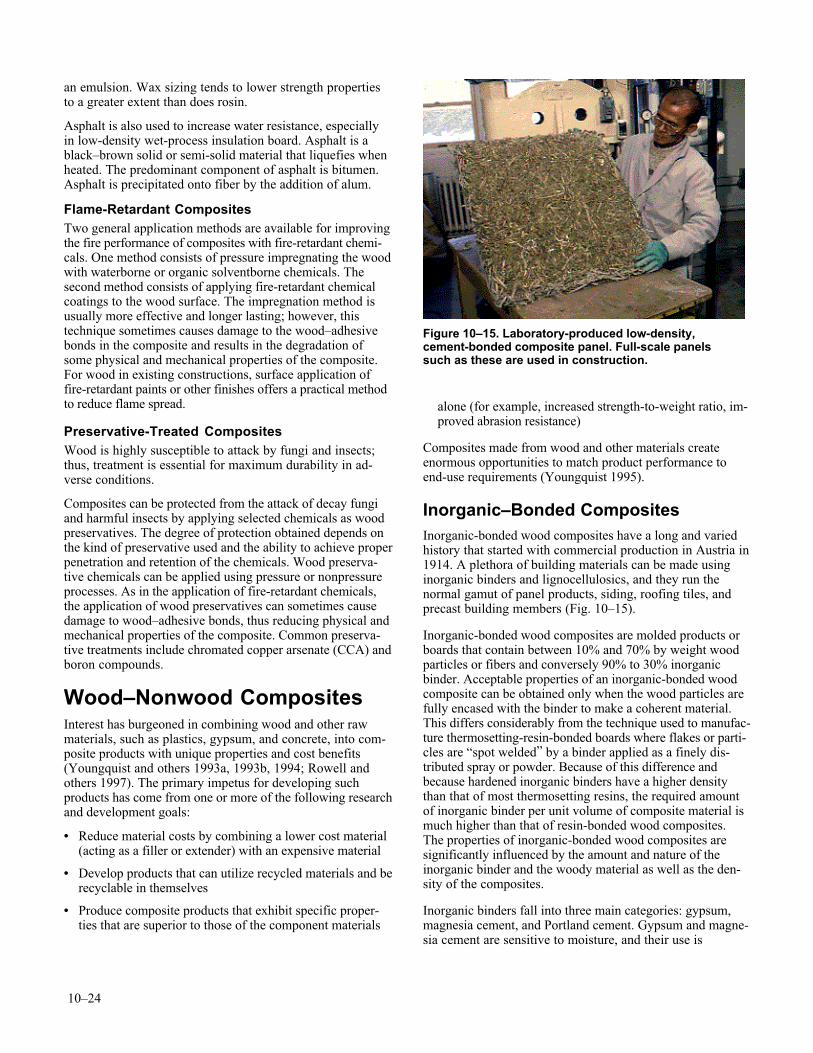
10–24
an emulsion. Wax sizing tends to lower strength propertiesto a greater extent than does rosin.
Asphalt is also used to increase water resistance, especiallyin low-density wet-process insulation board. Asphalt is ablack–brown solid or semi-solid material that liquefies whenheated. The predominant component of asphalt is bitumen.Asphalt is precipitated onto fiber by the addition of alum.
Flame-Retardant CompositesTwo general application methods are available for improvingthe fire performance of composites with fire-retardant chemi-cals. One method consists of pressure impregnating the woodwith waterborne or organic solventborne chemicals. Thesecond method consists of applying fire-retardant chemicalcoatings to the wood surface. The impregnation method isusually more effective and longer lasting; however, thistechnique sometimes causes damage to the wood–adhesivebonds in the composite and results in the degradation ofsome physical and mechanical properties of the composite.For wood in existing constructions, surface application offire-retardant paints or other finishes offers a practical methodto reduce flame spread.
Preservative-Treated CompositesWood is highly susceptible to attack by fungi and insects;thus, treatment is essential for maximum durability in ad-verse conditions.
Composites can be protected from the attack of decay fungiand harmful insects by applying selected chemicals as woodpreservatives. The degree of protection obtained depends onthe kind of preservative used and the ability to achieve properpenetration and retention of the chemicals. Wood preserva-tive chemicals can be applied using pressure or nonpressureprocesses. As in the application of fire-retardant chemicals,the application of wood preservatives can sometimes causedamage to wood–adhesive bonds, thus reducing physical andmechanical properties of the composite. Common preserva-tive treatments include chromated copper arsenate (CCA) andboron compounds.
Wood–Nonwood CompositesInterest has burgeoned in combining wood and other rawmaterials, such as plastics, gypsum, and concrete, into com-posite products with unique properties and cost benefits(Youngquist and others 1993a, 1993b, 1994; Rowell andothers 1997). The primary impetus for developing suchproducts has come from one or more of the following researchand development goals:
• Reduce material costs by combining a lower cost material(acting as a filler or extender) with an expensive material
• Develop products that can utilize recycled materials and berecyclable in themselves
• Produce composite products that exhibit specific proper-ties that are superior to those of the component materials
alone (for example, increased strength-to-weight ratio, im-proved abrasion resistance)
Composites made from wood and other materials createenormous opportunities to match product performance toend-use requirements (Youngquist 1995).
Inorganic–Bonded CompositesInorganic-bonded wood composites have a long and variedhistory that started with commercial production in Austria in1914. A plethora of building materials can be made usinginorganic binders and lignocellulosics, and they run thenormal gamut of panel products, siding, roofing tiles, andprecast building members (Fig. 10–15).
Inorganic-bonded wood composites are molded products orboards that contain between 10% and 70% by weight woodparticles or fibers and conversely 90% to 30% inorganicbinder. Acceptable properties of an inorganic-bonded woodcomposite can be obtained only when the wood particles arefully encased with the binder to make a coherent material.This differs considerably from the technique used to manufac-ture thermosetting-resin-bonded boards where flakes or parti-cles are “spot welded” by a binder applied as a finely dis-tributed spray or powder. Because of this difference andbecause hardened inorganic binders have a higher densitythan that of most thermosetting resins, the required amountof inorganic binder per unit volume of composite material ismuch higher than that of resin-bonded wood composites.The properties of inorganic-bonded wood composites aresignificantly influenced by the amount and nature of theinorganic binder and the woody material as well as the den-sity of the composites.
Inorganic binders fall into three main categories: gypsum,magnesia cement, and Portland cement. Gypsum and magne-sia cement are sensitive to moisture, and their use is
Figure 10–15. Laboratory-produced low-density,cement-bonded composite panel. Full-scale panelssuch as these are used in construction.
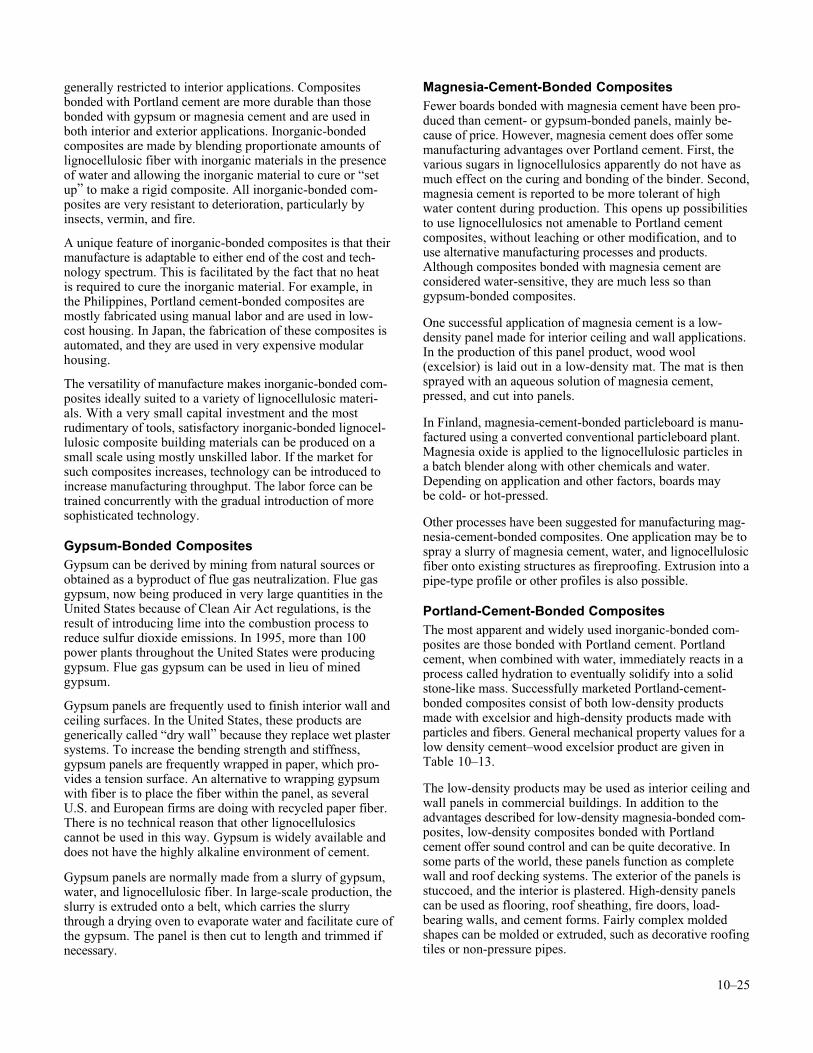
10–25
generally restricted to interior applications. Compositesbonded with Portland cement are more durable than thosebonded with gypsum or magnesia cement and are used inboth interior and exterior applications. Inorganic-bondedcomposites are made by blending proportionate amounts oflignocellulosic fiber with inorganic materials in the presenceof water and allowing the inorganic material to cure or “setup” to make a rigid composite. All inorganic-bonded com-posites are very resistant to deterioration, particularly byinsects, vermin, and fire.
A unique feature of inorganic-bonded composites is that theirmanufacture is adaptable to either end of the cost and tech-nology spectrum. This is facilitated by the fact that no heatis required to cure the inorganic material. For example, inthe Philippines, Portland cement-bonded composites aremostly fabricated using manual labor and are used in low-cost housing. In Japan, the fabrication of these composites isautomated, and they are used in very expensive modularhousing.
The versatility of manufacture makes inorganic-bonded com-posites ideally suited to a variety of lignocellulosic materi-als. With a very small capital investment and the mostrudimentary of tools, satisfactory inorganic-bonded lignocel-lulosic composite building materials can be produced on asmall scale using mostly unskilled labor. If the market forsuch composites increases, technology can be introduced toincrease manufacturing throughput. The labor force can betrained concurrently with the gradual introduction of moresophisticated technology.
Gypsum-Bonded CompositesGypsum can be derived by mining from natural sources orobtained as a byproduct of flue gas neutralization. Flue gasgypsum, now being produced in very large quantities in theUnited States because of Clean Air Act regulations, is theresult of introducing lime into the combustion process toreduce sulfur dioxide emissions. In 1995, more than 100power plants throughout the United States were producinggypsum. Flue gas gypsum can be used in lieu of minedgypsum.
Gypsum panels are frequently used to finish interior wall andceiling surfaces. In the United States, these products aregenerically called “dry wall” because they replace wet plastersystems. To increase the bending strength and stiffness,gypsum panels are frequently wrapped in paper, which pro-vides a tension surface. An alternative to wrapping gypsumwith fiber is to place the fiber within the panel, as severalU.S. and European firms are doing with recycled paper fiber.There is no technical reason that other lignocellulosicscannot be used in this way. Gypsum is widely available anddoes not have the highly alkaline environment of cement.
Gypsum panels are normally made from a slurry of gypsum,water, and lignocellulosic fiber. In large-scale production, theslurry is extruded onto a belt, which carries the slurrythrough a drying oven to evaporate water and facilitate cure ofthe gypsum. The panel is then cut to length and trimmed ifnecessary.
Magnesia-Cement-Bonded CompositesFewer boards bonded with magnesia cement have been pro-duced than cement- or gypsum-bonded panels, mainly be-cause of price. However, magnesia cement does offer somemanufacturing advantages over Portland cement. First, thevarious sugars in lignocellulosics apparently do not have asmuch effect on the curing and bonding of the binder. Second,magnesia cement is reported to be more tolerant of highwater content during production. This opens up possibilitiesto use lignocellulosics not amenable to Portland cementcomposites, without leaching or other modification, and touse alternative manufacturing processes and products.Although composites bonded with magnesia cement areconsidered water-sensitive, they are much less so thangypsum-bonded composites.
One successful application of magnesia cement is a low-density panel made for interior ceiling and wall applications.In the production of this panel product, wood wool(excelsior) is laid out in a low-density mat. The mat is thensprayed with an aqueous solution of magnesia cement,pressed, and cut into panels.
In Finland, magnesia-cement-bonded particleboard is manu-factured using a converted conventional particleboard plant.Magnesia oxide is applied to the lignocellulosic particles ina batch blender along with other chemicals and water.Depending on application and other factors, boards maybe cold- or hot-pressed.
Other processes have been suggested for manufacturing mag-nesia-cement-bonded composites. One application may be tospray a slurry of magnesia cement, water, and lignocellulosicfiber onto existing structures as fireproofing. Extrusion into apipe-type profile or other profiles is also possible.
Portland-Cement-Bonded CompositesThe most apparent and widely used inorganic-bonded com-posites are those bonded with Portland cement. Portlandcement, when combined with water, immediately reacts in aprocess called hydration to eventually solidify into a solidstone-like mass. Successfully marketed Portland-cement-bonded composites consist of both low-density productsmade with excelsior and high-density products made withparticles and fibers. General mechanical property values for alow density cement–wood excelsior product are given inTable 10–13.
The low-density products may be used as interior ceiling andwall panels in commercial buildings. In addition to theadvantages described for low-density magnesia-bonded com-posites, low-density composites bonded with Portlandcement offer sound control and can be quite decorative. Insome parts of the world, these panels function as completewall and roof decking systems. The exterior of the panels isstuccoed, and the interior is plastered. High-density panelscan be used as flooring, roof sheathing, fire doors, load-bearing walls, and cement forms. Fairly complex moldedshapes can be molded or extruded, such as decorative roofingtiles or non-pressure pipes.
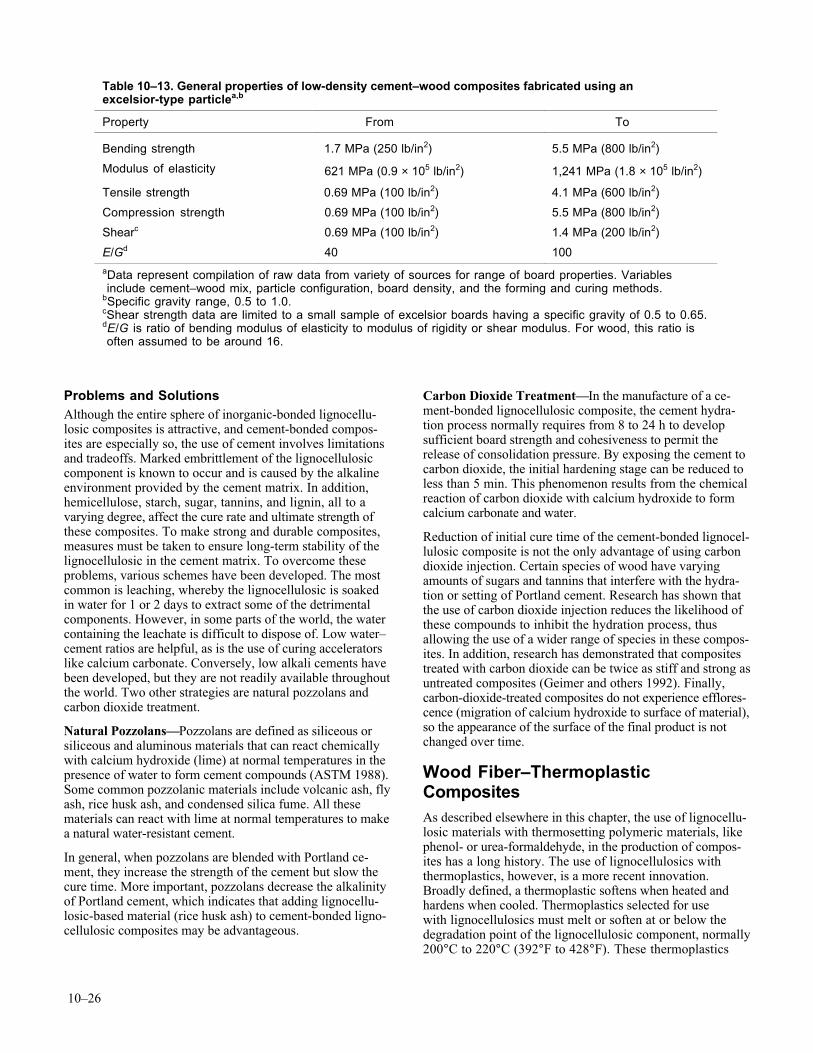
10–26
Problems and SolutionsAlthough the entire sphere of inorganic-bonded lignocellu-losic composites is attractive, and cement-bonded compos-ites are especially so, the use of cement involves limitationsand tradeoffs. Marked embrittlement of the lignocellulosiccomponent is known to occur and is caused by the alkalineenvironment provided by the cement matrix. In addition,hemicellulose, starch, sugar, tannins, and lignin, all to avarying degree, affect the cure rate and ultimate strength ofthese composites. To make strong and durable composites,measures must be taken to ensure long-term stability of thelignocellulosic in the cement matrix. To overcome theseproblems, various schemes have been developed. The mostcommon is leaching, whereby the lignocellulosic is soakedin water for 1 or 2 days to extract some of the detrimentalcomponents. However, in some parts of the world, the watercontaining the leachate is difficult to dispose of. Low water–cement ratios are helpful, as is the use of curing acceleratorslike calcium carbonate. Conversely, low alkali cements havebeen developed, but they are not readily available throughoutthe world. Two other strategies are natural pozzolans andcarbon dioxide treatment.
Natural Pozzolans—Pozzolans are defined as siliceous orsiliceous and aluminous materials that can react chemicallywith calcium hydroxide (lime) at normal temperatures in thepresence of water to form cement compounds (ASTM 1988).Some common pozzolanic materials include volcanic ash, flyash, rice husk ash, and condensed silica fume. All thesematerials can react with lime at normal temperatures to makea natural water-resistant cement.
In general, when pozzolans are blended with Portland ce-ment, they increase the strength of the cement but slow thecure time. More important, pozzolans decrease the alkalinityof Portland cement, which indicates that adding lignocellu-losic-based material (rice husk ash) to cement-bonded ligno-cellulosic composites may be advantageous.
Carbon Dioxide Treatment—In the manufacture of a ce-ment-bonded lignocellulosic composite, the cement hydra-tion process normally requires from 8 to 24 h to developsufficient board strength and cohesiveness to permit therelease of consolidation pressure. By exposing the cement tocarbon dioxide, the initial hardening stage can be reduced toless than 5 min. This phenomenon results from the chemicalreaction of carbon dioxide with calcium hydroxide to formcalcium carbonate and water.
Reduction of initial cure time of the cement-bonded lignocel-lulosic composite is not the only advantage of using carbondioxide injection. Certain species of wood have varyingamounts of sugars and tannins that interfere with the hydra-tion or setting of Portland cement. Research has shown thatthe use of carbon dioxide injection reduces the likelihood ofthese compounds to inhibit the hydration process, thusallowing the use of a wider range of species in these compos-ites. In addition, research has demonstrated that compositestreated with carbon dioxide can be twice as stiff and strong asuntreated composites (Geimer and others 1992). Finally,carbon-dioxide-treated composites do not experience efflores-cence (migration of calcium hydroxide to surface of material),so the appearance of the surface of the final product is notchanged over time.
Wood Fiber–ThermoplasticCompositesAs described elsewhere in this chapter, the use of lignocellu-losic materials with thermosetting polymeric materials, likephenol- or urea-formaldehyde, in the production of compos-ites has a long history. The use of lignocellulosics withthermoplastics, however, is a more recent innovation.Broadly defined, a thermoplastic softens when heated andhardens when cooled. Thermoplastics selected for usewith lignocellulosics must melt or soften at or below thedegradation point of the lignocellulosic component, normally200°C to 220°C (392°F to 428°F). These thermoplastics
Table 10–13. General properties of low-density cement–wood composites fabricated using anexcelsior-type particlea,b
Property From To
Bending strength 1.7 MPa (250 lb/in2) 5.5 MPa (800 lb/in2)
Modulus of elasticity 621 MPa (0.9 × 10⁵ lb/in2) 1,241 MPa (1.8 × 10⁵ lb/in2)
Tensile strength 0.69 MPa (100 lb/in2) 4.1 MPa (600 lb/in2)
Compression strength 0.69 MPa (100 lb/in2) 5.5 MPa (800 lb/in2)
Shearc 0.69 MPa (100 lb/in2) 1.4 MPa (200 lb/in2)
E/Gd 40 100
aData represent compilation of raw data from variety of sources for range of board properties. Variables include cement–wood mix, particle configuration, board density, and the forming and curing methods.bSpecific gravity range, 0.5 to 1.0.cShear strength data are limited to a small sample of excelsior boards having a specific gravity of 0.5 to 0.65.dE/G is ratio of bending modulus of elasticity to modulus of rigidity or shear modulus. For wood, this ratio is often assumed to be around 16.
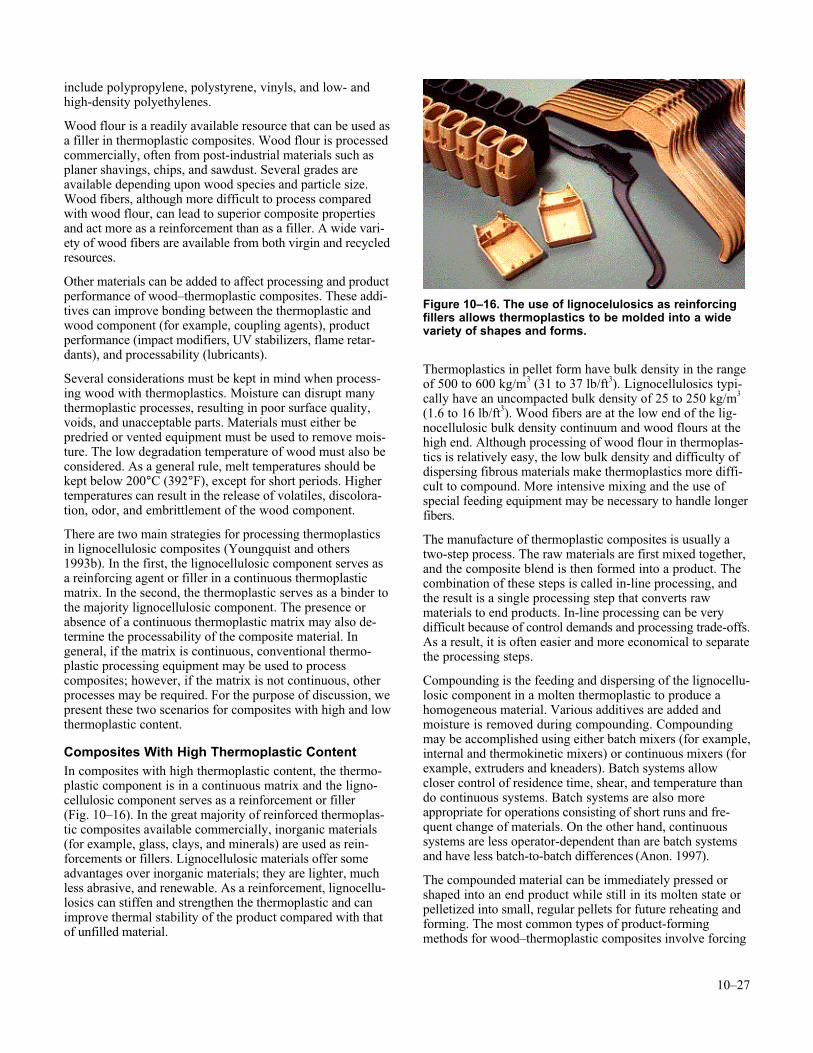
10–27
include polypropylene, polystyrene, vinyls, and low- andhigh-density polyethylenes.
Wood flour is a readily available resource that can be used asa filler in thermoplastic composites. Wood flour is processedcommercially, often from post-industrial materials such asplaner shavings, chips, and sawdust. Several grades areavailable depending upon wood species and particle size.Wood fibers, although more difficult to process comparedwith wood flour, can lead to superior composite propertiesand act more as a reinforcement than as a filler. A wide vari-ety of wood fibers are available from both virgin and recycledresources.
Other materials can be added to affect processing and productperformance of wood–thermoplastic composites. These addi-tives can improve bonding between the thermoplastic andwood component (for example, coupling agents), productperformance (impact modifiers, UV stabilizers, flame retar-dants), and processability (lubricants).
Several considerations must be kept in mind when process-ing wood with thermoplastics. Moisture can disrupt manythermoplastic processes, resulting in poor surface quality,voids, and unacceptable parts. Materials must either bepredried or vented equipment must be used to remove mois-ture. The low degradation temperature of wood must also beconsidered. As a general rule, melt temperatures should bekept below 200°C (392°F), except for short periods. Highertemperatures can result in the release of volatiles, discolora-tion, odor, and embrittlement of the wood component.
There are two main strategies for processing thermoplasticsin lignocellulosic composites (Youngquist and others1993b). In the first, the lignocellulosic component serves asa reinforcing agent or filler in a continuous thermoplasticmatrix. In the second, the thermoplastic serves as a binder tothe majority lignocellulosic component. The presence orabsence of a continuous thermoplastic matrix may also de-termine the processability of the composite material. Ingeneral, if the matrix is continuous, conventional thermo-plastic processing equipment may be used to processcomposites; however, if the matrix is not continuous, otherprocesses may be required. For the purpose of discussion, wepresent these two scenarios for composites with high and lowthermoplastic content.
Composites With High Thermoplastic ContentIn composites with high thermoplastic content, the thermo-plastic component is in a continuous matrix and the ligno-cellulosic component serves as a reinforcement or filler(Fig. 10–16). In the great majority of reinforced thermoplas-tic composites available commercially, inorganic materials(for example, glass, clays, and minerals) are used as rein-forcements or fillers. Lignocellulosic materials offer someadvantages over inorganic materials; they are lighter, muchless abrasive, and renewable. As a reinforcement, lignocellu-losics can stiffen and strengthen the thermoplastic and canimprove thermal stability of the product compared with thatof unfilled material.
Thermoplastics in pellet form have bulk density in the rangeof 500 to 600 kg/m3 (31 to 37 lb/ft3). Lignocellulosics typi-cally have an uncompacted bulk density of 25 to 250 kg/m3
(1.6 to 16 lb/ft3). Wood fibers are at the low end of the lig-nocellulosic bulk density continuum and wood flours at thehigh end. Although processing of wood flour in thermoplas-tics is relatively easy, the low bulk density and difficulty ofdispersing fibrous materials make thermoplastics more diffi-cult to compound. More intensive mixing and the use ofspecial feeding equipment may be necessary to handle longerfibers.
The manufacture of thermoplastic composites is usually atwo-step process. The raw materials are first mixed together,and the composite blend is then formed into a product. Thecombination of these steps is called in-line processing, andthe result is a single processing step that converts rawmaterials to end products. In-line processing can be verydifficult because of control demands and processing trade-offs.As a result, it is often easier and more economical to separatethe processing steps.
Compounding is the feeding and dispersing of the lignocellu-losic component in a molten thermoplastic to produce ahomogeneous material. Various additives are added andmoisture is removed during compounding. Compoundingmay be accomplished using either batch mixers (for example,internal and thermokinetic mixers) or continuous mixers (forexample, extruders and kneaders). Batch systems allowcloser control of residence time, shear, and temperature thando continuous systems. Batch systems are also moreappropriate for operations consisting of short runs and fre-quent change of materials. On the other hand, continuoussystems are less operator-dependent than are batch systemsand have less batch-to-batch differences (Anon. 1997).
The compounded material can be immediately pressed orshaped into an end product while still in its molten state orpelletized into small, regular pellets for future reheating andforming. The most common types of product-formingmethods for wood–thermoplastic composites involve forcing
Figure 10–16. The use of lignocelulosics as reinforcingfillers allows thermoplastics to be molded into a widevariety of shapes and forms.
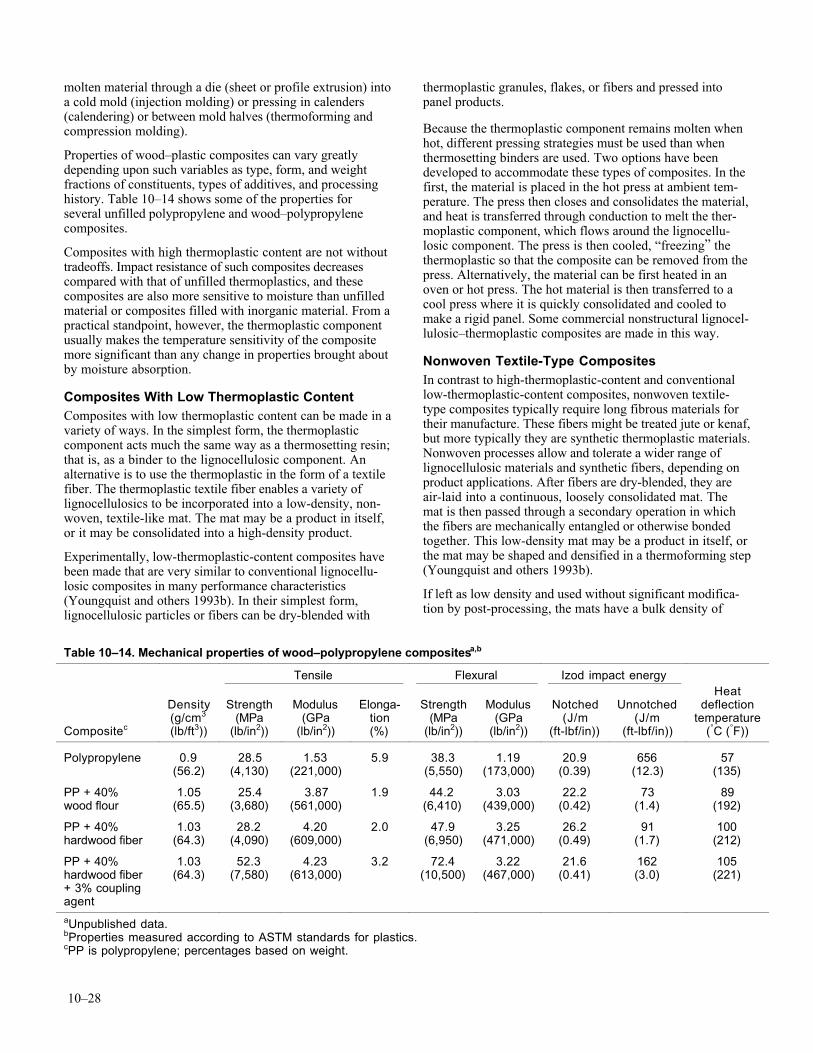
10–28
molten material through a die (sheet or profile extrusion) intoa cold mold (injection molding) or pressing in calenders(calendering) or between mold halves (thermoforming andcompression molding).
Properties of wood–plastic composites can vary greatlydepending upon such variables as type, form, and weightfractions of constituents, types of additives, and processinghistory. Table 10–14 shows some of the properties forseveral unfilled polypropylene and wood–polypropylenecomposites.
Composites with high thermoplastic content are not withouttradeoffs. Impact resistance of such composites decreasescompared with that of unfilled thermoplastics, and thesecomposites are also more sensitive to moisture than unfilledmaterial or composites filled with inorganic material. From apractical standpoint, however, the thermoplastic componentusually makes the temperature sensitivity of the compositemore significant than any change in properties brought aboutby moisture absorption.
Composites With Low Thermoplastic ContentComposites with low thermoplastic content can be made in avariety of ways. In the simplest form, the thermoplasticcomponent acts much the same way as a thermosetting resin;that is, as a binder to the lignocellulosic component. Analternative is to use the thermoplastic in the form of a textilefiber. The thermoplastic textile fiber enables a variety oflignocellulosics to be incorporated into a low-density, non-woven, textile-like mat. The mat may be a product in itself,or it may be consolidated into a high-density product.
Experimentally, low-thermoplastic-content composites havebeen made that are very similar to conventional lignocellu-losic composites in many performance characteristics(Youngquist and others 1993b). In their simplest form,lignocellulosic particles or fibers can be dry-blended with
thermoplastic granules, flakes, or fibers and pressed intopanel products.
Because the thermoplastic component remains molten whenhot, different pressing strategies must be used than whenthermosetting binders are used. Two options have beendeveloped to accommodate these types of composites. In thefirst, the material is placed in the hot press at ambient tem-perature. The press then closes and consolidates the material,and heat is transferred through conduction to melt the ther-moplastic component, which flows around the lignocellu-losic component. The press is then cooled, “freezing” thethermoplastic so that the composite can be removed from thepress. Alternatively, the material can be first heated in anoven or hot press. The hot material is then transferred to acool press where it is quickly consolidated and cooled tomake a rigid panel. Some commercial nonstructural lignocel-lulosic–thermoplastic composites are made in this way.
Nonwoven Textile-Type CompositesIn contrast to high-thermoplastic-content and conventionallow-thermoplastic-content composites, nonwoven textile-type composites typically require long fibrous materials fortheir manufacture. These fibers might be treated jute or kenaf,but more typically they are synthetic thermoplastic materials.Nonwoven processes allow and tolerate a wider range oflignocellulosic materials and synthetic fibers, depending onproduct applications. After fibers are dry-blended, they areair-laid into a continuous, loosely consolidated mat. Themat is then passed through a secondary operation in whichthe fibers are mechanically entangled or otherwise bondedtogether. This low-density mat may be a product in itself, orthe mat may be shaped and densified in a thermoforming step(Youngquist and others 1993b).
If left as low density and used without significant modifica-tion by post-processing, the mats have a bulk density of
Table 10–14. Mechanical properties of wood–polypropylene compositesa,b
Tensile Flexural Izod impact energy
Compositec
Density(g/cm3
(lb/ft3))
Strength(MPa
(lb/in2))
Modulus(GPa
(lb/in2))
Elonga-tion(%)
Strength(MPa
(lb/in2))
Modulus(GPa
(lb/in2))
Notched(J/m
(ft-lbf/in))
Unnotched(J/m
(ft-lbf/in))
Heatdeflection
temperature(°C (°F))
Polypropylene 0.9(56.2)
28.5(4,130)
1.53(221,000)
5.9 38.3(5,550)
1.19(173,000)
20.9(0.39)
656(12.3)
57(135)
PP + 40%wood flour
1.05(65.5)
25.4(3,680)
3.87(561,000)
1.9 44.2(6,410)
3.03(439,000)
22.2(0.42)
73(1.4)
89(192)
PP + 40%hardwood fiber
1.03(64.3)
28.2(4,090)
4.20(609,000)
2.0 47.9(6,950)
3.25(471,000)
26.2(0.49)
91(1.7)
100(212)
PP + 40%hardwood fiber+ 3% couplingagent
1.03(64.3)
52.3(7,580)
4.23(613,000)
3.2 72.4(10,500)
3.22(467,000)
21.6(0.41)
162(3.0)
105(221)
aUnpublished data.bProperties measured according to ASTM standards for plastics.cPP is polypropylene; percentages based on weight.
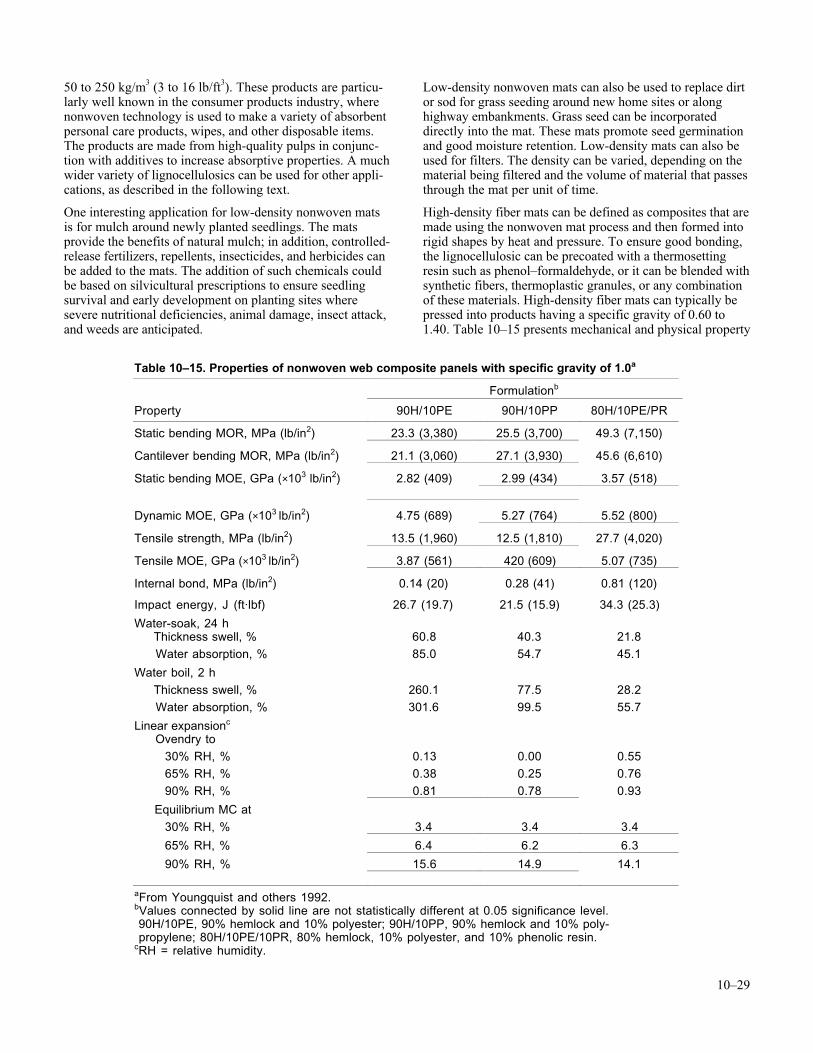
10–29
50 to 250 kg/m3 (3 to 16 lb/ft3). These products are particu-larly well known in the consumer products industry, wherenonwoven technology is used to make a variety of absorbentpersonal care products, wipes, and other disposable items.The products are made from high-quality pulps in conjunc-tion with additives to increase absorptive properties. A muchwider variety of lignocellulosics can be used for other appli-cations, as described in the following text.
One interesting application for low-density nonwoven matsis for mulch around newly planted seedlings. The matsprovide the benefits of natural mulch; in addition, controlled-release fertilizers, repellents, insecticides, and herbicides canbe added to the mats. The addition of such chemicals couldbe based on silvicultural prescriptions to ensure seedlingsurvival and early development on planting sites wheresevere nutritional deficiencies, animal damage, insect attack,and weeds are anticipated.
Low-density nonwoven mats can also be used to replace dirtor sod for grass seeding around new home sites or alonghighway embankments. Grass seed can be incorporateddirectly into the mat. These mats promote seed germinationand good moisture retention. Low-density mats can also beused for filters. The density can be varied, depending on thematerial being filtered and the volume of material that passesthrough the mat per unit of time.
High-density fiber mats can be defined as composites that aremade using the nonwoven mat process and then formed intorigid shapes by heat and pressure. To ensure good bonding,the lignocellulosic can be precoated with a thermosettingresin such as phenol–formaldehyde, or it can be blended withsynthetic fibers, thermoplastic granules, or any combinationof these materials. High-density fiber mats can typically bepressed into products having a specific gravity of 0.60 to1.40. Table 10–15 presents mechanical and physical property
Table 10–15. Properties of nonwoven web composite panels with specific gravity of 1.0a
Formulationb
Property 90H/10PE 90H/10PP 80H/10PE/PR
Static bending MOR, MPa (lb/in2) 23.3 (3,380) 25.5 (3,700) 49.3 (7,150)
Cantilever bending MOR, MPa (lb/in2) 21.1 (3,060) 27.1 (3,930) 45.6 (6,610)
Static bending MOE, GPa (×103 lb/in2) 2.82 (409) 2.99 (434) 3.57 (518)
Dynamic MOE, GPa (×103 lb/in2) 4.75 (689) 5.27 (764) 5.52 (800)
Tensile strength, MPa (lb/in2) 13.5 (1,960) 12.5 (1,810) 27.7 (4,020)
Tensile MOE, GPa (×103 lb/in2) 3.87 (561) 420 (609) 5.07 (735)
Internal bond, MPa (lb/in2) 0.14 (20) 0.28 (41) 0.81 (120)
Impact energy, J (ft·lbf) 26.7 (19.7) 21.5 (15.9) 34.3 (25.3)
Water-soak, 24 h Thickness swell, % 60.8 40.3 21.8
Water absorption, % 85.0 54.7 45.1
Water boil, 2 h
Thickness swell, % 260.1 77.5 28.2
Water absorption, % 301.6 99.5 55.7
Linear expansionc
Ovendry to
30% RH, % 0.13 0.00 0.55
65% RH, % 0.38 0.25 0.76
90% RH, % 0.81 0.78 0.93
Equilibrium MC at
30% RH, % 3.4 3.4 3.4
65% RH, % 6.4 6.2 6.3
90% RH, % 15.6 14.9 14.1
aFrom Youngquist and others 1992.bValues connected by solid line are not statistically different at 0.05 significance level. 90H/10PE, 90% hemlock and 10% polyester; 90H/10PP, 90% hemlock and 10% poly- propylene; 80H/10PE/10PR, 80% hemlock, 10% polyester, and 10% phenolic resin.cRH = relative humidity.
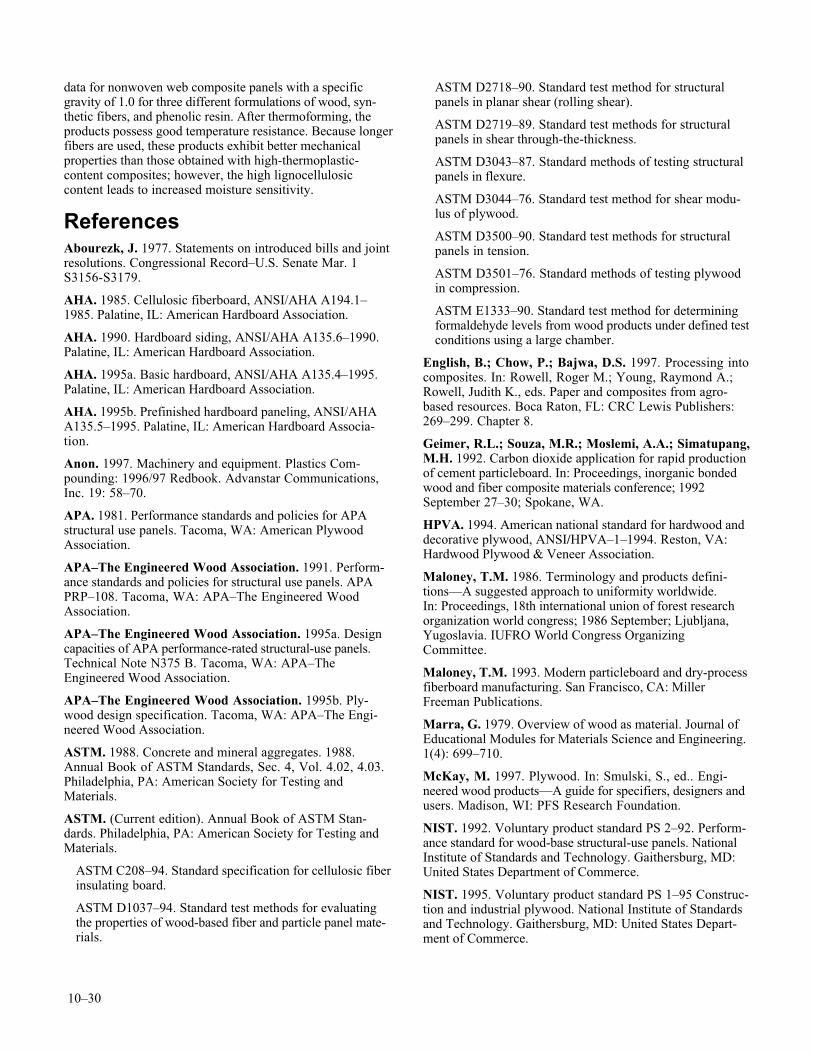
10–30
data for nonwoven web composite panels with a specificgravity of 1.0 for three different formulations of wood, syn-thetic fibers, and phenolic resin. After thermoforming, theproducts possess good temperature resistance. Because longerfibers are used, these products exhibit better mechanicalproperties than those obtained with high-thermoplastic-content composites; however, the high lignocellulosiccontent leads to increased moisture sensitivity.
ReferencesAbourezk, J. 1977. Statements on introduced bills and jointresolutions. Congressional Record–U.S. Senate Mar. 1S3156-S3179.
AHA. 1985. Cellulosic fiberboard, ANSI/AHA A194.1–1985. Palatine, IL: American Hardboard Association.
AHA. 1990. Hardboard siding, ANSI/AHA A135.6–1990.Palatine, IL: American Hardboard Association.
AHA. 1995a. Basic hardboard, ANSI/AHA A135.4–1995.Palatine, IL: American Hardboard Association.
AHA. 1995b. Prefinished hardboard paneling, ANSI/AHAA135.5–1995. Palatine, IL: American Hardboard Associa-tion.
Anon. 1997. Machinery and equipment. Plastics Com-pounding: 1996/97 Redbook. Advanstar Communications,Inc. 19: 58–70.
APA. 1981. Performance standards and policies for APAstructural use panels. Tacoma, WA: American PlywoodAssociation.
APA–The Engineered Wood Association. 1991. Perform-ance standards and policies for structural use panels. APAPRP–108. Tacoma, WA: APA–The Engineered WoodAssociation.
APA–The Engineered Wood Association. 1995a. Designcapacities of APA performance-rated structural-use panels.Technical Note N375 B. Tacoma, WA: APA–TheEngineered Wood Association.
APA–The Engineered Wood Association. 1995b. Ply-wood design specification. Tacoma, WA: APA–The Engi-neered Wood Association.
ASTM. 1988. Concrete and mineral aggregates. 1988.Annual Book of ASTM Standards, Sec. 4, Vol. 4.02, 4.03.Philadelphia, PA: American Society for Testing andMaterials.
ASTM. (Current edition). Annual Book of ASTM Stan-dards. Philadelphia, PA: American Society for Testing andMaterials.
ASTM C208–94. Standard specification for cellulosic fiberinsulating board.
ASTM D1037–94. Standard test methods for evaluatingthe properties of wood-based fiber and particle panel mate-rials.
ASTM D2718–90. Standard test method for structuralpanels in planar shear (rolling shear).
ASTM D2719–89. Standard test methods for structuralpanels in shear through-the-thickness.
ASTM D3043–87. Standard methods of testing structuralpanels in flexure.
ASTM D3044–76. Standard test method for shear modu-lus of plywood.
ASTM D3500–90. Standard test methods for structuralpanels in tension.
ASTM D3501–76. Standard methods of testing plywoodin compression.
ASTM E1333–90. Standard test method for determiningformaldehyde levels from wood products under defined testconditions using a large chamber.
English, B.; Chow, P.; Bajwa, D.S. 1997. Processing intocomposites. In: Rowell, Roger M.; Young, Raymond A.;Rowell, Judith K., eds. Paper and composites from agro-based resources. Boca Raton, FL: CRC Lewis Publishers:269–299. Chapter 8.
Geimer, R.L.; Souza, M.R.; Moslemi, A.A.; Simatupang,M.H. 1992. Carbon dioxide application for rapid productionof cement particleboard. In: Proceedings, inorganic bondedwood and fiber composite materials conference; 1992September 27–30; Spokane, WA.
HPVA. 1994. American national standard for hardwood anddecorative plywood, ANSI/HPVA–1–1994. Reston, VA:Hardwood Plywood & Veneer Association.
Maloney, T.M. 1986. Terminology and products defini-tions—A suggested approach to uniformity worldwide.In: Proceedings, 18th international union of forest researchorganization world congress; 1986 September; Ljubljana,Yugoslavia. IUFRO World Congress OrganizingCommittee.
Maloney, T.M. 1993. Modern particleboard and dry-processfiberboard manufacturing. San Francisco, CA: MillerFreeman Publications.
Marra, G. 1979. Overview of wood as material. Journal ofEducational Modules for Materials Science and Engineering.1(4): 699–710.
McKay, M. 1997. Plywood. In: Smulski, S., ed.. Engi-neered wood products—A guide for specifiers, designers andusers. Madison, WI: PFS Research Foundation.
NIST. 1992. Voluntary product standard PS 2–92. Perform-ance standard for wood-base structural-use panels. NationalInstitute of Standards and Technology. Gaithersburg, MD:United States Department of Commerce.
NIST. 1995. Voluntary product standard PS 1–95 Construc-tion and industrial plywood. National Institute of Standardsand Technology. Gaithersburg, MD: United States Depart-ment of Commerce.
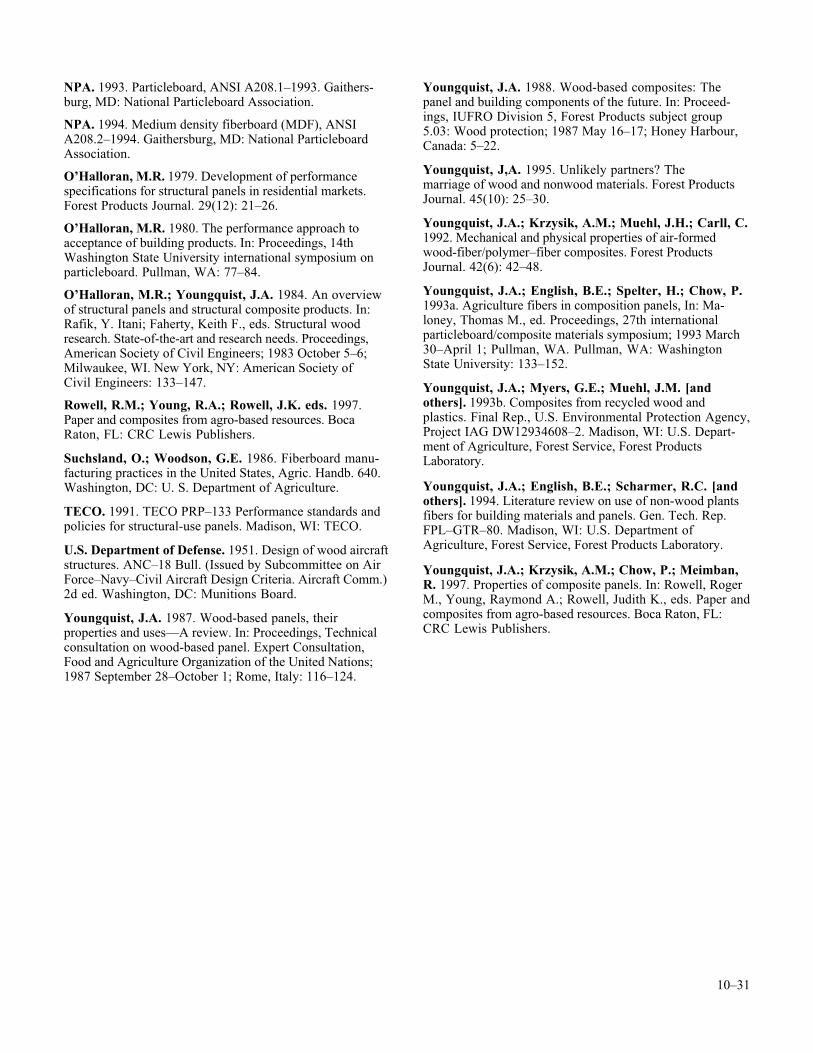
10–31
NPA. 1993. Particleboard, ANSI A208.1–1993. Gaithers-burg, MD: National Particleboard Association.
NPA. 1994. Medium density fiberboard (MDF), ANSIA208.2–1994. Gaithersburg, MD: National ParticleboardAssociation.
O’Halloran, M.R. 1979. Development of performancespecifications for structural panels in residential markets.Forest Products Journal. 29(12): 21–26.
O’Halloran, M.R. 1980. The performance approach toacceptance of building products. In: Proceedings, 14thWashington State University international symposium onparticleboard. Pullman, WA: 77–84.
O’Halloran, M.R.; Youngquist, J.A. 1984. An overviewof structural panels and structural composite products. In:Rafik, Y. Itani; Faherty, Keith F., eds. Structural woodresearch. State-of-the-art and research needs. Proceedings,American Society of Civil Engineers; 1983 October 5–6;Milwaukee, WI. New York, NY: American Society ofCivil Engineers: 133–147.
Rowell, R.M.; Young, R.A.; Rowell, J.K. eds. 1997.Paper and composites from agro-based resources. BocaRaton, FL: CRC Lewis Publishers.
Suchsland, O.; Woodson, G.E. 1986. Fiberboard manu-facturing practices in the United States, Agric. Handb. 640.Washington, DC: U. S. Department of Agriculture.
TECO. 1991. TECO PRP–133 Performance standards andpolicies for structural-use panels. Madison, WI: TECO.
U.S. Department of Defense. 1951. Design of wood aircraftstructures. ANC–18 Bull. (Issued by Subcommittee on AirForce–Navy–Civil Aircraft Design Criteria. Aircraft Comm.)2d ed. Washington, DC: Munitions Board.
Youngquist, J.A. 1987. Wood-based panels, theirproperties and uses—A review. In: Proceedings, Technicalconsultation on wood-based panel. Expert Consultation,Food and Agriculture Organization of the United Nations;1987 September 28–October 1; Rome, Italy: 116–124.
Youngquist, J.A. 1988. Wood-based composites: Thepanel and building components of the future. In: Proceed-ings, IUFRO Division 5, Forest Products subject group5.03: Wood protection; 1987 May 16–17; Honey Harbour,Canada: 5–22.
Youngquist, J,A. 1995. Unlikely partners? Themarriage of wood and nonwood materials. Forest ProductsJournal. 45(10): 25–30.
Youngquist, J.A.; Krzysik, A.M.; Muehl, J.H.; Carll, C.1992. Mechanical and physical properties of air-formedwood-fiber/polymer–fiber composites. Forest ProductsJournal. 42(6): 42–48.
Youngquist, J.A.; English, B.E.; Spelter, H.; Chow, P.1993a. Agriculture fibers in composition panels, In: Ma-loney, Thomas M., ed. Proceedings, 27th internationalparticleboard/composite materials symposium; 1993 March30–April 1; Pullman, WA. Pullman, WA: WashingtonState University: 133–152.
Youngquist, J.A.; Myers, G.E.; Muehl, J.M. [andothers]. 1993b. Composites from recycled wood andplastics. Final Rep., U.S. Environmental Protection Agency,Project IAG DW12934608–2. Madison, WI: U.S. Depart-ment of Agriculture, Forest Service, Forest ProductsLaboratory.
Youngquist, J.A.; English, B.E.; Scharmer, R.C. [andothers]. 1994. Literature review on use of non-wood plantsfibers for building materials and panels. Gen. Tech. Rep.FPL–GTR–80. Madison, WI: U.S. Department ofAgriculture, Forest Service, Forest Products Laboratory.
Youngquist, J.A.; Krzysik, A.M.; Chow, P.; Meimban,R. 1997. Properties of composite panels. In: Rowell, RogerM., Young, Raymond A.; Rowell, Judith K., eds. Paper andcomposites from agro-based resources. Boca Raton, FL:CRC Lewis Publishers.

FromForest Products Laboratory. 1999. Wood handbook—Wood as an engineering material.Gen. Tech. Rep. FPL–GTR–113. Madison, WI: U.S. Department of Agriculture, Forest Service,Forest Products Laboratory. 463 p.
11–1
Glued Structural MembersRussell C. Moody, Roland Hernandez, and Je n Y. Liu
Chapter 11
ContentsStructural Composite Lumber 11–1
Types 11–2
Advantages and Uses 11–2
Standards and Specifications 11–3
Glulam 11–3
Advantages 11–3
History 11–4
Types of Glulam Combinations 11–4
Standards and Specifications 11–6
Manufacture 11–6
Development of Design Values 11–9
Designs for Glued-Laminated Timber 11–10
Glued Members With Lumber and Panels 11–12
Box Beams and I-Beams 11–12
Prefabricated Wood I-Joists 11–13
Stressed-Skin Panels 11–14
Structural Sandwich Construction 11–16
Fabrication 11–16
Structural Design 11–17
Dimensional Stability, Durability, and Bowing 11–20
Thermal Insulation 11–20
Fire Resistance 11–21
References 11–21
lued structural members are manufactured in avariety of configurations. Structural compositelumber (SCL) products consist of small pieces of
wood glued together into sizes common for solid-sawnlumber. Glued-laminated timber (glulam) is an engineeredstress-rated product that consists of two or more layers oflumber in which the grain of all layers is oriented parallel tothe length of the lumber. Glued structural members alsoinclude lumber that is glued to panel products, such as boxbeams and I-beams, and structural sandwich construction.
Structural Composite LumberStructural composite lumber was developed in response tothe increasing demand for high quality lumber at a timewhen it was becoming difficult to obtain this type of lumberfrom the forest resource. Structural composite lumber prod-ucts are characterized by smaller pieces of wood glued to-gether into sizes common for solid-sawn lumber.
One type of SCL product is manufactured by laminatingveneer with all plies parallel to the length. This product iscalled laminated veneer lumber (LVL) and consists of spe-cially graded veneer. Another type of SCL product consistsof strands of wood or strips of veneer glued together underhigh pressures and temperatures. Depending upon the com-ponent material, this product is called laminated strandlumber (LSL), parallel strand lumber (PSL), or orientedstrand lumber (OSL) (Fig. 11–1). These types of SCL prod-ucts can be manufactured from raw materials, such as aspenor other underutilized species, that are not commonly usedfor structural applications. Different widths of lumber can beripped from SCL for various uses.
Structural composite lumber is a growing segment of theengineered wood products industry. It is used as a replace-ment for lumber in various applications and in the manufac-ture of other engineered wood products, such as prefabricatedwood I-joists, which take advantage of engineering designvalues that can be greater than those commonly assigned tosawn lumber.
G
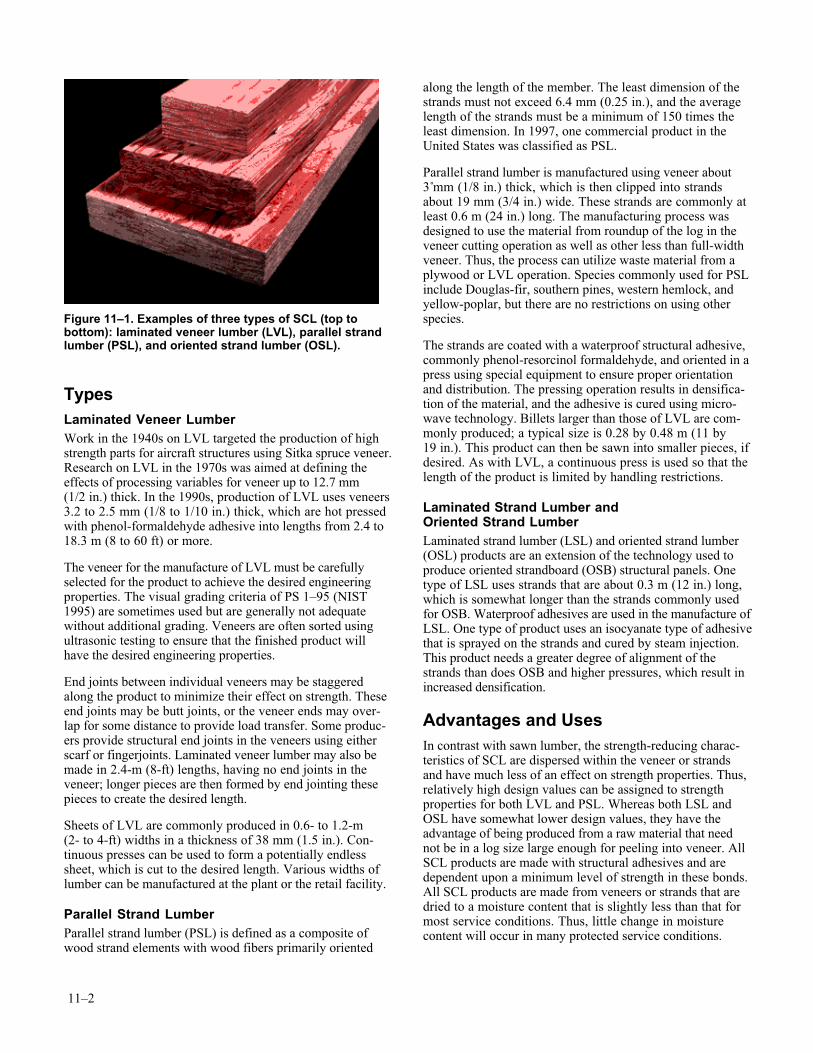
11–2
TypesLaminated Veneer LumberWork in the 1940s on LVL targeted the production of highstrength parts for aircraft structures using Sitka spruce veneer.Research on LVL in the 1970s was aimed at defining theeffects of processing variables for veneer up to 12.7 mm(1/2 in.) thick. In the 1990s, production of LVL uses veneers3.2 to 2.5 mm (1/8 to 1/10 in.) thick, which are hot pressedwith phenol-formaldehyde adhesive into lengths from 2.4 to18.3 m (8 to 60 ft) or more.
The veneer for the manufacture of LVL must be carefullyselected for the product to achieve the desired engineeringproperties. The visual grading criteria of PS 1–95 (NIST1995) are sometimes used but are generally not adequatewithout additional grading. Veneers are often sorted usingultrasonic testing to ensure that the finished product willhave the desired engineering properties.
End joints between individual veneers may be staggeredalong the product to minimize their effect on strength. Theseend joints may be butt joints, or the veneer ends may over-lap for some distance to provide load transfer. Some produc-ers provide structural end joints in the veneers using eitherscarf or fingerjoints. Laminated veneer lumber may also bemade in 2.4-m (8-ft) lengths, having no end joints in theveneer; longer pieces are then formed by end jointing thesepieces to create the desired length.
Sheets of LVL are commonly produced in 0.6- to 1.2-m(2- to 4-ft) widths in a thickness of 38 mm (1.5 in.). Con-tinuous presses can be used to form a potentially endlesssheet, which is cut to the desired length. Various widths oflumber can be manufactured at the plant or the retail facility.
Parallel Strand LumberParallel strand lumber (PSL) is defined as a composite ofwood strand elements with wood fibers primarily oriented
along the length of the member. The least dimension of thestrands must not exceed 6.4 mm (0.25 in.), and the averagelength of the strands must be a minimum of 150 times theleast dimension. In 1997, one commercial product in theUnited States was classified as PSL.
Parallel strand lumber is manufactured using veneer about3 mm (1/8 in.) thick, which is then clipped into strandsabout 19 mm (3/4 in.) wide. These strands are commonly atleast 0.6 m (24 in.) long. The manufacturing process wasdesigned to use the material from roundup of the log in theveneer cutting operation as well as other less than full-widthveneer. Thus, the process can utilize waste material from aplywood or LVL operation. Species commonly used for PSLinclude Douglas-fir, southern pines, western hemlock, andyellow-poplar, but there are no restrictions on using otherspecies.
The strands are coated with a waterproof structural adhesive,commonly phenol-resorcinol formaldehyde, and oriented in apress using special equipment to ensure proper orientationand distribution. The pressing operation results in densifica-tion of the material, and the adhesive is cured using micro-wave technology. Billets larger than those of LVL are com-monly produced; a typical size is 0.28 by 0.48 m (11 by19 in.). This product can then be sawn into smaller pieces, ifdesired. As with LVL, a continuous press is used so that thelength of the product is limited by handling restrictions.
Laminated Strand Lumber andOriented Strand LumberLaminated strand lumber (LSL) and oriented strand lumber(OSL) products are an extension of the technology used toproduce oriented strandboard (OSB) structural panels. Onetype of LSL uses strands that are about 0.3 m (12 in.) long,which is somewhat longer than the strands commonly usedfor OSB. Waterproof adhesives are used in the manufacture ofLSL. One type of product uses an isocyanate type of adhesivethat is sprayed on the strands and cured by steam injection.This product needs a greater degree of alignment of thestrands than does OSB and higher pressures, which result inincreased densification.
Advantages and UsesIn contrast with sawn lumber, the strength-reducing charac-teristics of SCL are dispersed within the veneer or strandsand have much less of an effect on strength properties. Thus,relatively high design values can be assigned to strengthproperties for both LVL and PSL. Whereas both LSL andOSL have somewhat lower design values, they have theadvantage of being produced from a raw material that neednot be in a log size large enough for peeling into veneer. AllSCL products are made with structural adhesives and aredependent upon a minimum level of strength in these bonds.All SCL products are made from veneers or strands that aredried to a moisture content that is slightly less than that formost service conditions. Thus, little change in moisturecontent will occur in many protected service conditions.
Figure 11–1. Examples of three types of SCL (top tobottom): laminated veneer lumber (LVL), parallel strandlumber (PSL), and oriented strand lumber (OSL).
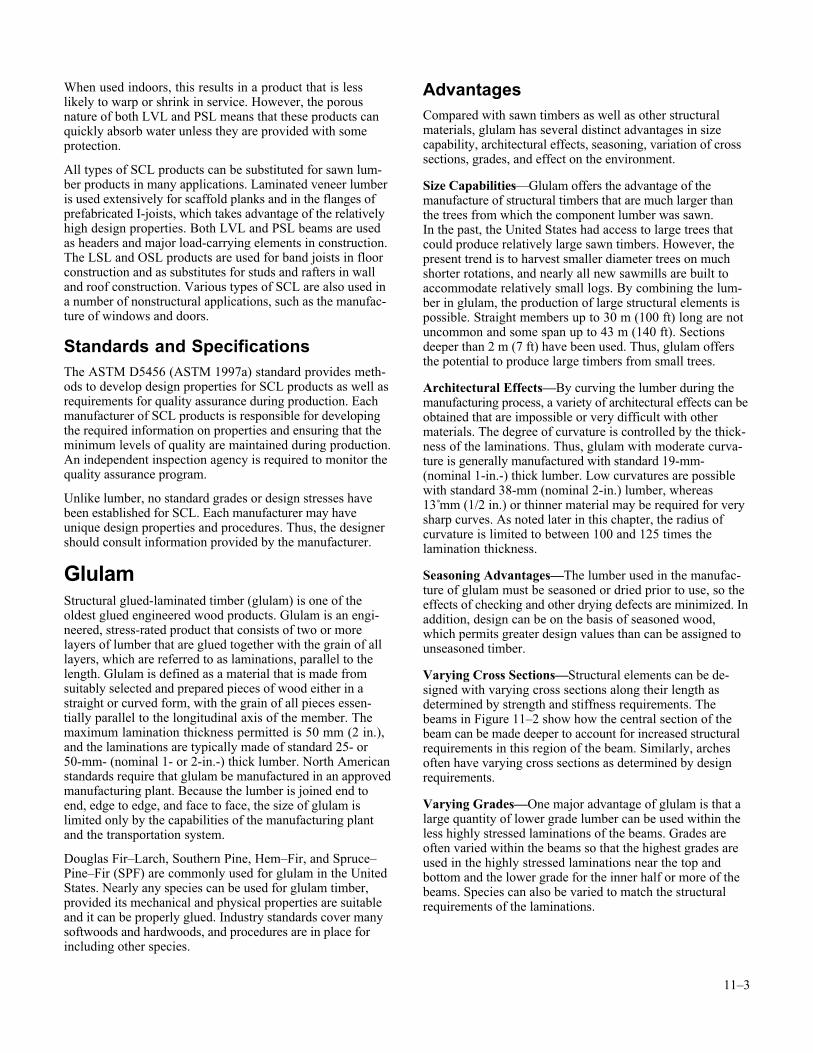
11–3
When used indoors, this results in a product that is lesslikely to warp or shrink in service. However, the porousnature of both LVL and PSL means that these products canquickly absorb water unless they are provided with someprotection.
All types of SCL products can be substituted for sawn lum-ber products in many applications. Laminated veneer lumberis used extensively for scaffold planks and in the flanges ofprefabricated I-joists, which takes advantage of the relativelyhigh design properties. Both LVL and PSL beams are usedas headers and major load-carrying elements in construction.The LSL and OSL products are used for band joists in floorconstruction and as substitutes for studs and rafters in walland roof construction. Various types of SCL are also used ina number of nonstructural applications, such as the manufac-ture of windows and doors.
Standards and SpecificationsThe ASTM D5456 (ASTM 1997a) standard provides meth-ods to develop design properties for SCL products as well asrequirements for quality assurance during production. Eachmanufacturer of SCL products is responsible for developingthe required information on properties and ensuring that theminimum levels of quality are maintained during production.An independent inspection agency is required to monitor thequality assurance program.
Unlike lumber, no standard grades or design stresses havebeen established for SCL. Each manufacturer may haveunique design properties and procedures. Thus, the designershould consult information provided by the manufacturer.
GlulamStructural glued-laminated timber (glulam) is one of theoldest glued engineered wood products. Glulam is an engi-neered, stress-rated product that consists of two or morelayers of lumber that are glued together with the grain of alllayers, which are referred to as laminations, parallel to thelength. Glulam is defined as a material that is made fromsuitably selected and prepared pieces of wood either in astraight or curved form, with the grain of all pieces essen-tially parallel to the longitudinal axis of the member. Themaximum lamination thickness permitted is 50 mm (2 in.),and the laminations are typically made of standard 25- or50-mm- (nominal 1- or 2-in.-) thick lumber. North Americanstandards require that glulam be manufactured in an approvedmanufacturing plant. Because the lumber is joined end toend, edge to edge, and face to face, the size of glulam islimited only by the capabilities of the manufacturing plantand the transportation system.
Douglas Fir–Larch, Southern Pine, Hem–Fir, and Spruce–Pine–Fir (SPF) are commonly used for glulam in the UnitedStates. Nearly any species can be used for glulam timber,provided its mechanical and physical properties are suitableand it can be properly glued. Industry standards cover manysoftwoods and hardwoods, and procedures are in place forincluding other species.
AdvantagesCompared with sawn timbers as well as other structuralmaterials, glulam has several distinct advantages in sizecapability, architectural effects, seasoning, variation of crosssections, grades, and effect on the environment.
Size Capabilities—Glulam offers the advantage of themanufacture of structural timbers that are much larger thanthe trees from which the component lumber was sawn.In the past, the United States had access to large trees thatcould produce relatively large sawn timbers. However, thepresent trend is to harvest smaller diameter trees on muchshorter rotations, and nearly all new sawmills are built toaccommodate relatively small logs. By combining the lum-ber in glulam, the production of large structural elements ispossible. Straight members up to 30 m (100 ft) long are notuncommon and some span up to 43 m (140 ft). Sectionsdeeper than 2 m (7 ft) have been used. Thus, glulam offersthe potential to produce large timbers from small trees.
Architectural Effects—By curving the lumber during themanufacturing process, a variety of architectural effects can beobtained that are impossible or very difficult with othermaterials. The degree of curvature is controlled by the thick-ness of the laminations. Thus, glulam with moderate curva-ture is generally manufactured with standard 19-mm-(nominal 1-in.-) thick lumber. Low curvatures are possiblewith standard 38-mm (nominal 2-in.) lumber, whereas13 mm (1/2 in.) or thinner material may be required for verysharp curves. As noted later in this chapter, the radius ofcurvature is limited to between 100 and 125 times thelamination thickness.
Seasoning Advantages—The lumber used in the manufac-ture of glulam must be seasoned or dried prior to use, so theeffects of checking and other drying defects are minimized. Inaddition, design can be on the basis of seasoned wood,which permits greater design values than can be assigned tounseasoned timber.
Varying Cross Sections—Structural elements can be de-signed with varying cross sections along their length asdetermined by strength and stiffness requirements. Thebeams in Figure 11–2 show how the central section of thebeam can be made deeper to account for increased structuralrequirements in this region of the beam. Similarly, archesoften have varying cross sections as determined by designrequirements.
Varying Grades—One major advantage of glulam is that alarge quantity of lower grade lumber can be used within theless highly stressed laminations of the beams. Grades areoften varied within the beams so that the highest grades areused in the highly stressed laminations near the top andbottom and the lower grade for the inner half or more of thebeams. Species can also be varied to match the structuralrequirements of the laminations.
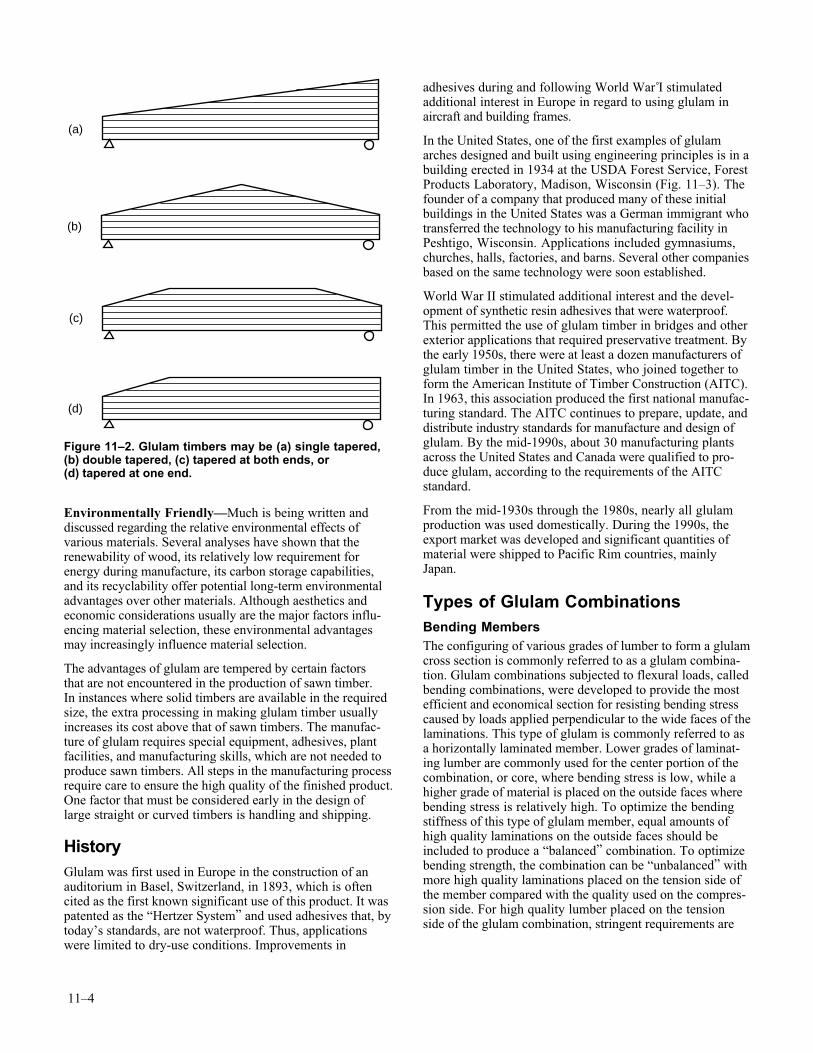
11–4
Environmentally Friendly—Much is being written anddiscussed regarding the relative environmental effects ofvarious materials. Several analyses have shown that therenewability of wood, its relatively low requirement forenergy during manufacture, its carbon storage capabilities,and its recyclability offer potential long-term environmentaladvantages over other materials. Although aesthetics andeconomic considerations usually are the major factors influ-encing material selection, these environmental advantagesmay increasingly influence material selection.
The advantages of glulam are tempered by certain factorsthat are not encountered in the production of sawn timber.In instances where solid timbers are available in the requiredsize, the extra processing in making glulam timber usuallyincreases its cost above that of sawn timbers. The manufac-ture of glulam requires special equipment, adhesives, plantfacilities, and manufacturing skills, which are not needed toproduce sawn timbers. All steps in the manufacturing processrequire care to ensure the high quality of the finished product.One factor that must be considered early in the design oflarge straight or curved timbers is handling and shipping.
HistoryGlulam was first used in Europe in the construction of anauditorium in Basel, Switzerland, in 1893, which is oftencited as the first known significant use of this product. It waspatented as the “Hertzer System” and used adhesives that, bytoday’s standards, are not waterproof. Thus, applicationswere limited to dry-use conditions. Improvements in
adhesives during and following World War I stimulatedadditional interest in Europe in regard to using glulam inaircraft and building frames.
In the United States, one of the first examples of glulamarches designed and built using engineering principles is in abuilding erected in 1934 at the USDA Forest Service, ForestProducts Laboratory, Madison, Wisconsin (Fig. 11–3). Thefounder of a company that produced many of these initialbuildings in the United States was a German immigrant whotransferred the technology to his manufacturing facility inPeshtigo, Wisconsin. Applications included gymnasiums,churches, halls, factories, and barns. Several other companiesbased on the same technology were soon established.
World War II stimulated additional interest and the devel-opment of synthetic resin adhesives that were waterproof.This permitted the use of glulam timber in bridges and otherexterior applications that required preservative treatment. Bythe early 1950s, there were at least a dozen manufacturers ofglulam timber in the United States, who joined together toform the American Institute of Timber Construction (AITC).In 1963, this association produced the first national manufac-turing standard. The AITC continues to prepare, update, anddistribute industry standards for manufacture and design ofglulam. By the mid-1990s, about 30 manufacturing plantsacross the United States and Canada were qualified to pro-duce glulam, according to the requirements of the AITCstandard.
From the mid-1930s through the 1980s, nearly all glulamproduction was used domestically. During the 1990s, theexport market was developed and significant quantities ofmaterial were shipped to Pacific Rim countries, mainlyJapan.
Types of Glulam CombinationsBending MembersThe configuring of various grades of lumber to form a glulamcross section is commonly referred to as a glulam combina-tion. Glulam combinations subjected to flexural loads, calledbending combinations, were developed to provide the mostefficient and economical section for resisting bending stresscaused by loads applied perpendicular to the wide faces of thelaminations. This type of glulam is commonly referred to asa horizontally laminated member. Lower grades of laminat-ing lumber are commonly used for the center portion of thecombination, or core, where bending stress is low, while ahigher grade of material is placed on the outside faces wherebending stress is relatively high. To optimize the bendingstiffness of this type of glulam member, equal amounts ofhigh quality laminations on the outside faces should beincluded to produce a “balanced” combination. To optimizebending strength, the combination can be “unbalanced” withmore high quality laminations placed on the tension side ofthe member compared with the quality used on the compres-sion side. For high quality lumber placed on the tensionside of the glulam combination, stringent requirements are
(a)
(c)
(b)
(d)
Figure 11–2. Glulam timbers may be (a) single tapered,(b) double tapered, (c) tapered at both ends, or(d) tapered at one end.
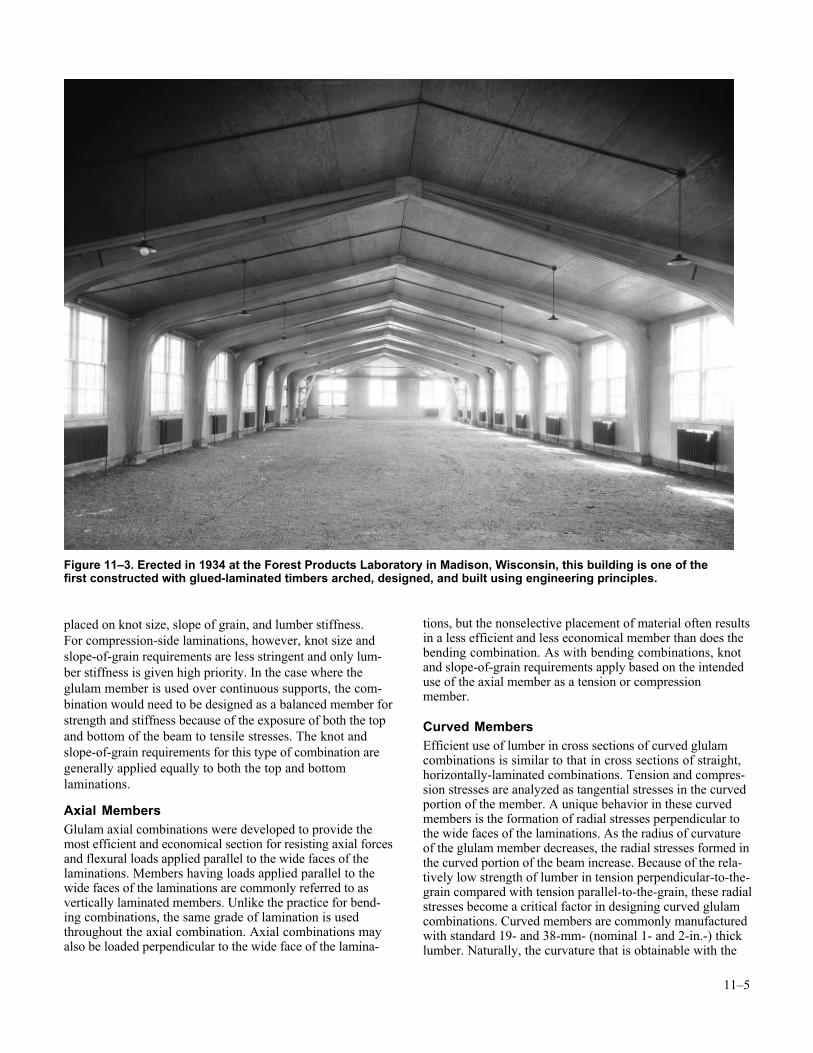
11–5
placed on knot size, slope of grain, and lumber stiffness.For compression-side laminations, however, knot size andslope-of-grain requirements are less stringent and only lum-ber stiffness is given high priority. In the case where theglulam member is used over continuous supports, the com-bination would need to be designed as a balanced member forstrength and stiffness because of the exposure of both the topand bottom of the beam to tensile stresses. The knot andslope-of-grain requirements for this type of combination aregenerally applied equally to both the top and bottomlaminations.
Axial MembersGlulam axial combinations were developed to provide themost efficient and economical section for resisting axial forcesand flexural loads applied parallel to the wide faces of thelaminations. Members having loads applied parallel to thewide faces of the laminations are commonly referred to asvertically laminated members. Unlike the practice for bend-ing combinations, the same grade of lamination is usedthroughout the axial combination. Axial combinations mayalso be loaded perpendicular to the wide face of the lamina-
tions, but the nonselective placement of material often resultsin a less efficient and less economical member than does thebending combination. As with bending combinations, knotand slope-of-grain requirements apply based on the intendeduse of the axial member as a tension or compressionmember.
Curved MembersEfficient use of lumber in cross sections of curved glulamcombinations is similar to that in cross sections of straight,horizontally-laminated combinations. Tension and compres-sion stresses are analyzed as tangential stresses in the curvedportion of the member. A unique behavior in these curvedmembers is the formation of radial stresses perpendicular tothe wide faces of the laminations. As the radius of curvatureof the glulam member decreases, the radial stresses formed inthe curved portion of the beam increase. Because of the rela-tively low strength of lumber in tension perpendicular-to-the-grain compared with tension parallel-to-the-grain, these radialstresses become a critical factor in designing curved glulamcombinations. Curved members are commonly manufacturedwith standard 19- and 38-mm- (nominal 1- and 2-in.-) thicklumber. Naturally, the curvature that is obtainable with the
Figure 11–3. Erected in 1934 at the Forest Products Laboratory in Madison, Wisconsin, this building is one of thefirst constructed with glued-laminated timbers arched, designed, and built using engineering principles.
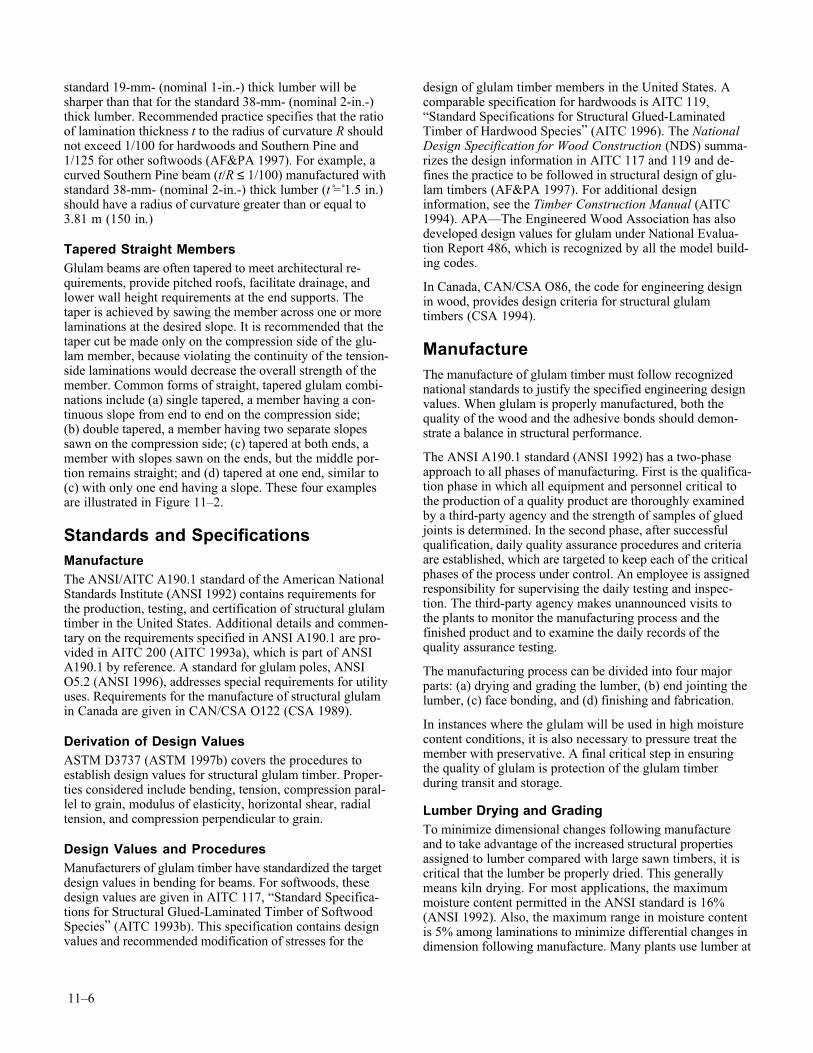
11–6
standard 19-mm- (nominal 1-in.-) thick lumber will besharper than that for the standard 38-mm- (nominal 2-in.-)thick lumber. Recommended practice specifies that the ratioof lamination thickness t to the radius of curvature R shouldnot exceed 1/100 for hardwoods and Southern Pine and1/125 for other softwoods (AF&PA 1997). For example, acurved Southern Pine beam (t/R ≤ 1/100) manufactured withstandard 38-mm- (nominal 2-in.-) thick lumber (t = 1.5 in.)should have a radius of curvature greater than or equal to3.81 m (150 in.)
Tapered Straight MembersGlulam beams are often tapered to meet architectural re-quirements, provide pitched roofs, facilitate drainage, andlower wall height requirements at the end supports. Thetaper is achieved by sawing the member across one or morelaminations at the desired slope. It is recommended that thetaper cut be made only on the compression side of the glu-lam member, because violating the continuity of the tension-side laminations would decrease the overall strength of themember. Common forms of straight, tapered glulam combi-nations include (a) single tapered, a member having a con-tinuous slope from end to end on the compression side;(b) double tapered, a member having two separate slopessawn on the compression side; (c) tapered at both ends, amember with slopes sawn on the ends, but the middle por-tion remains straight; and (d) tapered at one end, similar to(c) with only one end having a slope. These four examplesare illustrated in Figure 11–2.
Standards and SpecificationsManufactureThe ANSI/AITC A190.1 standard of the American NationalStandards Institute (ANSI 1992) contains requirements forthe production, testing, and certification of structural glulamtimber in the United States. Additional details and commen-tary on the requirements specified in ANSI A190.1 are pro-vided in AITC 200 (AITC 1993a), which is part of ANSIA190.1 by reference. A standard for glulam poles, ANSIO5.2 (ANSI 1996), addresses special requirements for utilityuses. Requirements for the manufacture of structural glulamin Canada are given in CAN/CSA O122 (CSA 1989).
Derivation of Design ValuesASTM D3737 (ASTM 1997b) covers the procedures toestablish design values for structural glulam timber. Proper-ties considered include bending, tension, compression paral-lel to grain, modulus of elasticity, horizontal shear, radialtension, and compression perpendicular to grain.
Design Values and ProceduresManufacturers of glulam timber have standardized the targetdesign values in bending for beams. For softwoods, thesedesign values are given in AITC 117, “Standard Specifica-tions for Structural Glued-Laminated Timber of SoftwoodSpecies” (AITC 1993b). This specification contains designvalues and recommended modification of stresses for the
design of glulam timber members in the United States. Acomparable specification for hardwoods is AITC 119,“Standard Specifications for Structural Glued-LaminatedTimber of Hardwood Species” (AITC 1996). The NationalDesign Specification for Wood Construction (NDS) summa-rizes the design information in AITC 117 and 119 and de-fines the practice to be followed in structural design of glu-lam timbers (AF&PA 1997). For additional designinformation, see the Timber Construction Manual (AITC1994). APA—The Engineered Wood Association has alsodeveloped design values for glulam under National Evalua-tion Report 486, which is recognized by all the model build-ing codes.
In Canada, CAN/CSA O86, the code for engineering designin wood, provides design criteria for structural glulamtimbers (CSA 1994).
ManufactureThe manufacture of glulam timber must follow recognizednational standards to justify the specified engineering designvalues. When glulam is properly manufactured, both thequality of the wood and the adhesive bonds should demon-strate a balance in structural performance.
The ANSI A190.1 standard (ANSI 1992) has a two-phaseapproach to all phases of manufacturing. First is the qualifica-tion phase in which all equipment and personnel critical tothe production of a quality product are thoroughly examinedby a third-party agency and the strength of samples of gluedjoints is determined. In the second phase, after successfulqualification, daily quality assurance procedures and criteriaare established, which are targeted to keep each of the criticalphases of the process under control. An employee is assignedresponsibility for supervising the daily testing and inspec-tion. The third-party agency makes unannounced visits tothe plants to monitor the manufacturing process and thefinished product and to examine the daily records of thequality assurance testing.
The manufacturing process can be divided into four majorparts: (a) drying and grading the lumber, (b) end jointing thelumber, (c) face bonding, and (d) finishing and fabrication.
In instances where the glulam will be used in high moisturecontent conditions, it is also necessary to pressure treat themember with preservative. A final critical step in ensuringthe quality of glulam is protection of the glulam timberduring transit and storage.
Lumber Drying and GradingTo minimize dimensional changes following manufactureand to take advantage of the increased structural propertiesassigned to lumber compared with large sawn timbers, it iscritical that the lumber be properly dried. This generallymeans kiln drying. For most applications, the maximummoisture content permitted in the ANSI standard is 16%(ANSI 1992). Also, the maximum range in moisture contentis 5% among laminations to minimize differential changes indimension following manufacture. Many plants use lumber at
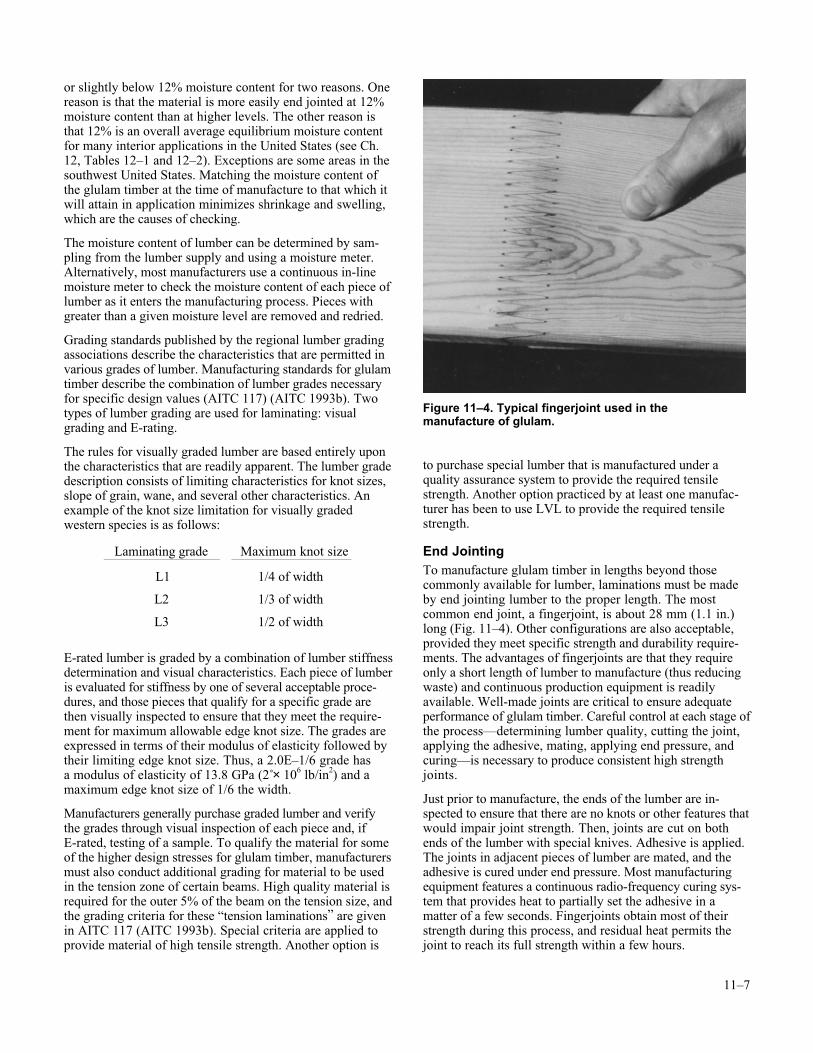
11–7
or slightly below 12% moisture content for two reasons. Onereason is that the material is more easily end jointed at 12%moisture content than at higher levels. The other reason isthat 12% is an overall average equilibrium moisture contentfor many interior applications in the United States (see Ch.12, Tables 12–1 and 12–2). Exceptions are some areas in thesouthwest United States. Matching the moisture content ofthe glulam timber at the time of manufacture to that which itwill attain in application minimizes shrinkage and swelling,which are the causes of checking.
The moisture content of lumber can be determined by sam-pling from the lumber supply and using a moisture meter.Alternatively, most manufacturers use a continuous in-linemoisture meter to check the moisture content of each piece oflumber as it enters the manufacturing process. Pieces withgreater than a given moisture level are removed and redried.
Grading standards published by the regional lumber gradingassociations describe the characteristics that are permitted invarious grades of lumber. Manufacturing standards for glulamtimber describe the combination of lumber grades necessaryfor specific design values (AITC 117) (AITC 1993b). Twotypes of lumber grading are used for laminating: visualgrading and E-rating.
The rules for visually graded lumber are based entirely uponthe characteristics that are readily apparent. The lumber gradedescription consists of limiting characteristics for knot sizes,slope of grain, wane, and several other characteristics. Anexample of the knot size limitation for visually gradedwestern species is as follows:
Laminating grade Maximum knot size
L1 1/4 of width
L2 1/3 of width
L3 1/2 of width
E-rated lumber is graded by a combination of lumber stiffnessdetermination and visual characteristics. Each piece of lumberis evaluated for stiffness by one of several acceptable proce-dures, and those pieces that qualify for a specific grade arethen visually inspected to ensure that they meet the require-ment for maximum allowable edge knot size. The grades areexpressed in terms of their modulus of elasticity followed bytheir limiting edge knot size. Thus, a 2.0E–1/6 grade hasa modulus of elasticity of 13.8 GPa (2 × 10⁶ lb/in2) and amaximum edge knot size of 1/6 the width.
Manufacturers generally purchase graded lumber and verifythe grades through visual inspection of each piece and, ifE-rated, testing of a sample. To qualify the material for someof the higher design stresses for glulam timber, manufacturersmust also conduct additional grading for material to be usedin the tension zone of certain beams. High quality material isrequired for the outer 5% of the beam on the tension size, andthe grading criteria for these “tension laminations” are givenin AITC 117 (AITC 1993b). Special criteria are applied toprovide material of high tensile strength. Another option is
to purchase special lumber that is manufactured under aquality assurance system to provide the required tensilestrength. Another option practiced by at least one manufac-turer has been to use LVL to provide the required tensilestrength.
End JointingTo manufacture glulam timber in lengths beyond thosecommonly available for lumber, laminations must be madeby end jointing lumber to the proper length. The mostcommon end joint, a fingerjoint, is about 28 mm (1.1 in.)long (Fig. 11–4). Other configurations are also acceptable,provided they meet specific strength and durability require-ments. The advantages of fingerjoints are that they requireonly a short length of lumber to manufacture (thus reducingwaste) and continuous production equipment is readilyavailable. Well-made joints are critical to ensure adequateperformance of glulam timber. Careful control at each stage ofthe process—determining lumber quality, cutting the joint,applying the adhesive, mating, applying end pressure, andcuring—is necessary to produce consistent high strengthjoints.
Just prior to manufacture, the ends of the lumber are in-spected to ensure that there are no knots or other features thatwould impair joint strength. Then, joints are cut on bothends of the lumber with special knives. Adhesive is applied.The joints in adjacent pieces of lumber are mated, and theadhesive is cured under end pressure. Most manufacturingequipment features a continuous radio-frequency curing sys-tem that provides heat to partially set the adhesive in amatter of a few seconds. Fingerjoints obtain most of theirstrength during this process, and residual heat permits thejoint to reach its full strength within a few hours.
Figure 11–4. Typical fingerjoint used in themanufacture of glulam.
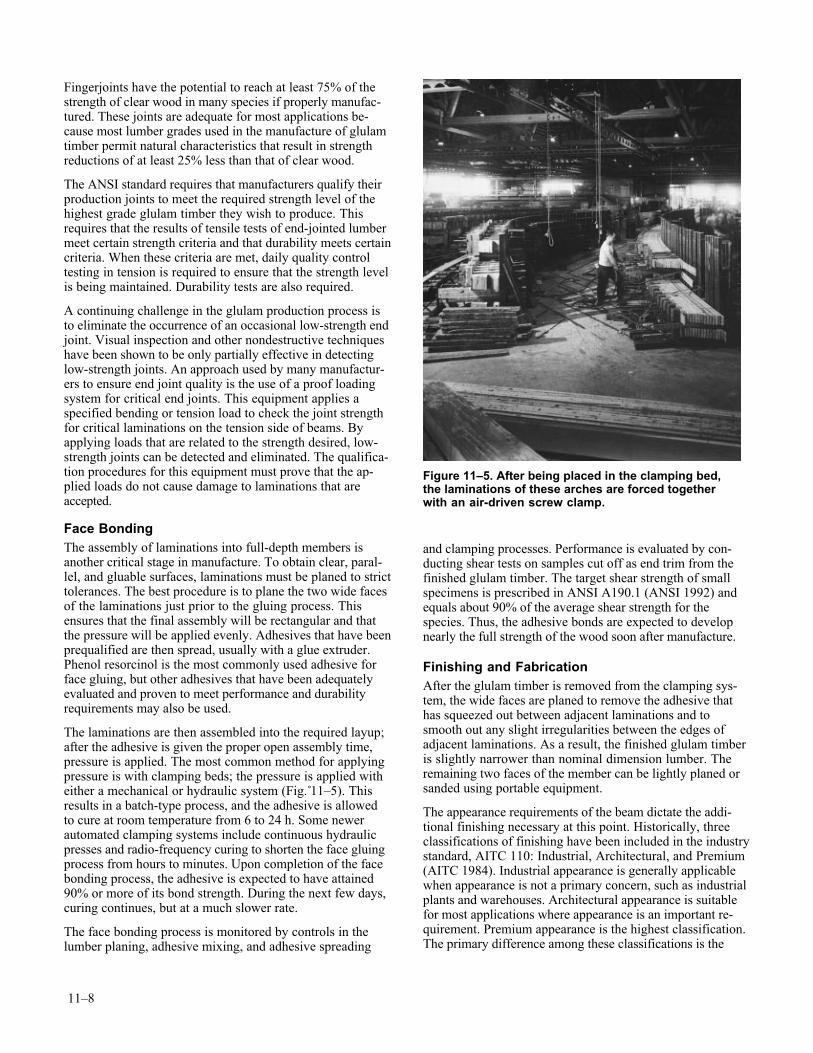
11–8
Fingerjoints have the potential to reach at least 75% of thestrength of clear wood in many species if properly manufac-tured. These joints are adequate for most applications be-cause most lumber grades used in the manufacture of glulamtimber permit natural characteristics that result in strengthreductions of at least 25% less than that of clear wood.
The ANSI standard requires that manufacturers qualify theirproduction joints to meet the required strength level of thehighest grade glulam timber they wish to produce. Thisrequires that the results of tensile tests of end-jointed lumbermeet certain strength criteria and that durability meets certaincriteria. When these criteria are met, daily quality controltesting in tension is required to ensure that the strength levelis being maintained. Durability tests are also required.
A continuing challenge in the glulam production process isto eliminate the occurrence of an occasional low-strength endjoint. Visual inspection and other nondestructive techniqueshave been shown to be only partially effective in detectinglow-strength joints. An approach used by many manufactur-ers to ensure end joint quality is the use of a proof loadingsystem for critical end joints. This equipment applies aspecified bending or tension load to check the joint strengthfor critical laminations on the tension side of beams. Byapplying loads that are related to the strength desired, low-strength joints can be detected and eliminated. The qualifica-tion procedures for this equipment must prove that the ap-plied loads do not cause damage to laminations that areaccepted.
Face BondingThe assembly of laminations into full-depth members isanother critical stage in manufacture. To obtain clear, paral-lel, and gluable surfaces, laminations must be planed to stricttolerances. The best procedure is to plane the two wide facesof the laminations just prior to the gluing process. Thisensures that the final assembly will be rectangular and thatthe pressure will be applied evenly. Adhesives that have beenprequalified are then spread, usually with a glue extruder.Phenol resorcinol is the most commonly used adhesive forface gluing, but other adhesives that have been adequatelyevaluated and proven to meet performance and durabilityrequirements may also be used.
The laminations are then assembled into the required layup;after the adhesive is given the proper open assembly time,pressure is applied. The most common method for applyingpressure is with clamping beds; the pressure is applied witheither a mechanical or hydraulic system (Fig. 11–5). Thisresults in a batch-type process, and the adhesive is allowedto cure at room temperature from 6 to 24 h. Some newerautomated clamping systems include continuous hydraulicpresses and radio-frequency curing to shorten the face gluingprocess from hours to minutes. Upon completion of the facebonding process, the adhesive is expected to have attained90% or more of its bond strength. During the next few days,curing continues, but at a much slower rate.
The face bonding process is monitored by controls in thelumber planing, adhesive mixing, and adhesive spreading
and clamping processes. Performance is evaluated by con-ducting shear tests on samples cut off as end trim from thefinished glulam timber. The target shear strength of smallspecimens is prescribed in ANSI A190.1 (ANSI 1992) andequals about 90% of the average shear strength for thespecies. Thus, the adhesive bonds are expected to developnearly the full strength of the wood soon after manufacture.
Finishing and FabricationAfter the glulam timber is removed from the clamping sys-tem, the wide faces are planed to remove the adhesive thathas squeezed out between adjacent laminations and tosmooth out any slight irregularities between the edges ofadjacent laminations. As a result, the finished glulam timberis slightly narrower than nominal dimension lumber. Theremaining two faces of the member can be lightly planed orsanded using portable equipment.
The appearance requirements of the beam dictate the addi-tional finishing necessary at this point. Historically, threeclassifications of finishing have been included in the industrystandard, AITC 110: Industrial, Architectural, and Premium(AITC 1984). Industrial appearance is generally applicablewhen appearance is not a primary concern, such as industrialplants and warehouses. Architectural appearance is suitablefor most applications where appearance is an important re-quirement. Premium appearance is the highest classification.The primary difference among these classifications is the
Figure 11–5. After being placed in the clamping bed,the laminations of these arches are forced togetherwith an air-driven screw clamp.

11–9
amount of knot holes and occasional planer skips that arepermitted. A recently introduced classification, called Fram-ing, consists of hit-and-miss planing and permits a signifi-cant amount of adhesive to remain on the surface. This fin-ishing is intended for uses that require one member to havethe same width as the lumber used in manufacture for framinginto walls. These members are often covered in the finishedstructure.
The next step in the manufacturing process is fabrication,where the final cuts are made, holes are drilled, connectorsare added, and a finish or sealer is applied, if specified. Forvarious members, different degrees of prefabrication are doneat this point. Trusses may be partially or fully assembled.Moment splices can be fully fabricated, then disconnected fortransportation and erection. End sealers, surface sealers,primer coats, and wrapping with waterproof paper or plasticall help to stabilize the moisture content of the glulam tim-ber between the time it is manufactured and installed. Theextent of protection necessary depends upon the end use andmust be specified.
Preservative TreatmentIn instances where the moisture content of the finished glu-lam timber will approach or exceed 20% (in most exteriorand some interior uses), the glulam timber should be pre-servative treated following AITC (1990) and AWPA(1997b). Three main types of preservatives are available:creosote, oilborne, and waterborne. Creosote and oilbornepreservatives are applied to the finished glulam timbers.Some light oil solvent treatments can be applied to thelumber prior to gluing, but the suitability must be verifiedwith the manufacturer. Waterborne preservatives are bestapplied to the lumber prior to the laminating and manufactur-ing process because they can lead to excessive checking ifapplied to large finished glulam timbers.
Creosote Solutions—Treatment with creosote solutions issuitable for the most severe outdoor exposure. It results in adark, oily surface appearance that is difficult to alter. This,coupled with a distinct odor, restricts creosote solutions tostructures, such as bridges, that do not come in direct contactwith humans. Creosote solutions are an extremely effectivepreservative as proven by their continued use for railwaystructures. Another advantage is that the creosote treatmentrenders the timbers much less susceptible to moisture con-tent changes than are untreated timbers. Creosote solutionsare often used as a preservative treatment on bridge stringers.
Oilborne Treatments—Pentachlorophenol and coppernapthanate are the most common oilborne preservatives. Thesolvents are classified in AWPA Standard P9 as Type A,Type C, and Type D (AWPA 1997a). Type A results in anoily finish and should not be used when a plain table surfaceis needed. Type B or C can be stained or painted. Moredetails are given in AITC (1990) and AWPA (1997a).
Waterborne Treatments—Waterborne preservative treat-ments conform to AWPA P5 (AWPA 1997b) and use water-soluble preservative chemicals that become fixed in thewood. The effectiveness of this treatment depends upon the
depth to which the chemicals penetrate into the lumber.Different processes are quite effective for some species but notfor others. In addition, the treated lumber is generally moredifficult to bond effectively and requires special manufacturingprocedures. Thus, it is recommended that the manufacturerbe contacted to determine the capabilities of waterborne-preservative-treated products.
The major advantage of a waterborne treatment is that thesurface of the timber appears little changed by the treatment.Different chemicals can leave a green, gray, or brown color;all result in a surface that is easily finished with stains orpaints. To avoid the potential of corrosive interactions withthe chemical treatments, special care must be given whenselecting the connection hardware. In addition, waterborne-preservative-treated glulam timber is much more subject tomoisture content cycling than is creosote-treated or oilborne-preservative-treated glulam timber.
A major consideration in selecting a preservative treatment isthe local regulations dealing with the use and disposal ofwaste from preservative-treated timber. Recommended reten-tion levels for applications of various preservatives are givenin AITC 109 (AITC 1990) along with appropriate qualityassurance procedures.
Development of Design ValuesThe basic approach to determine the engineered designvalues of glulam members is through the use of stress indexvalues and stress modification factors.
Stress Index ValuesStress index values are related to the properties clear of woodthat is free of defects and other strength-reducing characteris-tics. Stress index values for several commonly used speciesand E-rated grades of lumber are given in ASTM D3737(ASTM 1997b). Procedures are also given for developingthese values for visual grades of other species.
Stress Modification FactorsStress modification factors are related to strength-reducingcharacteristics and are multiplied by the stress index valuesto obtain allowable design properties. Detailed informationon determination of these factors for bending, tension, com-pression, and modulus of elasticity are given in ASTMD3737 (1997b).
Other ConsiderationsEffect of End Joints on Strength—Both fingerjoints andscarf joints can be manufactured with adequate strength foruse in structural glulam. Adequacy is determined by physicaltesting procedures and requirements in ANSI A190.1 (ANSI1992).
Joints should be well scattered in portions of structuralglulam that is highly stressed in tension. Required spacingsof end joints are given in ANSI A190.1. End joints of twoqualities can be used in a glulam member, depending uponstrength requirements at various depths of the cross section.
11–10
However, laminators usually use the same joint throughoutthe members for ease in manufacture.
The highest strength values are obtained with well-madeplain scarf joints; the lowest values are obtained with buttjoints. This is because scarf joints with flat slopes haveessentially side-grain surfaces that can be well bonded todevelop high strength, and butt joints have end-grain surfacesthat cannot be bonded effectively. Structural fingerjoints(either vertical or horizontal) are a compromise between scarfand butt joints; the strength of structural fingerjoints varieswith joint design.
No statement can be made regarding the specific jointstrength factor of fingerjoints, because fingerjoint strengthdepends on the type and configuration of the joint and themanufacturing process. However, the joint factor of com-monly used fingerjoints in high-quality lumber used forlaminating can be about 75%. High-strength fingerjoints canbe made when the design is such that the fingers have rela-tively flat slopes and sharp tips. Tips are essentially a seriesof butt joints that reduce the effectiveness of fingerjoints aswell as creating sources of stress concentration.
Generally, butt joints cannot transmit tensile stress and cantransmit compressive stress only after considerable deforma-tion or if a metal bearing plate is tightly fitted between theabutting ends. In normal assembly operations, such fittingwould not be done. Therefore, it is necessary to assume thatbutt joints are ineffective in transmitting both tensile andcompressive stresses. Because of this ineffectiveness andbecause butt joints cause concentration of both shear stressand longitudinal stress, butt joints are not permitted for usein structural glued-laminated timbers.
Effect of Edge Joints on Strength—It is sometimes neces-sary to place laminations edge-to-edge to provide glulammembers of sufficient width. Because of difficulties in fabrica-tion, structural edge joint bonding may not be readily avail-able, and the designer should investigate the availability ofsuch bonding prior to specifying.
For tension, compression, and horizontally laminated bend-ing members, the strength of edge joints is of little impor-tance to the overall strength of the member. Therefore, fromthe standpoint of strength, it is unnecessary that edge jointsbe glued if they are not in the same location in adjacentlaminations. However, for maximum strength, edge jointsshould be glued where torsional loading is involved. Otherconsiderations, such as the appearance of face laminations orthe possibility that water will enter the unglued joints andpromote decay, should also dictate if edge joints are glued.
If edge joints in vertically laminated beams are not glued,shear strength could be reduced. The amount of reduction canbe determined by engineering analysis. Using standard lami-nating procedures with edge joints staggered in adjacentlaminations by at least one lamination thickness, shearstrength of vertically laminated beams with unglued edgejoints is approximately half that of beams with adhesive-bonded edge joints.
Effect of Shake, Checks, and Splits on Shear Strength—In general, checks and splits have little effect on the shearstrength of glulam. Shake occurs infrequently and should beexcluded from material for laminations. Most laminatedtimbers are made from laminations that are thin enough toseason readily without developing significant checks andsplits.
Designs for Glued-Laminated TimberMost basic engineering equations used for sawn lumber alsoapply to glulam beams and columns. The design of glulamin this chapter is only applicable to glulam combinationsthat conform to AITC 117 (AITC 1993b) for softwood spe-cies and AITC 119 (AITC 1996) for hardwood species andare manufactured in accordance with ANSI/AITC A190.1(ANSI 1992). The AITC 117 standard is made up of twoparts: (a) manufacturing, which provides details for the manyconfigurations of glulam made from visually graded andE-rated softwood lumber; and (b) design, which providestabular design values of strength and stiffness for these glu-lam combinations. The AITC 119 standard provides similarinformation for glulam made from hardwood species of lum-ber. These standards are based on laterally-braced straightmembers with an average moisture content of 12%. Forbending members, the design values are based on an as-sumed reference size of 305 mm deep, 130 mm wide, and6.4 m long (12 in. deep, 5.125 in. wide, and 21 ft long).
Tabular Design ValuesTabular design values given in AITC 117 and AITC 119include the following:
Fb allowable bending design value,
Ft allowable tension design value parallel to grain,
Fv allowable shear design value parallel to grain,
Fc-perp allowable compression design value perpendicular to grain,
Fc allowable compression design value parallelto grain,
E allowable modulus of elasticity, and
Frt allowable radial tension design valueperpendicular to grain.
Because glulam members can have different properties whenloaded perpendicular or parallel to the wide faces of the lami-nations, a common naming convention is used to specify thedesign values that correspond to a particular type of orienta-tion. For glulam members loaded perpendicular to the widefaces of the laminations, design values are commonly de-noted with a subscript x. For glulam members loaded paral-lel to the wide faces of the laminations, design values arecommonly denoted with a subscript y. Some examplesinclude Fbx and Ex for design bending stress and designmodulus of elasticity, respectively.
11–11
End-Use Adjustment FactorsWhen glulam members are exposed to conditions other thanthe described reference condition, the published allowabledesign values require adjustment. The following text de-scribes each of the adjustment factors that account for the end-use condition of glulam members.
Volume—The volume factor Cv accounts for an observedreduction in strength when length, width, and depth of struc-tural glulam members increase. This strength reduction isdue to the higher probability of occurrence of strength-reducing characteristics, such as knots and slope of grain, inhigher volume beams. This volume factor adjustment isgiven in the National Design Specification for WoodConstruction (AF&PA 1997) in the form
C
d w Lv =
305 130 6 40 10 0 10 0 10. . .
.(metric) (11–1a)
C
d w Lv =
12 5 125 210 10 0 10 0 10. . .
.(inch– pound) (11–1b)
for Douglas-fir and other species, and
C
d w Lv =
305 130 6 40 05 0 05 0 05. . .
.(metric) (11–2a)
C
d w Lv =
12 5 125 210 05 0 05 0 05. . .
.(inch–pound) (11–2b)
for southern pines, where d is depth (mm, in.), w width(mm, in.), and L length (m, ft). (Eqs. (11–1a) and (11–2a) inmetric, Eqs. (11–1b) and (11–2b) in inch–pound system.)
Moisture Content—The moisture content factor CM
accounts for the reduction in strength as moisture contentincreases. A moisture content adjustment is listed in bothASTM D3737 (ASTM 1997b) and AITC 117–Design(AITC 1993b).
CM = 1.0 for moisture content ≤16%
For moisture content >16%, as in ground contact and manyother exterior conditions, use the following CM values:
Fb Ft Fv Fc-perp Fc E
CM 0.8 0.8 0.875 0.53 0.73 0.833
Loading—An adjustment for the type of loading on themember is also necessary because the volume factors are
derived assuming a uniform load. This method of loadingfactor CL is recommended in the National DesignSpecification for Wood Construction (AF&PA 1997).
CL = 1.00 for uniform loading on a simple span
= 1.08 for center point loading on a simple span
= 0.92 for constant stress over the full length
For other loading conditions, values of CL can be estimatedusing the proportion of the beam length subjected to 80% ormore of the maximum stress L0 and
C
LL0
=
0 450 1
..
(11–3)
Tension Lamination—Past research has shown that specialprovisions are required for the tension lamination of a glulambeam to achieve the specified design bending strength levels.Properties listed in AITC 117 and 119 are applicable tobeams with these special tension laminations. If a specialtension lamination is not included in the beam combination,strength reduction factors must be applied. Tension lamina-tion factors CT, which can be found in ASTM D3737(ASTM 1997b), have the following values:
CT = 1.00 for special tension laminations per AITC 117
= 0.85 without tension laminations and for depth≤380 mm (≤15 in.)
= 0.75 without tension laminations and for depth>380 mm (>15 in.).
Curvature—The curvature factor accounts for the increasedstresses in the curved portion of curved glulam beams. Thisfactor does not apply to design values in the straight portionof a member, regardless of the curvature elsewhere. Thecurvature factor Cc, which can be found in the NationalDesign Specification (AF&PA 1997), has the followingrelation:
C
t
Rc = −
1 20002
(11–4)
where t is thickness of lamination and R is radius of curva-ture on inside face of lamination. The value t/R ≤ 1/100for hardwoods and southern pines; t/R ≤ 1/125 for othersoftwoods.
Flat Use—The flat use factor is applied to bending designvalues when members are loaded parallel to wide faces oflaminations and are less than 305 mm (12 in.) in depth. Flatuse factors Cfu, which can be found in the National DesignSpecification (AF&PA 1997), have the following values:
11–12
Lateral Stability—The lateral stability factor is applied tobending design values to account for the amount of lateralsupport applied to bending members. Deep bending mem-bers that are unsupported along the top surface are subject tolateral torsional buckling and would have lower bendingdesign values. Members that are fully supported would haveno adjustments (CL = 1.0).
Glued Members WithLumber and PanelsHighly efficient structural components can be produced bycombining lumber with panel products through gluing.These components, including box beams, I-beams,“stressed-skin” panels, and folded plate roofs, are discussedin detail in technical publications of the APA—The Engi-neered Wood Association (APA 1980). One type of member,prefabricated wood I-joists, is discussed in detail. Details onstructural design are given in the following portion of thischapter for beams with webs of structural panel products andstressed-skin panels wherein the parts are glued together witha rigid, durable adhesive.
These highly efficient designs, although adequate structur-ally, can suffer from lack of resistance to fire and decay unlesstreatment or protection is provided. The rather thin portionsof the cross section (the panel materials) are more vulnerableto fire damage than are the larger, solid cross sections.
Box Beams and I-BeamsBox beams and I-beams with lumber or laminated flangesand structural panel webs can be designed to provide thedesired stiffness, bending, moment resistance, and shearresistance. The flanges resist bending moment, and the websprovide primary shear resistance. Proper design requires thatthe webs must not buckle under design loads. If lateral sta-bility is a problem, the box beam design should be chosenbecause it is stiffer in lateral bending and torsion than is theI-beam. In contrast, the I-beam should be chosen if bucklingof the web is of concern because its single web, double thethickness of that of a box beam, will offer greater bucklingresistance.
Design details for beam cross sections (including definitionsof terms in the following equations) are presented inFigure 11–6. Both flanges in these beams are the samethickness because a construction symmetrical about theneutral plane provides the greatest moment of inertia for theamount of material used. The following equations werederived by basic principles of engineering mechanics.These methods can be extended to derive designs forunsymmetrical constructions, if necessary.
Beam DeflectionsBeam deflections can be computed using Equation (8–2) inChapter 8. The following equations for bending stiffness (EI)x
and shear stiffness GA′ apply to the box and I-beam shown inFigure 11–6. The bending stiffness is given by
( ) [ ( ) ]EI E d c b E Wdx = − +1
1223 3 3
w (11–5)
where E is flange modulus of elasticity and Ew is web modu-lus of elasticity. For plywood, values of Ew for the appropri-ate structural panel construction and grain direction can becomputed from Equations (11–1), (11–2), and (11–3).
An approximate expression for the shear stiffness is
GA WcG′ = 2 (11–6)
where G is shear modulus for the structural panel for appro-priate direction and A′ is the effective area of the web. Animprovement in shear stiffness can be made by properlyorienting the web, depending upon its directional properties.Equation (11–6) is conservative because it ignores the shearstiffness of the flange. This contribution can be included byuse of APA design methods that are based on Orosz (1970).(For further information on APA design methods, contactAPA—The Engineered Wood Association in Tacoma,Washington.)
Flange StressesFlange compressive and tensile stresses at outer beam fibersare given by
Member dimension parallelto wide faces of laminations Cfu
273 or 267 mm (10-3/4 or 10-1/2 in.) 1.01
222 or 216 mm (8-3/4 or 8-1/2 in.) 1.04
171 mm (6-3/4 in.) 1.07
130 or 127 mm (5-1/8 or 5 in.) 1.10
79 or 76 mm (3-1/8 or 3 in.) 1.16
64 mm (2-1/2 in.) 1.19
Figure 11–6. Beams with structural panel webs.
11–13
fM
d cbd
E WdE
x =− +
6
23 32
( w)
(11–7)
where M is bending moment.
Web Shear Stress
Web shear stress at the beam neutral plane is given by
f
VW
E d c b E Wd
E d c b E Wdxy = − +
− +
34
2
2
2 2 2
3 3 3
( )
( )w
w
(11–8)
where V is shear load. The shear stress must not exceedallowable values. To avoid web buckling, either the webshould be increased in thickness or the clear length of theweb should be broken by stiffeners glued to the web.
Web edgewise bending stresses at the inside of the flangescan be computed by
fM
EE
d cbc
dc
Wxw
w
=− +
6
23 33
( )
(11–9)
Although it is not likely, the web can buckle as a result ofbending stresses. Should buckling as a result of edgewisebending appear possible, the interaction of shear and edge-wise bending buckling can be examined using the principlesof Timoshenko (1961).
Lateral Buckling
Possible lateral buckling of the entire beam should bechecked by calculating the critical bending stress (Ch. 8,Lateral–Torsional Buckling section). The slenderness factorp, required to calculate this stress, includes terms for lateralflexural rigidity EIy and torsional rigidity GK that are definedas follows:
For box beams,
EI E d c b
E b W b d
y = −
+ + −
112
2
3
3 3
( )
[( ) ]w
(11–10)
GK
d c d c b W W
d c b W WG= + − +
− + +
( )( )( )
( ) ( )
2 2 2
2 2 4 (11–11)
For I-beams,
EI E b W W d c
E W d
y = + − −
+
112
2 2
2
3 3
3
{
}
[( ) ( ) ]( )
( )fw
(11–12)
GK d c b d W G= − +
13
14
23 3( ) ( ) (11–13)
where Efw is flexural elastic modulus of the web.
In Equations (11–11) and (11–13), the shear modulus G canbe assumed without great error to be about 1/16 of the flangemodulus of elasticity EL. The resultant torsional stiffness GKwill be slightly low if beam webs have plywood grain at 45°to the neutral axis. The lateral buckling of I-beams will alsobe slightly conservative because bending rigidity of theflange has been neglected in writing the equations given here.If buckling of the I-beam seems possible at design loads, themore accurate analysis of Forest Products Laboratory Report1318B (Lewis and others 1943) should be used beforeredesigning.
Stiffeners and Load Blocks
Determination of the number and sizes of stiffeners and loadblocks needed in a particular construction does not lend itselfto a rational procedure, but certain general rules can be giventhat will help the designer of a structure obtain a satisfactorystructural member. Stiffeners serve a dual purpose in a struc-tural member of this type. One function is to limit the size ofthe unsupported panel in the web, and the other is to restrainthe flanges from moving toward each other as the beam isstressed.
Stiffeners should be glued to the webs and in contact withboth flanges. A rational way of determining how thick thestiffener should be is not available, but tests of box beamsmade at the Forest Products Laboratory indicate that a thick-ness of at least six times the thickness of the web is suffi-cient. Because stiffeners must also resist the tendency of theflanges to move toward each other, the stiffeners should be aswide as (extend to the edge of) the flanges.
For plywood webs containing plies with the grain of thewood oriented both parallel and perpendicular to the axis ofthe member, the spacing of the stiffeners is relatively unim-portant for the web shear stresses that are allowed. Maximumallowable stresses are less than those that will produce buck-ling. A clear distance between stiffeners equal to or less thantwo times the clear distance between flanges is adequate.Load blocks are special stiffeners placed along the member atpoints of concentrated load. Load blocks should be designedso that stresses caused by a load that bears against the side-grain material in the flanges do not exceed the allowabledesign for the flange material in compression perpendicularto grain.
Prefabricated Wood I-JoistsIn recent years, the development of improved adhesives andmanufacturing techniques has led to the development of theprefabricated I-joist industry. This product is a unique typeof I-beam that is replacing wider lumber sizes in floor androof applications for both residential and commercial build-ings (Fig. 11–7).
Significant savings in materials are possible with prefabri-cated I-joists that use either plywood or oriented strandboard(OSB) for the web material and small dimension lumber orstructural composite lumber (SCL) for the flanges. The highquality lumber needed for these flanges has been difficult toobtain using visual grading methods, and both mechanically
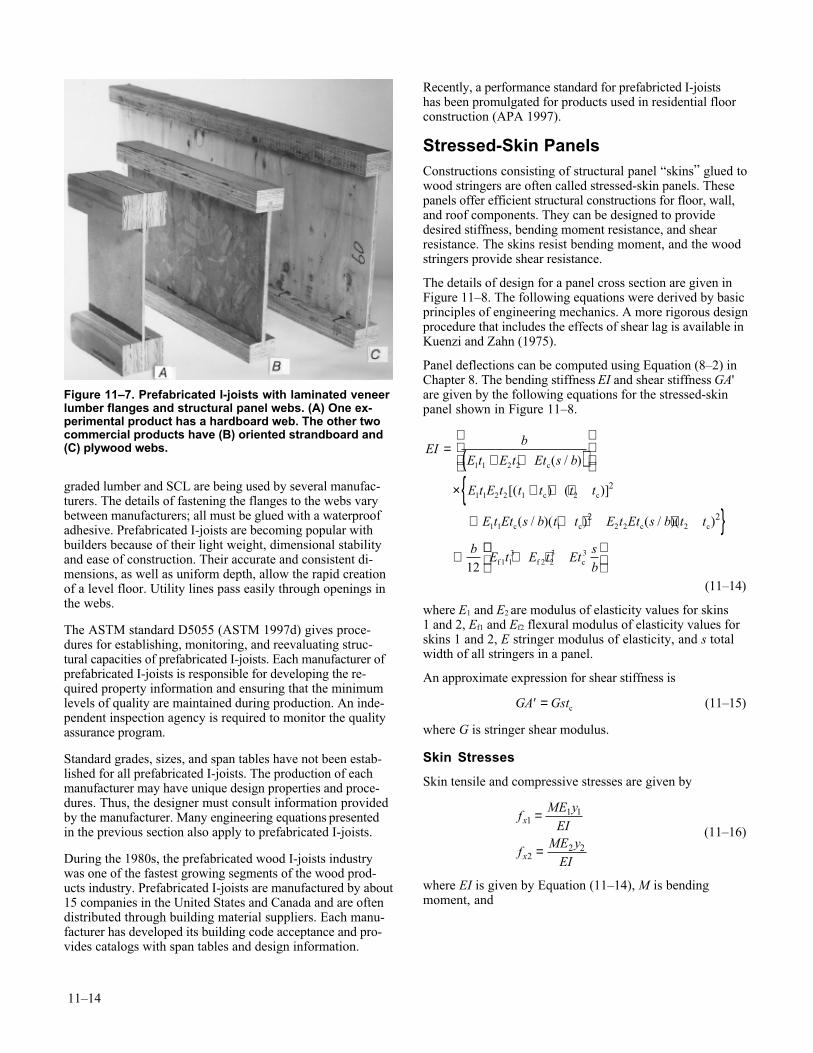
11–14
graded lumber and SCL are being used by several manufac-turers. The details of fastening the flanges to the webs varybetween manufacturers; all must be glued with a waterproofadhesive. Prefabricated I-joists are becoming popular withbuilders because of their light weight, dimensional stabilityand ease of construction. Their accurate and consistent di-mensions, as well as uniform depth, allow the rapid creationof a level floor. Utility lines pass easily through openings inthe webs.
The ASTM standard D5055 (ASTM 1997d) gives proce-dures for establishing, monitoring, and reevaluating struc-tural capacities of prefabricated I-joists. Each manufacturer ofprefabricated I-joists is responsible for developing the re-quired property information and ensuring that the minimumlevels of quality are maintained during production. An inde-pendent inspection agency is required to monitor the qualityassurance program.
Standard grades, sizes, and span tables have not been estab-lished for all prefabricated I-joists. The production of eachmanufacturer may have unique design properties and proce-dures. Thus, the designer must consult information providedby the manufacturer. Many engineering equations presentedin the previous section also apply to prefabricated I-joists.
During the 1980s, the prefabricated wood I-joists industrywas one of the fastest growing segments of the wood prod-ucts industry. Prefabricated I-joists are manufactured by about15 companies in the United States and Canada and are oftendistributed through building material suppliers. Each manu-facturer has developed its building code acceptance and pro-vides catalogs with span tables and design information.
Recently, a performance standard for prefabricted I-joistshas been promulgated for products used in residential floorconstruction (APA 1997).
Stressed-Skin PanelsConstructions consisting of structural panel “skins” glued towood stringers are often called stressed-skin panels. Thesepanels offer efficient structural constructions for floor, wall,and roof components. They can be designed to providedesired stiffness, bending moment resistance, and shearresistance. The skins resist bending moment, and the woodstringers provide shear resistance.
The details of design for a panel cross section are given inFigure 11–8. The following equations were derived by basicprinciples of engineering mechanics. A more rigorous designprocedure that includes the effects of shear lag is available inKuenzi and Zahn (1975).
Panel deflections can be computed using Equation (8–2) inChapter 8. The bending stiffness EI and shear stiffness GA'are given by the following equations for the stressed-skinpanel shown in Figure 11–8.
EIb
E t E t Et s b
E t E t t t t t
E t Et s b t t E t Et s b t t
bE t E t Et
sb
=+ +( )
× + + +{+ + + + }
+ + +
1 1 2 2
1 1 2 2 1 2
1 1 1 2 2 2
1 13
2 23 3
2
2 2
12
c
c c
c c c c
c
( / )
[( ) ( )]
( / )( ) ( / )( )
f f
(11–14)
where E1 and E2 are modulus of elasticity values for skins1 and 2, Ef1 and Ef2 flexural modulus of elasticity values forskins 1 and 2, E stringer modulus of elasticity, and s totalwidth of all stringers in a panel.
An approximate expression for shear stiffness is
GA Gst′ = c (11–15)
where G is stringer shear modulus.
Skin Stresses
Skin tensile and compressive stresses are given by
fME y
EI
fME y
EI
x
x
11 1
22 2
=
= (11–16)
where EI is given by Equation (11–14), M is bendingmoment, and
Figure 11–7. Prefabricated I-joists with laminated veneerlumber flanges and structural panel webs. (A) One ex-perimental product has a hardboard web. The other twocommercial products have (B) oriented strandboard and(C) plywood webs.
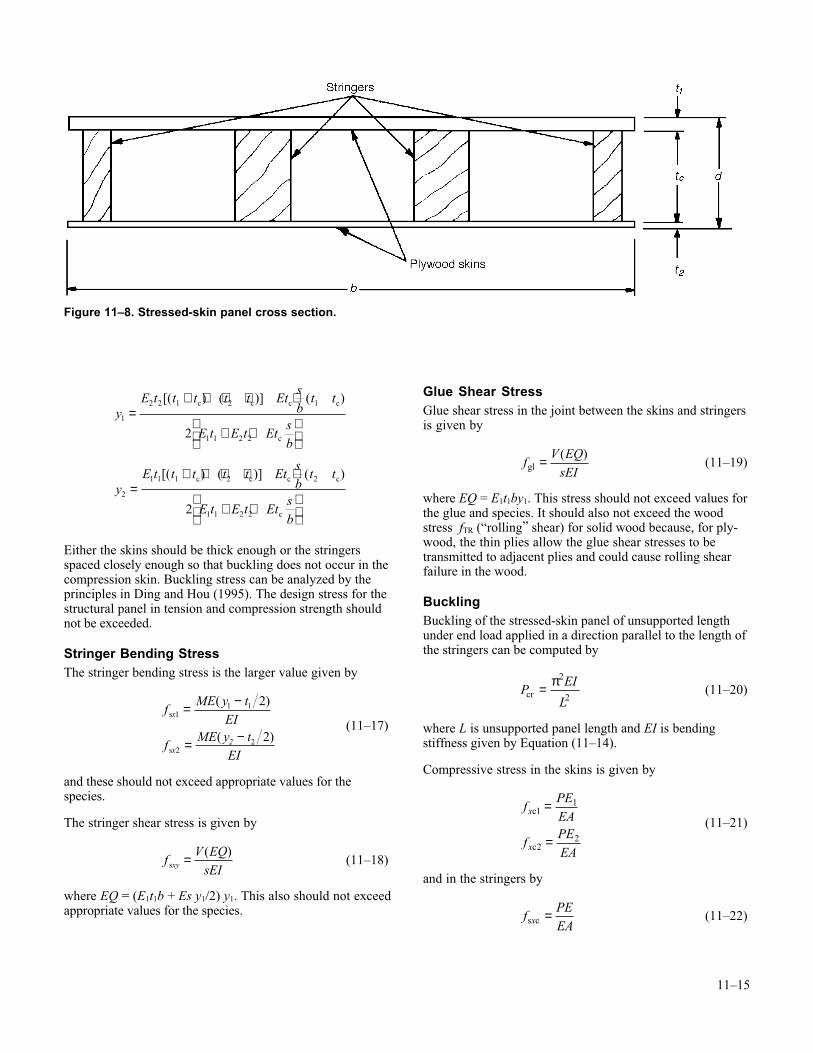
11–15
yE t t t t t Et
sb
t t
E t E t Etsb
yE t t t t t Et
sb
t t
E t E t Etsb
1
2 2 1 2 1
1 1 2 2
2
1 1 1 2 2
1 1 2 2
2
2
=+ + + + +
+ +
=+ + + + +
+ +
[( ) ( )] ( )
[( ) ( )] ( )
c c c c
c
c c c c
c
Either the skins should be thick enough or the stringersspaced closely enough so that buckling does not occur in thecompression skin. Buckling stress can be analyzed by theprinciples in Ding and Hou (1995). The design stress for thestructural panel in tension and compression strength shouldnot be exceeded.
Stringer Bending StressThe stringer bending stress is the larger value given by
fME y t
EI
fME y t
EI
x
x2
s
s
11 1
22
2
2
= −
= −
( )
( ) (11–17)
and these should not exceed appropriate values for thespecies.
The stringer shear stress is given by
f
V EQsEIxys = ( )
(11–18)
where EQ = (E1t1b + Es y1/2) y1. This also should not exceedappropriate values for the species.
Glue Shear StressGlue shear stress in the joint between the skins and stringersis given by
f
V EQsEIgl = ( )
(11–19)
where EQ = E1t1by1. This stress should not exceed values forthe glue and species. It should also not exceed the woodstress fTR (“rolling” shear) for solid wood because, for ply-wood, the thin plies allow the glue shear stresses to betransmitted to adjacent plies and could cause rolling shearfailure in the wood.
BucklingBuckling of the stressed-skin panel of unsupported lengthunder end load applied in a direction parallel to the length ofthe stringers can be computed by
P
EI
Lcr = π2
2 (11–20)
where L is unsupported panel length and EI is bendingstiffness given by Equation (11–14).
Compressive stress in the skins is given by
fPEEA
fPEEA
x
x
c
c
11
22
=
= (11–21)
and in the stringers by
f
PEEAxs c = (11–22)
Figure 11–8. Stressed-skin panel cross section.
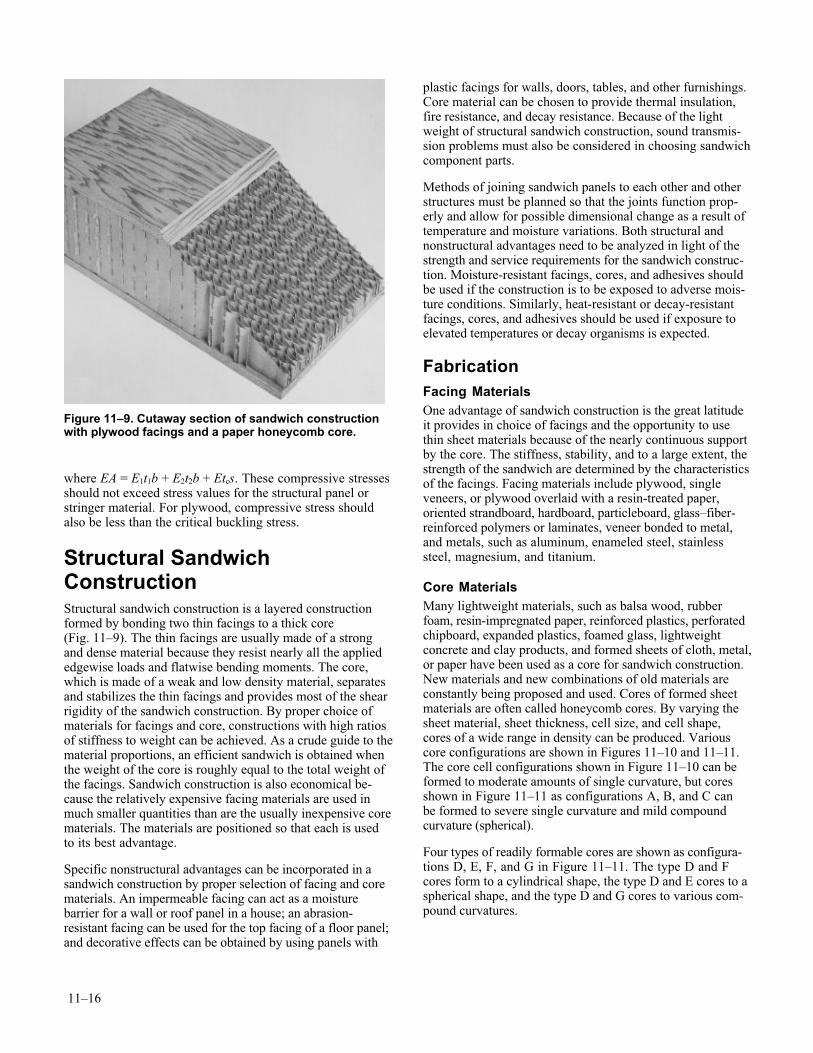
11–16
where EA = E1t1b + E2t2b + Etcs. These compressive stressesshould not exceed stress values for the structural panel orstringer material. For plywood, compressive stress shouldalso be less than the critical buckling stress.
Structural SandwichConstructionStructural sandwich construction is a layered constructionformed by bonding two thin facings to a thick core(Fig. 11–9). The thin facings are usually made of a strongand dense material because they resist nearly all the appliededgewise loads and flatwise bending moments. The core,which is made of a weak and low density material, separatesand stabilizes the thin facings and provides most of the shearrigidity of the sandwich construction. By proper choice ofmaterials for facings and core, constructions with high ratiosof stiffness to weight can be achieved. As a crude guide to thematerial proportions, an efficient sandwich is obtained whenthe weight of the core is roughly equal to the total weight ofthe facings. Sandwich construction is also economical be-cause the relatively expensive facing materials are used inmuch smaller quantities than are the usually inexpensive corematerials. The materials are positioned so that each is usedto its best advantage.
Specific nonstructural advantages can be incorporated in asandwich construction by proper selection of facing and corematerials. An impermeable facing can act as a moisturebarrier for a wall or roof panel in a house; an abrasion-resistant facing can be used for the top facing of a floor panel;and decorative effects can be obtained by using panels with
plastic facings for walls, doors, tables, and other furnishings.Core material can be chosen to provide thermal insulation,fire resistance, and decay resistance. Because of the lightweight of structural sandwich construction, sound transmis-sion problems must also be considered in choosing sandwichcomponent parts.
Methods of joining sandwich panels to each other and otherstructures must be planned so that the joints function prop-erly and allow for possible dimensional change as a result oftemperature and moisture variations. Both structural andnonstructural advantages need to be analyzed in light of thestrength and service requirements for the sandwich construc-tion. Moisture-resistant facings, cores, and adhesives shouldbe used if the construction is to be exposed to adverse mois-ture conditions. Similarly, heat-resistant or decay-resistantfacings, cores, and adhesives should be used if exposure toelevated temperatures or decay organisms is expected.
FabricationFacing MaterialsOne advantage of sandwich construction is the great latitudeit provides in choice of facings and the opportunity to usethin sheet materials because of the nearly continuous supportby the core. The stiffness, stability, and to a large extent, thestrength of the sandwich are determined by the characteristicsof the facings. Facing materials include plywood, singleveneers, or plywood overlaid with a resin-treated paper,oriented strandboard, hardboard, particleboard, glass–fiber-reinforced polymers or laminates, veneer bonded to metal,and metals, such as aluminum, enameled steel, stainlesssteel, magnesium, and titanium.
Core MaterialsMany lightweight materials, such as balsa wood, rubberfoam, resin-impregnated paper, reinforced plastics, perforatedchipboard, expanded plastics, foamed glass, lightweightconcrete and clay products, and formed sheets of cloth, metal,or paper have been used as a core for sandwich construction.New materials and new combinations of old materials areconstantly being proposed and used. Cores of formed sheetmaterials are often called honeycomb cores. By varying thesheet material, sheet thickness, cell size, and cell shape,cores of a wide range in density can be produced. Variouscore configurations are shown in Figures 11–10 and 11–11.The core cell configurations shown in Figure 11–10 can beformed to moderate amounts of single curvature, but coresshown in Figure 11–11 as configurations A, B, and C canbe formed to severe single curvature and mild compoundcurvature (spherical).
Four types of readily formable cores are shown as configura-tions D, E, F, and G in Figure 11–11. The type D and Fcores form to a cylindrical shape, the type D and E cores to aspherical shape, and the type D and G cores to various com-pound curvatures.
Figure 11–9. Cutaway section of sandwich constructionwith plywood facings and a paper honeycomb core.
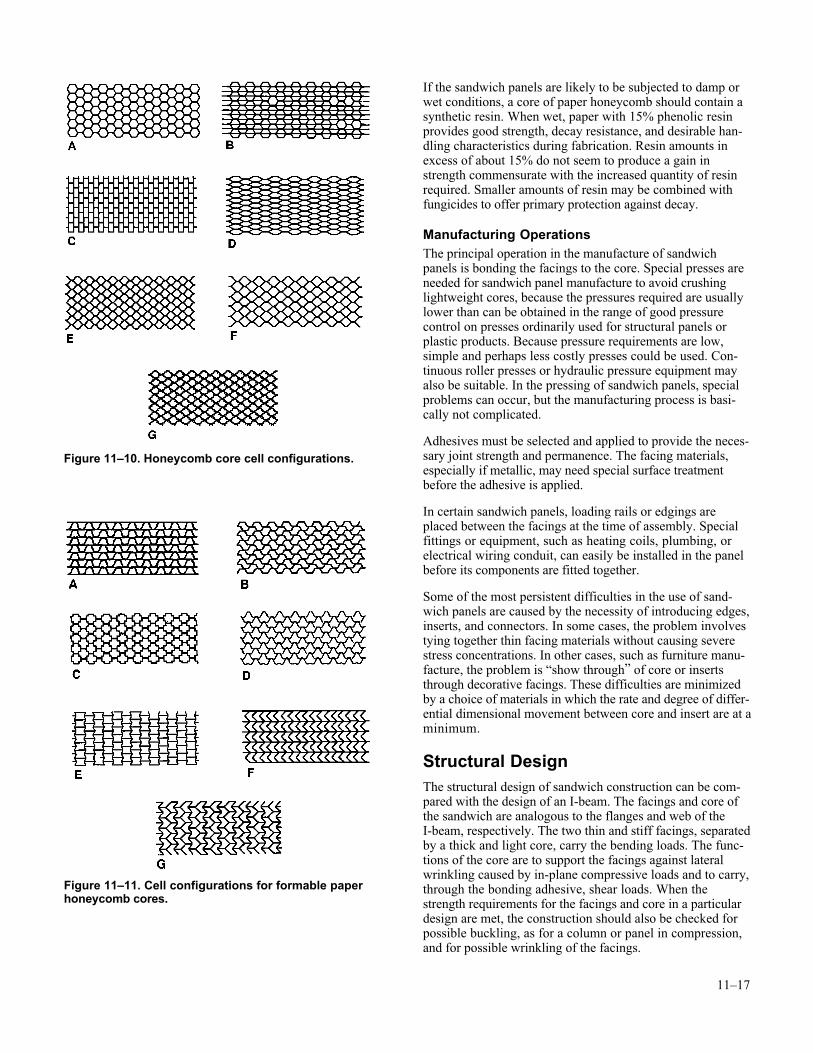
11–17
If the sandwich panels are likely to be subjected to damp orwet conditions, a core of paper honeycomb should contain asynthetic resin. When wet, paper with 15% phenolic resinprovides good strength, decay resistance, and desirable han-dling characteristics during fabrication. Resin amounts inexcess of about 15% do not seem to produce a gain instrength commensurate with the increased quantity of resinrequired. Smaller amounts of resin may be combined withfungicides to offer primary protection against decay.
Manufacturing OperationsThe principal operation in the manufacture of sandwichpanels is bonding the facings to the core. Special presses areneeded for sandwich panel manufacture to avoid crushinglightweight cores, because the pressures required are usuallylower than can be obtained in the range of good pressurecontrol on presses ordinarily used for structural panels orplastic products. Because pressure requirements are low,simple and perhaps less costly presses could be used. Con-tinuous roller presses or hydraulic pressure equipment mayalso be suitable. In the pressing of sandwich panels, specialproblems can occur, but the manufacturing process is basi-cally not complicated.
Adhesives must be selected and applied to provide the neces-sary joint strength and permanence. The facing materials,especially if metallic, may need special surface treatmentbefore the adhesive is applied.
In certain sandwich panels, loading rails or edgings areplaced between the facings at the time of assembly. Specialfittings or equipment, such as heating coils, plumbing, orelectrical wiring conduit, can easily be installed in the panelbefore its components are fitted together.
Some of the most persistent difficulties in the use of sand-wich panels are caused by the necessity of introducing edges,inserts, and connectors. In some cases, the problem involvestying together thin facing materials without causing severestress concentrations. In other cases, such as furniture manu-facture, the problem is “show through” of core or insertsthrough decorative facings. These difficulties are minimizedby a choice of materials in which the rate and degree of differ-ential dimensional movement between core and insert are at aminimum.
Structural DesignThe structural design of sandwich construction can be com-pared with the design of an I-beam. The facings and core ofthe sandwich are analogous to the flanges and web of theI-beam, respectively. The two thin and stiff facings, separatedby a thick and light core, carry the bending loads. The func-tions of the core are to support the facings against lateralwrinkling caused by in-plane compressive loads and to carry,through the bonding adhesive, shear loads. When thestrength requirements for the facings and core in a particulardesign are met, the construction should also be checked forpossible buckling, as for a column or panel in compression,and for possible wrinkling of the facings.
Figure 11–10. Honeycomb core cell configurations.
Figure 11–11. Cell configurations for formable paperhoneycomb cores.
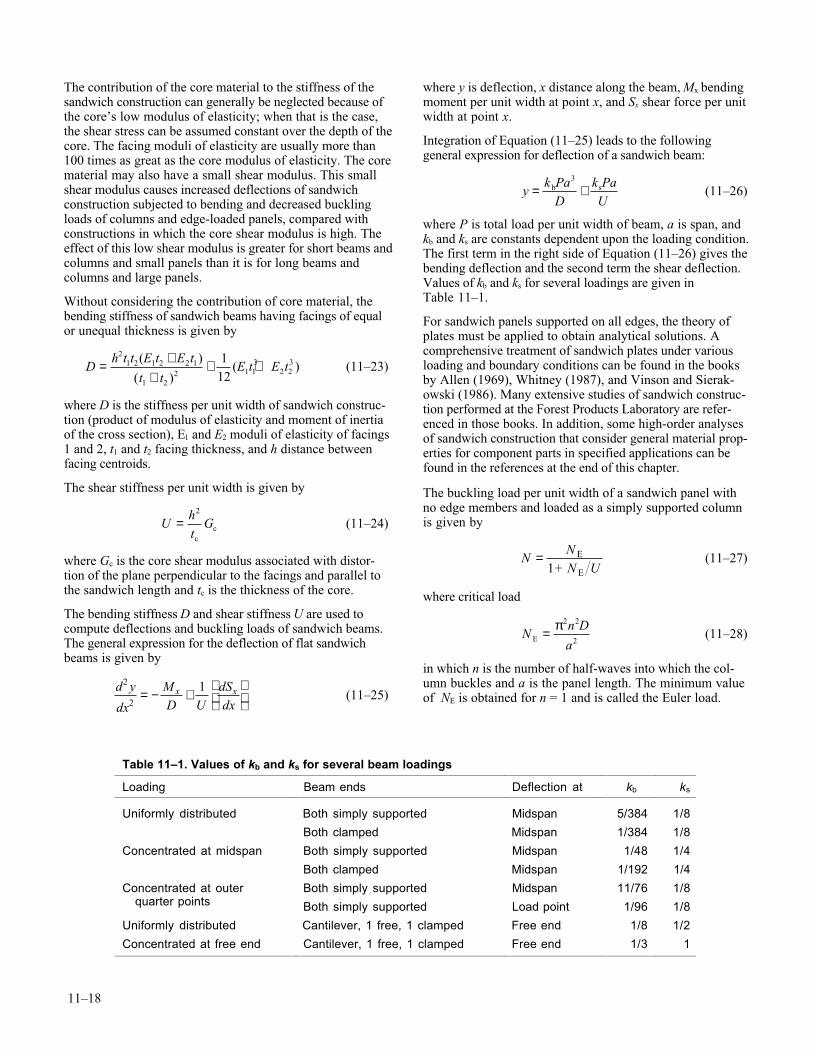
11–18
The contribution of the core material to the stiffness of thesandwich construction can generally be neglected because ofthe core’s low modulus of elasticity; when that is the case,the shear stress can be assumed constant over the depth of thecore. The facing moduli of elasticity are usually more than100 times as great as the core modulus of elasticity. The corematerial may also have a small shear modulus. This smallshear modulus causes increased deflections of sandwichconstruction subjected to bending and decreased bucklingloads of columns and edge-loaded panels, compared withconstructions in which the core shear modulus is high. Theeffect of this low shear modulus is greater for short beams andcolumns and small panels than it is for long beams andcolumns and large panels.
Without considering the contribution of core material, thebending stiffness of sandwich beams having facings of equalor unequal thickness is given by
D
h t t E t E t
t tE t E t= +
++ +
21 2 1 2 2 1
1 22 1 1
32 2
3112
( )
( )( ) (11–23)
where D is the stiffness per unit width of sandwich construc-tion (product of modulus of elasticity and moment of inertiaof the cross section), E1 and E2 moduli of elasticity of facings1 and 2, t1 and t2 facing thickness, and h distance betweenfacing centroids.
The shear stiffness per unit width is given by
U
ht
G=2
cc (11–24)
where Gc is the core shear modulus associated with distor-tion of the plane perpendicular to the facings and parallel tothe sandwich length and tc is the thickness of the core.
The bending stiffness D and shear stiffness U are used tocompute deflections and buckling loads of sandwich beams.The general expression for the deflection of flat sandwichbeams is given by
d y
dx
MD U
dSdx
x x2
2
1= − +
(11–25)
where y is deflection, x distance along the beam, Mx bendingmoment per unit width at point x, and Sx shear force per unitwidth at point x.
Integration of Equation (11–25) leads to the followinggeneral expression for deflection of a sandwich beam:
y
k PaD
k PaU
= +b s3
(11–26)
where P is total load per unit width of beam, a is span, andkb and ks are constants dependent upon the loading condition.The first term in the right side of Equation (11–26) gives thebending deflection and the second term the shear deflection.Values of kb and ks for several loadings are given inTable 11–1.
For sandwich panels supported on all edges, the theory ofplates must be applied to obtain analytical solutions. Acomprehensive treatment of sandwich plates under variousloading and boundary conditions can be found in the booksby Allen (1969), Whitney (1987), and Vinson and Sierak-owski (1986). Many extensive studies of sandwich construc-tion performed at the Forest Products Laboratory are refer-enced in those books. In addition, some high-order analysesof sandwich construction that consider general material prop-erties for component parts in specified applications can befound in the references at the end of this chapter.
The buckling load per unit width of a sandwich panel withno edge members and loaded as a simply supported columnis given by
N
N+ N U
= E
1 E
(11–27)
where critical load
N
n D
aE = π2 2
2 (11–28)
in which n is the number of half-waves into which the col-umn buckles and a is the panel length. The minimum valueof NE is obtained for n = 1 and is called the Euler load.
Table 11–1. Values of kb and ks for several beam loadings
Loading Beam ends Deflection at kb ks
Uniformly distributed Both simply supported Midspan 5/384 1/8
Both clamped Midspan 1/384 1/8
Concentrated at midspan Both simply supported Midspan 1/48 1/4
Both clamped Midspan 1/192 1/4
Concentrated at outer quarter points
Both simply supported
Both simply supported
Midspan
Load point
11/76
1/96
1/8
1/8
Uniformly distributed Cantilever, 1 free, 1 clamped Free end 1/8 1/2
Concentrated at free end Cantilever, 1 free, 1 clamped Free end 1/3 1
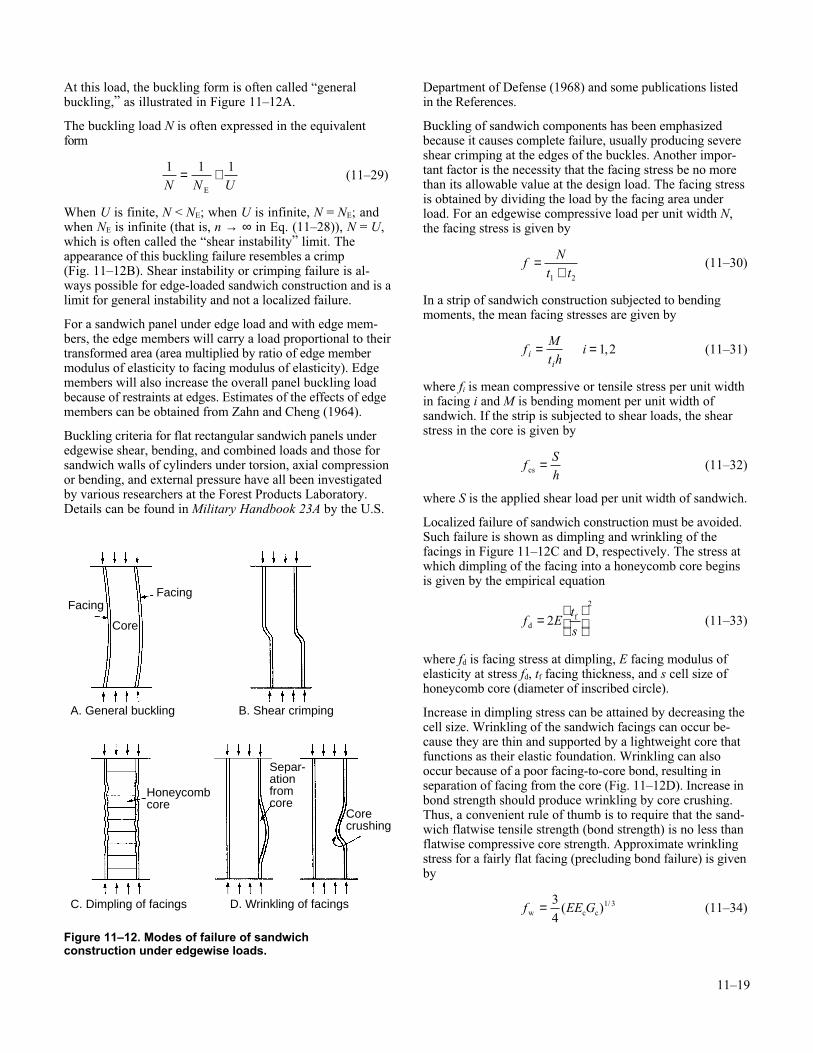
11–19
At this load, the buckling form is often called “generalbuckling,” as illustrated in Figure 11–12A.
The buckling load N is often expressed in the equivalentform
1 1 1N N U
= +E
(11–29)
When U is finite, N < NE; when U is infinite, N = NE; andwhen NE is infinite (that is, n → ∞ in Eq. (11–28)), N = U,which is often called the “shear instability” limit. Theappearance of this buckling failure resembles a crimp(Fig. 11–12B). Shear instability or crimping failure is al-ways possible for edge-loaded sandwich construction and is alimit for general instability and not a localized failure.
For a sandwich panel under edge load and with edge mem-bers, the edge members will carry a load proportional to theirtransformed area (area multiplied by ratio of edge membermodulus of elasticity to facing modulus of elasticity). Edgemembers will also increase the overall panel buckling loadbecause of restraints at edges. Estimates of the effects of edgemembers can be obtained from Zahn and Cheng (1964).
Buckling criteria for flat rectangular sandwich panels underedgewise shear, bending, and combined loads and those forsandwich walls of cylinders under torsion, axial compressionor bending, and external pressure have all been investigatedby various researchers at the Forest Products Laboratory.Details can be found in Military Handbook 23A by the U.S.
Department of Defense (1968) and some publications listedin the References.
Buckling of sandwich components has been emphasizedbecause it causes complete failure, usually producing severeshear crimping at the edges of the buckles. Another impor-tant factor is the necessity that the facing stress be no morethan its allowable value at the design load. The facing stressis obtained by dividing the load by the facing area underload. For an edgewise compressive load per unit width N,the facing stress is given by
f
Nt t
=+1 2
(11–30)
In a strip of sandwich construction subjected to bendingmoments, the mean facing stresses are given by
f
Mt h
iii
= =1 2, (11–31)
where fi is mean compressive or tensile stress per unit widthin facing i and M is bending moment per unit width ofsandwich. If the strip is subjected to shear loads, the shearstress in the core is given by
f
Shcs = (11–32)
where S is the applied shear load per unit width of sandwich.
Localized failure of sandwich construction must be avoided.Such failure is shown as dimpling and wrinkling of thefacings in Figure 11–12C and D, respectively. The stress atwhich dimpling of the facing into a honeycomb core beginsis given by the empirical equation
f E
t
sdf=
22
(11–33)
where fd is facing stress at dimpling, E facing modulus ofelasticity at stress fd, tf facing thickness, and s cell size ofhoneycomb core (diameter of inscribed circle).
Increase in dimpling stress can be attained by decreasing thecell size. Wrinkling of the sandwich facings can occur be-cause they are thin and supported by a lightweight core thatfunctions as their elastic foundation. Wrinkling can alsooccur because of a poor facing-to-core bond, resulting inseparation of facing from the core (Fig. 11–12D). Increase inbond strength should produce wrinkling by core crushing.Thus, a convenient rule of thumb is to require that the sand-wich flatwise tensile strength (bond strength) is no less thanflatwise compressive core strength. Approximate wrinklingstress for a fairly flat facing (precluding bond failure) is givenby
f EE Gw c c= 3
41 3( ) / (11–34)
Corecrushing
Facing
Core
Facing
Honeycombcore
Separ-ationfromcore
A. General buckling B. Shear crimping
C. Dimpling of facings D. Wrinkling of facings
Figure 11–12. Modes of failure of sandwichconstruction under edgewise loads.
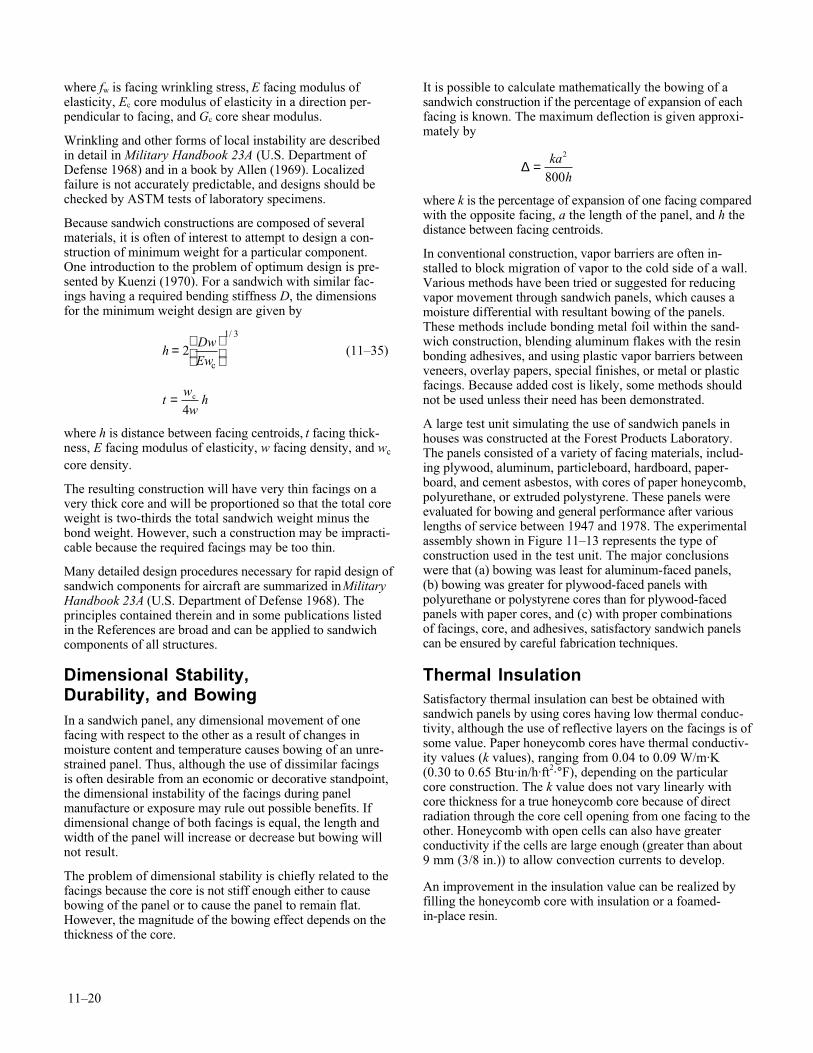
11–20
where fw is facing wrinkling stress, E facing modulus ofelasticity, Ec core modulus of elasticity in a direction per-pendicular to facing, and Gc core shear modulus.
Wrinkling and other forms of local instability are describedin detail in Military Handbook 23A (U.S. Department ofDefense 1968) and in a book by Allen (1969). Localizedfailure is not accurately predictable, and designs should bechecked by ASTM tests of laboratory specimens.
Because sandwich constructions are composed of severalmaterials, it is often of interest to attempt to design a con-struction of minimum weight for a particular component.One introduction to the problem of optimum design is pre-sented by Kuenzi (1970). For a sandwich with similar fac-ings having a required bending stiffness D, the dimensionsfor the minimum weight design are given by
h
DwEw
=
21 3
c
/
(11–35)
t
ww
h= c
4
where h is distance between facing centroids, t facing thick-ness, E facing modulus of elasticity, w facing density, and wc
core density.
The resulting construction will have very thin facings on avery thick core and will be proportioned so that the total coreweight is two-thirds the total sandwich weight minus thebond weight. However, such a construction may be impracti-cable because the required facings may be too thin.
Many detailed design procedures necessary for rapid design ofsandwich components for aircraft are summarized in MilitaryHandbook 23A (U.S. Department of Defense 1968). Theprinciples contained therein and in some publications listedin the References are broad and can be applied to sandwichcomponents of all structures.
Dimensional Stability,Durability, and BowingIn a sandwich panel, any dimensional movement of onefacing with respect to the other as a result of changes inmoisture content and temperature causes bowing of an unre-strained panel. Thus, although the use of dissimilar facingsis often desirable from an economic or decorative standpoint,the dimensional instability of the facings during panelmanufacture or exposure may rule out possible benefits. Ifdimensional change of both facings is equal, the length andwidth of the panel will increase or decrease but bowing willnot result.
The problem of dimensional stability is chiefly related to thefacings because the core is not stiff enough either to causebowing of the panel or to cause the panel to remain flat.However, the magnitude of the bowing effect depends on thethickness of the core.
It is possible to calculate mathematically the bowing of asandwich construction if the percentage of expansion of eachfacing is known. The maximum deflection is given approxi-mately by
∆ = ka
h
2
800
where k is the percentage of expansion of one facing comparedwith the opposite facing, a the length of the panel, and h thedistance between facing centroids.
In conventional construction, vapor barriers are often in-stalled to block migration of vapor to the cold side of a wall.Various methods have been tried or suggested for reducingvapor movement through sandwich panels, which causes amoisture differential with resultant bowing of the panels.These methods include bonding metal foil within the sand-wich construction, blending aluminum flakes with the resinbonding adhesives, and using plastic vapor barriers betweenveneers, overlay papers, special finishes, or metal or plasticfacings. Because added cost is likely, some methods shouldnot be used unless their need has been demonstrated.
A large test unit simulating the use of sandwich panels inhouses was constructed at the Forest Products Laboratory.The panels consisted of a variety of facing materials, includ-ing plywood, aluminum, particleboard, hardboard, paper-board, and cement asbestos, with cores of paper honeycomb,polyurethane, or extruded polystyrene. These panels wereevaluated for bowing and general performance after variouslengths of service between 1947 and 1978. The experimentalassembly shown in Figure 11–13 represents the type ofconstruction used in the test unit. The major conclusionswere that (a) bowing was least for aluminum-faced panels,(b) bowing was greater for plywood-faced panels withpolyurethane or polystyrene cores than for plywood-facedpanels with paper cores, and (c) with proper combinationsof facings, core, and adhesives, satisfactory sandwich panelscan be ensured by careful fabrication techniques.
Thermal InsulationSatisfactory thermal insulation can best be obtained withsandwich panels by using cores having low thermal conduc-tivity, although the use of reflective layers on the facings is ofsome value. Paper honeycomb cores have thermal conductiv-ity values (k values), ranging from 0.04 to 0.09 W/m·K(0.30 to 0.65 Btu·in/h·ft2·°F), depending on the particularcore construction. The k value does not vary linearly withcore thickness for a true honeycomb core because of directradiation through the core cell opening from one facing to theother. Honeycomb with open cells can also have greaterconductivity if the cells are large enough (greater than about9 mm (3/8 in.)) to allow convection currents to develop.
An improvement in the insulation value can be realized byfilling the honeycomb core with insulation or a foamed-in-place resin.
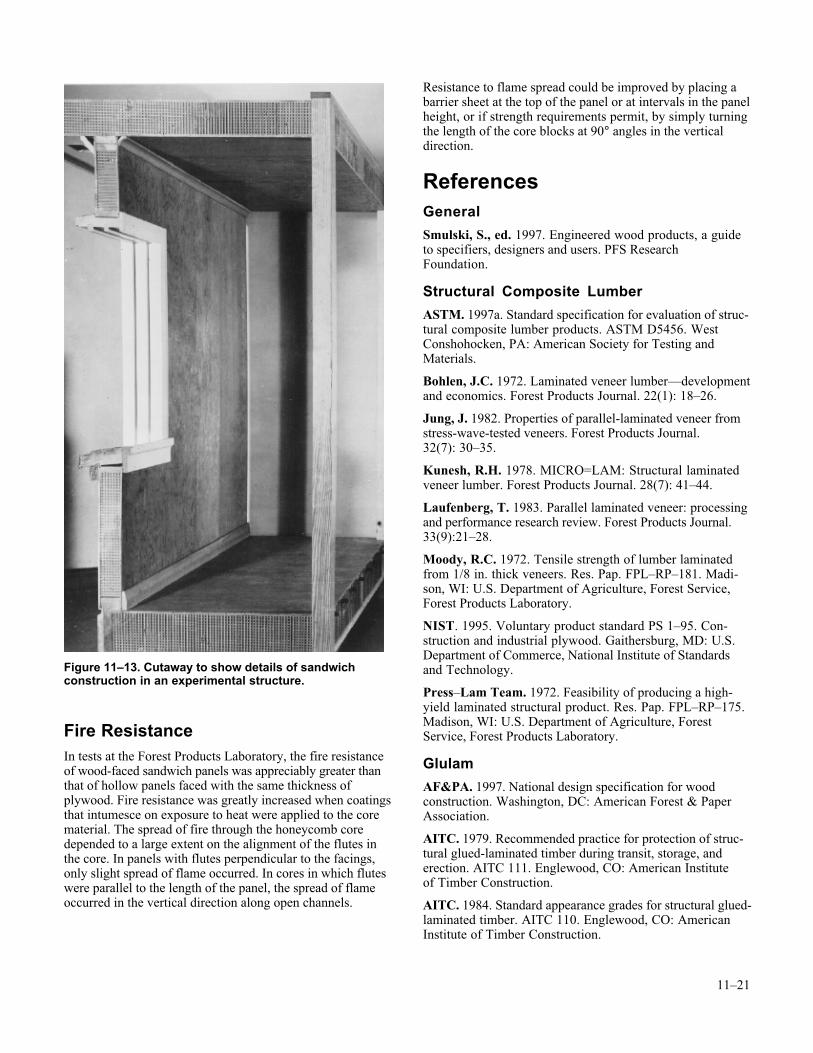
11–21
Fire ResistanceIn tests at the Forest Products Laboratory, the fire resistanceof wood-faced sandwich panels was appreciably greater thanthat of hollow panels faced with the same thickness ofplywood. Fire resistance was greatly increased when coatingsthat intumesce on exposure to heat were applied to the corematerial. The spread of fire through the honeycomb coredepended to a large extent on the alignment of the flutes inthe core. In panels with flutes perpendicular to the facings,only slight spread of flame occurred. In cores in which fluteswere parallel to the length of the panel, the spread of flameoccurred in the vertical direction along open channels.
Resistance to flame spread could be improved by placing abarrier sheet at the top of the panel or at intervals in the panelheight, or if strength requirements permit, by simply turningthe length of the core blocks at 90° angles in the verticaldirection.
ReferencesGeneral
Smulski, S., ed. 1997. Engineered wood products, a guideto specifiers, designers and users. PFS ResearchFoundation.
Structural Composite Lumber
ASTM. 1997a. Standard specification for evaluation of struc-tural composite lumber products. ASTM D5456. WestConshohocken, PA: American Society for Testing andMaterials.
Bohlen, J.C. 1972. Laminated veneer lumber—developmentand economics. Forest Products Journal. 22(1): 18–26.
Jung, J. 1982. Properties of parallel-laminated veneer fromstress-wave-tested veneers. Forest Products Journal.32(7): 30–35.
Kunesh, R.H. 1978. MICRO=LAM: Structural laminatedveneer lumber. Forest Products Journal. 28(7): 41–44.
Laufenberg, T. 1983. Parallel laminated veneer: processingand performance research review. Forest Products Journal.33(9):21–28.
Moody, R.C. 1972. Tensile strength of lumber laminatedfrom 1/8 in. thick veneers. Res. Pap. FPL–RP–181. Madi-son, WI: U.S. Department of Agriculture, Forest Service,Forest Products Laboratory.
NIST. 1995. Voluntary product standard PS 1–95. Con-struction and industrial plywood. Gaithersburg, MD: U.S.Department of Commerce, National Institute of Standardsand Technology.
Press–Lam Team. 1972. Feasibility of producing a high-yield laminated structural product. Res. Pap. FPL–RP–175.Madison, WI: U.S. Department of Agriculture, ForestService, Forest Products Laboratory.
Glulam
AF&PA. 1997. National design specification for woodconstruction. Washington, DC: American Forest & PaperAssociation.
AITC. 1979. Recommended practice for protection of struc-tural glued-laminated timber during transit, storage, anderection. AITC 111. Englewood, CO: American Instituteof Timber Construction.
AITC. 1984. Standard appearance grades for structural glued-laminated timber. AITC 110. Englewood, CO: AmericanInstitute of Timber Construction.
Figure 11–13. Cutaway to show details of sandwichconstruction in an experimental structure.
11–22
AITC. 1990. Standard for preservative treatment of structuralglued-laminated timber. AITC 109. Englewood, CO:American Institute of Timber Construction.
AITC. 1993a. Inspection manual. AITC 200. Englewood,CO: American Institute of Timber Construction.
AITC. 1993b. Standard specifications for structural glued-laminated timber of softwood species. AITC 117. Engle-wood, CO: American Institute of Timber Construction.
AITC. 1994. Timber construction manual. American Insti-tute of Timber Construction. 4th ed. New York: John Wiley& Sons.
AITC. 1996. Standard specifications for structural glued-laminated timber of hardwood species. AITC 119. Engle-wood, CO: American Institute of Timber Construction.
ANSI. 1992. Structural glued laminated timber.ANSI/AITC A190.1. New York: American NationalStandards Institute.
ANSI. 1996. Structural glued laminated timber for utilitystructures. ANSI O5.2. New York: American NationalStandards Institute.
ASCE. 1975. Wood structures, a design guide and commen-tary. New York: American Society of Civil Engineers.
ASCE. 1982. Evaluation, maintenance and upgrading ofwood structures. New York: American Society of CivilEngineers.
ASTM. 1997b. Standard practice for establishing stresses forstructural glued-laminated timber (glulam). ASTM D3737.Philadelphia, PA: American Society for Testing andMaterials.
ASTM. 1997c. Standard practice for establishing structuralgrades and related allowable properties for visually gradedlumber. ASTM D245. Philadelphia, PA: American Societyfor Testing and Materials.
AWPA. 1997a. Standards for solvents and formulations fororganic preservative system. P9. Woodstock, MD: AmericanWood Preservers’ Association.
AWPA. 1997b. Standards for waterborne preservatives. P5.Woodstock, MD: American Wood Preservers’ Association.
CSA. 1989. Structural glued-laminated timbers. CAN/CSAO122. Rexdale, ON: Canadian Standards Association.
CSA. 1994. Engineering design of wood (limit state design).CAN/CSA O86. Rexdale, ON: Canadian StandardsAssociation.
Freas, A.D.; Selbo, M.L. 1954. Fabrication and design ofglued laminated wood structural members. U.S. Departmentof Agriculture Tech. Bull. 1069. Available from: Engle-wood, CO: American Institute of Timber Construction.
Jokerst, R.W. 1981. Finger-jointed wood products. Res.Pap. FPL–RP–382. Madison, WI: U.S. Department ofAgriculture, Forest Service, Forest Products Laboratory.
Moody, R.C. 1977. Improved utilization of lumber in gluedlaminated beams. Res. Pap. FPL–RP–292. Madison, WI:U.S. Department of Agriculture, Forest Service, ForestProducts Laboratory.
Peterson, J.; Madson, G.; Moody, R.C. 1981. Tensilestrength of one-, two-, and three-ply glulam members of 2 by6 Douglas-fir. Forest Products Journal. 31(1): 42–48.
Selbo, M.L.; Knauss, A.C.; Worth, H.E. 1965. After twodecades of service, glulam timbers show good performance.Forest Products Journal. 15(11): 466–472.
Wolfe, R.W.; Moody, R.C. 1979. Bending strength ofvertically glued laminated beams with one to five plies. Res.Pap. FPL–RP–333. Madison, WI: U.S. Department ofAgriculture, Forest Service, Forest Products Laboratory.
Glued Members With Lumber and Panels
APA. 1980. Plywood Design Specification. Tacoma, WA:APA—The Engineered Wood Association.
Supp. 1. Design and fabrication of plywood curved panels
Supp. 2. Design and fabrication of plywood-lumber beams
Supp. 3. Design and fabrication of plywood stressed-skinpanels
Supp. 4. Design and fabrication of plywood sandwichpanels
APA. 1997. Performance standard for I-joists used in residen-tial floor construction. PRI–400. Tacoma, WA: APA—TheEngineered Wood Association.
ASTM. 1997d. Standard specification for establishing andmonitoring structural capacities of prefabricated wood I-joists. ASTM D5055. West Conshohocken, PA: AmericanSociety for Testing and Materials.
ASTM. 1997e. Standard methods for testing veneer, ply-wood, and other glued veneer constructions. ASTM D805.West Conshohocken, PA: American Society for Testing andMaterials.
Ding, Y.; Hou, J. 1995. General buckling analysis of sand-wich constructions. Computers & Structures. 55(3):485–493.
Forest Products Laboratory. 1943. Design of plywoodwebs for box beams. FPL Rep. 1318. Madison, WI: U.S.Department of Agriculture, Forest Service, Forest ProductsLaboratory.
Kuenzi, E.W.; Zahn, J.J. 1975. Stressed-skin panel deflec-tion and stresses. Res. Pap. FPL–RP–251. Madison, WI:U.S. Department of Agriculture, Forest Service, ForestProducts Laboratory.
Lewis, W.C.; Heebink, T.B.; Cottingham, W.S.;Dawley, E.R. 1943. Buckling in shear webs of box and I-beams and their effect upon design criteria. FPL Rep. 1318B.Madison, WI: U.S. Department of Agriculture, ForestService, Forest Products Laboratory.
11–23
Lewis, W.C.; Heebink, T.B.; Cottingham, W.S. 1944.Effects of certain defects and stress concentrating factors onthe strength of tension flanges of box beams. FPL Rep.1513. Madison, WI: U.S. Department of Agriculture, ForestService, Forest Products Laboratory.
Lewis, W.C.; Heebink, T.B.; Cottingham, W. S. 1945.Effect of increased moisture on the shear strength at glue linesof box beams and on the glue–shear and glue–tensionstrengths of small specimens. FPL Rep. 1551. Madison,WI: U.S. Department of Agriculture, Forest Service, ForestProducts Laboratory.
McNatt, J.D. 1980. Hardboard-webbed beams: Research andapplication. Forest Products Journal. 30(10): 57–64.
Orosz, I. 1970. Simplified method for calculating sheardeflections of beams. Res. Note FPL–RN–0210. Madison,WI: U.S. Department of Agriculture, Forest Service, ForestProducts Laboratory.
Superfesky, M.J.; Ramaker, T.J. 1976. Hardboard-webbedI-beams subjected to short-term loading. Res. Pap. FPL–RP–264. Madison, WI: U.S. Department of Agriculture,Forest Service, Forest Products Laboratory.
Superfesky, M.J.; Ramaker, T.J. 1978. Hardboard-webbedI-beams: Effects of long-term loading and loading environ-ment. Res. Pap. FPL–RP–306. Madison, WI: U.S. Depart-ment of Agriculture, Forest Service, Forest ProductsLaboratory.
Timoshenko, S. 1961. Theory of elastic stability. 2d ed.New York: McGraw–Hill.
Structural Sandwich Construction
Allen, H.G. 1969. Analysis and design of structural sand-wich panels. Oxford, England: Pergamon.
ASTM. 1997f. Annual book of ASTM standards. ASTMSection 15, Vol. 03. Philadelphia, PA: American Society forTesting and Materials.
C271–88. Density of core materials for structural sandwichconstructions
C273–88. Shear properties in flatwise plane of flatsandwich constructions or sandwich core
C297–88. Tensile strength of flat sandwich constructionsin flatwise plane
C363–88. Delamination strength of honeycomb type corematerial
C364–88. Compressive strength, edgewise, of flatsandwich constructions
C365–88. Compressive strength, flatwise, of sandwichcores
C366–88. Thickness of sandwich cores, measurement of
C393–88. Flexural properties of flat sandwichconstructions
C394–88. Shear fatigue of sandwich core materials
C480–88. Flexure-creep of sandwich constructions
C481–88. Laboratory aging of sandwich constructions
Cheng, S. 1961. Torsion of sandwich plates of trapezoidalcross section. Journal of Applied Mechanics, AmericanSociety of Mechanical Engineers Transactions. 28(3):363–366.
Hall, R.B. 1996. Performance limits for stiffness-criticalgraphitic foam structures. Pt. II. Comparisons of foams,foam-core and honeycomb-core sandwiches in bending/shear.Journal of Composite Materials. 30(17): 1938–1956.
Holmes, C.A. 1978. Room corner-wall fire tests of somestructural sandwich panels and components. Journalof Fire and Flammability. 9: 467–488.
Holmes, C.A.; Eickner, H.W.; Brenden, J.J. [andothers]. 1980. Fire development and wall endurance insandwich and wood-frame structures. Res. Pap. FPL–RP–364. Madison, WI: U.S. Department of Agriculture, ForestService, Forest Products Laboratory.
Karlsson, K.F.; Astrom, B.T. 1997. Manufacturing andapplications of structural sandwich components. Composites,Part A: Applied Science and Manufacturing. 28(2): 88–97.
Kimel, W.R. 1956. Elastic buckling of a simply supportedrectangular sandwich panel subjected to combined edgewisebending and compression- results for panels with facings ofeither equal or unequal thickness and with orthotropic cores.FPL Rep. 1857-A. Madison, WI: U.S. Department of Agri-culture, Forest Service, Forest Products Laboratory.
Krajcinovic, D. 1972. Sandwich beam analysis. Journal ofApplied Mechanics, American Society of MechanicalEngineers Transactions. 39(3): 773–778.
Kuenzi, E.W. 1970. Minimum weight structural sandwich.Res. Note FPL–086. Madison, WI: U.S. Department ofAgriculture, Forest Service, Forest Products Laboratory.
Kuenzi, E.W.; Ericksen, W.S.; Zahn, J.J. 1962. Shearstability of flat panels of sandwich construction. FPL Rep.1560. (Rev.) Madison, WI: U.S. Department of Agriculture,Forest Service, Forest Products Laboratory.
Kuenzi, E.W.; Bohannan, B.; Stevens, G.H. 1965. Buck-ling coefficients for sandwich cylinders of finite length underuniform external later pressure. Res. Note FPL–RN–0104.Madison, WI: U.S. Department of Agriculture, Forest Serv-ice, Forest Products Laboratory.
Noor, A.K.; Burton, W.S.; Bert, C.W. 1996. Computa-tional models for sandwich panels and shells. AppliedMechanics Reviews. 49(3): 155–199.
Palms, J.; Sherwood, G.E. 1979. Structural sandwichperformance after 31 years of service. Res. Pap. FPL–RP–342. Madison, WI: U.S. Department of Agriculture, ForestService, Forest Products Laboratory.
11–24
Plantema, F.J. 1966. Sandwich construction. New York,NY: John Wiley.
Reddy, J.N.; Miravete, A. 1995. Practical analysis of com-posite laminates. Boca Raton, FL: CRC Press, Inc.
Seidl, R.J. 1952. Paper honeycomb cores for structuralsandwich panels. FPL Rep. R1918. Madison, WI: U.S.Department of Agriculture, Forest Service, Forest ProductsLaboratory.
Sherwood, G.E. 1970. Longtime performance of sandwichpanels in Forest Products Laboratory experimental unit. Res.Pap. FPL–RP–144. Madison, WI: U.S. Department ofAgriculture, Forest Service, Forest Products Laboratory.
U.S. Department of Defense. 1968. Structural sandwichcomposites. Military Handbook 23A. Washington, DC:Superintendent of Documents.
Vinson, J.R.; Sierakowski, R.L. 1986. The behavior ofstructures composed of composite materials. MartinusNijhoff.
Whitney, J.M. 1987. Structural analysis of laminatedanisotropic plates. Lancaster, PA: Technomic PublishingCo., Inc.
Zahn, J.J.; Cheng, S. 1964. Edgewise compressivebuckling of flat sandwich panels: Loaded ends simplysupported and sides supported by beams. Res. NoteFPL–RN–019. Madison, WI: U.S. Department ofAgriculture, Forest Service, Forest Products Laboratory.
Zheng, Shiying; Yao, J. 1995. Exact solution of sandwichbeams. Applied Mathematics and Mechanics. 16(6):539–548.

FromForest Products Laboratory. 1999. Wood handbook—Wood as an engineering material.Gen. Tech. Rep. FPL–GTR–113. Madison, WI: U.S. Department of Agriculture, Forest Service,Forest Products Laboratory. 463 p.
12–1
Drying and Control of MoistureContent and Dimensional ChangesWilliam T. Simpson
Chapter 12
Contents
Determination of Moisture Content 12–1Oven-Drying Method 12–2Electrical Method 12–2
Recommended Moisture Content 12–3Timbers 12–3Lumber 12–3Glued Wood Products 12–3
Drying of Wood 12–5Air Drying 12–6Accelerated Air Drying and Pre-Drying 12–6Kiln Drying 12–6Drying Mechanism 12–6Drying Stresses 12–7Dry Kilns 12–7Kiln Schedules 12–8Drying Defects 12–9Moisture Content of Dried Lumber 12–10
Moisture Control During Transit and Storage 12–14Plywood and Structural Items 12–14Finish and Factory Lumber 12–15
Dimensional Changes in Wood 12–15Estimation Using Dimensional Change Coefficient 12–15Calculation Based on Green Dimensions 12–17
Design Factors Affecting Dimensional Change 12–18Framing Lumber in House Construction 12–18Heavy Timber Construction 12–18Interior Finish 12–18Flooring 12–18
Wood Care and Installation During Construction 12–18Lumber and Trusses 12–18Exterior Trim and Millwork 12–19Finished Flooring 12–19Interior Finish 12–19Plastering 12–19
References 12–20
n the living tree, wood contains large quantities ofwater. As green wood dries, most of the water isremoved. The moisture remaining in the wood
tends to come to equilibrium with the relative humidity ofthe surrounding air. Correct drying, handling, and storage ofwood will minimize moisture content changes that mightoccur after drying when the wood is in service and suchchanges are undesirable. If moisture content is controlledwithin reasonable limits by such methods, major problemsfrom dimensional changes can usually be avoided.
The discussion in this chapter is concerned with moisturecontent determination, recommended moisture content val-ues, drying methods, methods of calculating dimensionalchanges, design factors affecting such changes in structures,and moisture content control during transit, storage, andconstruction. Data on green moisture content, fiber saturationpoint, shrinkage, and equilibrium moisture content are givenwith information on other physical properties in Chapter 3.
Wood in service is virtually always undergoing at leastslight changes in moisture content. Changes in response todaily humidity changes are small and usually of no conse-quence. Changes that occur as a result of seasonal variation,although gradual, tend to be of more concern. Protectivecoatings can retard dimensional changes in wood but do notprevent them. In general, no significant dimensional changeswill occur if wood is fabricated or installed at a moisturecontent corresponding to the average atmospheric conditionsto which it will be exposed. When incompletely dried mate-rial is used in construction, some minor dimensionalchanges can be tolerated if the proper design is used.
Determination ofMoisture ContentThe amount of moisture in wood is ordinarily expressed as apercentage of the weight of the wood when ovendry. Fourmethods of determining moisture content are covered inASTM D4442. Two of these—the oven-drying and theelectrical methods—are described in this chapter.
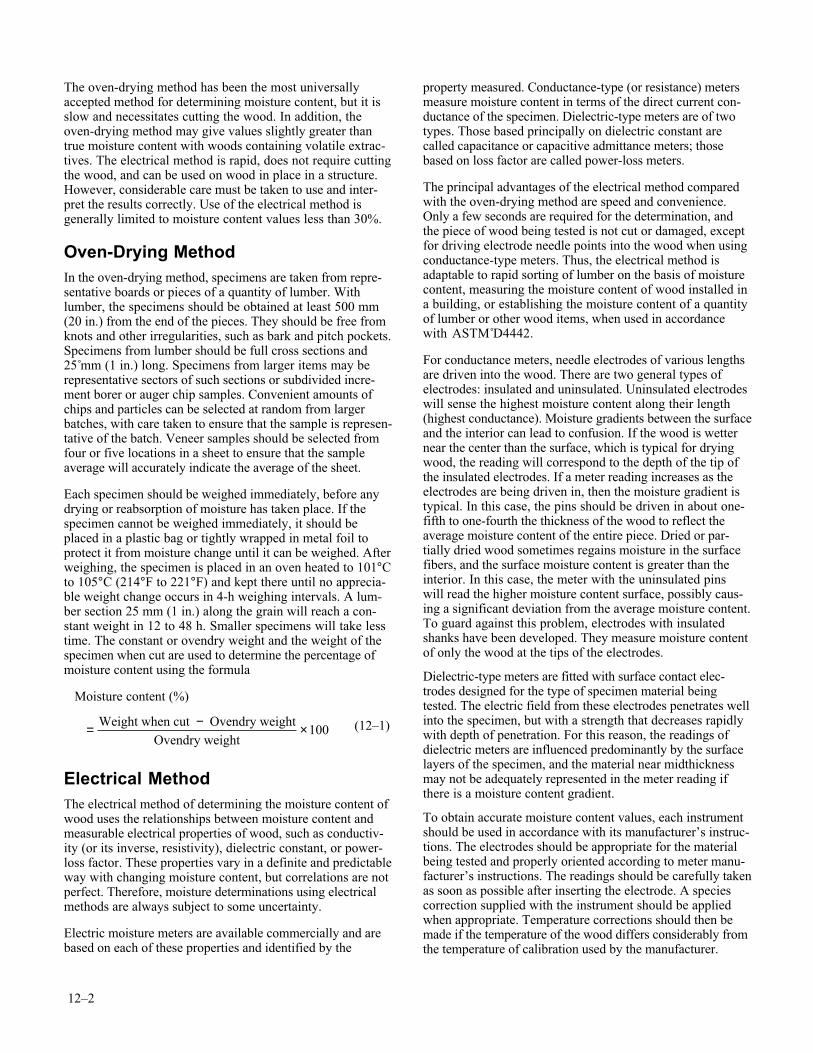
12–2
The oven-drying method has been the most universallyaccepted method for determining moisture content, but it isslow and necessitates cutting the wood. In addition, theoven-drying method may give values slightly greater thantrue moisture content with woods containing volatile extrac-tives. The electrical method is rapid, does not require cuttingthe wood, and can be used on wood in place in a structure.However, considerable care must be taken to use and inter-pret the results correctly. Use of the electrical method isgenerally limited to moisture content values less than 30%.
Oven-Drying MethodIn the oven-drying method, specimens are taken from repre-sentative boards or pieces of a quantity of lumber. Withlumber, the specimens should be obtained at least 500 mm(20 in.) from the end of the pieces. They should be free fromknots and other irregularities, such as bark and pitch pockets.Specimens from lumber should be full cross sections and25 mm (1 in.) long. Specimens from larger items may berepresentative sectors of such sections or subdivided incre-ment borer or auger chip samples. Convenient amounts ofchips and particles can be selected at random from largerbatches, with care taken to ensure that the sample is represen-tative of the batch. Veneer samples should be selected fromfour or five locations in a sheet to ensure that the sampleaverage will accurately indicate the average of the sheet.
Each specimen should be weighed immediately, before anydrying or reabsorption of moisture has taken place. If thespecimen cannot be weighed immediately, it should beplaced in a plastic bag or tightly wrapped in metal foil toprotect it from moisture change until it can be weighed. Afterweighing, the specimen is placed in an oven heated to 101°Cto 105°C (214°F to 221°F) and kept there until no apprecia-ble weight change occurs in 4-h weighing intervals. A lum-ber section 25 mm (1 in.) along the grain will reach a con-stant weight in 12 to 48 h. Smaller specimens will take lesstime. The constant or ovendry weight and the weight of thespecimen when cut are used to determine the percentage ofmoisture content using the formula
Moisture content (%)
= − ×Weight when cut Ovendry weight
Ovendry weight100 (12–1)
Electrical MethodThe electrical method of determining the moisture content ofwood uses the relationships between moisture content andmeasurable electrical properties of wood, such as conductiv-ity (or its inverse, resistivity), dielectric constant, or power-loss factor. These properties vary in a definite and predictableway with changing moisture content, but correlations are notperfect. Therefore, moisture determinations using electricalmethods are always subject to some uncertainty.
Electric moisture meters are available commercially and arebased on each of these properties and identified by the
property measured. Conductance-type (or resistance) metersmeasure moisture content in terms of the direct current con-ductance of the specimen. Dielectric-type meters are of twotypes. Those based principally on dielectric constant arecalled capacitance or capacitive admittance meters; thosebased on loss factor are called power-loss meters.
The principal advantages of the electrical method comparedwith the oven-drying method are speed and convenience.Only a few seconds are required for the determination, andthe piece of wood being tested is not cut or damaged, exceptfor driving electrode needle points into the wood when usingconductance-type meters. Thus, the electrical method isadaptable to rapid sorting of lumber on the basis of moisturecontent, measuring the moisture content of wood installed ina building, or establishing the moisture content of a quantityof lumber or other wood items, when used in accordancewith ASTM D4442.
For conductance meters, needle electrodes of various lengthsare driven into the wood. There are two general types ofelectrodes: insulated and uninsulated. Uninsulated electrodeswill sense the highest moisture content along their length(highest conductance). Moisture gradients between the surfaceand the interior can lead to confusion. If the wood is wetternear the center than the surface, which is typical for dryingwood, the reading will correspond to the depth of the tip ofthe insulated electrodes. If a meter reading increases as theelectrodes are being driven in, then the moisture gradient istypical. In this case, the pins should be driven in about one-fifth to one-fourth the thickness of the wood to reflect theaverage moisture content of the entire piece. Dried or par-tially dried wood sometimes regains moisture in the surfacefibers, and the surface moisture content is greater than theinterior. In this case, the meter with the uninsulated pinswill read the higher moisture content surface, possibly caus-ing a significant deviation from the average moisture content.To guard against this problem, electrodes with insulatedshanks have been developed. They measure moisture contentof only the wood at the tips of the electrodes.
Dielectric-type meters are fitted with surface contact elec-trodes designed for the type of specimen material beingtested. The electric field from these electrodes penetrates wellinto the specimen, but with a strength that decreases rapidlywith depth of penetration. For this reason, the readings ofdielectric meters are influenced predominantly by the surfacelayers of the specimen, and the material near midthicknessmay not be adequately represented in the meter reading ifthere is a moisture content gradient.
To obtain accurate moisture content values, each instrumentshould be used in accordance with its manufacturer’s instruc-tions. The electrodes should be appropriate for the materialbeing tested and properly oriented according to meter manu-facturer’s instructions. The readings should be carefully takenas soon as possible after inserting the electrode. A speciescorrection supplied with the instrument should be appliedwhen appropriate. Temperature corrections should then bemade if the temperature of the wood differs considerably fromthe temperature of calibration used by the manufacturer.
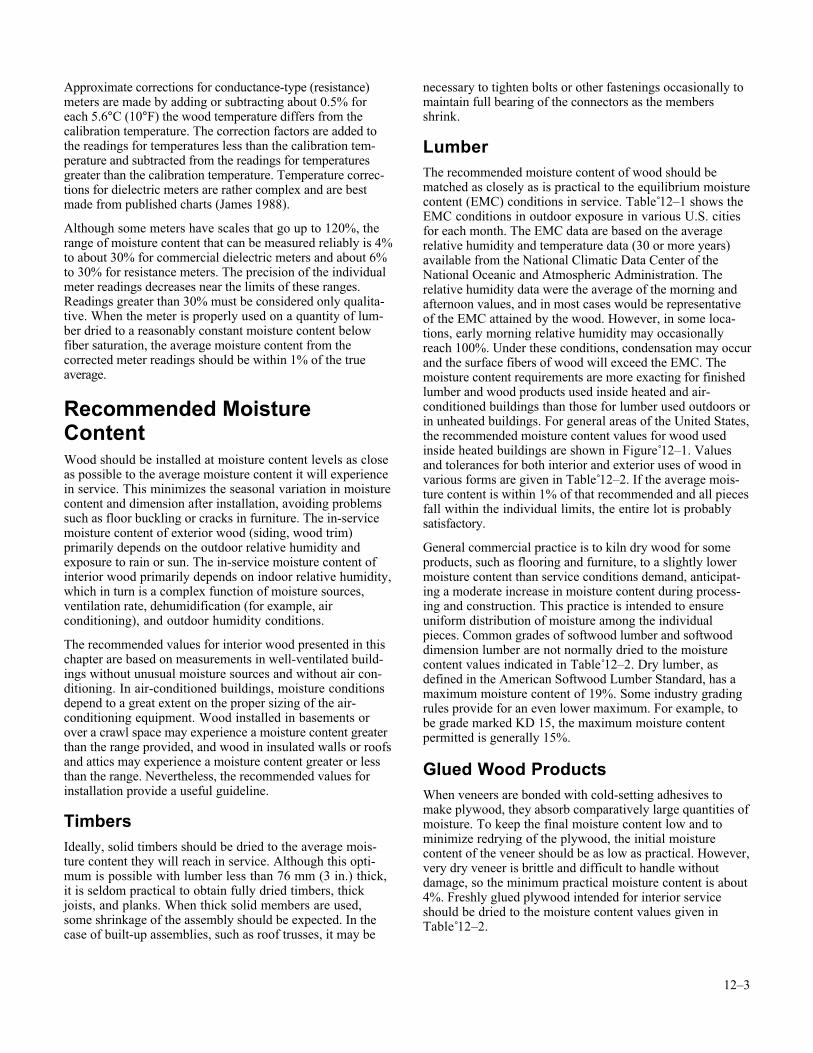
12–3
Approximate corrections for conductance-type (resistance)meters are made by adding or subtracting about 0.5% foreach 5.6°C (10°F) the wood temperature differs from thecalibration temperature. The correction factors are added tothe readings for temperatures less than the calibration tem-perature and subtracted from the readings for temperaturesgreater than the calibration temperature. Temperature correc-tions for dielectric meters are rather complex and are bestmade from published charts (James 1988).
Although some meters have scales that go up to 120%, therange of moisture content that can be measured reliably is 4%to about 30% for commercial dielectric meters and about 6%to 30% for resistance meters. The precision of the individualmeter readings decreases near the limits of these ranges.Readings greater than 30% must be considered only qualita-tive. When the meter is properly used on a quantity of lum-ber dried to a reasonably constant moisture content belowfiber saturation, the average moisture content from thecorrected meter readings should be within 1% of the trueaverage.
Recommended MoistureContentWood should be installed at moisture content levels as closeas possible to the average moisture content it will experiencein service. This minimizes the seasonal variation in moisturecontent and dimension after installation, avoiding problemssuch as floor buckling or cracks in furniture. The in-servicemoisture content of exterior wood (siding, wood trim)primarily depends on the outdoor relative humidity andexposure to rain or sun. The in-service moisture content ofinterior wood primarily depends on indoor relative humidity,which in turn is a complex function of moisture sources,ventilation rate, dehumidification (for example, airconditioning), and outdoor humidity conditions.
The recommended values for interior wood presented in thischapter are based on measurements in well-ventilated build-ings without unusual moisture sources and without air con-ditioning. In air-conditioned buildings, moisture conditionsdepend to a great extent on the proper sizing of the air-conditioning equipment. Wood installed in basements orover a crawl space may experience a moisture content greaterthan the range provided, and wood in insulated walls or roofsand attics may experience a moisture content greater or lessthan the range. Nevertheless, the recommended values forinstallation provide a useful guideline.
TimbersIdeally, solid timbers should be dried to the average mois-ture content they will reach in service. Although this opti-mum is possible with lumber less than 76 mm (3 in.) thick,it is seldom practical to obtain fully dried timbers, thickjoists, and planks. When thick solid members are used,some shrinkage of the assembly should be expected. In thecase of built-up assemblies, such as roof trusses, it may be
necessary to tighten bolts or other fastenings occasionally tomaintain full bearing of the connectors as the membersshrink.
LumberThe recommended moisture content of wood should bematched as closely as is practical to the equilibrium moisturecontent (EMC) conditions in service. Table 12–1 shows theEMC conditions in outdoor exposure in various U.S. citiesfor each month. The EMC data are based on the averagerelative humidity and temperature data (30 or more years)available from the National Climatic Data Center of theNational Oceanic and Atmospheric Administration. Therelative humidity data were the average of the morning andafternoon values, and in most cases would be representativeof the EMC attained by the wood. However, in some loca-tions, early morning relative humidity may occasionallyreach 100%. Under these conditions, condensation may occurand the surface fibers of wood will exceed the EMC. Themoisture content requirements are more exacting for finishedlumber and wood products used inside heated and air-conditioned buildings than those for lumber used outdoors orin unheated buildings. For general areas of the United States,the recommended moisture content values for wood usedinside heated buildings are shown in Figure 12–1. Valuesand tolerances for both interior and exterior uses of wood invarious forms are given in Table 12–2. If the average mois-ture content is within 1% of that recommended and all piecesfall within the individual limits, the entire lot is probablysatisfactory.
General commercial practice is to kiln dry wood for someproducts, such as flooring and furniture, to a slightly lowermoisture content than service conditions demand, anticipat-ing a moderate increase in moisture content during process-ing and construction. This practice is intended to ensureuniform distribution of moisture among the individualpieces. Common grades of softwood lumber and softwooddimension lumber are not normally dried to the moisturecontent values indicated in Table 12–2. Dry lumber, asdefined in the American Softwood Lumber Standard, has amaximum moisture content of 19%. Some industry gradingrules provide for an even lower maximum. For example, tobe grade marked KD 15, the maximum moisture contentpermitted is generally 15%.
Glued Wood ProductsWhen veneers are bonded with cold-setting adhesives tomake plywood, they absorb comparatively large quantities ofmoisture. To keep the final moisture content low and tominimize redrying of the plywood, the initial moisturecontent of the veneer should be as low as practical. However,very dry veneer is brittle and difficult to handle withoutdamage, so the minimum practical moisture content is about4%. Freshly glued plywood intended for interior serviceshould be dried to the moisture content values given inTable 12–2.
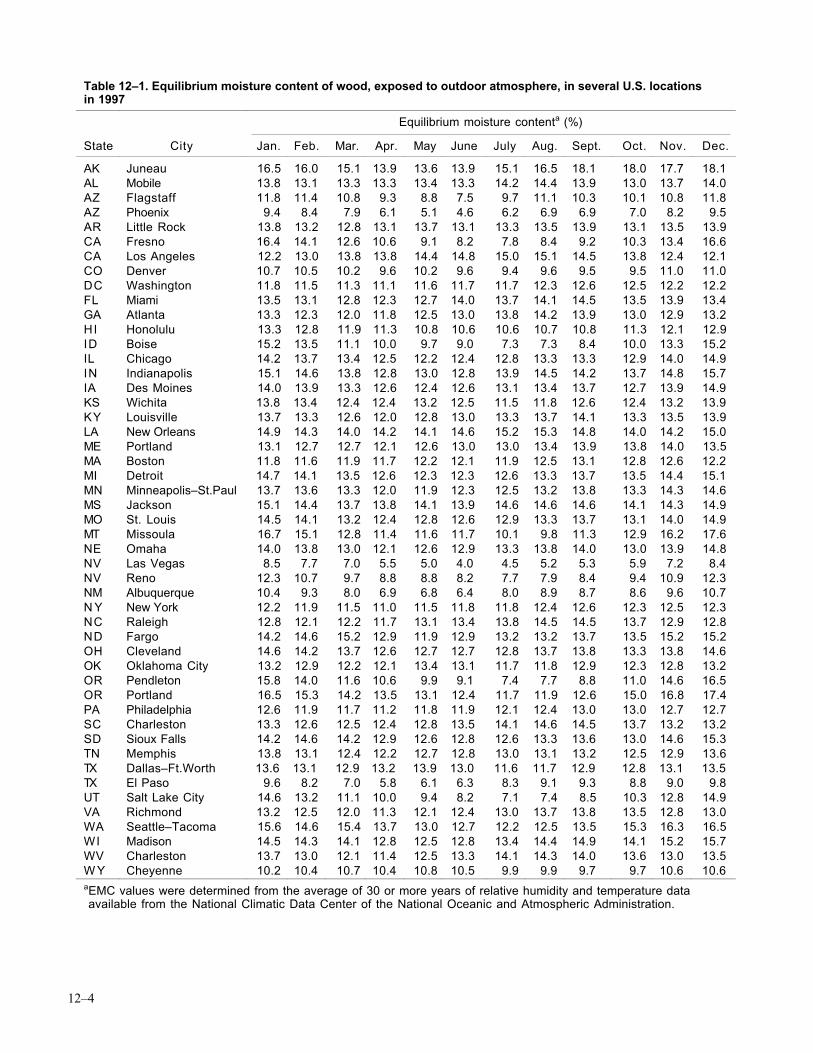
12–4
Table 12–1. Equilibrium moisture content of wood, exposed to outdoor atmosphere, in several U.S. locationsin 1997
Equilibrium moisture contenta (%)
State City Jan. Feb. Mar. Apr. May June July Aug. Sept. Oct. Nov. Dec.
AK Juneau 16.5 16.0 15.1 13.9 13.6 13.9 15.1 16.5 18.1 18.0 17.7 18.1AL Mobile 13.8 13.1 13.3 13.3 13.4 13.3 14.2 14.4 13.9 13.0 13.7 14.0AZ Flagstaff 11.8 11.4 10.8 9.3 8.8 7.5 9.7 11.1 10.3 10.1 10.8 11.8AZ Phoenix 9.4 8.4 7.9 6.1 5.1 4.6 6.2 6.9 6.9 7.0 8.2 9.5AR Little Rock 13.8 13.2 12.8 13.1 13.7 13.1 13.3 13.5 13.9 13.1 13.5 13.9CA Fresno 16.4 14.1 12.6 10.6 9.1 8.2 7.8 8.4 9.2 10.3 13.4 16.6CA Los Angeles 12.2 13.0 13.8 13.8 14.4 14.8 15.0 15.1 14.5 13.8 12.4 12.1CO Denver 10.7 10.5 10.2 9.6 10.2 9.6 9.4 9.6 9.5 9.5 11.0 11.0DC Washington 11.8 11.5 11.3 11.1 11.6 11.7 11.7 12.3 12.6 12.5 12.2 12.2FL Miami 13.5 13.1 12.8 12.3 12.7 14.0 13.7 14.1 14.5 13.5 13.9 13.4GA Atlanta 13.3 12.3 12.0 11.8 12.5 13.0 13.8 14.2 13.9 13.0 12.9 13.2HI Honolulu 13.3 12.8 11.9 11.3 10.8 10.6 10.6 10.7 10.8 11.3 12.1 12.9ID Boise 15.2 13.5 11.1 10.0 9.7 9.0 7.3 7.3 8.4 10.0 13.3 15.2IL Chicago 14.2 13.7 13.4 12.5 12.2 12.4 12.8 13.3 13.3 12.9 14.0 14.9IN Indianapolis 15.1 14.6 13.8 12.8 13.0 12.8 13.9 14.5 14.2 13.7 14.8 15.7IA Des Moines 14.0 13.9 13.3 12.6 12.4 12.6 13.1 13.4 13.7 12.7 13.9 14.9KS Wichita 13.8 13.4 12.4 12.4 13.2 12.5 11.5 11.8 12.6 12.4 13.2 13.9KY Louisville 13.7 13.3 12.6 12.0 12.8 13.0 13.3 13.7 14.1 13.3 13.5 13.9LA New Orleans 14.9 14.3 14.0 14.2 14.1 14.6 15.2 15.3 14.8 14.0 14.2 15.0ME Portland 13.1 12.7 12.7 12.1 12.6 13.0 13.0 13.4 13.9 13.8 14.0 13.5MA Boston 11.8 11.6 11.9 11.7 12.2 12.1 11.9 12.5 13.1 12.8 12.6 12.2MI Detroit 14.7 14.1 13.5 12.6 12.3 12.3 12.6 13.3 13.7 13.5 14.4 15.1MN Minneapolis–St.Paul 13.7 13.6 13.3 12.0 11.9 12.3 12.5 13.2 13.8 13.3 14.3 14.6MS Jackson 15.1 14.4 13.7 13.8 14.1 13.9 14.6 14.6 14.6 14.1 14.3 14.9MO St. Louis 14.5 14.1 13.2 12.4 12.8 12.6 12.9 13.3 13.7 13.1 14.0 14.9MT Missoula 16.7 15.1 12.8 11.4 11.6 11.7 10.1 9.8 11.3 12.9 16.2 17.6NE Omaha 14.0 13.8 13.0 12.1 12.6 12.9 13.3 13.8 14.0 13.0 13.9 14.8NV Las Vegas 8.5 7.7 7.0 5.5 5.0 4.0 4.5 5.2 5.3 5.9 7.2 8.4NV Reno 12.3 10.7 9.7 8.8 8.8 8.2 7.7 7.9 8.4 9.4 10.9 12.3NM Albuquerque 10.4 9.3 8.0 6.9 6.8 6.4 8.0 8.9 8.7 8.6 9.6 10.7N Y New York 12.2 11.9 11.5 11.0 11.5 11.8 11.8 12.4 12.6 12.3 12.5 12.3NC Raleigh 12.8 12.1 12.2 11.7 13.1 13.4 13.8 14.5 14.5 13.7 12.9 12.8ND Fargo 14.2 14.6 15.2 12.9 11.9 12.9 13.2 13.2 13.7 13.5 15.2 15.2OH Cleveland 14.6 14.2 13.7 12.6 12.7 12.7 12.8 13.7 13.8 13.3 13.8 14.6OK Oklahoma City 13.2 12.9 12.2 12.1 13.4 13.1 11.7 11.8 12.9 12.3 12.8 13.2OR Pendleton 15.8 14.0 11.6 10.6 9.9 9.1 7.4 7.7 8.8 11.0 14.6 16.5OR Portland 16.5 15.3 14.2 13.5 13.1 12.4 11.7 11.9 12.6 15.0 16.8 17.4PA Philadelphia 12.6 11.9 11.7 11.2 11.8 11.9 12.1 12.4 13.0 13.0 12.7 12.7SC Charleston 13.3 12.6 12.5 12.4 12.8 13.5 14.1 14.6 14.5 13.7 13.2 13.2SD Sioux Falls 14.2 14.6 14.2 12.9 12.6 12.8 12.6 13.3 13.6 13.0 14.6 15.3TN Memphis 13.8 13.1 12.4 12.2 12.7 12.8 13.0 13.1 13.2 12.5 12.9 13.6TX Dallas–Ft.Worth 13.6 13.1 12.9 13.2 13.9 13.0 11.6 11.7 12.9 12.8 13.1 13.5TX El Paso 9.6 8.2 7.0 5.8 6.1 6.3 8.3 9.1 9.3 8.8 9.0 9.8UT Salt Lake City 14.6 13.2 11.1 10.0 9.4 8.2 7.1 7.4 8.5 10.3 12.8 14.9VA Richmond 13.2 12.5 12.0 11.3 12.1 12.4 13.0 13.7 13.8 13.5 12.8 13.0WA Seattle–Tacoma 15.6 14.6 15.4 13.7 13.0 12.7 12.2 12.5 13.5 15.3 16.3 16.5WI Madison 14.5 14.3 14.1 12.8 12.5 12.8 13.4 14.4 14.9 14.1 15.2 15.7WV Charleston 13.7 13.0 12.1 11.4 12.5 13.3 14.1 14.3 14.0 13.6 13.0 13.5W Y Cheyenne 10.2 10.4 10.7 10.4 10.8 10.5 9.9 9.9 9.7 9.7 10.6 10.6aEMC values were determined from the average of 30 or more years of relative humidity and temperature data available from the National Climatic Data Center of the National Oceanic and Atmospheric Administration.
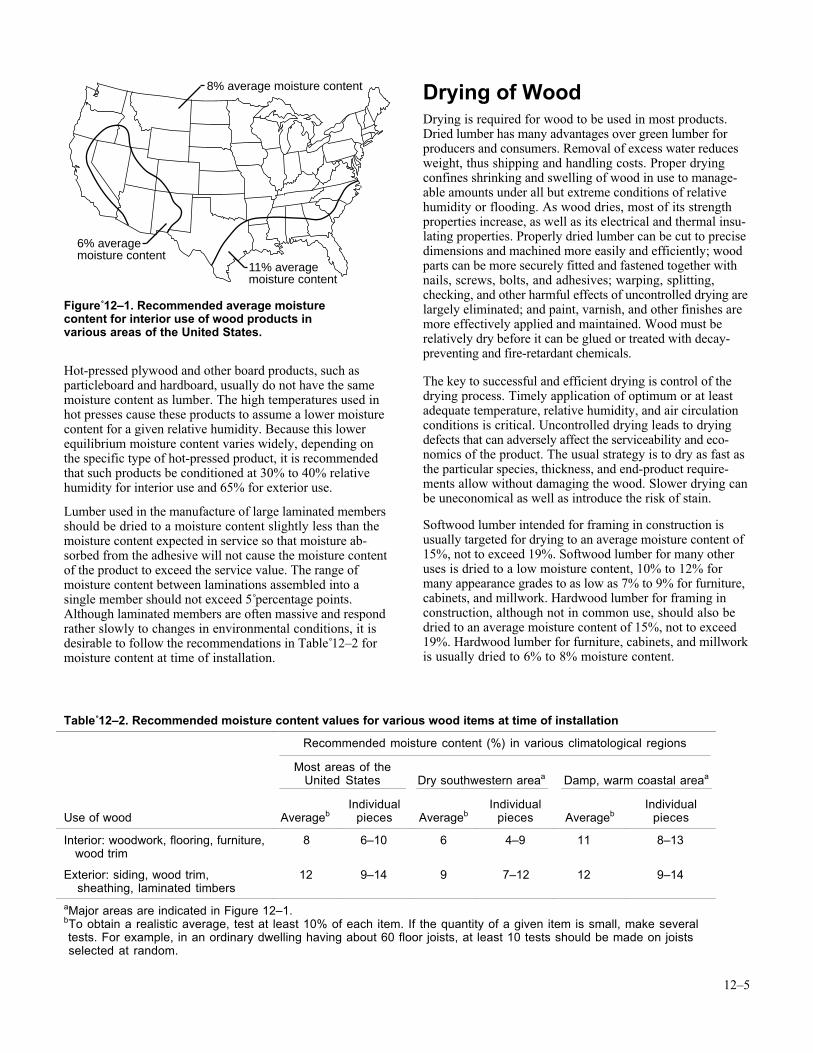
12–5
Hot-pressed plywood and other board products, such asparticleboard and hardboard, usually do not have the samemoisture content as lumber. The high temperatures used inhot presses cause these products to assume a lower moisturecontent for a given relative humidity. Because this lowerequilibrium moisture content varies widely, depending onthe specific type of hot-pressed product, it is recommendedthat such products be conditioned at 30% to 40% relativehumidity for interior use and 65% for exterior use.
Lumber used in the manufacture of large laminated membersshould be dried to a moisture content slightly less than themoisture content expected in service so that moisture ab-sorbed from the adhesive will not cause the moisture contentof the product to exceed the service value. The range ofmoisture content between laminations assembled into asingle member should not exceed 5 percentage points.Although laminated members are often massive and respondrather slowly to changes in environmental conditions, it isdesirable to follow the recommendations in Table 12–2 formoisture content at time of installation.
Drying of WoodDrying is required for wood to be used in most products.Dried lumber has many advantages over green lumber forproducers and consumers. Removal of excess water reducesweight, thus shipping and handling costs. Proper dryingconfines shrinking and swelling of wood in use to manage-able amounts under all but extreme conditions of relativehumidity or flooding. As wood dries, most of its strengthproperties increase, as well as its electrical and thermal insu-lating properties. Properly dried lumber can be cut to precisedimensions and machined more easily and efficiently; woodparts can be more securely fitted and fastened together withnails, screws, bolts, and adhesives; warping, splitting,checking, and other harmful effects of uncontrolled drying arelargely eliminated; and paint, varnish, and other finishes aremore effectively applied and maintained. Wood must berelatively dry before it can be glued or treated with decay-preventing and fire-retardant chemicals.
The key to successful and efficient drying is control of thedrying process. Timely application of optimum or at leastadequate temperature, relative humidity, and air circulationconditions is critical. Uncontrolled drying leads to dryingdefects that can adversely affect the serviceability and eco-nomics of the product. The usual strategy is to dry as fast asthe particular species, thickness, and end-product require-ments allow without damaging the wood. Slower drying canbe uneconomical as well as introduce the risk of stain.
Softwood lumber intended for framing in construction isusually targeted for drying to an average moisture content of15%, not to exceed 19%. Softwood lumber for many otheruses is dried to a low moisture content, 10% to 12% formany appearance grades to as low as 7% to 9% for furniture,cabinets, and millwork. Hardwood lumber for framing inconstruction, although not in common use, should also bedried to an average moisture content of 15%, not to exceed19%. Hardwood lumber for furniture, cabinets, and millworkis usually dried to 6% to 8% moisture content.
6% averagemoisture content
8% average moisture content
11% averagemoisture content
Figure 12–1. Recommended average moisturecontent for interior use of wood products invarious areas of the United States.
Table 12–2. Recommended moisture content values for various wood items at time of installation
Recommended moisture content (%) in various climatological regions
Most areas of theUnited States Dry southwestern areaa Damp, warm coastal areaa
Use of wood AveragebIndividual
pieces AveragebIndividual
pieces AveragebIndividual
pieces
Interior: woodwork, flooring, furniture, wood trim
8 6–10 6 4–9 11 8–13
Exterior: siding, wood trim, sheathing, laminated timbers
12 9–14 9 7–12 12 9–14
aMajor areas are indicated in Figure 12–1.bTo obtain a realistic average, test at least 10% of each item. If the quantity of a given item is small, make several tests. For example, in an ordinary dwelling having about 60 floor joists, at least 10 tests should be made on joists selected at random.
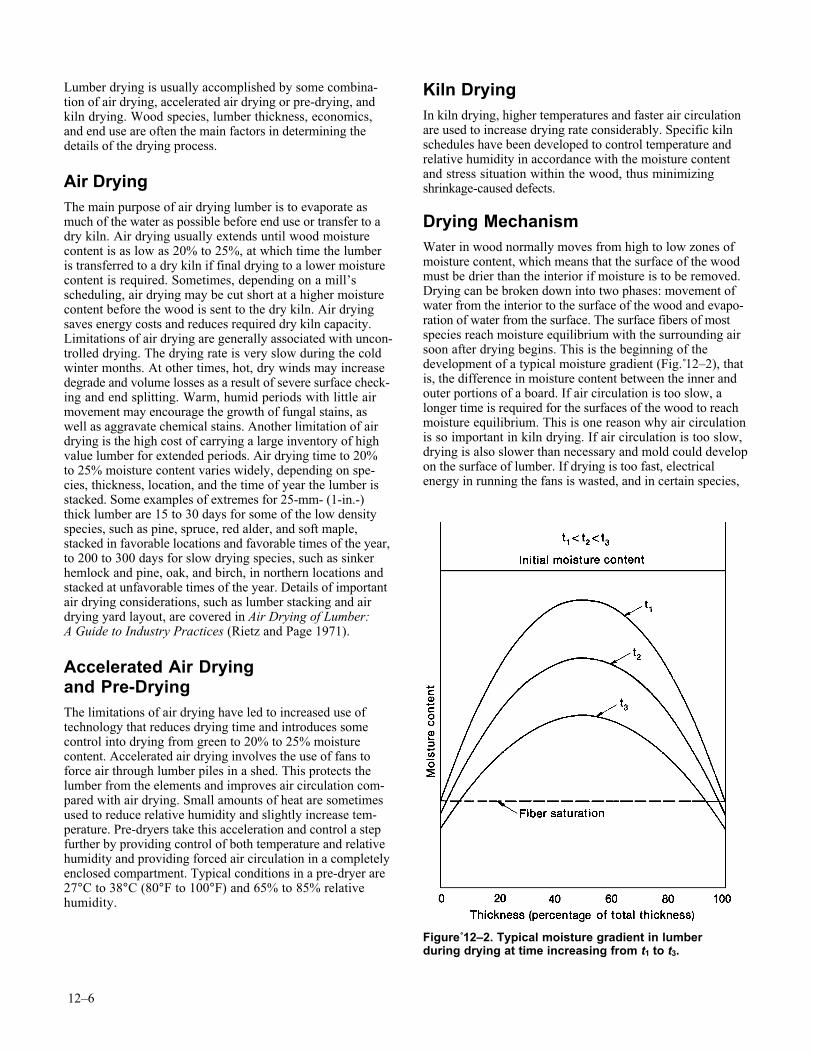
12–6
Lumber drying is usually accomplished by some combina-tion of air drying, accelerated air drying or pre-drying, andkiln drying. Wood species, lumber thickness, economics,and end use are often the main factors in determining thedetails of the drying process.
Air DryingThe main purpose of air drying lumber is to evaporate asmuch of the water as possible before end use or transfer to adry kiln. Air drying usually extends until wood moisturecontent is as low as 20% to 25%, at which time the lumberis transferred to a dry kiln if final drying to a lower moisturecontent is required. Sometimes, depending on a mill’sscheduling, air drying may be cut short at a higher moisturecontent before the wood is sent to the dry kiln. Air dryingsaves energy costs and reduces required dry kiln capacity.Limitations of air drying are generally associated with uncon-trolled drying. The drying rate is very slow during the coldwinter months. At other times, hot, dry winds may increasedegrade and volume losses as a result of severe surface check-ing and end splitting. Warm, humid periods with little airmovement may encourage the growth of fungal stains, aswell as aggravate chemical stains. Another limitation of airdrying is the high cost of carrying a large inventory of highvalue lumber for extended periods. Air drying time to 20%to 25% moisture content varies widely, depending on spe-cies, thickness, location, and the time of year the lumber isstacked. Some examples of extremes for 25-mm- (1-in.-)thick lumber are 15 to 30 days for some of the low densityspecies, such as pine, spruce, red alder, and soft maple,stacked in favorable locations and favorable times of the year,to 200 to 300 days for slow drying species, such as sinkerhemlock and pine, oak, and birch, in northern locations andstacked at unfavorable times of the year. Details of importantair drying considerations, such as lumber stacking and airdrying yard layout, are covered in Air Drying of Lumber:A Guide to Industry Practices (Rietz and Page 1971).
Accelerated Air Dryingand Pre-DryingThe limitations of air drying have led to increased use oftechnology that reduces drying time and introduces somecontrol into drying from green to 20% to 25% moisturecontent. Accelerated air drying involves the use of fans toforce air through lumber piles in a shed. This protects thelumber from the elements and improves air circulation com-pared with air drying. Small amounts of heat are sometimesused to reduce relative humidity and slightly increase tem-perature. Pre-dryers take this acceleration and control a stepfurther by providing control of both temperature and relativehumidity and providing forced air circulation in a completelyenclosed compartment. Typical conditions in a pre-dryer are27°C to 38°C (80°F to 100°F) and 65% to 85% relativehumidity.
Kiln DryingIn kiln drying, higher temperatures and faster air circulationare used to increase drying rate considerably. Specific kilnschedules have been developed to control temperature andrelative humidity in accordance with the moisture contentand stress situation within the wood, thus minimizingshrinkage-caused defects.
Drying MechanismWater in wood normally moves from high to low zones ofmoisture content, which means that the surface of the woodmust be drier than the interior if moisture is to be removed.Drying can be broken down into two phases: movement ofwater from the interior to the surface of the wood and evapo-ration of water from the surface. The surface fibers of mostspecies reach moisture equilibrium with the surrounding airsoon after drying begins. This is the beginning of thedevelopment of a typical moisture gradient (Fig. 12–2), thatis, the difference in moisture content between the inner andouter portions of a board. If air circulation is too slow, alonger time is required for the surfaces of the wood to reachmoisture equilibrium. This is one reason why air circulationis so important in kiln drying. If air circulation is too slow,drying is also slower than necessary and mold could developon the surface of lumber. If drying is too fast, electricalenergy in running the fans is wasted, and in certain species,
Figure 12–2. Typical moisture gradient in lumberduring drying at time increasing from t1 to t3.
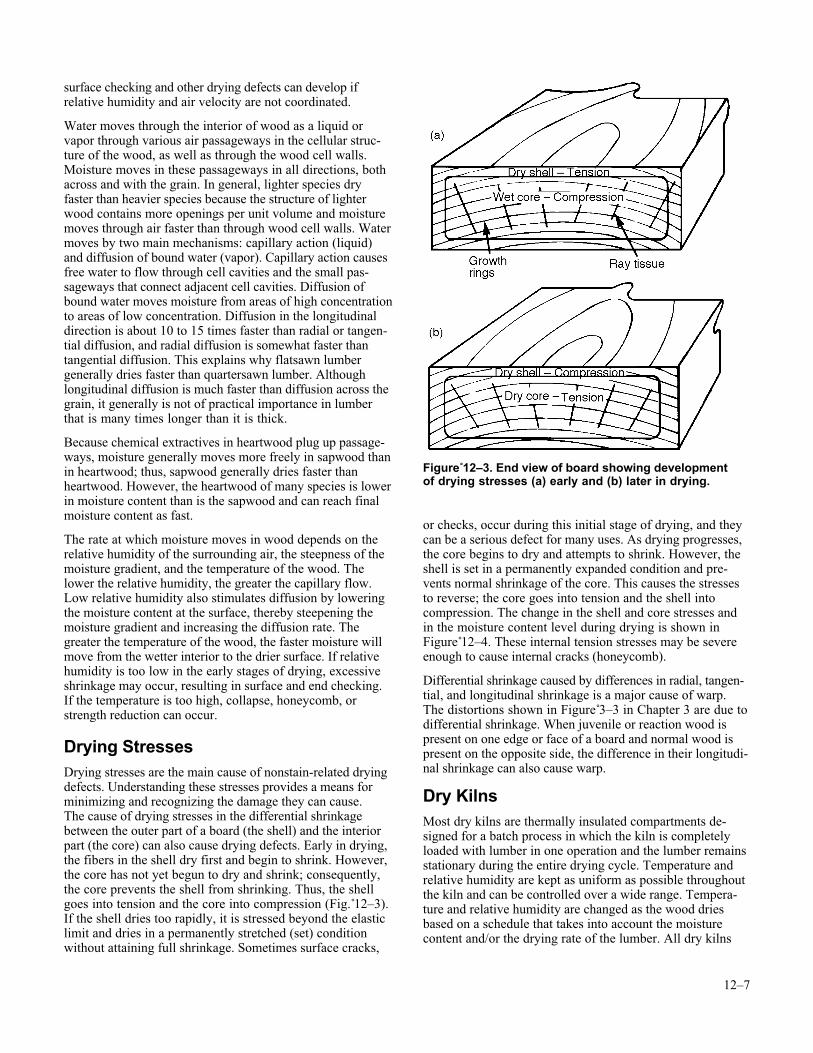
12–7
surface checking and other drying defects can develop ifrelative humidity and air velocity are not coordinated.
Water moves through the interior of wood as a liquid orvapor through various air passageways in the cellular struc-ture of the wood, as well as through the wood cell walls.Moisture moves in these passageways in all directions, bothacross and with the grain. In general, lighter species dryfaster than heavier species because the structure of lighterwood contains more openings per unit volume and moisturemoves through air faster than through wood cell walls. Watermoves by two main mechanisms: capillary action (liquid)and diffusion of bound water (vapor). Capillary action causesfree water to flow through cell cavities and the small pas-sageways that connect adjacent cell cavities. Diffusion ofbound water moves moisture from areas of high concentrationto areas of low concentration. Diffusion in the longitudinaldirection is about 10 to 15 times faster than radial or tangen-tial diffusion, and radial diffusion is somewhat faster thantangential diffusion. This explains why flatsawn lumbergenerally dries faster than quartersawn lumber. Althoughlongitudinal diffusion is much faster than diffusion across thegrain, it generally is not of practical importance in lumberthat is many times longer than it is thick.
Because chemical extractives in heartwood plug up passage-ways, moisture generally moves more freely in sapwood thanin heartwood; thus, sapwood generally dries faster thanheartwood. However, the heartwood of many species is lowerin moisture content than is the sapwood and can reach finalmoisture content as fast.
The rate at which moisture moves in wood depends on therelative humidity of the surrounding air, the steepness of themoisture gradient, and the temperature of the wood. Thelower the relative humidity, the greater the capillary flow.Low relative humidity also stimulates diffusion by loweringthe moisture content at the surface, thereby steepening themoisture gradient and increasing the diffusion rate. Thegreater the temperature of the wood, the faster moisture willmove from the wetter interior to the drier surface. If relativehumidity is too low in the early stages of drying, excessiveshrinkage may occur, resulting in surface and end checking.If the temperature is too high, collapse, honeycomb, orstrength reduction can occur.
Drying StressesDrying stresses are the main cause of nonstain-related dryingdefects. Understanding these stresses provides a means forminimizing and recognizing the damage they can cause.The cause of drying stresses in the differential shrinkagebetween the outer part of a board (the shell) and the interiorpart (the core) can also cause drying defects. Early in drying,the fibers in the shell dry first and begin to shrink. However,the core has not yet begun to dry and shrink; consequently,the core prevents the shell from shrinking. Thus, the shellgoes into tension and the core into compression (Fig. 12–3).If the shell dries too rapidly, it is stressed beyond the elasticlimit and dries in a permanently stretched (set) conditionwithout attaining full shrinkage. Sometimes surface cracks,
or checks, occur during this initial stage of drying, and theycan be a serious defect for many uses. As drying progresses,the core begins to dry and attempts to shrink. However, theshell is set in a permanently expanded condition and pre-vents normal shrinkage of the core. This causes the stressesto reverse; the core goes into tension and the shell intocompression. The change in the shell and core stresses andin the moisture content level during drying is shown inFigure 12–4. These internal tension stresses may be severeenough to cause internal cracks (honeycomb).
Differential shrinkage caused by differences in radial, tangen-tial, and longitudinal shrinkage is a major cause of warp.The distortions shown in Figure 3–3 in Chapter 3 are due todifferential shrinkage. When juvenile or reaction wood ispresent on one edge or face of a board and normal wood ispresent on the opposite side, the difference in their longitudi-nal shrinkage can also cause warp.
Dry KilnsMost dry kilns are thermally insulated compartments de-signed for a batch process in which the kiln is completelyloaded with lumber in one operation and the lumber remainsstationary during the entire drying cycle. Temperature andrelative humidity are kept as uniform as possible throughoutthe kiln and can be controlled over a wide range. Tempera-ture and relative humidity are changed as the wood driesbased on a schedule that takes into account the moisturecontent and/or the drying rate of the lumber. All dry kilns
Figure 12–3. End view of board showing developmentof drying stresses (a) early and (b) later in drying.
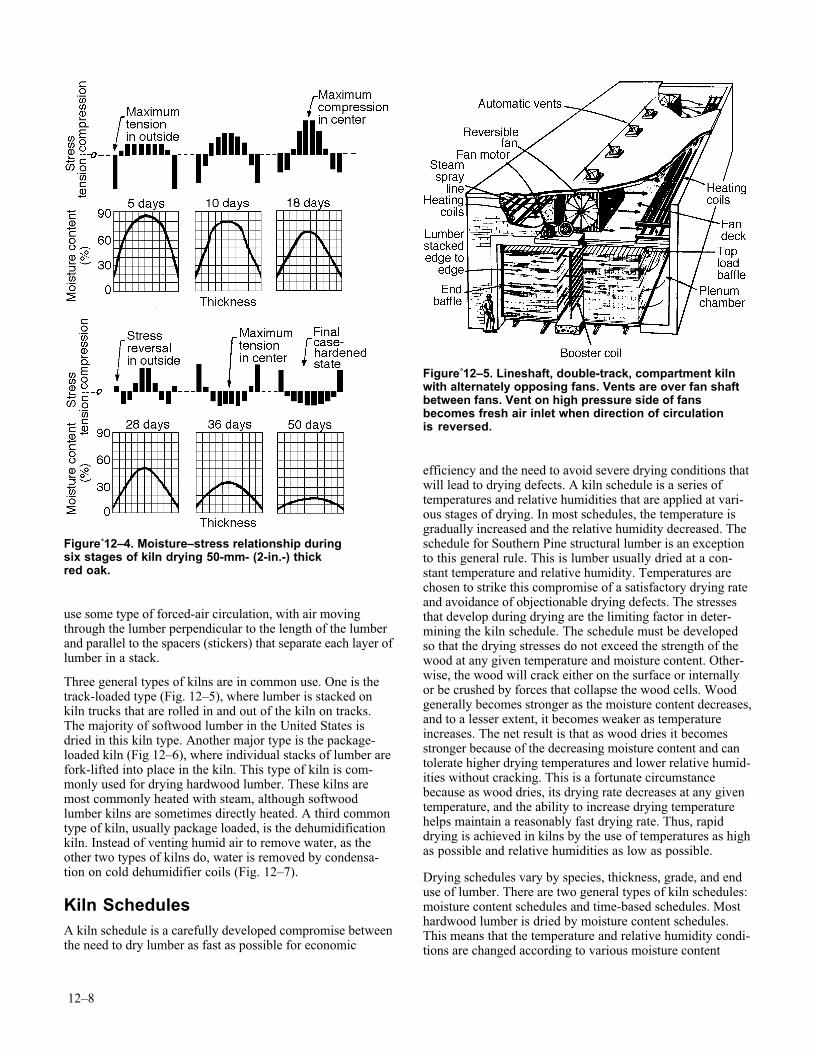
12–8
use some type of forced-air circulation, with air movingthrough the lumber perpendicular to the length of the lumberand parallel to the spacers (stickers) that separate each layer oflumber in a stack.
Three general types of kilns are in common use. One is thetrack-loaded type (Fig. 12–5), where lumber is stacked onkiln trucks that are rolled in and out of the kiln on tracks.The majority of softwood lumber in the United States isdried in this kiln type. Another major type is the package-loaded kiln (Fig 12–6), where individual stacks of lumber arefork-lifted into place in the kiln. This type of kiln is com-monly used for drying hardwood lumber. These kilns aremost commonly heated with steam, although softwoodlumber kilns are sometimes directly heated. A third commontype of kiln, usually package loaded, is the dehumidificationkiln. Instead of venting humid air to remove water, as theother two types of kilns do, water is removed by condensa-tion on cold dehumidifier coils (Fig. 12–7).
Kiln SchedulesA kiln schedule is a carefully developed compromise betweenthe need to dry lumber as fast as possible for economic
efficiency and the need to avoid severe drying conditions thatwill lead to drying defects. A kiln schedule is a series oftemperatures and relative humidities that are applied at vari-ous stages of drying. In most schedules, the temperature isgradually increased and the relative humidity decreased. Theschedule for Southern Pine structural lumber is an exceptionto this general rule. This is lumber usually dried at a con-stant temperature and relative humidity. Temperatures arechosen to strike this compromise of a satisfactory drying rateand avoidance of objectionable drying defects. The stressesthat develop during drying are the limiting factor in deter-mining the kiln schedule. The schedule must be developedso that the drying stresses do not exceed the strength of thewood at any given temperature and moisture content. Other-wise, the wood will crack either on the surface or internallyor be crushed by forces that collapse the wood cells. Woodgenerally becomes stronger as the moisture content decreases,and to a lesser extent, it becomes weaker as temperatureincreases. The net result is that as wood dries it becomesstronger because of the decreasing moisture content and cantolerate higher drying temperatures and lower relative humid-ities without cracking. This is a fortunate circumstancebecause as wood dries, its drying rate decreases at any giventemperature, and the ability to increase drying temperaturehelps maintain a reasonably fast drying rate. Thus, rapiddrying is achieved in kilns by the use of temperatures as highas possible and relative humidities as low as possible.
Drying schedules vary by species, thickness, grade, and enduse of lumber. There are two general types of kiln schedules:moisture content schedules and time-based schedules. Mosthardwood lumber is dried by moisture content schedules.This means that the temperature and relative humidity condi-tions are changed according to various moisture content
Figure 12–4. Moisture–stress relationship duringsix stages of kiln drying 50-mm- (2-in.-) thickred oak.
Figure 12–5. Lineshaft, double-track, compartment kilnwith alternately opposing fans. Vents are over fan shaftbetween fans. Vent on high pressure side of fansbecomes fresh air inlet when direction of circulationis reversed.
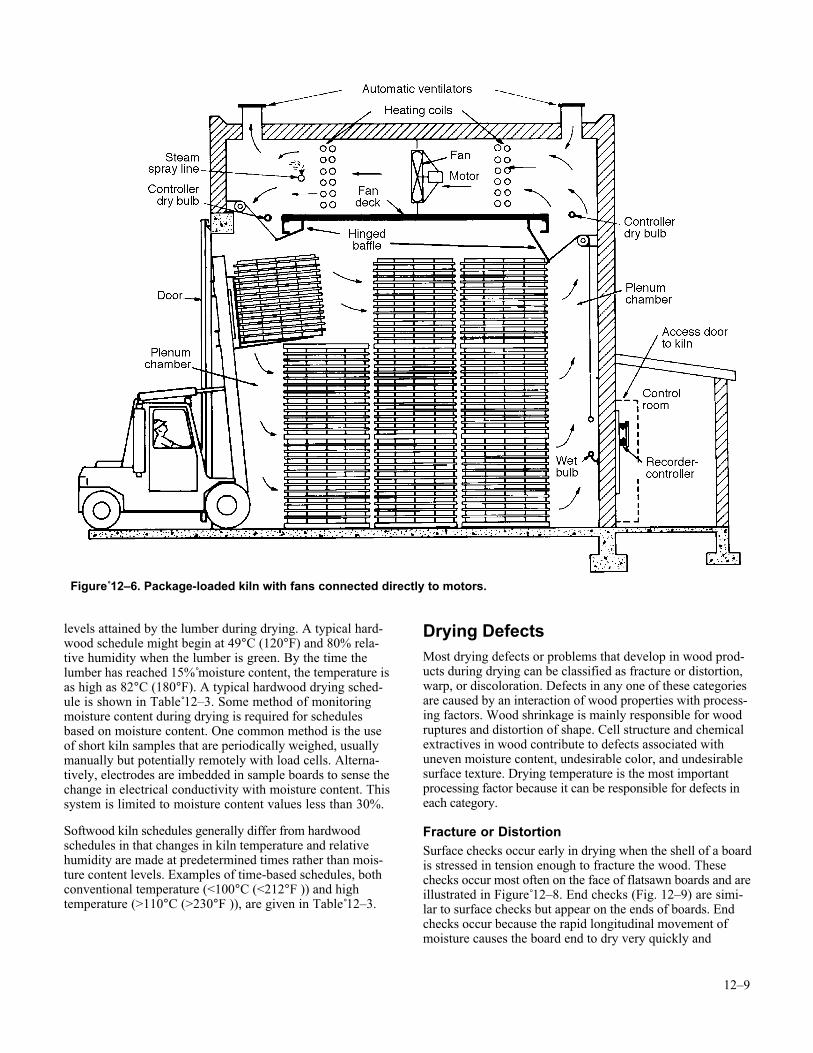
12–9
levels attained by the lumber during drying. A typical hard-wood schedule might begin at 49°C (120°F) and 80% rela-tive humidity when the lumber is green. By the time thelumber has reached 15% moisture content, the temperature isas high as 82°C (180°F). A typical hardwood drying sched-ule is shown in Table 12–3. Some method of monitoringmoisture content during drying is required for schedulesbased on moisture content. One common method is the useof short kiln samples that are periodically weighed, usuallymanually but potentially remotely with load cells. Alterna-tively, electrodes are imbedded in sample boards to sense thechange in electrical conductivity with moisture content. Thissystem is limited to moisture content values less than 30%.
Softwood kiln schedules generally differ from hardwoodschedules in that changes in kiln temperature and relativehumidity are made at predetermined times rather than mois-ture content levels. Examples of time-based schedules, bothconventional temperature (<100°C (<212°F )) and hightemperature (>110°C (>230°F )), are given in Table 12–3.
Drying DefectsMost drying defects or problems that develop in wood prod-ucts during drying can be classified as fracture or distortion,warp, or discoloration. Defects in any one of these categoriesare caused by an interaction of wood properties with process-ing factors. Wood shrinkage is mainly responsible for woodruptures and distortion of shape. Cell structure and chemicalextractives in wood contribute to defects associated withuneven moisture content, undesirable color, and undesirablesurface texture. Drying temperature is the most importantprocessing factor because it can be responsible for defects ineach category.
Fracture or DistortionSurface checks occur early in drying when the shell of a boardis stressed in tension enough to fracture the wood. Thesechecks occur most often on the face of flatsawn boards and areillustrated in Figure 12–8. End checks (Fig. 12–9) are simi-lar to surface checks but appear on the ends of boards. Endchecks occur because the rapid longitudinal movement ofmoisture causes the board end to dry very quickly and
Figure 12–6. Package-loaded kiln with fans connected directly to motors.
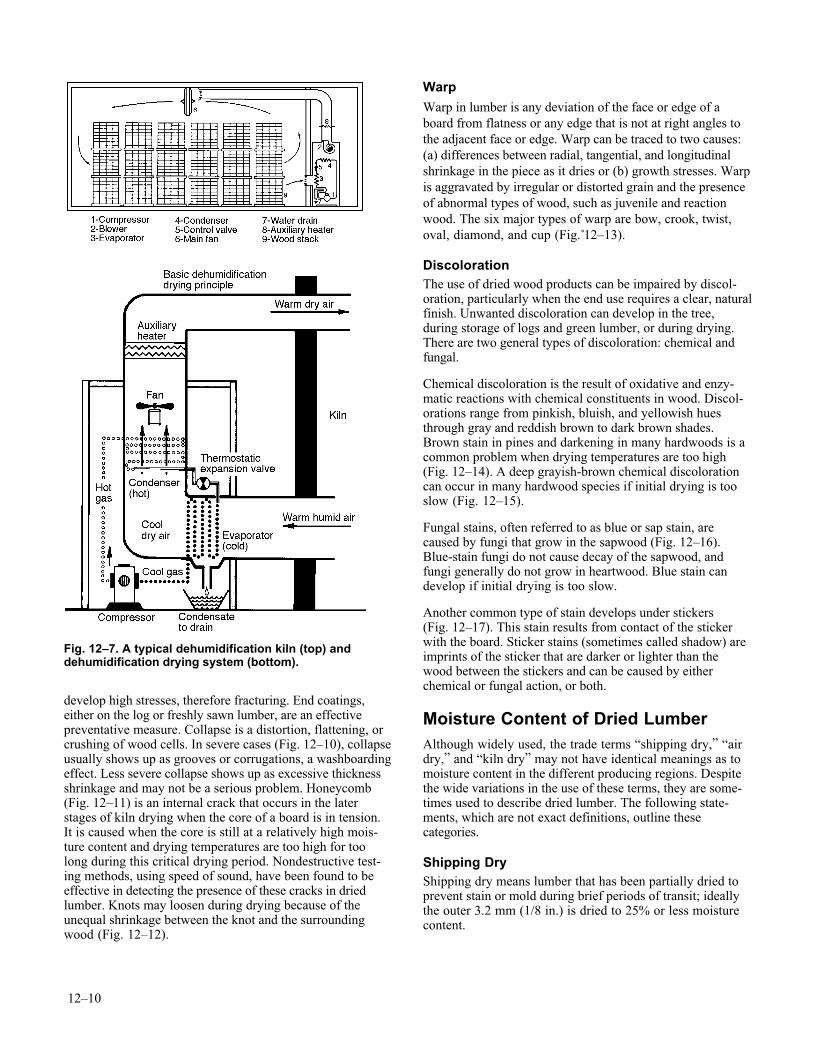
12–10
develop high stresses, therefore fracturing. End coatings,either on the log or freshly sawn lumber, are an effectivepreventative measure. Collapse is a distortion, flattening, orcrushing of wood cells. In severe cases (Fig. 12–10), collapseusually shows up as grooves or corrugations, a washboardingeffect. Less severe collapse shows up as excessive thicknessshrinkage and may not be a serious problem. Honeycomb(Fig. 12–11) is an internal crack that occurs in the laterstages of kiln drying when the core of a board is in tension.It is caused when the core is still at a relatively high mois-ture content and drying temperatures are too high for toolong during this critical drying period. Nondestructive test-ing methods, using speed of sound, have been found to beeffective in detecting the presence of these cracks in driedlumber. Knots may loosen during drying because of theunequal shrinkage between the knot and the surroundingwood (Fig. 12–12).
Warp
Warp in lumber is any deviation of the face or edge of aboard from flatness or any edge that is not at right angles tothe adjacent face or edge. Warp can be traced to two causes:(a) differences between radial, tangential, and longitudinalshrinkage in the piece as it dries or (b) growth stresses. Warpis aggravated by irregular or distorted grain and the presenceof abnormal types of wood, such as juvenile and reactionwood. The six major types of warp are bow, crook, twist,oval, diamond, and cup (Fig. 12–13).
DiscolorationThe use of dried wood products can be impaired by discol-oration, particularly when the end use requires a clear, naturalfinish. Unwanted discoloration can develop in the tree,during storage of logs and green lumber, or during drying.There are two general types of discoloration: chemical andfungal.
Chemical discoloration is the result of oxidative and enzy-matic reactions with chemical constituents in wood. Discol-orations range from pinkish, bluish, and yellowish huesthrough gray and reddish brown to dark brown shades.Brown stain in pines and darkening in many hardwoods is acommon problem when drying temperatures are too high(Fig. 12–14). A deep grayish-brown chemical discolorationcan occur in many hardwood species if initial drying is tooslow (Fig. 12–15).
Fungal stains, often referred to as blue or sap stain, arecaused by fungi that grow in the sapwood (Fig. 12–16).Blue-stain fungi do not cause decay of the sapwood, andfungi generally do not grow in heartwood. Blue stain candevelop if initial drying is too slow.
Another common type of stain develops under stickers(Fig. 12–17). This stain results from contact of the stickerwith the board. Sticker stains (sometimes called shadow) areimprints of the sticker that are darker or lighter than thewood between the stickers and can be caused by eitherchemical or fungal action, or both.
Moisture Content of Dried LumberAlthough widely used, the trade terms “shipping dry,” “airdry,” and “kiln dry” may not have identical meanings as tomoisture content in the different producing regions. Despitethe wide variations in the use of these terms, they are some-times used to describe dried lumber. The following state-ments, which are not exact definitions, outline thesecategories.
Shipping DryShipping dry means lumber that has been partially dried toprevent stain or mold during brief periods of transit; ideallythe outer 3.2 mm (1/8 in.) is dried to 25% or less moisturecontent.
Fig. 12–7. A typical dehumidification kiln (top) anddehumidification drying system (bottom).
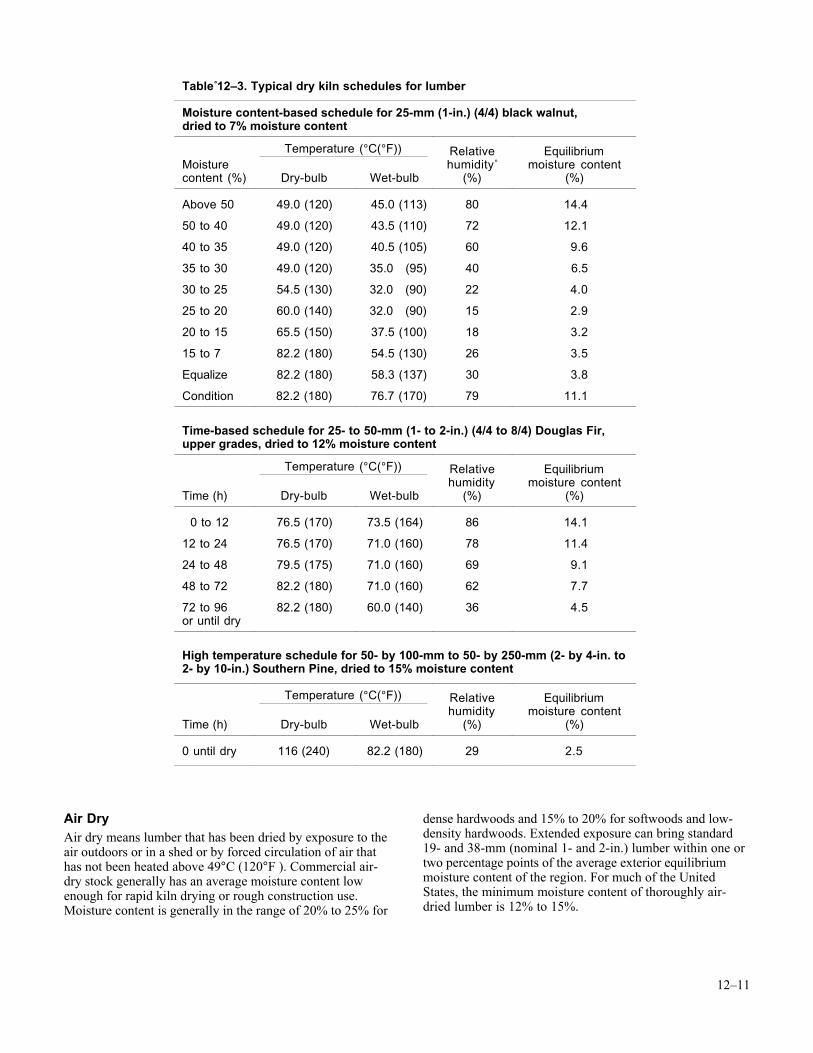
12–11
Air DryAir dry means lumber that has been dried by exposure to theair outdoors or in a shed or by forced circulation of air thathas not been heated above 49°C (120°F ). Commercial air-dry stock generally has an average moisture content lowenough for rapid kiln drying or rough construction use.Moisture content is generally in the range of 20% to 25% for
dense hardwoods and 15% to 20% for softwoods and low-density hardwoods. Extended exposure can bring standard19- and 38-mm (nominal 1- and 2-in.) lumber within one ortwo percentage points of the average exterior equilibriummoisture content of the region. For much of the UnitedStates, the minimum moisture content of thoroughly air-dried lumber is 12% to 15%.
Table 12–3. Typical dry kiln schedules for lumber
Moisture content-based schedule for 25-mm (1-in.) (4/4) black walnut,dried to 7% moisture content
Temperature (°C(°F)) Relative EquilibriumMoisturecontent (%) Dry-bulb Wet-bulb
humidity (%)
moisture content(%)
Above 50 49.0 (120) 45.0 (113) 80 14.4
50 to 40 49.0 (120) 43.5 (110) 72 12.1
40 to 35 49.0 (120) 40.5 (105) 60 9.6
35 to 30 49.0 (120) 35.0 (95) 40 6.5
30 to 25 54.5 (130) 32.0 (90) 22 4.0
25 to 20 60.0 (140) 32.0 (90) 15 2.9
20 to 15 65.5 (150) 37.5 (100) 18 3.2
15 to 7 82.2 (180) 54.5 (130) 26 3.5
Equalize 82.2 (180) 58.3 (137) 30 3.8
Condition 82.2 (180) 76.7 (170) 79 11.1
Time-based schedule for 25- to 50-mm (1- to 2-in.) (4/4 to 8/4) Douglas Fir,upper grades, dried to 12% moisture content
Temperature (°C(°F)) Relative Equilibrium
Time (h) Dry-bulb Wet-bulbhumidity
(%)moisture content
(%)
0 to 12 76.5 (170) 73.5 (164) 86 14.1
12 to 24 76.5 (170) 71.0 (160) 78 11.4
24 to 48 79.5 (175) 71.0 (160) 69 9.1
48 to 72 82.2 (180) 71.0 (160) 62 7.7
72 to 96or until dry
82.2 (180) 60.0 (140) 36 4.5
High temperature schedule for 50- by 100-mm to 50- by 250-mm (2- by 4-in. to2- by 10-in.) Southern Pine, dried to 15% moisture content
Temperature (°C(°F)) Relative Equilibrium
Time (h) Dry-bulb Wet-bulbhumidity
(%)moisture content
(%)
0 until dry 116 (240) 82.2 (180) 29 2.5
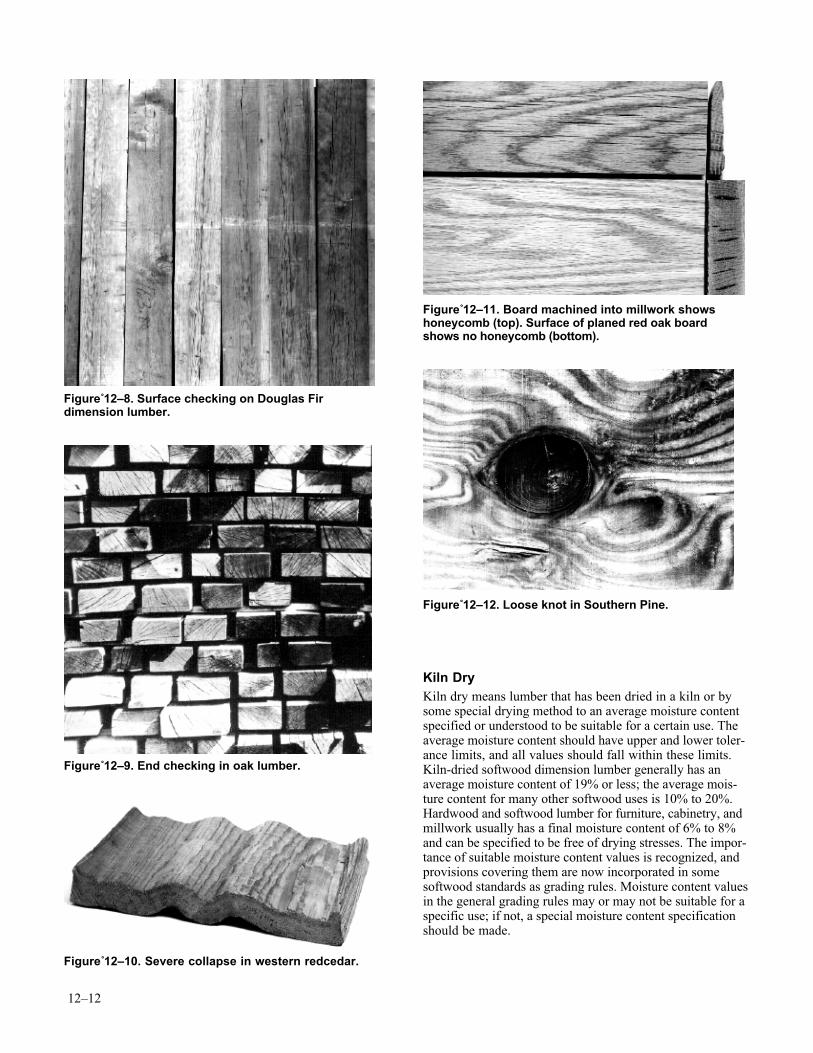
12–12
Figure 12–11. Board machined into millwork showshoneycomb (top). Surface of planed red oak boardshows no honeycomb (bottom).
Figure 12–12. Loose knot in Southern Pine.
Kiln DryKiln dry means lumber that has been dried in a kiln or bysome special drying method to an average moisture contentspecified or understood to be suitable for a certain use. Theaverage moisture content should have upper and lower toler-ance limits, and all values should fall within these limits.Kiln-dried softwood dimension lumber generally has anaverage moisture content of 19% or less; the average mois-ture content for many other softwood uses is 10% to 20%.Hardwood and softwood lumber for furniture, cabinetry, andmillwork usually has a final moisture content of 6% to 8%and can be specified to be free of drying stresses. The impor-tance of suitable moisture content values is recognized, andprovisions covering them are now incorporated in somesoftwood standards as grading rules. Moisture content valuesin the general grading rules may or may not be suitable for aspecific use; if not, a special moisture content specificationshould be made.
Figure 12–8. Surface checking on Douglas Firdimension lumber.
Figure 12–9. End checking in oak lumber.
Figure 12–10. Severe collapse in western redcedar.
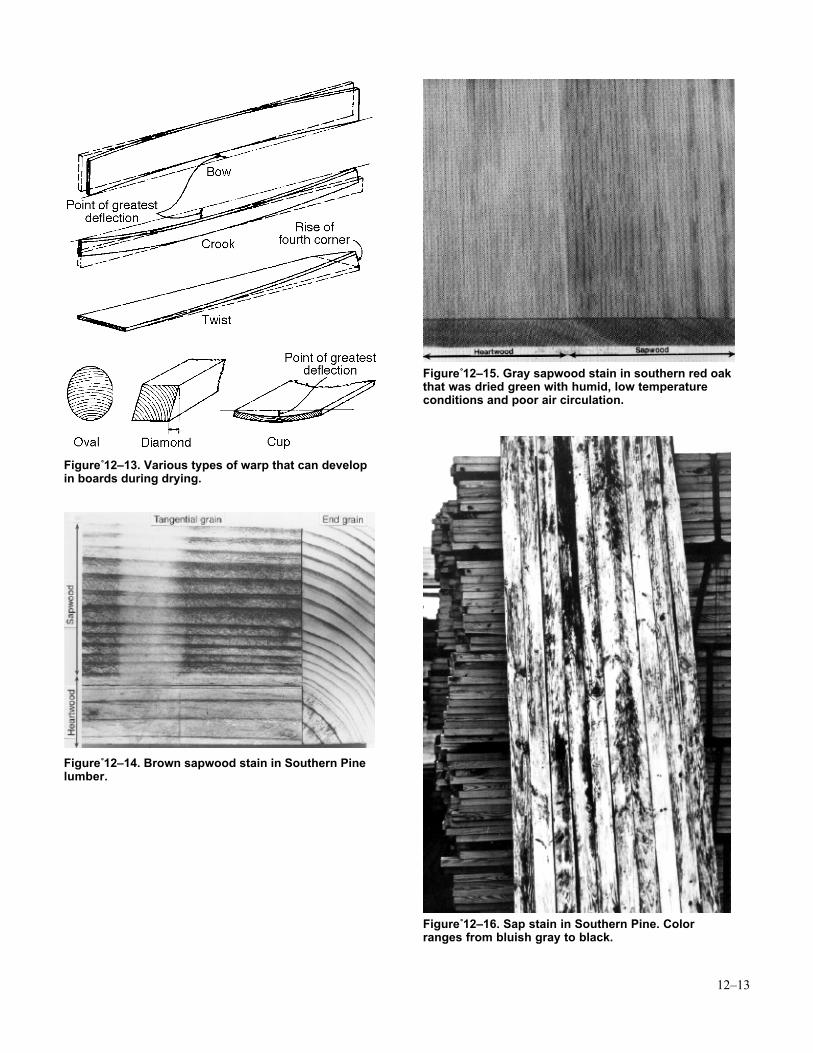
12–13
Figure 12–15. Gray sapwood stain in southern red oakthat was dried green with humid, low temperatureconditions and poor air circulation.
Figure 12–16. Sap stain in Southern Pine. Colorranges from bluish gray to black.
Figure 12–13. Various types of warp that can developin boards during drying.
Figure 12–14. Brown sapwood stain in Southern Pinelumber.
12–14
Moisture Control DuringTransit and StorageLumber and other wood items may change in moisturecontent and dimension while awaiting shipment, duringfabrication, in transit, and in storage.
When standard 19-mm (nominal 1-in.) dry softwood lumberis shipped in tightly closed boxcars, shipping containers, ortrucks or in packages with complete and intact wrappers,average moisture content changes for a package can generallybe held to 0.2% or less per month. In holds or betweendecks of ships, dry material usually adsorbs about 1.5%moisture during normal shipping periods. If green material isincluded in the cargo, the moisture regain of the dry lumbermay be doubled. On the top deck, if unprotected from theelements, the moisture regain can be as much as 7%.
When standard 19-mm (nominal 1-in.) softwood lumber,kiln dried to 8% or less, is piled solid under a good pile roofin a yard in humid weather, average moisture content of apile can increase at the rate of about 2% per month during thefirst 45 days. An absorption rate of about 1% per month canthen be sustained throughout a humid season. Comparableinitial and sustaining absorption rates are about 1% permonth in open (roofed) sheds and 0.3% per month in closedsheds. Stock that was piled for a year in an open shed in awestern location increased 2.7% on the inside of solid pilesand 3.5% on the outside of the piles. All stock that has beenmanufactured in any way should be protected from precipita-tion and spray, because water that gets into a solid pile tendsto be absorbed by the wood instead of evaporating. Theextent to which additional control of the storage environmentis required depends upon the use to which the wood will beput and the corresponding moisture content recommenda-tions. The moisture content of all stock should be deter-mined when it is received. If moisture content is not asspecified or required, stickered storage in an appropriatecondition could ultimately bring the stock within the desiredmoisture content range. If a large degree of moisture changeis required, the stock must be redried.
Plywood and Structural ItemsGreen or partially dried lumber and timbers should be openpiled on stickers and protected from sunshine and precipita-tion by a tight roof. Framing lumber and plywood with 20%or less moisture content can be solid piled in a shed thatprovides good protection against sunshine and direct orwind-driven precipitation. However, a better practice forstock with greater than 12% moisture content is the use ofstickered piling to bring moisture content more in line withthe moisture content in use. Dry lumber can be piled solid inthe open for relatively short periods, but at least a minimumpile cover of waterproofed paper should be used wheneverpossible. Because it is difficult to keep rain out completely,storing solid-piled lumber in the open for long periods is notrecommended. If framing lumber must be stored in the openfor a long time, it should be piled on stickers over goodsupports and the piles should be roofed. Solid-piled materialthat has become wet again should also be re-piled onstickers.
Figure 12–17. Sticker stain in sapwood of sugarmaple after planing.
Table 12–4. Amount by which temperature of storage area must be increased above outsidetemperature to maintain equilibrium moisture content
Outside relative Temperature differential (°C (°F)) for desired equilibrium moisture contenthumidity
(%) 6% 7% 8% 9% 10% 11% 12%
90 18.3 (33) 16.1 (29) 12.8 (23) 10.0 (18) 8.3 (15) 6.1 (11) 5.0 (9)80 16.7 (30) 13.9 (25) 10.5 (19) 7.8 (14) 6.1 (11) 4.4 (8) 3.3 (6)70 13.9 (25) 11.1 (20) 8.3 (15) 5.6 (10) 3.9 (7) 2.2 (4) 1.7 (3)60 11.1 (20) 8.3 (15) 5.0 (9) 3.3 (6) 1.7 (3) — —50 8.3 (15) 5.6 (10) 2.8 (5) 0.6 (1) — — —
12–15
Finish and Factory LumberSuch kiln-dried items as exterior finish, siding, and exteriormillwork should be stored in a closed but unheated shed.They should be placed on supports raised above the floor, atleast 150 mm (6 in.) high if the floor is paved or 300 mm(12 in.) if not paved. Interior trim, flooring, cabinet work,and lumber for processing into furniture should be stored in aroom or closed shed where relative humidity is controlled.Kiln-dried and machined hardwood dimension or softwoodcut stock should also be stored under controlled humidityconditions.
Dried and machined hardwood dimension or softwoodlumber intended for remanufacture should also be storedunder controlled humidity conditions. Under uncontrolledconditions, the ends of such stock may attain a greater mois-ture content than the balance of the length. Then, when thestock is straight-line ripped or jointed before edge gluing,subsequent shrinkage will cause splitting or open glue jointsat the ends of panels. The simplest way to reduce relativehumidity in storage areas of all sizes is to heat the space to atemperature slightly greater than that of the outside air.Dehumidifiers can be used in small, well-enclosed spaces.
If the heating method is used, and there is no source of mois-ture except that contained in the air, the equilibrium mois-ture content can be maintained by increasing the temperatureof the storage area greater than the outside temperature by theamounts shown in Table 12–4. When a dehumidifier isused, the average temperature in the storage space should beknown or controlled. Table 3–4 in Chapter 3 should be usedto select the proper relative humidity to give the desiredaverage moisture content. Wood in a factory awaiting orfollowing manufacture can become too dry if the area isheated to 21°C (70°F) or greater when the outdoor tempera-ture is low. This often occurs in the northern United Statesduring the winter. Under such circumstances, exposed endsand surfaces of boards or cut pieces will tend to dry to thelow equilibrium moisture content condition, causing shrink-age and warp. In addition, an equilibrium moisture contentof 4% or more below the moisture content of the core offreshly crosscut boards can cause end checking. Simpleremedies are to cover piles of partially manufactured itemswith plastic film and lower the shop temperature duringnonwork hours. Increased control can be obtained in criticalshop and storage areas by humidification. In warm weather,cooling can increase relative humidity and dehumidificationmay be necessary.
Dimensional Changes in WoodDry wood undergoes small changes in dimension with nor-mal changes in relative humidity. More humid air will causeslight swelling, and drier air will cause slight shrinkage.These changes are considerably smaller than those involvedwith shrinkage from the green condition. Equation (12–2)can be used to approximate dimensional changes caused byshrinking and swelling by using the total shrinkage coeffi-cient from green to ovendry. However, the equation assumes
that the shrinkage–moisture content relationship is linear.Figure 3–4 (Ch. 3) shows that this is not the case, so someerror is introduced. The error is in the direction of underes-timating dimensional change, by about 5% of the truechange. Many changes of moisture content in use are over thesmall moisture content range of 6% to 14%, where theshrinkage–moisture content relationship is linear (Ch. 3,Fig. 3–4). Therefore, a set of shrinkage coefficients based onthe linear portion of the shrinkage–moisture content curvehas been developed (Table 12–5). Approximate changes indimension can be estimated by a simple formula that in-volves a dimensional change coefficient, from Table 12–5,when moisture content remains within the range of normaluse. (Dimensional changes are further discussed in Chs. 3and 6.)
Estimation Using DimensionalChange CoefficientThe change in dimension within the moisture content limitsof 6% to 14% can be estimated satisfactorily by using adimensional change coefficient based on the dimension at10% moisture content:
∆D D C M M= −[ ]I F IT ( ) (12–2)
where ∆D is change in dimension, DI dimension in units oflength at start of change, CT dimensional change coefficienttangential direction (for radial direction, use CR), MF mois-ture content (%) at end of change, and MI moisture content(%) at start of change.
Values for CT and CR, derived from total shrinkage values,are given in Table 12–5. When MF < MI, the quantity(MF − MI) will be negative, indicating a decrease indimension; when greater, it will be positive, indicating anincrease in dimension.
As an example, assuming the width of a flat-grained white firboard is 232 mm (9.15 in.) at 8% moisture content, itschange in width at 11% moisture content is estimated as
∆D = 232[0.00245(11 − 8)]
= 232(0.00735)
= 1.705 mm
∆D = 9.15[0.00245(11 − 8)]
= 9.15[0.00735]
= 0.06725 or 0.067 in.
Then, dimension at end of change
DI + ∆D = 232 + 1.7 (= 9.15 + 0.067)
= 233.7 mm (= 9.217 in.)
The thickness of the same board at 11% moisture content canbe estimated by using the coefficient CR = 0.00112.
12–16
Table 12–5. Coefficients for dimensional change as a result of shrinking or swelling within moisture content limitsof 6% to 14% (CT = dimensional change coefficient for tangential direction; CR = radial direction)
Dimensional changecoefficienta
Dimensional changecoefficienta
Species CR CT Species CR CT
Hardwoods
Alder, red 0.00151 0.00256 Honeylocust 0.00144 0.00230Apple 0.00205 0.00376 Locust, black 0.00158 0.00252Ash, black 0.00172 0.00274 Madrone, Pacific 0.00194 0.00451Ash, Oregon 0.00141 0.00285 Magnolia, cucumbertree 0.00180 0.00312Ash, pumpkin 0.00126 0.00219 Magnolia, southern 0.00187 0.00230Ash, white 0.00169 0.00274 Magnolia, sweetbay 0.00162 0.00293Ash, green 0.00169 0.00274 Maple, bigleaf 0.00126 0.00248Aspen, quaking 0.00119 0.00234 Maple, red 0.00137 0.00289Basswood, American 0.00230 0.00330 Maple, silver 0.00102 0.00252Beech, American 0.00190 0.00431 Maple, black 0.00165 0.00353Birch, paper 0.00219 0.00304 Maple, sugar 0.00165 0.00353Birch, river 0.00162 0.00327 Oak, black 0.00123 0.00230Birch, yellow 0.00256 0.00338 Red Oak, commercial 0.00158 0.00369Birch, sweet 0.00256 0.00338 Red oak, California 0.00123 0.00230Buckeye, yellow 0.00123 0.00285 Red oak: water, laurel, willow 0.00151 0.00350Butternut 0.00116 0.00223 White Oak, commercial 0.00180 0.00365Catalpa, northern 0.00085 0.00169 White oak, live 0.00230 0.00338Cherry, black 0.00126 0.00248 White oak, Oregon white 0.00144 0.00327Chestnut, American 0.00116 0.00234 White oak, overcup 0.00183 0.00462Cottonwood, black 0.00123 0.00304 Persimmon, common 0.00278 0.00403Cottonwood, eastern 0.00133 0.00327 Sassafras 0.00137 0.00216Elm, American 0.00144 0.00338 Sweet gum 0.00183 0.00365Elm, rock 0.00165 0.00285 Sycamore, American 0.00172 0.00296Elm, slippery 0.00169 0.00315 Tanoak 0.00169 0.00423Elm, winged 0.00183 0.00419 Tupelo, black 0.00176 0.00308Elm, cedar 0.00183 0.00419 Tupelo, water 0.00144 0.00267Hackberry 0.00165 0.00315 Walnut, black 0.00190 0.00274Hickory, pecan 0.00169 0.00315 Willow, black 0.00112 0.00308Hickory, true 0.00259 0.00411 Willow, Pacific 0.00099 0.00319Holly, American 0.00165 0.00353 Yellow-poplar 0.00158 0.00289
Softwoods
Baldcypress 0.00130 0.00216 Pine, eastern white 0.00071 0.00212Cedar, yellow 0.00095 0.00208 Pine, jack 0.00126 0.00230Cedar, Atlantic white 0.00099 0.00187 Pine, loblolly 0.00165 0.00259Cedar, eastern red 0.00106 0.00162 Pine, pond 0.00165 0.00259Cedar, Incense 0.00112 0.00180 Pine, lodgepole 0.00148 0.00234Cedar, Northern whiteb 0.00101 0.00229 Pine, Jeffrey 0.00148 0.00234Cedar, Port-Orford 0.00158 0.00241 Pine, longleaf 0.00176 0.00263Cedar, western redb 0.00111 0.00234 Pine, ponderosa 0.00133 0.00216Douglas-fir, Coast-type 0.00165 0.00267 Pine, red 0.00130 0.00252Douglas-fir, Interior north 0.00130 0.00241 Pine, shortleaf 0.00158 0.00271Douglas-fir, Interior west 0.00165 0.00263 Pine, slash 0.00187 0.00267Fir, balsam 0.00099 0.00241 Pine, sugar 0.00099 0.00194Fir, California red 0.00155 0.00278 Pine, Virginia 0.00144 0.00252Fir, noble 0.00148 0.00293 Pine, western white 0.00141 0.00259
12–17
Because commercial lumber is often not perfectly flatsawn orquartersawn, this procedure will probably overestimate widthshrinkage and underestimate thickness shrinkage. Note alsothat if both a size change and the percentage of moisturecontent are known, Equation (12–2) can be used to calculatethe original moisture content.
Calculation Based onGreen DimensionsApproximate dimensional changes associated with moisturecontent changes greater than 6% to 14% , or when one
moisture value is outside of those limits, can be calculatedby
∆DD M M
S M= −
( ) − +I F I
T I
( )
/30 100 30 (12–3)
where ST is tangential shrinkage (%) from green to ovendry(Ch. 3, Tables 3–5 and 3–6) (use radial shrinkage SR whenappropriate).
Neither MI nor MF should exceed 30%, the assumed moisturecontent value when shrinkage starts for most species.
Table 12–5. Coefficients for dimensional change as a result of shrinkage or swelling within moisture contentlimits of 6% to 14% (CT = dimensional change coefficient for tangential direction; CR = radial direction)—con.
Dimensional changecoefficienta
Dimensional changecoefficienta
Species CR CT Species CR CT
Softwoods—con.
Fir, Pacific silver 0.00151 0.00327 Redwood, old-growthb 0.00120 0.00205Fir, subalpine 0.00088 0.00259 Redwood, second-growthb 0.00101 0.00229Fir, grand 0.00112 0.00245 Spruce, black 0.00141 0.00237Fir, white 0.00112 0.00245 Spruce, Engelmann 0.00130 0.00248Hemlock, eastern 0.00102 0.00237 Spruce, red 0.00130 0.00274Hemlock, western 0.00144 0.00274 Spruce, white 0.00130 0.00274Larch, western 0.00155 0.00323 Spruce, Sitka 0.00148 0.00263
Tamarack 0.00126 0.00259
Imported Woods
Andiroba, crabwood 0.00137 0.00274 Light red “Philippine mahogany” 0.00126 0.00241Angelique 0.00180 0.00312 Limba 0.00151 0.00187Apitong, keruingb
(all Dipterocarpus spp.)0.00243 0.00527 Mahoganyb
Meranti0.001720.00126
0.002380.00289
Avodire 0.00126 0.00226 Obeche 0.00106 0.00183Balsa 0.00102 0.00267 Okoume 0.00194 0.00212Banak 0.00158 0.00312 Parana, pine 0.00137 0.00278Cativo 0.00078 0.00183 Paumarfim 0.00158 0.00312Cuangare 0.00183 0.00342 Primavera 0.00106 0.00180Greenheartb 0.00390 0.00430 Ramin 0.00133 0.00308Irokob 0.00153 0.00205 Santa Maria 0.00187 0.00278Khaya 0.00141 0.00201 Spanish-cedar 0.00141 0.00219Kokroduab 0.00148 0.00297 Teakb 0.00101 0.00186Lauans: dark red“Philippine mahogany”
0.00133 0.00267
aPer 1% change in moisture content, based on dimension at 10% moisture content and a straight-line relationship between moisture content at which shrinkage starts and total shrinkage. (Shrinkage assumed to start at 30% for all species except those indicated by footnote b.)bShrinkage assumed to start at 22% moisture content.
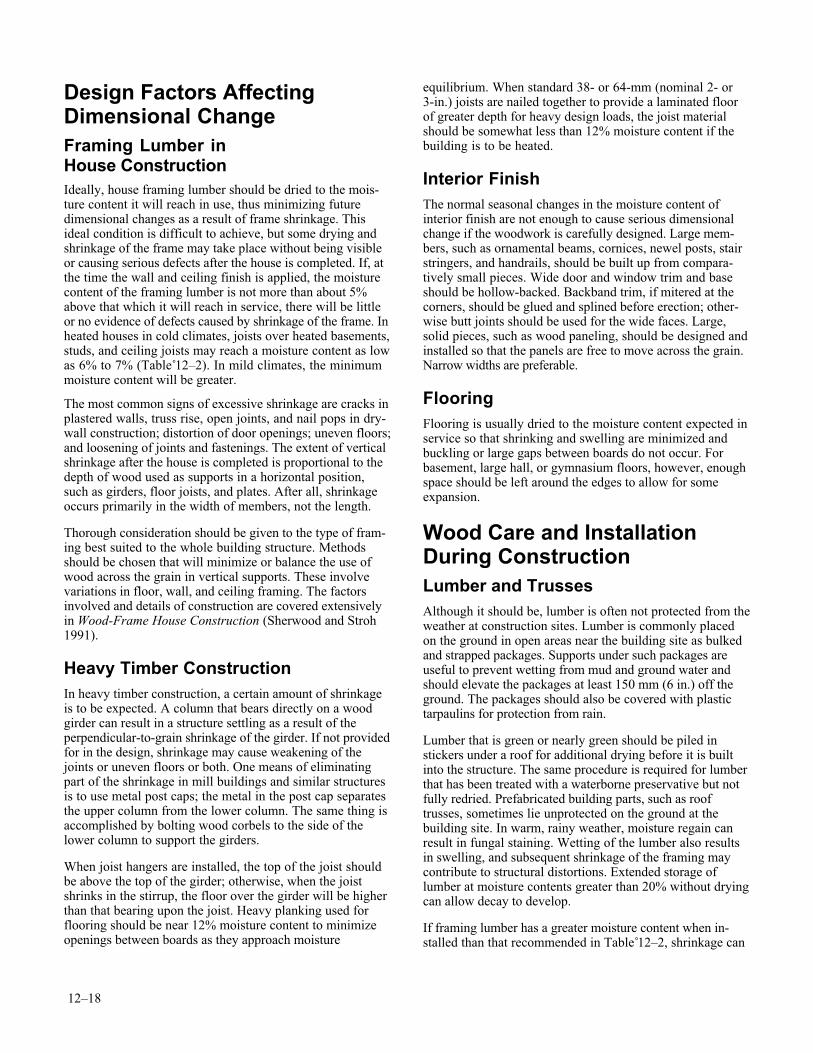
12–18
Design Factors AffectingDimensional ChangeFraming Lumber inHouse ConstructionIdeally, house framing lumber should be dried to the mois-ture content it will reach in use, thus minimizing futuredimensional changes as a result of frame shrinkage. Thisideal condition is difficult to achieve, but some drying andshrinkage of the frame may take place without being visibleor causing serious defects after the house is completed. If, atthe time the wall and ceiling finish is applied, the moisturecontent of the framing lumber is not more than about 5%above that which it will reach in service, there will be littleor no evidence of defects caused by shrinkage of the frame. Inheated houses in cold climates, joists over heated basements,studs, and ceiling joists may reach a moisture content as lowas 6% to 7% (Table 12–2). In mild climates, the minimummoisture content will be greater.
The most common signs of excessive shrinkage are cracks inplastered walls, truss rise, open joints, and nail pops in dry-wall construction; distortion of door openings; uneven floors;and loosening of joints and fastenings. The extent of verticalshrinkage after the house is completed is proportional to thedepth of wood used as supports in a horizontal position,such as girders, floor joists, and plates. After all, shrinkageoccurs primarily in the width of members, not the length.
Thorough consideration should be given to the type of fram-ing best suited to the whole building structure. Methodsshould be chosen that will minimize or balance the use ofwood across the grain in vertical supports. These involvevariations in floor, wall, and ceiling framing. The factorsinvolved and details of construction are covered extensivelyin Wood-Frame House Construction (Sherwood and Stroh1991).
Heavy Timber ConstructionIn heavy timber construction, a certain amount of shrinkageis to be expected. A column that bears directly on a woodgirder can result in a structure settling as a result of theperpendicular-to-grain shrinkage of the girder. If not providedfor in the design, shrinkage may cause weakening of thejoints or uneven floors or both. One means of eliminatingpart of the shrinkage in mill buildings and similar structuresis to use metal post caps; the metal in the post cap separatesthe upper column from the lower column. The same thing isaccomplished by bolting wood corbels to the side of thelower column to support the girders.
When joist hangers are installed, the top of the joist shouldbe above the top of the girder; otherwise, when the joistshrinks in the stirrup, the floor over the girder will be higherthan that bearing upon the joist. Heavy planking used forflooring should be near 12% moisture content to minimizeopenings between boards as they approach moisture
equilibrium. When standard 38- or 64-mm (nominal 2- or3-in.) joists are nailed together to provide a laminated floorof greater depth for heavy design loads, the joist materialshould be somewhat less than 12% moisture content if thebuilding is to be heated.
Interior FinishThe normal seasonal changes in the moisture content ofinterior finish are not enough to cause serious dimensionalchange if the woodwork is carefully designed. Large mem-bers, such as ornamental beams, cornices, newel posts, stairstringers, and handrails, should be built up from compara-tively small pieces. Wide door and window trim and baseshould be hollow-backed. Backband trim, if mitered at thecorners, should be glued and splined before erection; other-wise butt joints should be used for the wide faces. Large,solid pieces, such as wood paneling, should be designed andinstalled so that the panels are free to move across the grain.Narrow widths are preferable.
FlooringFlooring is usually dried to the moisture content expected inservice so that shrinking and swelling are minimized andbuckling or large gaps between boards do not occur. Forbasement, large hall, or gymnasium floors, however, enoughspace should be left around the edges to allow for someexpansion.
Wood Care and InstallationDuring ConstructionLumber and TrussesAlthough it should be, lumber is often not protected from theweather at construction sites. Lumber is commonly placedon the ground in open areas near the building site as bulkedand strapped packages. Supports under such packages areuseful to prevent wetting from mud and ground water andshould elevate the packages at least 150 mm (6 in.) off theground. The packages should also be covered with plastictarpaulins for protection from rain.
Lumber that is green or nearly green should be piled instickers under a roof for additional drying before it is builtinto the structure. The same procedure is required for lumberthat has been treated with a waterborne preservative but notfully redried. Prefabricated building parts, such as rooftrusses, sometimes lie unprotected on the ground at thebuilding site. In warm, rainy weather, moisture regain canresult in fungal staining. Wetting of the lumber also resultsin swelling, and subsequent shrinkage of the framing maycontribute to structural distortions. Extended storage oflumber at moisture contents greater than 20% without dryingcan allow decay to develop.
If framing lumber has a greater moisture content when in-stalled than that recommended in Table 12–2, shrinkage can
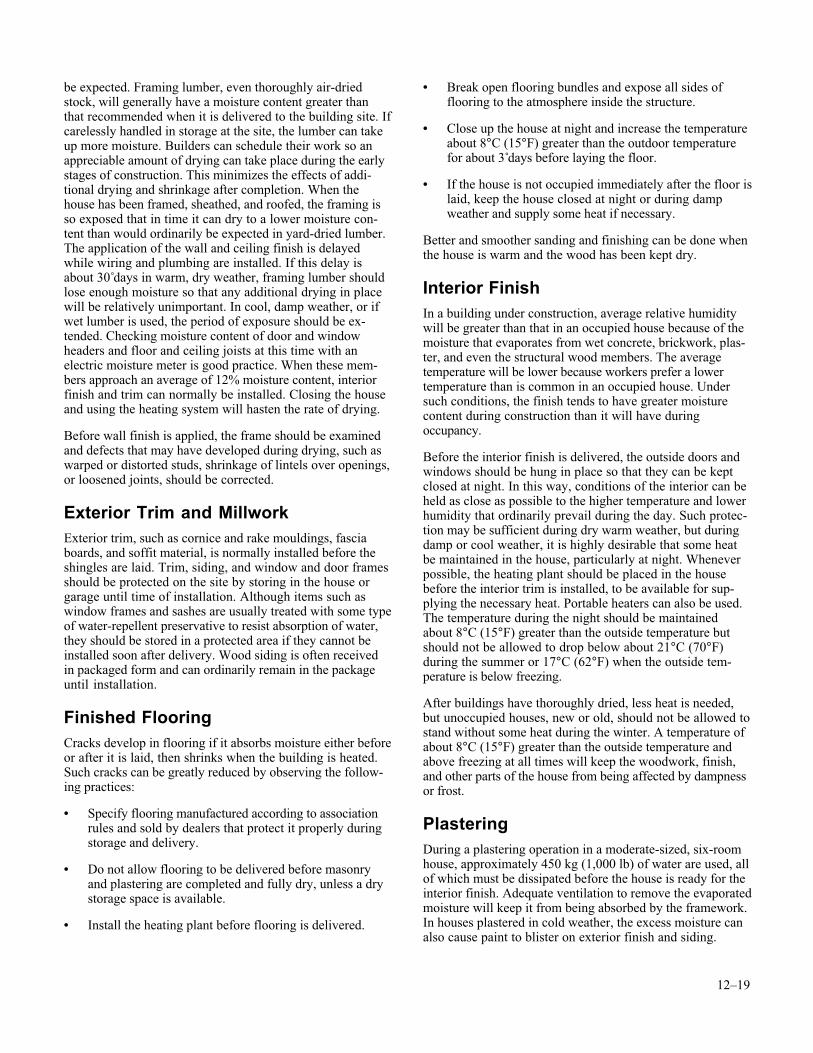
12–19
be expected. Framing lumber, even thoroughly air-driedstock, will generally have a moisture content greater thanthat recommended when it is delivered to the building site. Ifcarelessly handled in storage at the site, the lumber can takeup more moisture. Builders can schedule their work so anappreciable amount of drying can take place during the earlystages of construction. This minimizes the effects of addi-tional drying and shrinkage after completion. When thehouse has been framed, sheathed, and roofed, the framing isso exposed that in time it can dry to a lower moisture con-tent than would ordinarily be expected in yard-dried lumber.The application of the wall and ceiling finish is delayedwhile wiring and plumbing are installed. If this delay isabout 30 days in warm, dry weather, framing lumber shouldlose enough moisture so that any additional drying in placewill be relatively unimportant. In cool, damp weather, or ifwet lumber is used, the period of exposure should be ex-tended. Checking moisture content of door and windowheaders and floor and ceiling joists at this time with anelectric moisture meter is good practice. When these mem-bers approach an average of 12% moisture content, interiorfinish and trim can normally be installed. Closing the houseand using the heating system will hasten the rate of drying.
Before wall finish is applied, the frame should be examinedand defects that may have developed during drying, such aswarped or distorted studs, shrinkage of lintels over openings,or loosened joints, should be corrected.
Exterior Trim and MillworkExterior trim, such as cornice and rake mouldings, fasciaboards, and soffit material, is normally installed before theshingles are laid. Trim, siding, and window and door framesshould be protected on the site by storing in the house orgarage until time of installation. Although items such aswindow frames and sashes are usually treated with some typeof water-repellent preservative to resist absorption of water,they should be stored in a protected area if they cannot beinstalled soon after delivery. Wood siding is often receivedin packaged form and can ordinarily remain in the packageuntil installation.
Finished FlooringCracks develop in flooring if it absorbs moisture either beforeor after it is laid, then shrinks when the building is heated.Such cracks can be greatly reduced by observing the follow-ing practices:
• Specify flooring manufactured according to associationrules and sold by dealers that protect it properly duringstorage and delivery.
• Do not allow flooring to be delivered before masonryand plastering are completed and fully dry, unless a drystorage space is available.
• Install the heating plant before flooring is delivered.
• Break open flooring bundles and expose all sides offlooring to the atmosphere inside the structure.
• Close up the house at night and increase the temperatureabout 8°C (15°F) greater than the outdoor temperaturefor about 3 days before laying the floor.
• If the house is not occupied immediately after the floor islaid, keep the house closed at night or during dampweather and supply some heat if necessary.
Better and smoother sanding and finishing can be done whenthe house is warm and the wood has been kept dry.
Interior FinishIn a building under construction, average relative humiditywill be greater than that in an occupied house because of themoisture that evaporates from wet concrete, brickwork, plas-ter, and even the structural wood members. The averagetemperature will be lower because workers prefer a lowertemperature than is common in an occupied house. Undersuch conditions, the finish tends to have greater moisturecontent during construction than it will have duringoccupancy.
Before the interior finish is delivered, the outside doors andwindows should be hung in place so that they can be keptclosed at night. In this way, conditions of the interior can beheld as close as possible to the higher temperature and lowerhumidity that ordinarily prevail during the day. Such protec-tion may be sufficient during dry warm weather, but duringdamp or cool weather, it is highly desirable that some heatbe maintained in the house, particularly at night. Wheneverpossible, the heating plant should be placed in the housebefore the interior trim is installed, to be available for sup-plying the necessary heat. Portable heaters can also be used.The temperature during the night should be maintainedabout 8°C (15°F) greater than the outside temperature butshould not be allowed to drop below about 21°C (70°F)during the summer or 17°C (62°F) when the outside tem-perature is below freezing.
After buildings have thoroughly dried, less heat is needed,but unoccupied houses, new or old, should not be allowed tostand without some heat during the winter. A temperature ofabout 8°C (15°F) greater than the outside temperature andabove freezing at all times will keep the woodwork, finish,and other parts of the house from being affected by dampnessor frost.
PlasteringDuring a plastering operation in a moderate-sized, six-roomhouse, approximately 450 kg (1,000 lb) of water are used, allof which must be dissipated before the house is ready for theinterior finish. Adequate ventilation to remove the evaporatedmoisture will keep it from being absorbed by the framework.In houses plastered in cold weather, the excess moisture canalso cause paint to blister on exterior finish and siding.
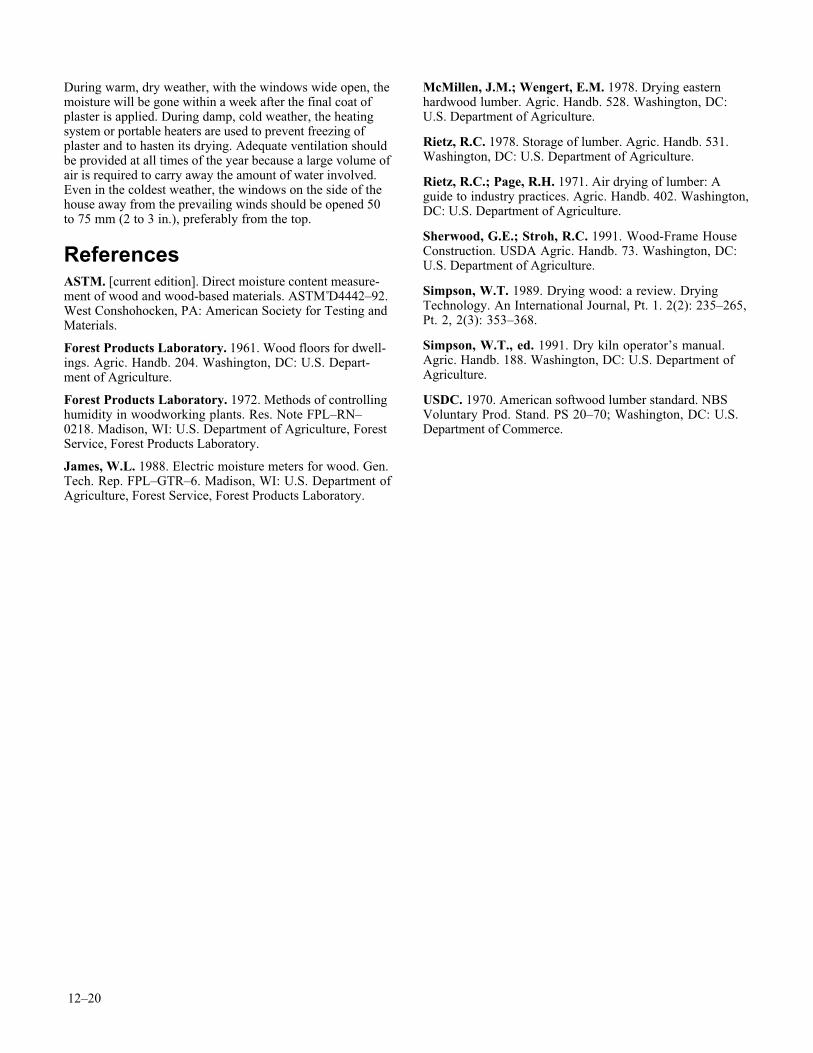
12–20
During warm, dry weather, with the windows wide open, themoisture will be gone within a week after the final coat ofplaster is applied. During damp, cold weather, the heatingsystem or portable heaters are used to prevent freezing ofplaster and to hasten its drying. Adequate ventilation shouldbe provided at all times of the year because a large volume ofair is required to carry away the amount of water involved.Even in the coldest weather, the windows on the side of thehouse away from the prevailing winds should be opened 50to 75 mm (2 to 3 in.), preferably from the top.
ReferencesASTM. [current edition]. Direct moisture content measure-ment of wood and wood-based materials. ASTM D4442–92.West Conshohocken, PA: American Society for Testing andMaterials.
Forest Products Laboratory. 1961. Wood floors for dwell-ings. Agric. Handb. 204. Washington, DC: U.S. Depart-ment of Agriculture.
Forest Products Laboratory. 1972. Methods of controllinghumidity in woodworking plants. Res. Note FPL–RN–0218. Madison, WI: U.S. Department of Agriculture, ForestService, Forest Products Laboratory.
James, W.L. 1988. Electric moisture meters for wood. Gen.Tech. Rep. FPL–GTR–6. Madison, WI: U.S. Department ofAgriculture, Forest Service, Forest Products Laboratory.
McMillen, J.M.; Wengert, E.M. 1978. Drying easternhardwood lumber. Agric. Handb. 528. Washington, DC:U.S. Department of Agriculture.
Rietz, R.C. 1978. Storage of lumber. Agric. Handb. 531.Washington, DC: U.S. Department of Agriculture.
Rietz, R.C.; Page, R.H. 1971. Air drying of lumber: Aguide to industry practices. Agric. Handb. 402. Washington,DC: U.S. Department of Agriculture.
Sherwood, G.E.; Stroh, R.C. 1991. Wood-Frame HouseConstruction. USDA Agric. Handb. 73. Washington, DC:U.S. Department of Agriculture.
Simpson, W.T. 1989. Drying wood: a review. DryingTechnology. An International Journal, Pt. 1. 2(2): 235–265,Pt. 2, 2(3): 353–368.
Simpson, W.T., ed. 1991. Dry kiln operator’s manual.Agric. Handb. 188. Washington, DC: U.S. Department ofAgriculture.
USDC. 1970. American softwood lumber standard. NBSVoluntary Prod. Stand. PS 20–70; Washington, DC: U.S.Department of Commerce.

FromForest Products Laboratory. 1999. Wood handbook—Wood as an engineering material.Gen. Tech. Rep. FPL–GTR–113. Madison, WI: U.S. Department of Agriculture, Forest Service,Forest Products Laboratory. 463 p.