Wonderfonteinspruit Catchment Area risk areas
21
Wonderfonteinspruit Catchment Area Areas of Concern Martin van Veelen June 2008
Transcript of Wonderfonteinspruit Catchment Area risk areas
Wonderfonteinspruit Catchment Area
Areas of Concern
Martin van Veelen
June 2008
2
Contents
• Introduction• Objective• Approach• Methodology• Results
3
Acknowledgement
• The information presented here was derived from work done by Professor Frank Winde, School of Environmental Sciences and Development, North West University

4
Introduction
• A Specialist Task Team has been appointed by the DWAF and the NNR to formulate a plan of action for the remediation of radioactive contamination in the Wonderfonteinspruit Catchment Area
• The STT consists of local and international specialists
5
STT Composition
• Mr Marius Keet :DWAF :Proj Man• Dr Martin van Veelen :Team Leader• Ms Kavita Pema :Admin• Mr Mogwera Khoathane• Ms Gugu Mlangeni• Prof Frank Winde• Prof Gerrit Basson• Mr Ronald Cohen• Dr Gert de Beer• Dr Don Lush
6
Objective
• The objective is to identify, categorize and prioritise areas where radioactivity as a result of mining activities poses a health risk to the community, with the view of developing a plan of action to reduce the risk to acceptable levels
7
Approach
• Use information from existing studies– IWQS (1999)– WRC 1214 (2004)– BSA (2007) (‘Brenck Report’)
• Define what constitutes risk– Level of contamination– Accessibility
8
Methodology
• Create a base map– River system– Mining activities– Human activities– Geology– Areas identified by previous studies
• Assess risk• Categorise and rank

9
Base Maps
• IWQS (1999) focussed on uranium in water
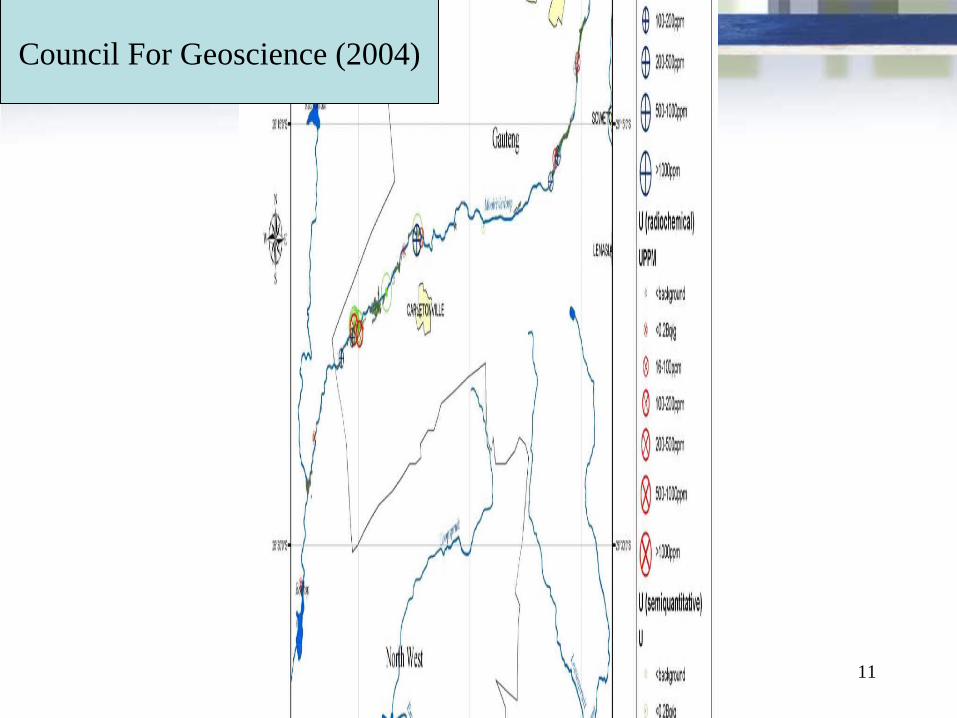
• Council for Geoscience (2004) focussed on sediment
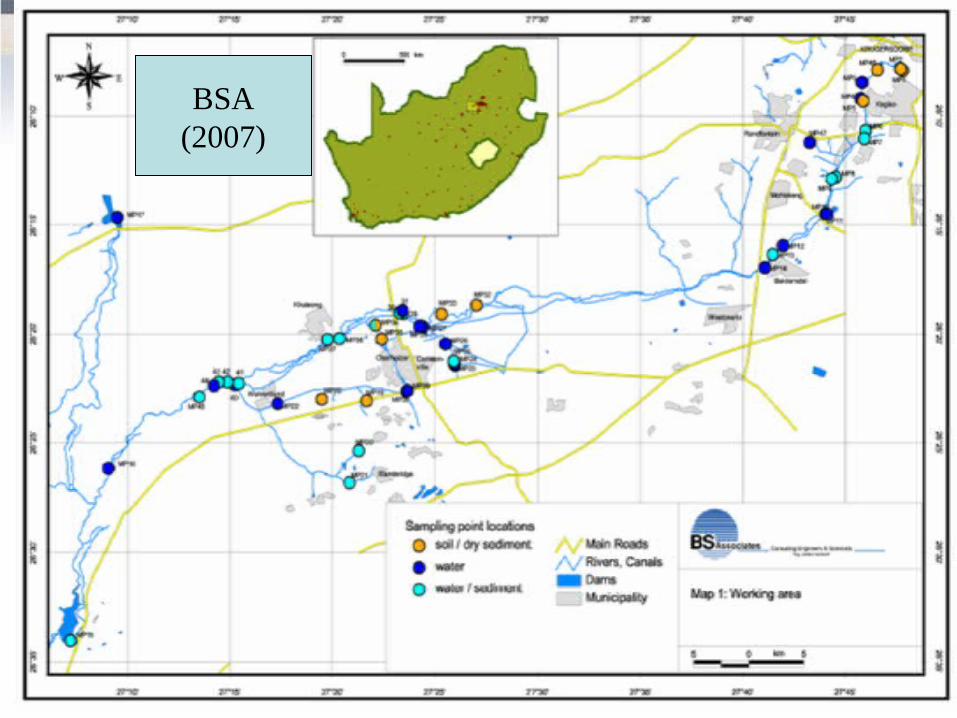
• BSA (2007) considered pathways

10
IWQS (1999)
11
Council For Geoscience (2004)
12
BSA(2007)
13
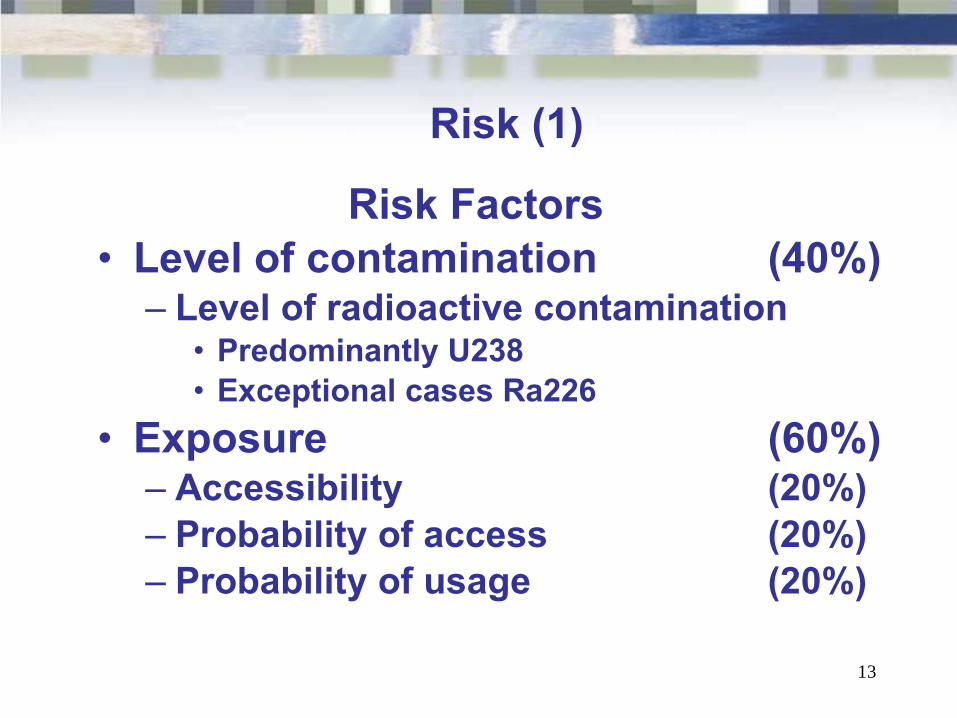
Risk (1)
Risk Factors• Level of contamination (40%)
– Level of radioactive contamination• Predominantly U238• Exceptional cases Ra226
• Exposure (60%)– Accessibility (20%)– Probability of access (20%)– Probability of usage (20%)

14
Risk (2)
• In order to categorize risk, each risk factor is weighted according to predetermined criteria:– Low : 1– Medium : 2 – High : 4
• HR =0,4CL+0,2A+0,2AP+0,2UP (HR: 1…4 )

15
Outcome Categories
• low risk: 1 to <2: requires further studies before establishing possible need for interventions
• medium risk: 2 to 3: requires further studies, may necessitate medium-term intervention
• high risk: >3 to 4: requires immediate intervention

16
Contamination
Class Natural Legislativebackground limit
• low < 10x <1x• medium 10x to 100x 1x to 2x• high >100x >2x
17
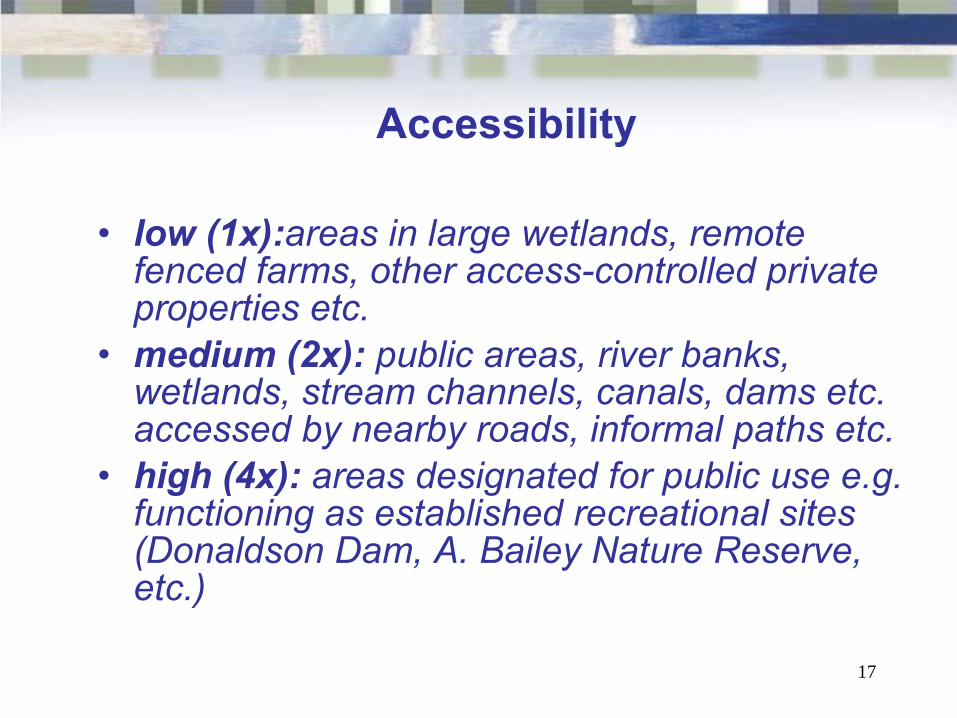
Accessibility
• low (1x):areas in large wetlands, remote fenced farms, other access-controlled private properties etc.
• medium (2x): public areas, river banks, wetlands, stream channels, canals, dams etc. accessed by nearby roads, informal paths etc.
• high (4x): areas designated for public use e.g. functioning as established recreational sites (Donaldson Dam, A. Bailey Nature Reserve, etc.)

18
Access probability
• low (1x): -remote areas well away from larger settlements (>5km walking distance, >15km driving distance), and no special attraction (such as fishing, swimming etc.), and no of local residents <10
• medium (2x): -areas in the vicinity of larger settlements (2-5km walking distance), or some features of special attraction (such as fishing, swimming etc.), or 10-30 local residents
• high (4x):-areas next to larger settlements (<2km walking distance), or site has special attraction (such as fishing, swimming etc.), or >30 local residents

19
Usage probability
• low (1x): -remote groundwater boreholes not used for domestic or agricultural purpose, -sediments in inaccessible areas such as large wetland with dense vegetation -sediments in sufficiently deep dams where no remobilisation occurs through normal activities (swimming, fishing….)
• medium (2x): -boreholes used for domestic/ agric. purpose,-surface water (streams, dams, mine canals)-water used for fishing, swimming-sediments in shallow dams, floodplain soil at commercial farms, no nearby informal settlements
• high (4x):-surface water in streams, dams, mine canals or -sediments in shallow dams, wetlands, floodplain soil in vicinity to townships/ informal settlements-areas with salt crusts-communal gardens in floodplain farming on contaminated site

20
21
Conclusion
• The map is a work in process and not meant to be conclusive
• The areas of concern are categorised and do not represent a quantification
• It identifies priority areas for urgent action
• All contamination will have to addressed in due course