Women’s Work and Economic development
30
Women’s Work and Women’s Work and Economic development Economic development Author(s): Kristin Mammen and Christina Paxson Source: The Journal of Economic Perspectives, Vol. 14, No. 4, (Autumn, 2000), pp. 141-164 Published by: American Economic Association Stable URL: http://www.jstor.org/stable/2647079 Presented by Moshe Shaul (S.ID 029429438) 16/07/20008
description
Women’s Work and Economic development. Author(s): Kristin Mammen and Christina Paxson Source: The Journal of Economic Perspectives, Vol. 14, No. 4, (Autumn, 2000), pp. 141-164 Published by: American Economic Association Stable URL: http://www.jstor.org/stable/2647079 - PowerPoint PPT Presentation
Transcript of Women’s Work and Economic development

Women’s Work and Women’s Work and Economic developmentEconomic development
Author(s): Kristin Mammen and Christina Paxson
Source: The Journal of Economic Perspectives, Vol. 14, No. 4, (Autumn, 2000), pp. 141-164
Published by: American Economic Association
Stable URL: http://www.jstor.org/stable/2647079
Presented by Moshe Shaul (S.ID 029429438) 16/07/20008

Essay ObjectiveEssay Objective
How the role of women in the labor force varies with the level of economic development.
Note: Although there is a diversity across countries at similar income levels in how much women work and the types of jobs they perform, several clear patterns emerge from the data.
2Moshe Shaul Student ID-029429438

ContentContentFirst part: presents the theoretical Model.Second part: Presents evidence from cross
country data. Third part: verifies the consistency
between the cross-country data and patterns within India and Thailand
Forth part: discusses the recent literature on resource allocation to women within households in poor counties.
3Moshe Shaul Student ID-029429438

Women’s Work and Economic Women’s Work and Economic Development in TheoryDevelopment in Theory
Moshe Shaul Student ID-029429438 4
Women’s labor supply decision
Earned Unearned
Cost of her work = Education level, Experience and Skill level
Earning of her husband and transfer income of her family
Positive affect Negative affect

How should Economic Development How should Economic Development Affect the Labor Force of Women?Affect the Labor Force of Women?
Moshe Shaul Student ID-029429438 5
Man’s opportunities improve relative to women’s, It plays an important role how women’s labor force participation changes with development.

Competitive Labor MarketCompetitive Labor Market
Moshe Shaul Student ID-029429438 6
Labor markets do not function competitively in developing counties, especially for women. Following are some of the factors restricting women from working outside her home:
LawsCustom or social norms (manual jobs)Not compatible with child rearing
creating fixed cost of working off-farm.

Agriculture to Urbanization Agriculture to Urbanization (industrialization) Process(industrialization) Process
Moshe Shaul Student ID-029429438 7
The process of urbanization and new blue-collar jobs decrease the number of farms and thus decrease the opportunities for women in absolute terms (Goldin 1995).
Until women can acquire the required schooling and transferable skills to find a suitable employment in firms of modern economy the opertunities relative to men may decline (Schlutz 1988)

Women’s Labor Force in Women’s Labor Force in Developed CountriesDeveloped Countries
Moshe Shaul Student ID-029429438 8
What explain the increase of women’s labor force in developed countries?
a) Growth of white-collar jobsb) Gains of women education

U-Shaped RelationshipU-Shaped Relationship
Moshe Shaul Student ID-029429438 9
Economic Development
Women's labor force participation
Poor CountiesWomen works in farm
Urbanization and social barriers
against women
Women education level raise and start to work in white-collar jobs

Social Norms and White/Blue Social Norms and White/Blue Collar JobsCollar Jobs
Moshe Shaul Student ID-029429438 10
Why should social norms dictate that white-collar jobs are “acceptable” for married women whereas blue-collar jobs are not?
a) Women dislike factory work and marriage can be used as escape opportunity.
b) In some countries it is typical for manufacturing firms to terminate women’s jobs upon marriage.
c) Societies stigmatize the husbands of women who do blue-collar work (e.g. lazy, avoid his obligation to the family etc), Note: this reason is not relevant to white-collar jobs (since such women typically have more educated husbands which have relative high income)
d) Factory does not pay wives enough to compensate for the fixed costs of working away from home.

ContentContentFirst part: presents the theoretical Model.Second part: Presents evidence from cross
country data. Third part: verifies the consistency
between the cross-country data and patterns within India and Thailand
Forth part: discusses the recent literature on resource allocation to women within households in poor counties.
11Moshe Shaul Student ID-029429438

Database Description and Database Description and Objectives Objectives
Moshe Shaul Student ID-029429438 12
Geographic location: 90 countiesDates: from the 1970s and 1980sObjectives: trace out the relationships between:
Economic development And Several indicators of women’s status:
Investment in education Labor force participation (self employment, employer or
employee)
Participation in wage work (employee)
Fertility

Research's Evidence-Research's Evidence-Education Analysis Education Analysis
Moshe Shaul Student ID-029429438 13
Top curve description: 1) Women's education levels and economic development
• Women's education levels increase with economic development both in absolute and relative terms to those of men.
• Note: Education is a normal consumer good, (more of which is demanded at higher income levels).
2) Women's education levels have risen over time especially for lower and middle income countries.

Research's Evidence-Research's Evidence-Education Analysis, cont Education Analysis, cont
Moshe Shaul Student ID-029429438 14
Bottom curve description:• Show the results for female - male education gap. (Average years
of adult female minus Average years of adult male schooling at age of 25). • The largest gap (about 2 years) at a per capita GDP of about 1000$, than shrinks as income
rises.
• Since education level for both men and women rise with income, the gap of education narrows throughout the income range.

Research's Evidence- Women’s labor Research's Evidence- Women’s labor force participation vs. Income level force participation vs. Income level relation Analysis relation Analysis
Moshe Shaul Student ID-029429438 15
African South Asian
Country
South America Central America South European East Asian North European North American

Research's Evidence- Women’s Research's Evidence- Women’s labor force participation vs. labor force participation vs. Income level relation Analysis Income level relation Analysis
Moshe Shaul Student ID-029429438 16
Women’s labor force participation vs. Income level relation has “U-shape” (Goldin 1995)
High participation in very low and very high incomes. Labor force participation is measured for women
aged 45-59, who are past the child rearing stage. (however, similar results would be obtained if younger women were included.)

Research's Evidence- Women’s wages VS. Research's Evidence- Women’s wages VS. Fertility Rate relation Analysis Fertility Rate relation Analysis
Moshe Shaul Student ID-029429438 17
Income ,Family enterprise Paid jobs, Fertility

Research's Evidence- Women’s wages VS. Research's Evidence- Women’s wages VS. Fertility Rate relation Analysis. Cont’ Fertility Rate relation Analysis. Cont’
Moshe Shaul Student ID-029429438 18
If we assume that children are normal goods thenwage may have the following affect:
Wage Fertility
But if we consider the opportunity cost of women’s time raises and it has largest effect then wage may have the following affect:
Wage Fertility

Research's Evidence- Women’s wages VS. Research's Evidence- Women’s wages VS. Fertility Rate relation Analysis. Cont’ Fertility Rate relation Analysis. Cont’
Moshe Shaul Student ID-029429438 19
Other factor may drive fertility decline :a) Reduction in child mortality that come with
development may allow for lower fertility level if the “demand” for complete family size which increases or remains the same.
b) Development of public or private pension systems decries the expectation from children to provide income for their parents especially in their old age.

ContentContentFirst part: presents the theoretical Model.Second part: Presents evidence from cross
country data. Third part: verifies the consistency
between the cross-country data and patterns within India and Thailand.
Forth part: discusses the recent literature on resource allocation to women within households in poor counties.
20Moshe Shaul Student ID-029429438

Two examples: Thailand and IndiaTwo examples: Thailand and India
These countries were not chosen to be representative of the entire developing world, indeed, no two counties can be.
21Moshe Shaul Student ID-029429438
Characteristic Thailand IndiaRecent growth (1980,1995 GDP per capita)
+125% +69%
Women’s Labor force Relative high Relative low
Women’s ownership and control of lands
Acceptable Against social norms
Distribution of rural household lands
Fairly evenly distributed 72% own the land11% rent the land
16% farm laborer
Less equal distribution36% farm laborer

Thailand Across Cohort PatternsThailand Across Cohort Patterns
22Moshe Shaul Student ID-029429438
Thai Socioeconomic surveys allow us to track birth cohorts over time, we can examine how women's labor force participation and work activity have changed during a period of rapid economic growth. Notes:a)Below data are not applicable to India because of lack of available data but we expect to have the same behavior.b)The relatively flat cohort lines indicate that this fraction varies little over time within cohorts.

Male-Female Gap in Education VS. Male-Female Gap in Education VS. Expenditure Expenditure
23Moshe Shaul Student ID-029429438
a) Educational achievement is lower for women then man at both graphs.
b) In both countries, the male-female gap in education rises with expenditure (e.g. spending) in rural areas, but remain steady with expenditure in urban areas.

Women Labor force VS. Women Labor force VS. Expenditure Expenditure
24Moshe Shaul Student ID-029429438
a) Labor force definition: applicable to women as employee, employer or self employment (e.g. free family labor)
b) Women labor force is lower in both countries for urban areas (due to
fewer work opportunities).c) In urban areas women labor force follows the “U shape”

Women Working for Wages VS. Women Working for Wages VS. Expenditure Expenditure
25Moshe Shaul Student ID-029429438
a) The probability of working as an employee increases steadily with living standard.
b) In India there is relatively large number of landless or near landless poor household, the member of which often work as casual on lager farms. Thus work as “free family labor” is not an option for many women in the poorest families.
Thai Free family labor
India’s women must work due to lack of lands

Education affect Education affect (regression results)(regression results)
26Moshe Shaul Student ID-029429438
a) Secondary school-I. In India women with secondary school has minor affect on the
probability to be part of labor force.II. In Thai secondary school has no affect on the probability to be part of
labor force.b) Post-secondary school-
In both countries Post-secondary school has large affect on the probability to be part of labor force.
c) Rural women-In both countries are more likely to be part of labor force
d) Spousal education- Has negative affect on participation in labor force in India but not in Thai.
e) Special tribe- In India being a member of a specific tribe may increase the affect on
participation in labor force.f) Following are more affects of education:
I. More likely to work in non-manual jobs (e.g. white-collar)II. More likely to work as employee rather than self-employed

ContentContentFirst part: presents the theoretical Model.Second part: Presents evidence from cross
country data. Third part: verifies the consistency
between the cross-country data and patterns within India and Thailand
Forth part: discusses the recent literature on resource allocation to women within households in poor counties.
27Moshe Shaul Student ID-029429438
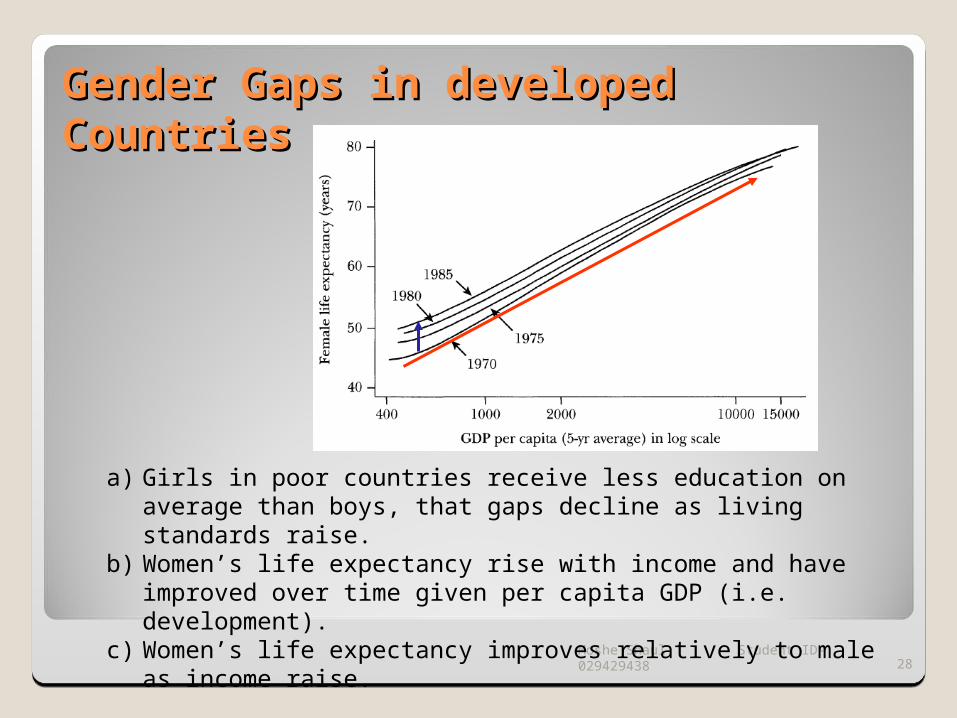
Gender Gaps in developed Gender Gaps in developed Countries Countries
28Moshe Shaul Student ID-029429438
a) Girls in poor countries receive less education on average than boys, that gaps decline as living standards raise.
b) Women’s life expectancy rise with income and have improved over time given per capita GDP (i.e. development).
c) Women’s life expectancy improves relatively to male as income raise.

Gender Gaps in developed Gender Gaps in developed Countries. cont’ Countries. cont’
29Moshe Shaul Student ID-029429438
d) Women and girls in developed countries receive fewer resources within the household.
e) More labor market opportunities, higher wages may increase women’s well being both through direct affect and also by strengthening their bargaining position within households.
f) Difference in men’s and women’s well being and achievement as adult may be rooted in difference in investment they received as boys and girls.
g) One possible reason why parents invest less in girl is the higher future returns to parents.
Conclusion Conclusion
30Moshe Shaul Student ID-029429438
Mortality rate and education levels indicates that women’s well being improves on average with development, both in absolute term and relative to men.