WOMEN VETERANS PROFILE - United States Department of Labor · PDF fileSouth Carolina 3,609,405...
8
I ssue brief AGE In 2011, women veterans were more likely to be younger than men veterans and older than non-veterans of either gender. Almost 84 percent of women veterans were of working age (17-64 years), compared to 55 percent of men veterans and 81 percent of women non-veterans. 2 EDUCATION In 2013, more women veterans completed some college or obtained an Associate, Bachelor’s, Master’s or higher degree, compared to men veterans or non-veterans of either gender. 3 47 41 MEDIAN AGE Male Nonveterans Women Nonveterans Male Veterans Women Veterans 64 MEDIAN AGE MEDIAN AGE 49 MEDIAN AGE Median Age 10.1 7.8 High School Some College or Associate Bachelor’s Master’s or Higher Women Veterans Women Women Nonveterans 20.9 29.4 43.1 21.2 19.1 29.9 7.5 6.7 High School Some College or Associate Bachelor’s Master’s or Higher 32.7 30.5 33.7 16.7 19 26.2 Male Veterans Male Male Nonveterans Educational Attainment in Percent EMPLOYMENT BY PROFESSION In 2013, more women veterans worked in management, professional and related occupations than did men veterans or non-veterans of either gender. Fewer women veterans worked in sales, office and service occupations than women non-veterans. Men veterans and men non- veterans worked at nearly the same rates for similar occupations. 4 Women veterans are the fastest growing segment of the veteran community. In 2013, about 2.2 million (or 10 percent) of the nation’s nearly 22 million veterans were women. This number is projected to increase to 2.4 million by 2020. In contrast, the number of male veterans is projected to decrease from 20.1 million to 17.2 million by 2020. 1 WOMEN VETERANS PROFILE 34.9 14.6 16.7 16.4 17.5 36.7 13.8 15.4 15.9 18.2 Production, Transportation and Material Moving Occupations Natural Resources, Construction and Maintenance Occupations Sales and Office Occupations Service Occupations Management, Professionals and Related Occupations 47.8 30.8 15.2 4.9 1.4 41.9 21.5 30.3 5.4 0.9 Employment by Profession in Percent Male Veterans Male Nonveterans Women Veterans Women Nonveterans Page 1
Transcript of WOMEN VETERANS PROFILE - United States Department of Labor · PDF fileSouth Carolina 3,609,405...

Issue briefAGEIn 2011, women veterans were more likely to be younger than men veterans and older than non-veterans of either gender. Almost 84 percent of women veterans were of working age (17-64 years), compared to 55 percent of men veterans and 81 percent of women non-veterans.2
EDUCATIONIn 2013, more women veterans completed some college or obtained an Associate, Bachelor’s, Master’s or higher degree, compared to men veterans or non-veterans of either gender.3
4741MEDIANAGE
MaleNonveterans
WomenNonveterans
MaleVeterans
WomenVeterans
64MEDIANAGE
MEDIANAGE
49MEDIANAGE
Median Age
10.17.8
HighSchool
Some Collegeor Associate
Bachelor’s Master’sor Higher
WomenVeterans
WomenWomenNonveterans
20.9
29.4
43.1
21.2 19.1
29.9
7.5 6.7
HighSchool
Some Collegeor Associate
Bachelor’s Master’sor Higher
32.7 30.533.7
16.719
26.2
MaleVeterans
MaleMaleNonveterans
Educational Attainment in Percent
EMPLOYMENT BY PROFESSIONIn 2013, more women veterans worked in management, professional and related occupations than did men veterans or non-veterans of either gender. Fewer women veterans worked in sales, office and service occupations than women non-veterans. Men veterans and men non-veterans worked at nearly the same rates for similar occupations.4
Women veterans are the fastest growing segment of the veteran community. In 2013, about 2.2 million (or 10 percent) of the nation’s nearly 22 million veterans were women. This number is projected to increase to 2.4 million by 2020. In contrast, the number of male veterans is projected to decrease from 20.1 million to 17.2 million by 2020.1
WOMEN VETERANS PROFILE
34.9
14.6
16.7
16.4
17.5
36.7
13.8
15.4
15.9
18.2
Production, Transportation andMaterial Moving Occupations
Natural Resources, Constructionand Maintenance Occupations
Sales and O�ce Occupations
Service Occupations
Management, Professionals and Related Occupations
47.8
30.8
15.2
4.9 1.4
41.9
21.5
30.3
5.4 0.9
Employment by Profession in Percent
MaleVeterans
MaleNonveterans
WomenVeterans
WomenNonveterans
Page 1

Page 2
Issue briefLOCATIONThe map below shows the total population of women veterans by state.8
The map below shows the population of women veterans as a percentage of the total population of each state.
The number and percentage of women veterans in each state, as reflected in the maps, is listed below:
Women Veterans Population by StateLess than 50,00
50,000 - 100,000
Greater than 100,000
DC
Women Veterans as Percentageof Total State Population
Less than .5% .5% - .99% 1% - 1.5% Greater than 1.5%
DC
EMPLOYMENT BY INDUSTRYIn 2013, women veterans worked in government more than any other industry. The education and health services industries employ the second highest percentage of women veterans. Women veterans worked in education and health services at a similar rate as women non-veterans.5
INCOME LEVELSIn 2012, men and women veterans had a higher median income than their non-veteran counterparts. However, women veterans had a lower median income than men veterans and men non-veterans.6 In 2011, about 7 percent of women veterans and 3 percent of men veterans had no earnings or income.7
Mining, Quarrying, and Oil and Gas Extraction
Agricultural and Related IndustriesWholesale Trade
Construction
Information
Transportation and Utilities
Other Service
Self-Employment
Financial Activities
Leasure and Hospitality
Manufacturing
Professional and Business ServicesRetail Trade
Education and Health ServicesGovernment
MaleVeterans
MaleNonveterans
WomenVeterans
WomenNonveterans
9.0
8.0
7.4
6.4
3.5
20.0
6.9
8.3
10.4
13.7
3.63 64.4
3.57.2
7 4
6.42.06 42.8
16.9
24.1
10.8
8.9
6.2
9.1
7.2
5.25 24.64.61.9 3.4333.44
2.1
3.93 95.75 72.2
10.6
6.7
10.5
11.0
13.6
5.6
6.6
28.6
22.5
9.4
9.1
6.56 54.44 45.45 43.93 93.92.82222 88882.82.6 1.5
1.50.50.1
1.21.5
1.50.80.2
1.11.91.3 1.2
Employment by Industry in Percent
WomenVeterans
$30,929Male
Veterans
$36,672Women
Nonveterans
$21,071Male
Nonveterans
$31,586
Median Income Levels

Page 3
Issue briefState Total Population Women Veteran Population Women Veterans as Percentage of Total PopulationAlabama 3,683,815 29,470 0.80%Alaska 528,429 11,154 2.11%Arizona 4,915,131 44,618 0.91%Arkansas 2,232,468 18,595 0.83%California 28,663,319 129,346 0.45%Colorado 3,923,756 44,466 1.13%Connecticut 2,789,272 10,929 0.39%Delaware 709,551 7,749 1.09%District of Columbia 519,476 4,058 0.78%Florida 15,264,844 120,977 0.79%Georgia 7,372,727 76,803 1.04%
Hawaii 1,051,883 10,880 1.03%Idaho 1,168,256 8,121 0.70%Illinois 9,795,470 44,713 0.46%Indiana 4,944,218 26,712 0.54%Iowa 2,349,788 14,061 0.60%Kansas 2,145,653 15,101 0.70%Kentucky 3,345,524 20,932 0.63%Louisiana 3,467,978 23,936 0.69%Maine 1,062,141 9,131 0.86%Maryland 4,513,635 48,215 1.07%Massachusetts 5,240,927 21,230 0.41%Michigan 7,612,370 37,465 0.49%Minnesota 4,098,333 22,528 0.55%Mississippi 2,226,363 15,598 0.70%Missouri 4,598,394 33,052 0.72%Montana 781,686 8,469 1.08%Nebraska 1,387,492 11,348 0.82%Nevada 2,085,544 16,918 0.81%New Hampshire 1,044,195 7,982 0.76%New Jersey 6,830,487 24,893 0.36%New Mexico 1,561,375 14,945 0.96%New York 15,284,210 50,107 0.33%North Carolina 7,383,857 65,213 0.88%North Dakota 540,213 5,030 0.93%Ohio 8,876,493 53,652 0.60%Oklahoma 2,859,530 23,378 0.82%Oregon 3,036,050 23,757 0.78%Pennsylvania 10,019,703 51,396 0.51%Rhode Island 830,726 3,850 0.46%South Carolina 3,609,405 36,464 1.01%South Dakota 626,965 5,425 0.87%Tennessee 4,944,681 32,619 0.66%Texas 18,982,973 136,874 0.72%Utah 1,964,059 9,092 0.46%Vermont 501,611 3,089 0.62%Virginia 6,221,883 89,325 1.44%Washington 5,266,221 51,439 0.98%West Virginia 1,470,678 7,811 0.53%Wisconsin 4,407,746 26,315 0.60%Wyoming 437,264 4,000 0.91%

Page 4
Issue briefPARENTAL STATUSIn 2011, the percentage of working-age women with children under 18 years old increased with age until 44 years, when the percentage began to decrease. Through the age of 34, more women veterans than women non-veterans had children who were under 18 years of age.11
17-24Years
25-34Years
35-44Years
45-54Years
55-64Years
WomenVeterans
WomenNonveterans
29.0
13.5
57.7
64.6
26.231.1
3.8 3.4
66.5
51.7
Percentage of Working-Age Women with Children Under18 Years Old by Age and Veteran Status in Percent
MILITARY SERVICEIn 2011, nearly 9 percent of women veterans had served as officers during their military service as compared to 6 percent of men veterans. Ninety-one percent of women veterans were enlisted.9
The largest cohort of men veterans served during the Vietnam era, while the largest cohort of women veterans served in the Gulf War 2 era (after 9/11) or during peacetime only. Just over 72 percent of women veterans served prior to 9/11.10
WomenVeterans
MaleVeterans
9%
91% 94%
6%
O�cersEnlisted
O�cersEnlisted
Rank
Women Veterans Male Veterans
Period of Military Service of Veterans in Percent
Peacetime OnlyGulf War 1Korean WarWorld War 2
11.2
24.9
Vietnam Era
34.9
12.7
27.6
5
23.710.7
Gulf War 2
27.7
10.47.9 3.3 POVERTY LEVELSIn 2011, 10 percent of women veterans and 6.6 percent of men veterans lived below the poverty threshold. These rates were lower than for their non-veteran counterparts (15.6 percent for women non-veterans and 13.3 percent for men non-veterans).12
6.6% 10% 13.3% 15.6%
WomenVeterans
MaleVeterans
WomenNonveterans
MaleNonveterans
Page 5
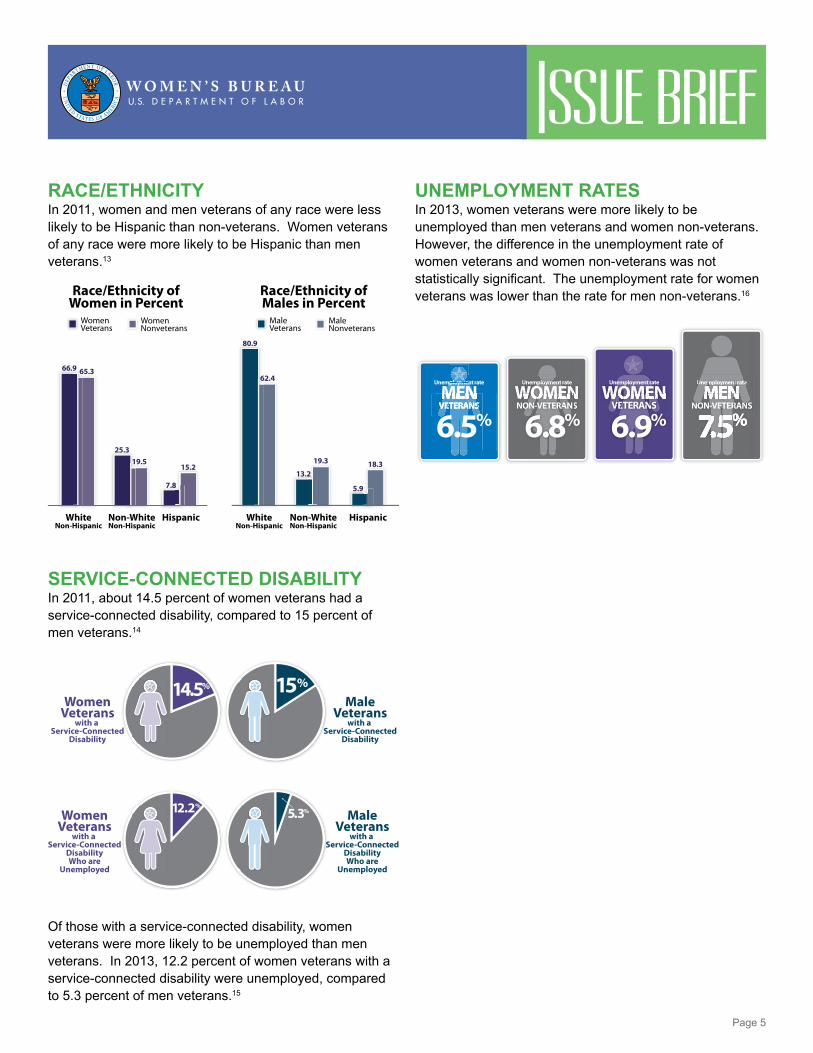
Issue briefRACE/ETHNICITYIn 2011, women and men veterans of any race were less likely to be Hispanic than non-veterans. Women veterans of any race were more likely to be Hispanic than men veterans.13
SERVICE-CONNECTED DISABILITYIn 2011, about 14.5 percent of women veterans had a service-connected disability, compared to 15 percent of men veterans.14
Of those with a service-connected disability, women veterans were more likely to be unemployed than men veterans. In 2013, 12.2 percent of women veterans with a service-connected disability were unemployed, compared to 5.3 percent of men veterans.15
WhiteNon-Hispanic
Non-WhiteNon-Hispanic
Hispanic
WomenVeterans
Race/Ethnicity ofWomen in Percent
Race/Ethnicity ofMales in Percent
WomenNonveterans
66.9 65.3
25.3
7.8
15.219.5
WhiteNon-Hispanic
Non-WhiteNon-Hispanic
Hispanic
MaleVeterans
MaleNonveterans
80.9
62.4
13.2
5.9
18.319.3
15%14.5%
WomenVeterans
with a Service-Connected
Disability
MaleVeterans
with a Service-Connected
Disability
12.2%
WomenVeterans
with a Service-Connected
DisabilityWho are
Unemployed
MaleVeterans
with a Service-Connected
DisabilityWho are
Unemployed
5.3%
UNEMPLOYMENT RATESIn 2013, women veterans were more likely to be unemployed than men veterans and women non-veterans. However, the difference in the unemployment rate of women veterans and women non-veterans was not statistically significant. The unemployment rate for women veterans was lower than the rate for men non-veterans.16
Unemployment rate
WOMENVETERANSVETERANSVETERANS
6.9%
Unemployment rate
WOMENNON-VETERANSNON-VETERANSON-VETERANSON-VETERAN
6.8%
Unemployment rate
MENNON-VETERANS
7.5%
UU emempl me tt tee
N N E A SNNOON-- ETERRANNS
Unemployment rate
NON-VETERAN
Unemployment rate
MENVETERANSVETERANSVETERANSVETERANSVETERANS
6.5%
plployoymemennoyoymm

Page 6
Issue briefSUMMARYComparisons between Women Veterans and Women Non-veteransCompared to women non-veterans, women veterans:
• Were more likely to be older.• Were more likely to have completed some college or obtained an Associate degree, a Bachelor’s degree, Master’s
degree or higher.• Were more likely to be in management, professional and related occupations and less likely to be in service
occupations.• Were more likely to work in government.• Had a higher median income.• Until the age of 34, were more likely to have children under 18 years of age.• Were less likely to live below the poverty threshold.• Were less likely to be of Hispanic ethnicity, regardless of race.
Comparisons between Women Veterans and Men VeteransCompared to men veterans, women veterans:
• Were more likely to be younger.• Were more likely to be in management, professional and related occupations and in sales and office occupations.• Were more likely to work in government.• Had a lower median income and were more likely to have no earnings or income.• Were more likely to have served as officers.• Were more likely to have served in the Gulf War 2 era or during peacetime only.• Were more likely to live below the poverty threshold.• Were more likely to be Hispanic, regardless of race.• Were more likely to have a service-connected disability rating.
DEFINITIONS• Earnings: Salary, wages, and self-employment income. [U.S. Census Bureau, American Community Survey, 2011
(U.S. Census Bureau. (2012). 2011 American Community Survey PUMS (as cited in U.S. Department of Veterans Affairs, NCVAS, Profile of Veterans: 2011 [PDF]). Retrieved from http://www.va.gov/vetdata/docs/SpecialReports/Profile_of_Veterans_2011.pdf]
• Income: The total of earnings and other sources of income such as pension, Supplemental Security Income, public assistance, etc. Median Income is calculated for the total population with personal income greater than zero. [U.S. Census Bureau. (2012). 2011 American Community Survey PUMS (as cited in U.S. Department of Veterans Affairs, NCVAS, Profile of Veterans: 2011 [PDF]). Retrieved from http://www.va.gov/vetdata/docs/SpecialReports/Profile_of_Veterans_2011.pdf]
• Non-veterans: Men and women who have never served on active duty in the U.S. Armed Forces. [U.S. Bureau of Labor Statistics. (2013). Current Population Survey Data on Women Veterans [PDF]. Retrieved from http://www.dol.gov/vets/womenveterans/outlook.pdf]
• Poverty threshold: Dollar amounts the Census Bureau uses to determine a family’s or person’s poverty status. [U.S. Census Bureau. (no date). Poverty: Definitions. Retrieved from http://www.census.gov/hhes/www/poverty/methods/definitions.html]

Page 7
Issue brief• Veterans: Men and women who previously served on active duty in the U.S. Armed Forces and were civilians at the
time they were surveyed. [U.S. Department of Labor. (2013). Current Population Survey Data on Women Veterans. Retrieved from http://www.dol.gov/vets/womenveterans/outlook.pdf]
• Unemployed persons: Persons aged 16 years and older who had no employment during the reference week, were available for work, except for temporary illness, and had made specific efforts to find employment sometime during the 4-week period ending with the reference week. Persons who were waiting to be recalled to a job from which they had been laid off need not have been looking for work to be classified as unemployed. [U.S. Department of Labor. (2013). Bureau of Labor Statistics Glossary. Retrieved from http://www.bls.gov/bls/glossary.htm]
• Unemployment rate: The unemployment rate represents the number unemployed as a percent of the labor force. [U.S. Department of Labor. (2013). Bureau of Labor Statistics Glossary. Retrieved from http://www.bls.gov/bls/glossary.htm]
ENDNOTES1 U.S. Department of Veterans Affairs. (2010). Veteran Population Projection Model 2011 – National Center for Veterans
Analysis and Statistics [Excel]. Retrieved from most recent version of data source: http://www.va.gov/VETDATA/docs/Demographics/New_Vetpop_Model/3lVetPop11_Race_National.xlsx
2 U.S. Census Bureau. (2012). 2011 American Community Survey PUMS (as cited in U.S. Department of Veterans Affairs, NCVAS, Profile of Veterans: 2011 [PDF]). Retrieved from http://www.va.gov/vetdata/docs/SpecialReports/Profile_of_Veterans_2011.pdf
3 U.S. Bureau of Labor Statistics. (2013). Current Population Survey, Unpublished Table 9. 2013 annual averages.4 U.S. Bureau of Labor Statistics. (2014). Bureau of Labor Statistics Economic News Release, Table 4. Employed persons
18 years and over by occupation, sex, veteran status, and period of service, 2013 annual averages. Retrieved from http://www.bls.gov/news.release/vet.t04.htm
5 U.S. Bureau of Labor Statistics. (2014). Bureau of Labor Statistics Economic News Release, Table 5. Employed persons 18 years and over by industry, class of worker, sex, veteran status, and period of service, 2013 annual averages. Retrieved from http://www.bls.gov/news.release/vet.t05.htm
6 U.S. Census Bureau. (2013). 2012 American Community Survey 1-Year Estimates [Data file S2101]. Retrieved from http://factfinder2.census.gov/faces/nav/jsf/pages/searchresults.xhtml?refresh=t#
7 U.S. Census Bureau. (2011). 2011 American Community Survey PUMS (as cited in U.S. Department of Veterans Affairs, NCVAS, Profile of Veterans: 2011 [PDF]). Retrieved from http://www.va.gov/vetdata/docs/SpecialReports/Profile_of_Veterans_2011.pdf
8 U.S. Census Bureau. (2013). 2012 American Community Survey 1-Year Estimates [Data file B21001]. Retrieved from http://factfinder2.census.gov/faces/nav/jsf/pages/searchresults.xhtml?refresh=t
9 U.S. Department of Veterans Affairs. (2010). Veteran Population Projection Model 2011 – National Center for Veterans Analysis and Statistics [Excel]. Retrieved from http://www.va.gov/VETDATA/docs/Demographics/New_Vetpop_Model/5lVetPop11_Rank.xlsx
10 U.S. Census Bureau. (2012). 2011 American Community Survey PUMS (as cited in U.S. Department of Veterans Affairs, NCVAS, Profile of Veterans: 2011 [PDF]). Retrieved from http://www.va.gov/vetdata/docs/SpecialReports/Profile_of_Veterans_2011.pdf
11 U.S. Census Bureau. (2012). 2011 American Community Survey PUMS (as cited in U.S. Department of Veterans Affairs, NCVAS, Profile of Veterans: 2011 [PDF]). Retrieved from http://www.va.gov/vetdata/docs/SpecialReports/Profile_of_Veterans_2011.pdf
Page 8
Issue brief12 U.S. Census Bureau. (2012). 2011 American Community Survey PUMS (as cited in U.S. Department of Veterans Affairs,
NCVAS, Profile of Veterans: 2011 [PDF]). Retrieved from http://www.va.gov/vetdata/docs/SpecialReports/Profile_of_Veterans_2011.pdf
13 U.S. Census Bureau. (2012). 2011 American Community Survey PUMS (as cited in U.S. Department of Veterans Affairs, NCVAS, Profile of Veterans: 2011 [PDF]). Retrieved from http://www.va.gov/vetdata/docs/SpecialReports/Profile_of_Veterans_2011.pdf
14 U.S. Census Bureau. (2012). 2011 American Community Survey PUMS (as cited in U.S. Department of Veterans Affairs, NCVAS, Profile of Veterans: 2011 [PDF]). Retrieved from http://www.va.gov/vetdata/docs/SpecialReports/Profile_of_Veterans_2011.pdf
15 U.S. Bureau of Labor Statistics. (2013). Bureau of Labor Statistics Economic News Release, Table 7. Employed persons 18 years and over by veteran status, presence of service-connected disability, period of service, and class of worker, August 2013, not seasonally adjusted. Retrieved from http://www.bls.gov/news.release/vet.t07.htm
16 U.S. Bureau of Labor Statistics. (2014). Bureau of Labor Statistics Economic News Release, Table 1. Employment status of persons 18 years and over by veteran status, period of service, sex, race, and Hispanic or Latino ethnicity, 2013 annual averages. Retrieved from http://www.bls.gov/news.release/vet.t01.htm
CONTACT USWebsite: www.dol.gov/wb/E-mail: [email protected]
Mail:
WOMEN’S BUREAUU.S. Department of Labor
200 Constitution Avenue, NW
Washington, DC 20210
Phone: 1-800-827-5335 or (202) 693-6710
Women’s BureauVeterans’ Employment and Training ServiceOctober 2014