When & How do Patients Change? Wolfgang Lutz Outcome Presentation
Upload
migrationpolicycentreCategory
view
706download
2
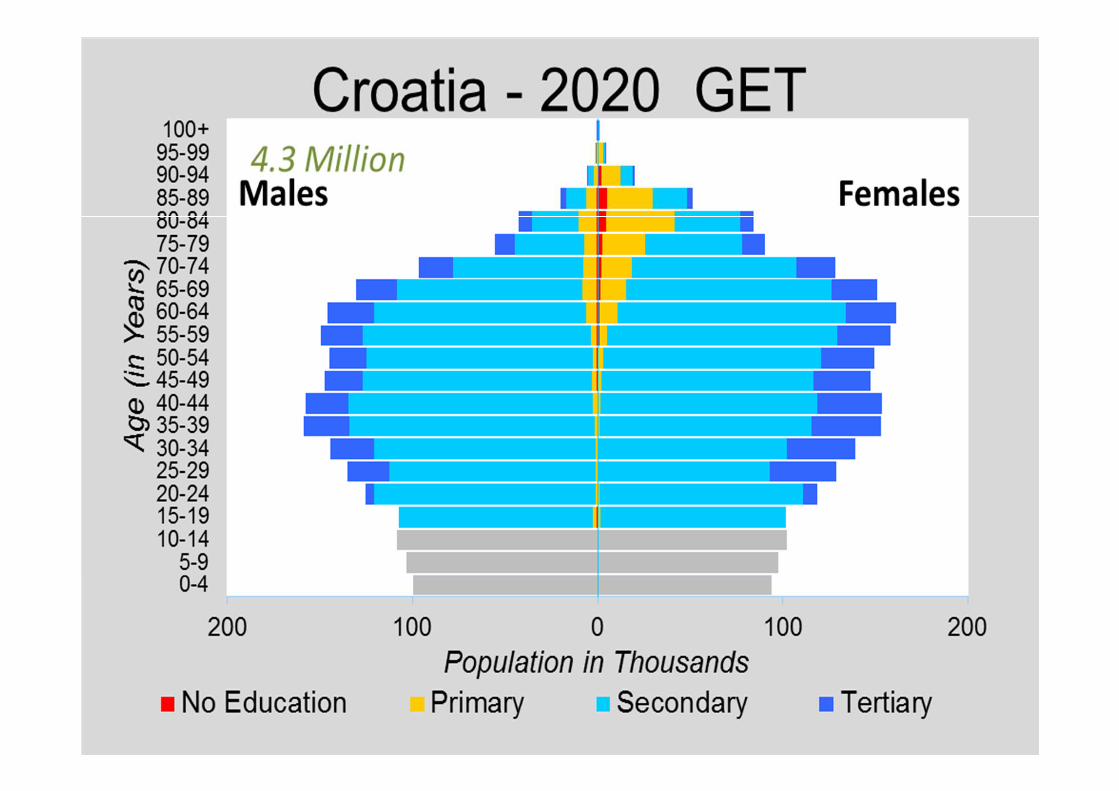
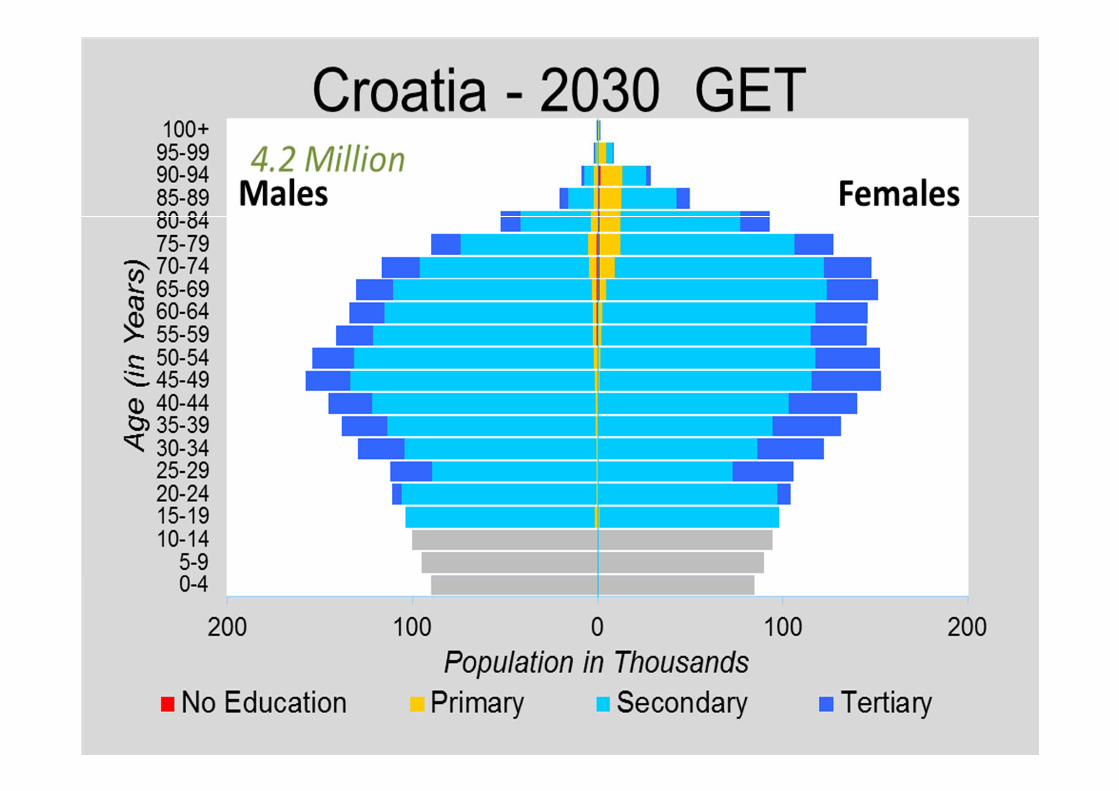
Europe’s Demographic Future: 4-Dimensional Scenarios for
assessing the Impacts of Migration
Wolfgang LutzEUI Demography Forum, 4-5 Feb 2016
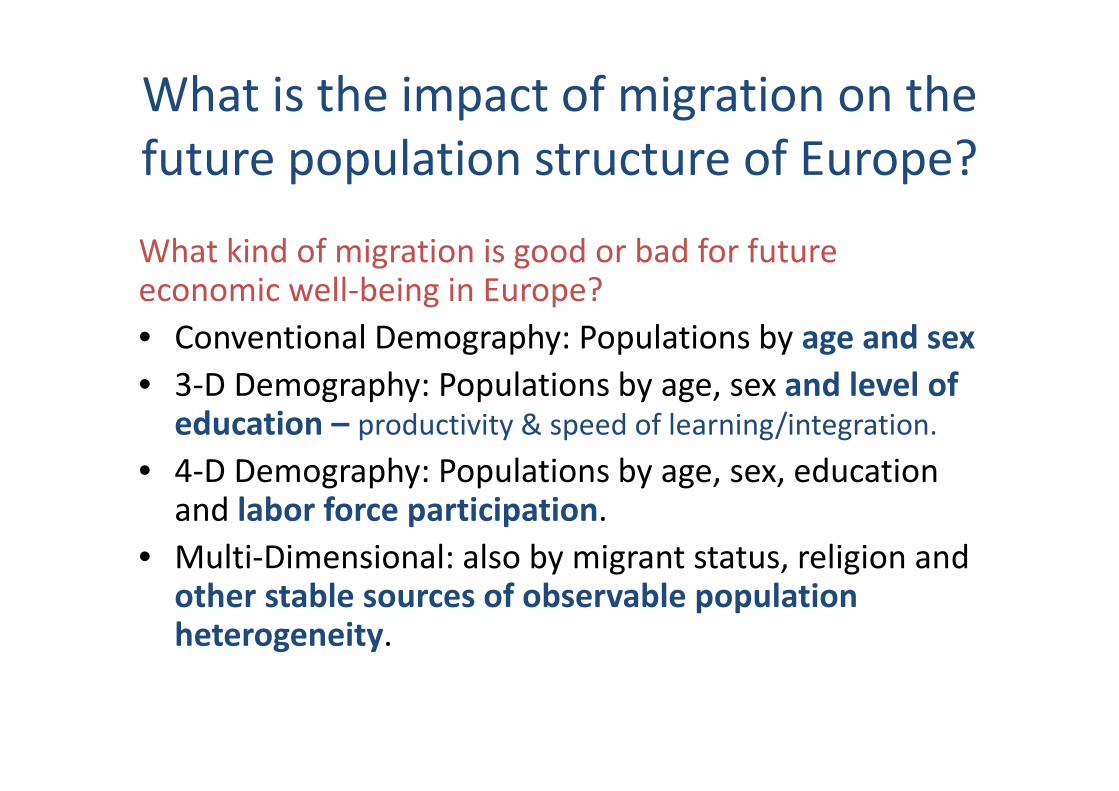
What is the impact of migration on the
future population structure of Europe?
What kind of migration is good or bad for future economic well-being in Europe?
• Conventional Demography: Populations by age and sex
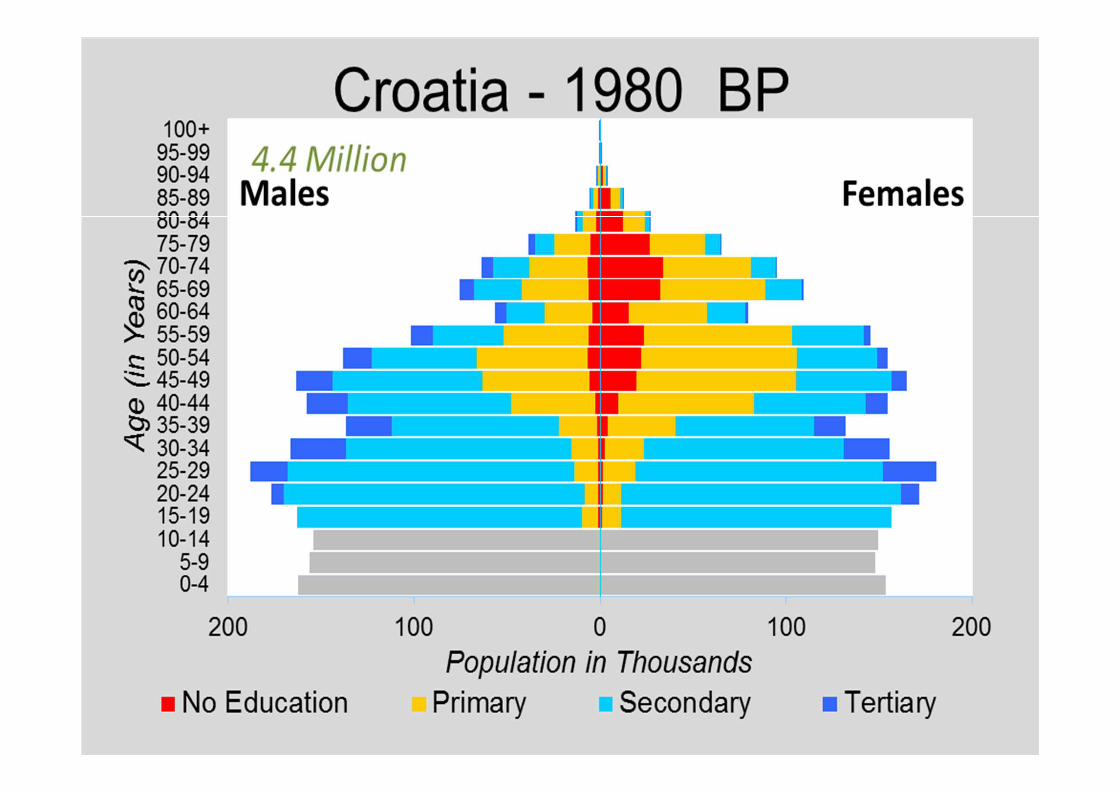
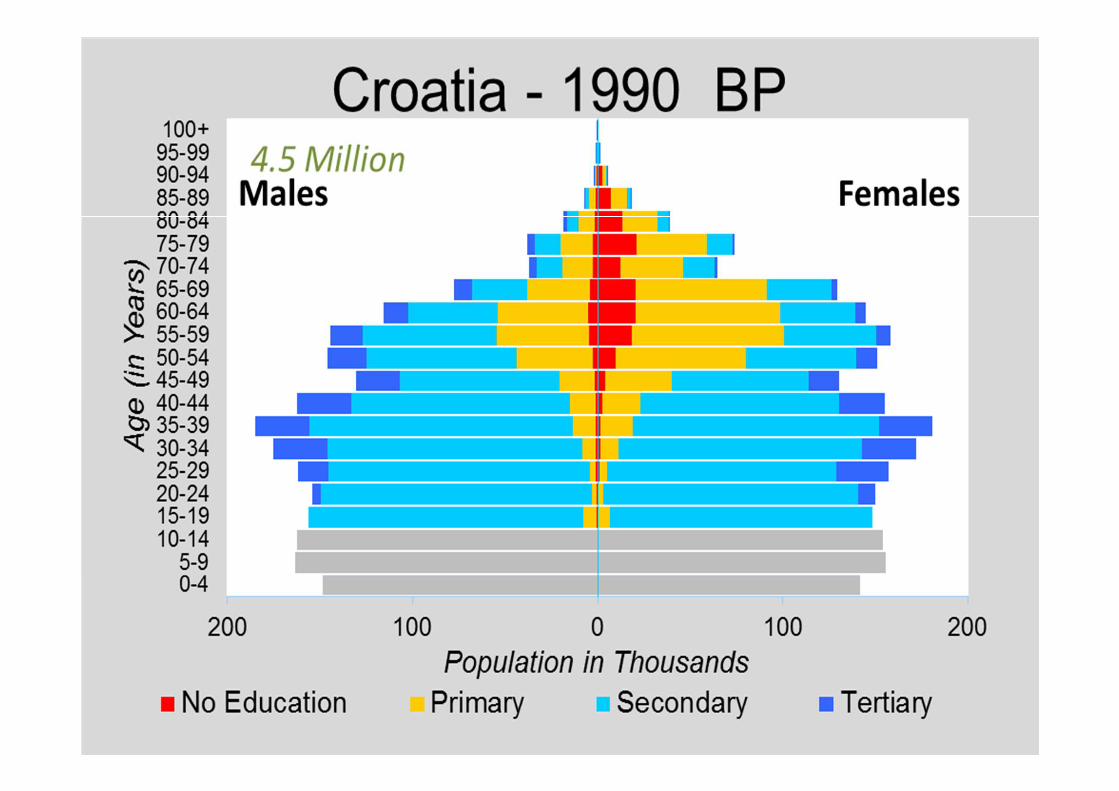
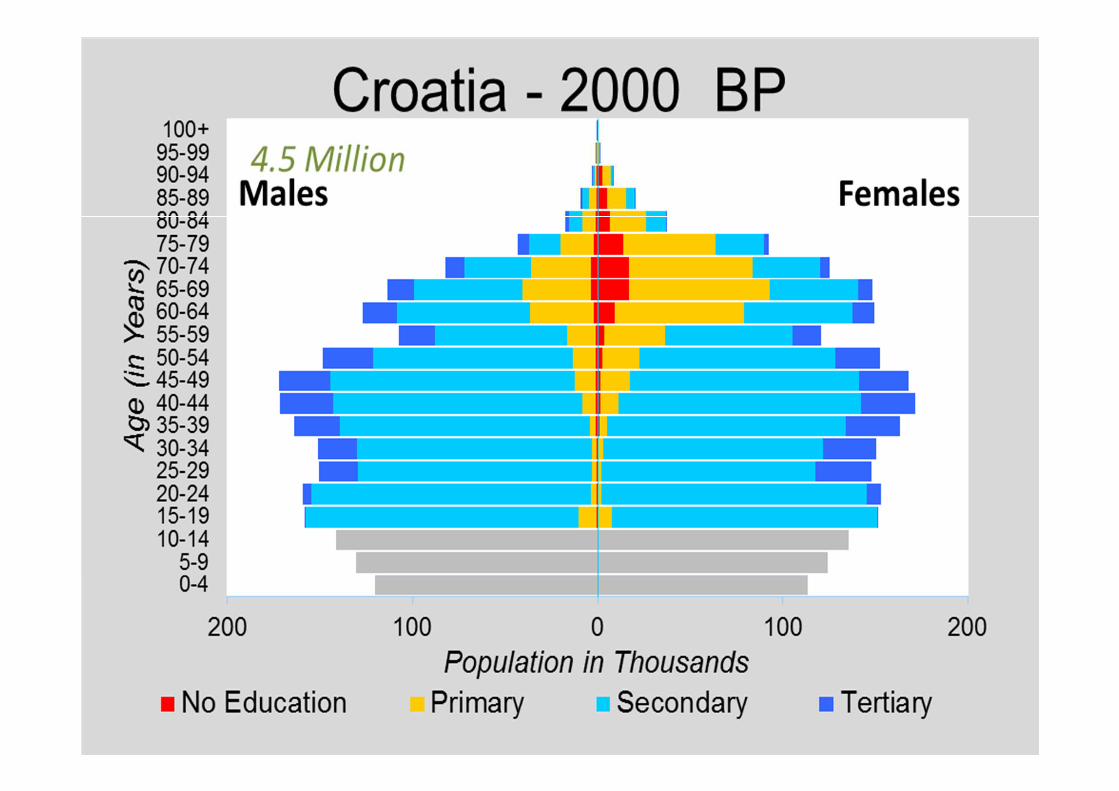
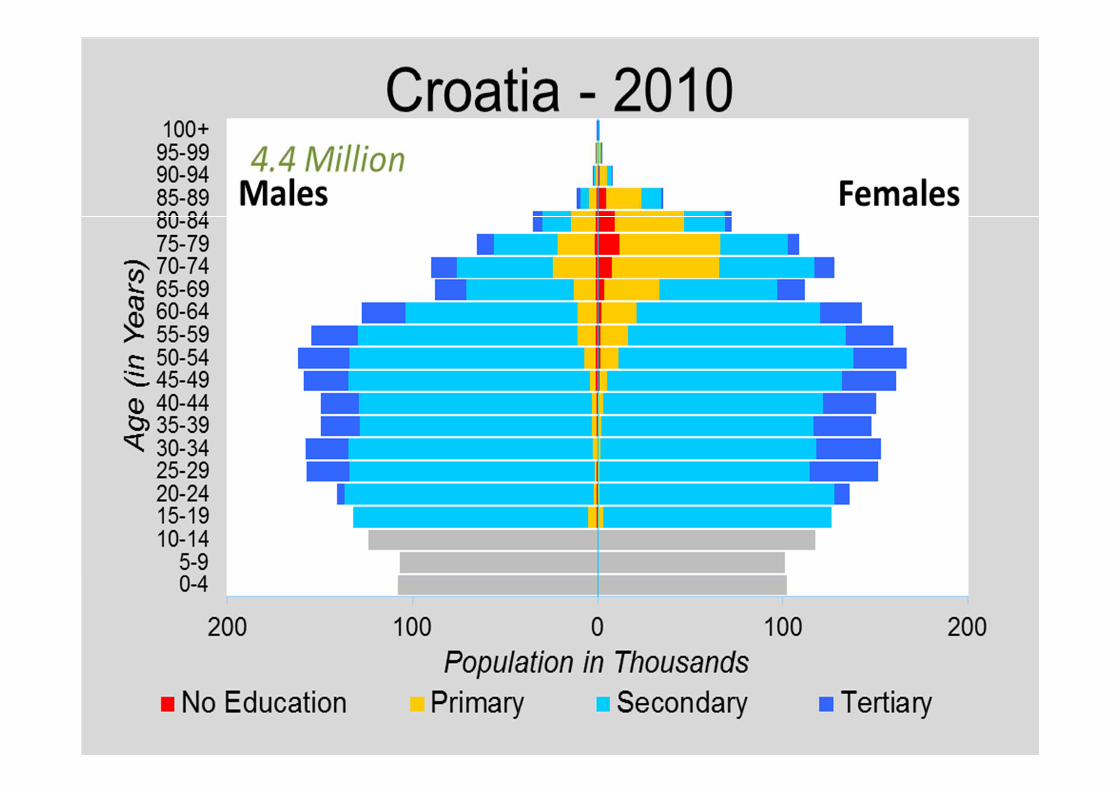
• 3-D Demography: Populations by age, sex and level of
education – productivity & speed of learning/integration.
• 4-D Demography: Populations by age, sex, education and labor force participation.
• Multi-Dimensional: also by migrant status, religion and other stable sources of observable population
heterogeneity.
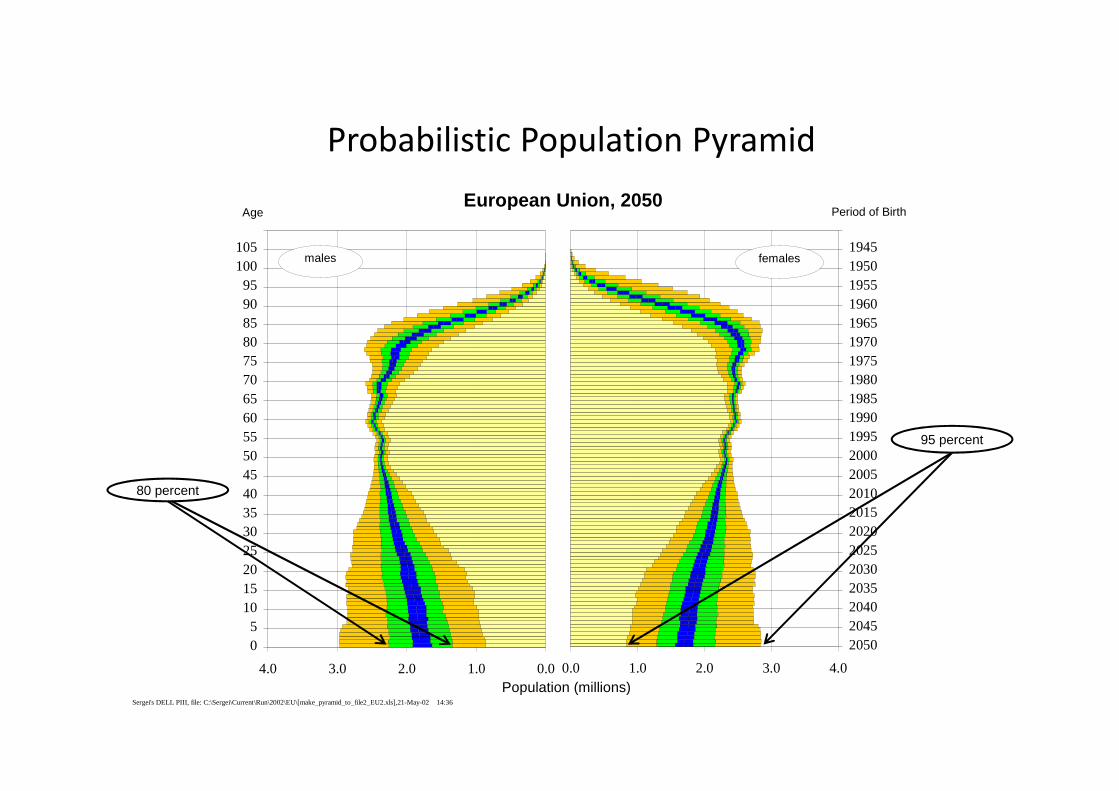
Probabilistic Population Pyramid
0.0 1.0 2.0 3.0 4.0
2050204520402035203020252020201520102005200019951990198519801975197019651960195519501945
females
0.01.02.03.04.0
05
101520253035404550556065707580859095
100105
European Union, 2050
Population (millions)
males
Age Period of Birth
Sergei's DELL PIII, file: C:\Sergei\Current\Run\2002\EU\[make_pyramid_to_file2_EU2.xls],21-May-02 14:36
95 percent
80 percent
4
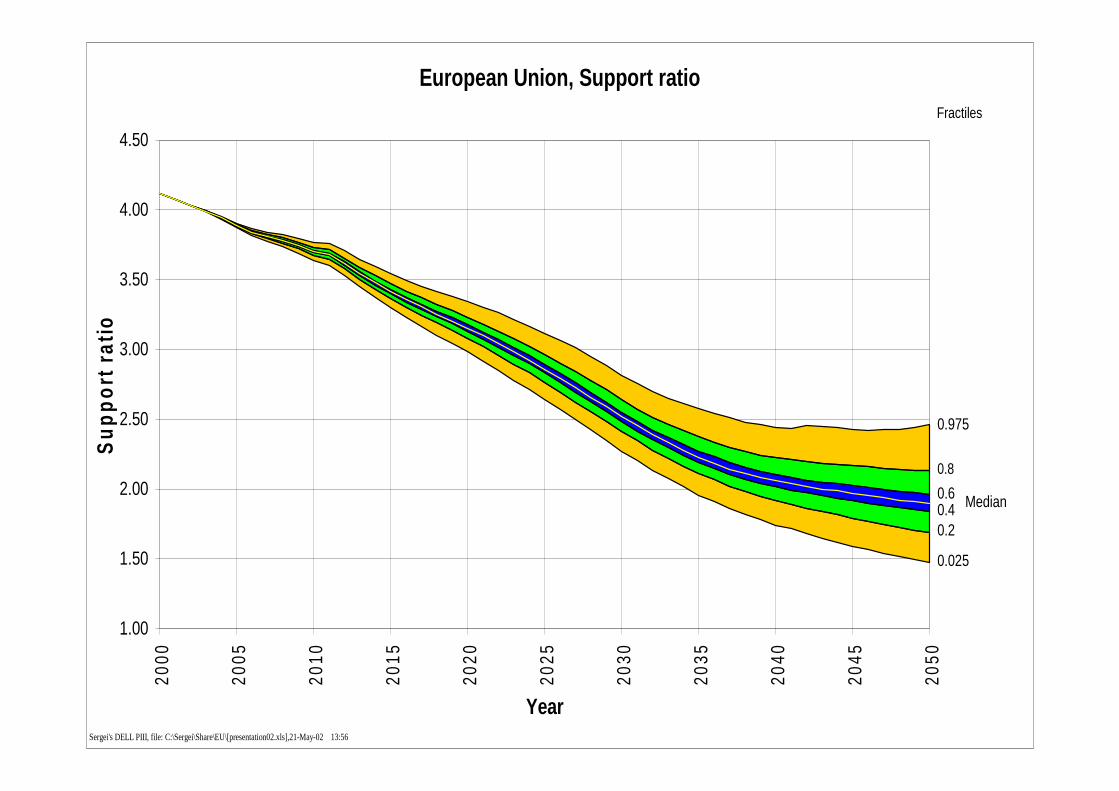
European Union, Support ratio
1.00
1.50
2.00
2.50
3.00
3.50
4.00
4.5020
00
2005
2010
2015
2020
2025
2030
2035
2040
2045
2050
Year
Su
pp
ort
rat
io
0.8
0.40.2
0.025
0.975
Median0.6
Fractiles
Sergei's DELL PIII, file: C:\Sergei\Share\EU\[presentation02.xls],21-May-02 13:56
Rethinking Population Ageing
Age is not what it used to be. Science tells us that the meaning of age is changing:
• “50 is the new 40” or “70 is the new 60”.
• People all over the world do not only live longer, they are also longer in good health.
• Cognitive decline with age is shifting to higher ages, in particular for better educated people that stay mentally and physically active.
• In countries without mandatory retirement ages (e.g. the USA) the better educated voluntarily tend to work longer and longer. We derive identity from meaningful work even at higher ages.
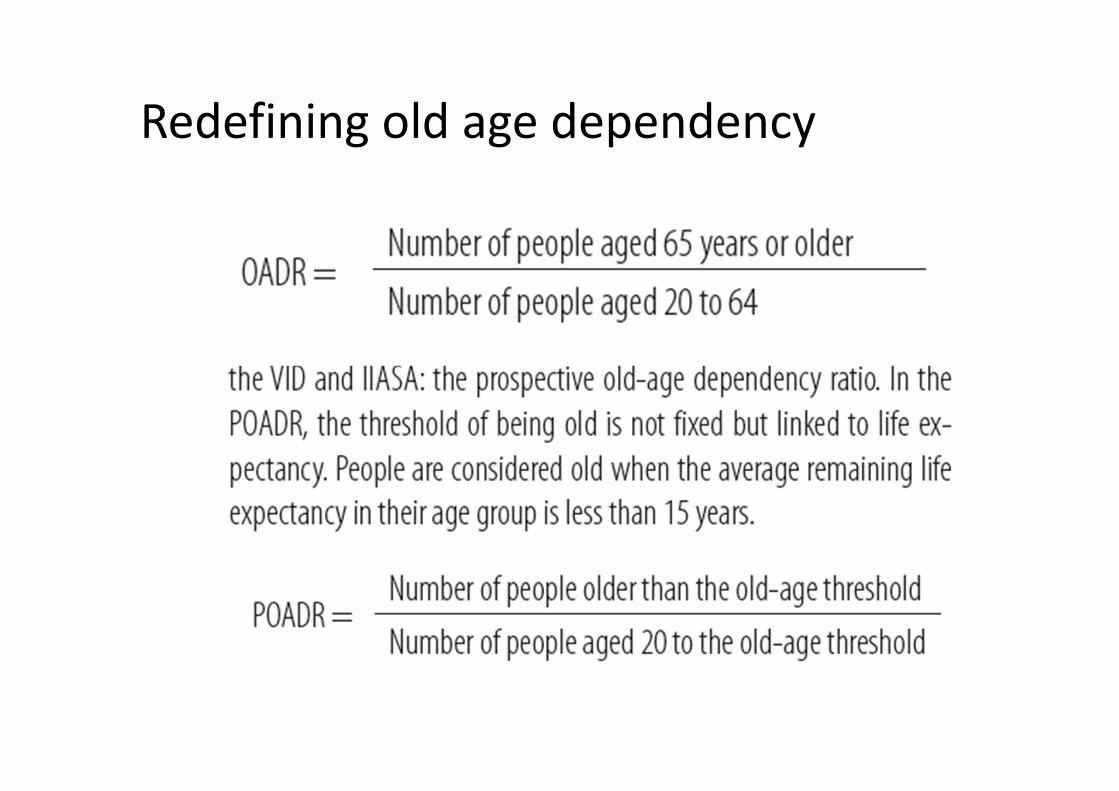
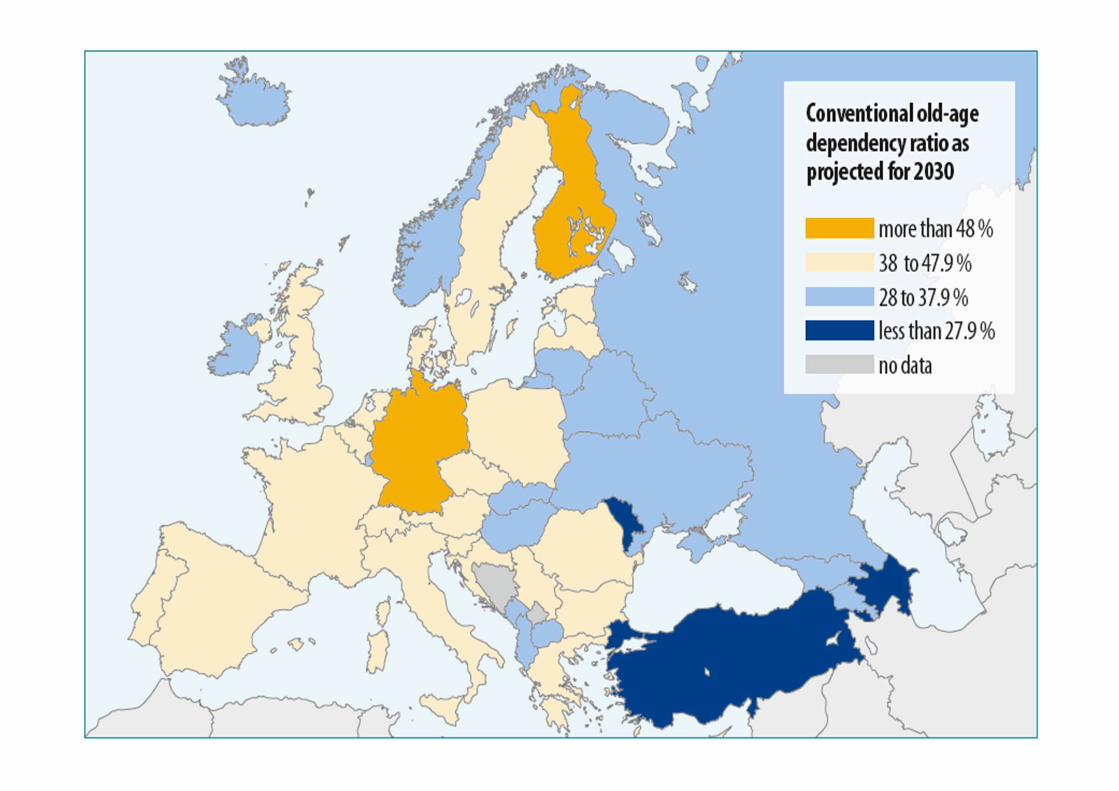
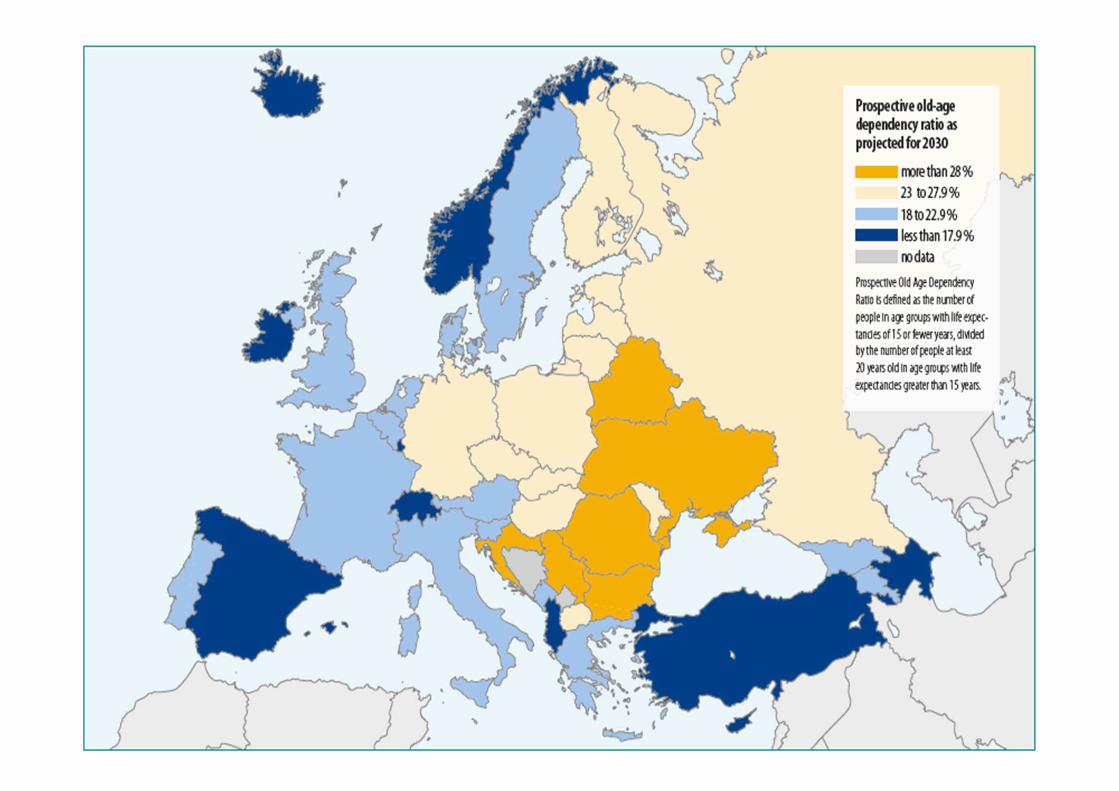
Redefining old age dependency
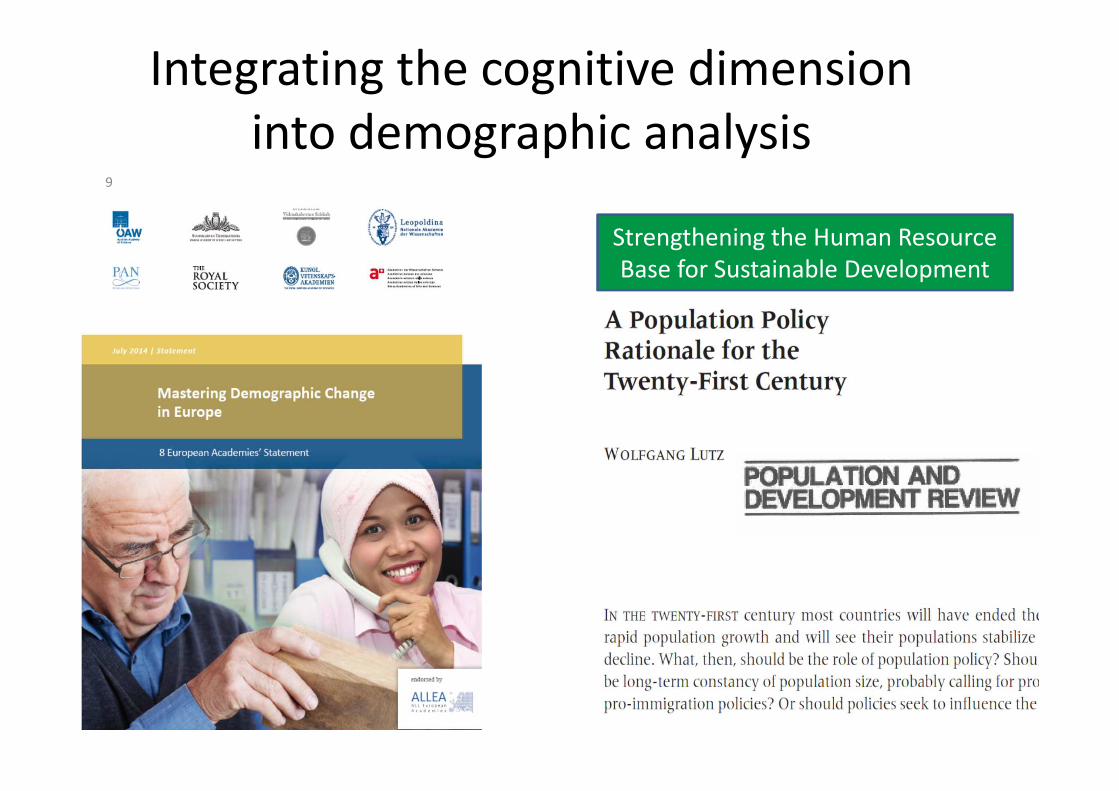
Integrating the cognitive dimension
into demographic analysis9
Strengthening the Human Resource
Base for Sustainable Development
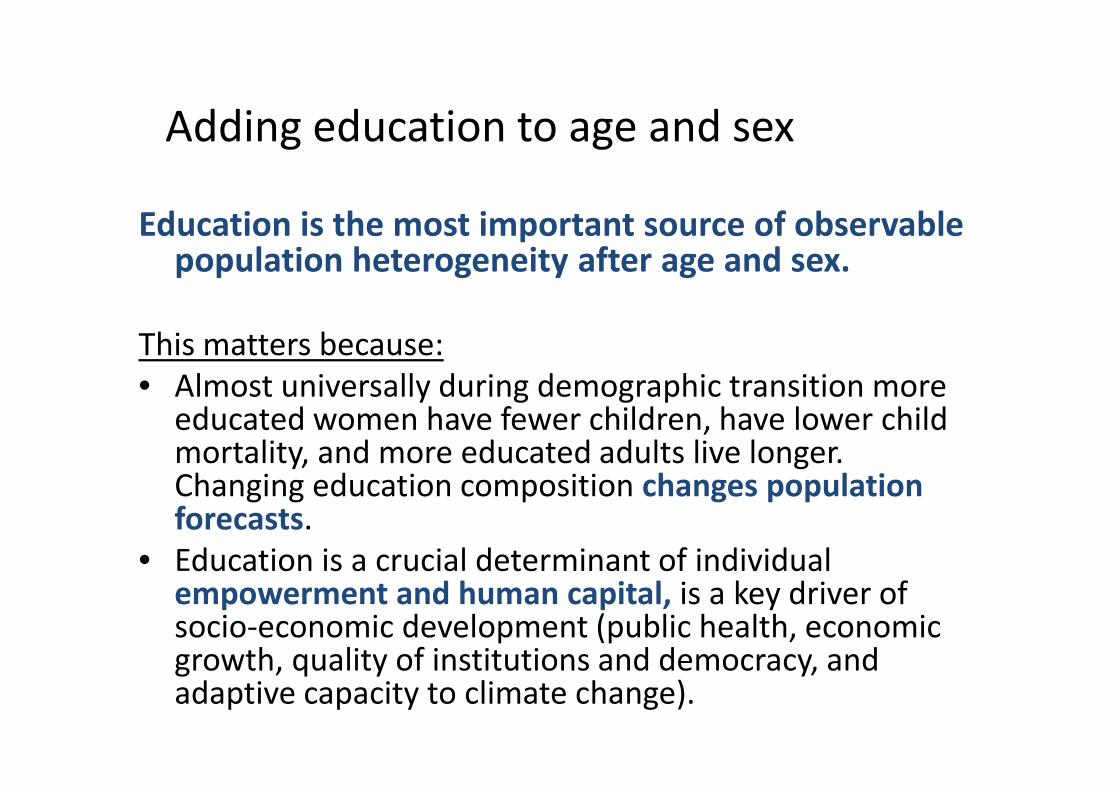
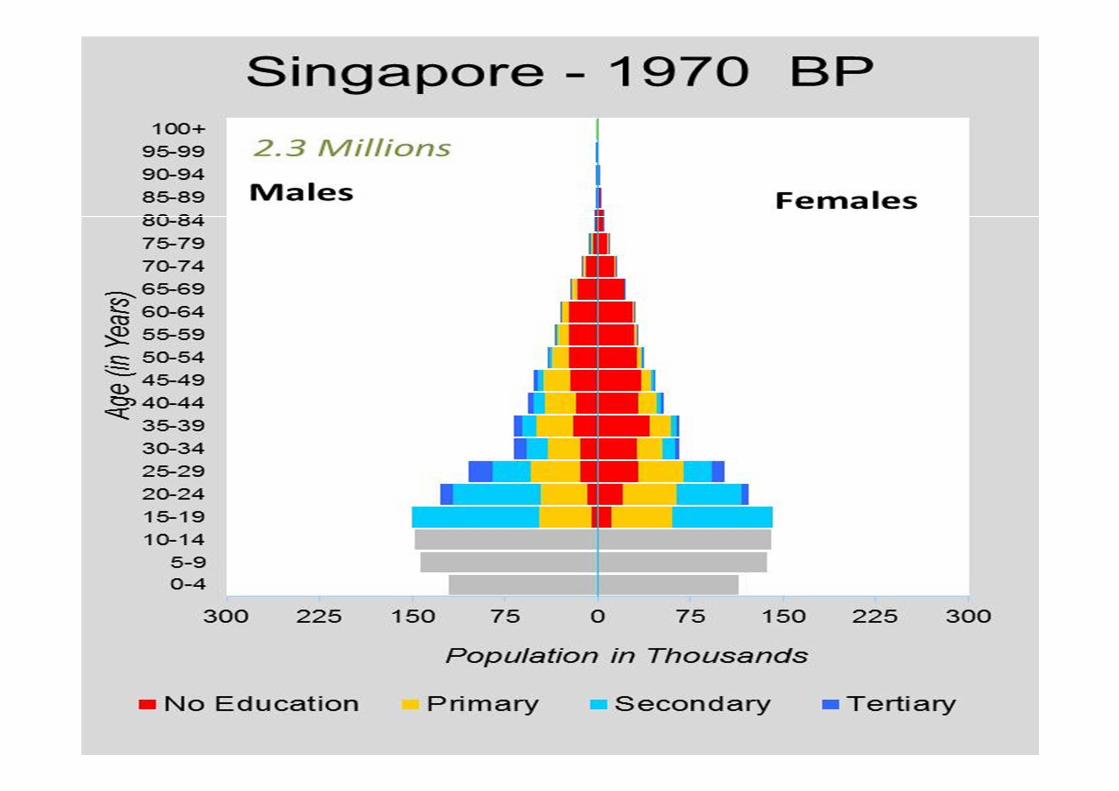
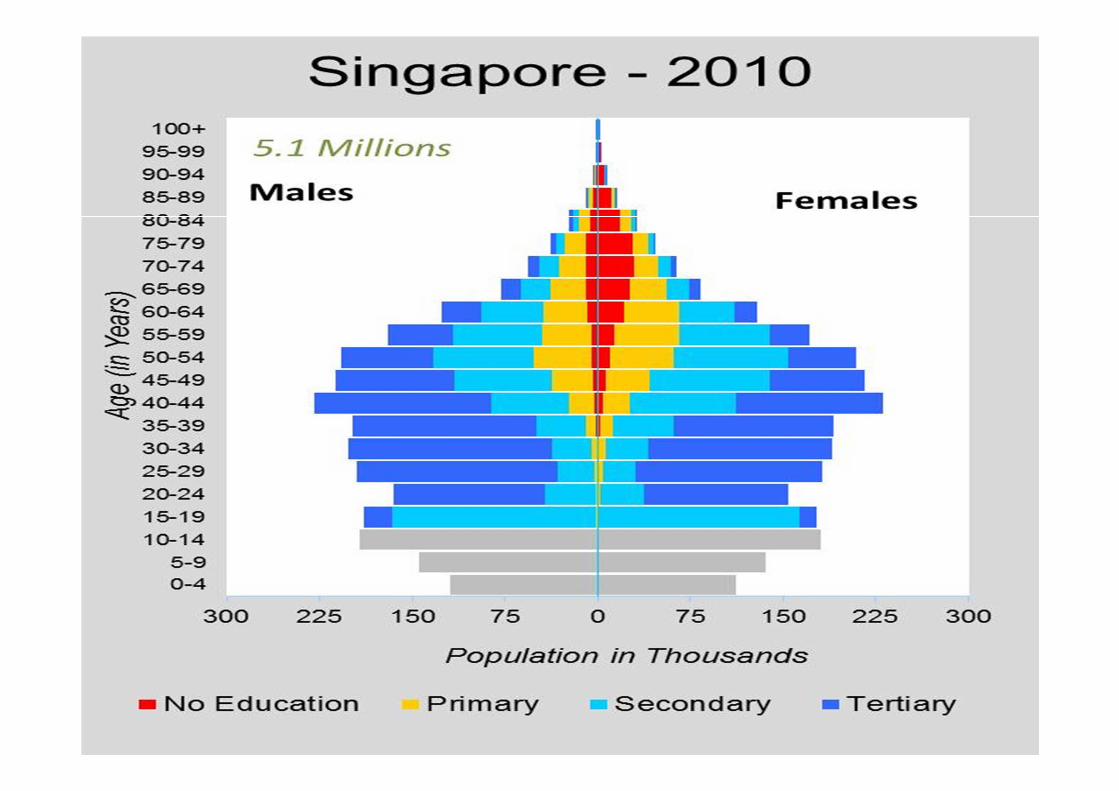
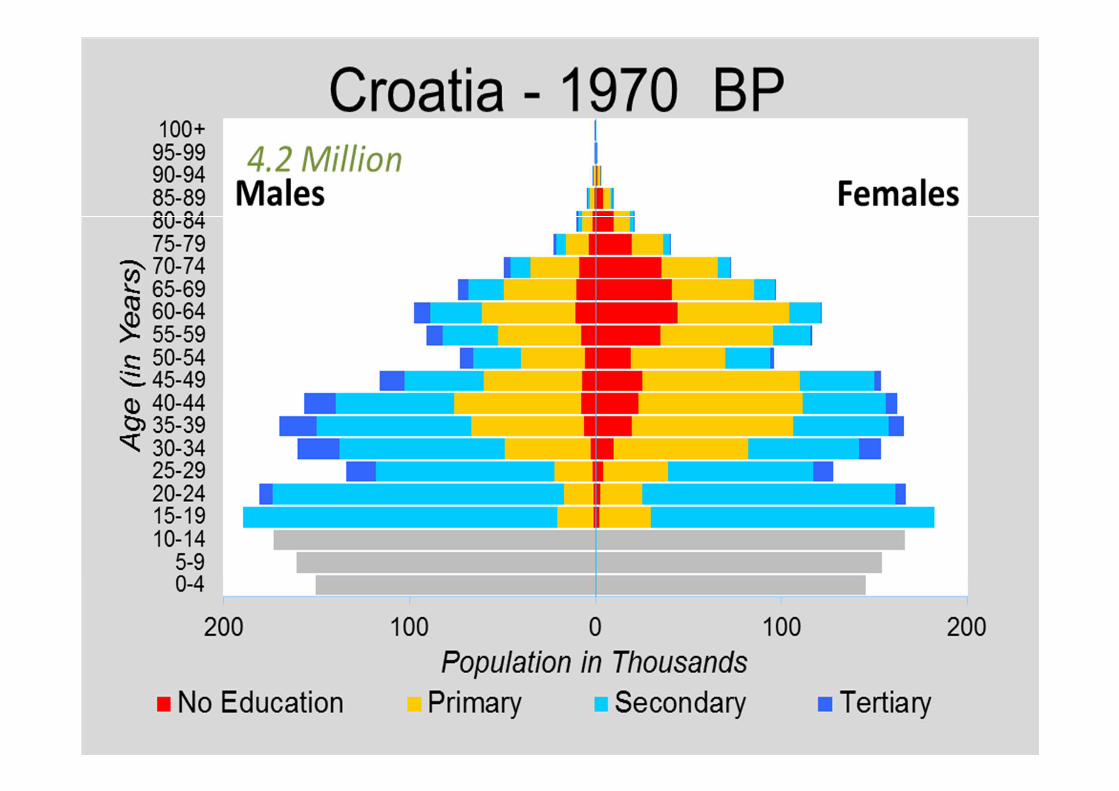
Adding education to age and sex
Education is the most important source of observable population heterogeneity after age and sex.
This matters because:
• Almost universally during demographic transition more educated women have fewer children, have lower child mortality, and more educated adults live longer. Changing education composition changes population forecasts.
• Education is a crucial determinant of individual empowerment and human capital, is a key driver of socio-economic development (public health, economic growth, quality of institutions and democracy, and adaptive capacity to climate change).
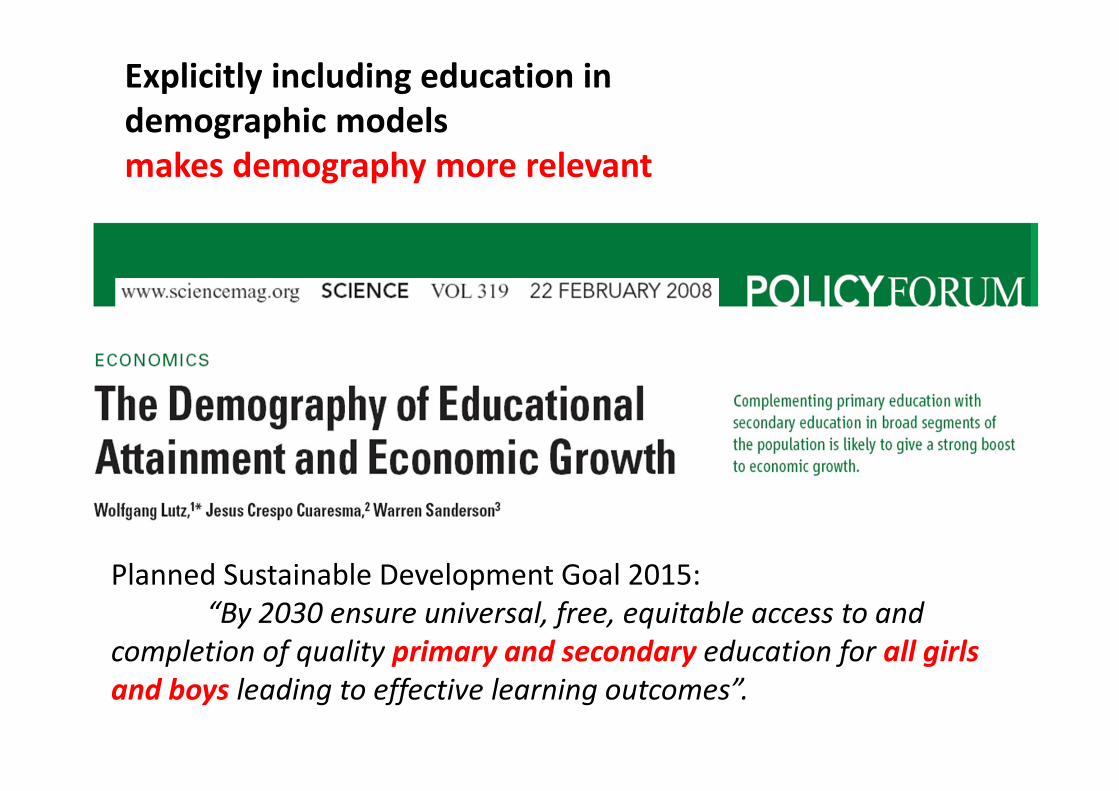
Planned Sustainable Development Goal 2015:
“By 2030 ensure universal, free, equitable access to and
completion of quality primary and secondary education for all girls
and boys leading to effective learning outcomes”.
Explicitly including education in
demographic models
makes demography more relevant
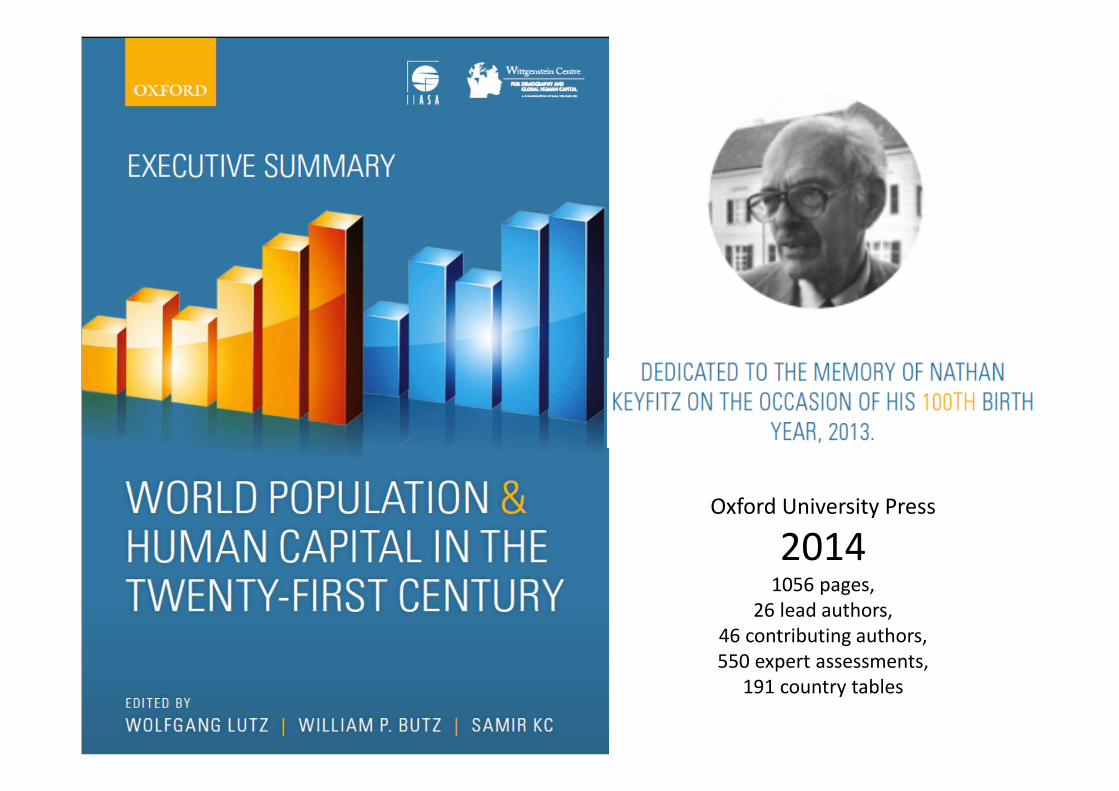
Oxford University Press
20141056 pages,
26 lead authors,
46 contributing authors,
550 expert assessments,
191 country tables
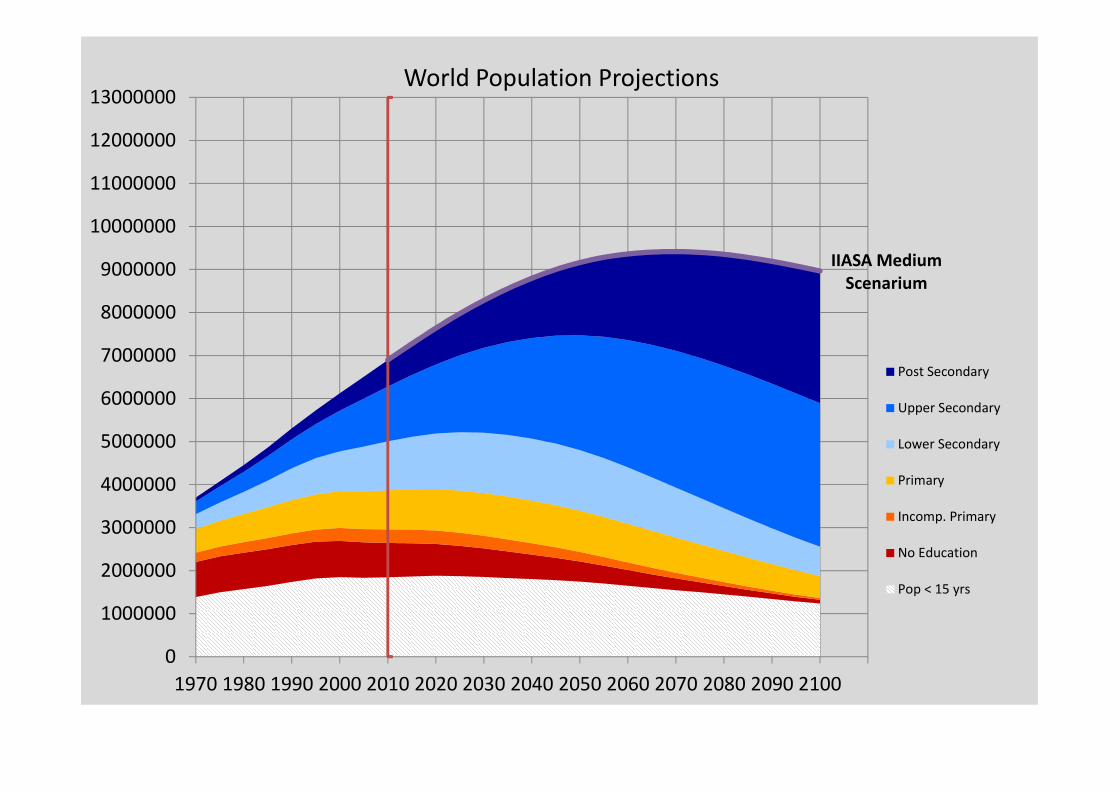
IIASA Medium
Scenarium
0
1000000
2000000
3000000
4000000
5000000
6000000
7000000
8000000
9000000
10000000
11000000
12000000
13000000
1970 1980 1990 2000 2010 2020 2030 2040 2050 2060 2070 2080 2090 2100
Post Secondary
Upper Secondary
Lower Secondary
Primary
Incomp. Primary
No Education
Pop < 15 yrs
World Population Projections
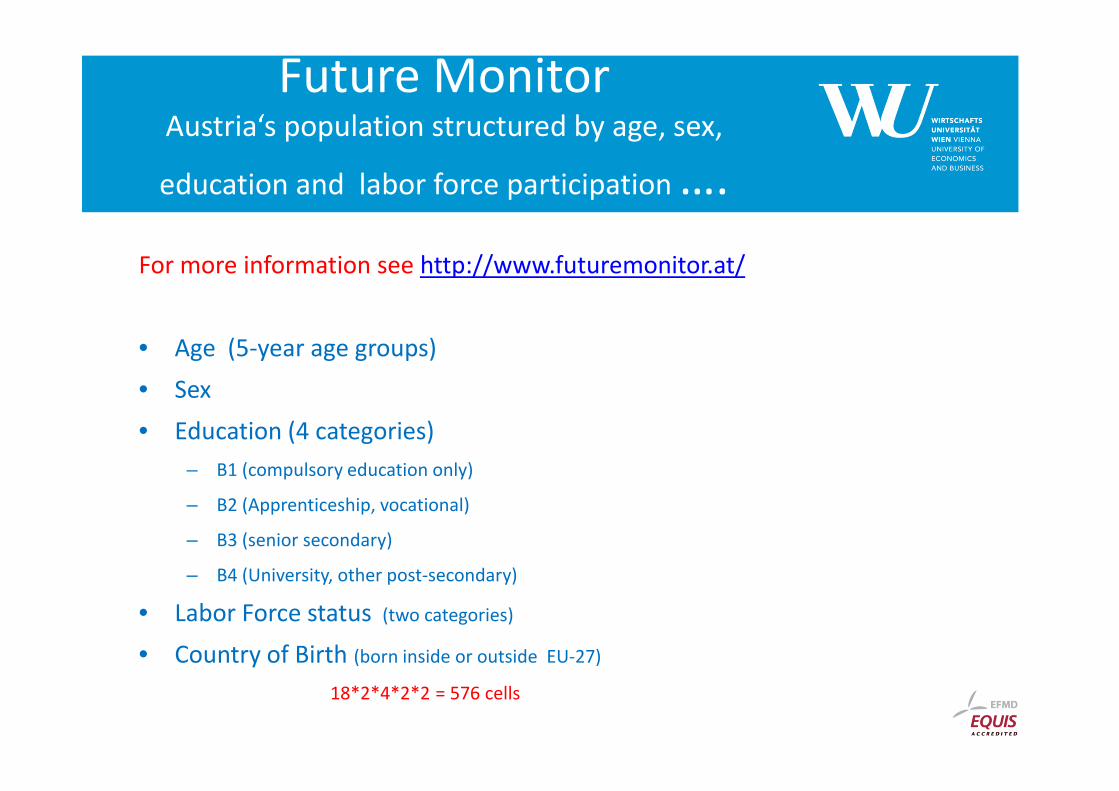
Future MonitorAustria‘s population structured by age, sex,
education and labor force participation ….
For more information see http://www.futuremonitor.at/
• Age (5-year age groups)
• Sex
• Education (4 categories)
– B1 (compulsory education only)
– B2 (Apprenticeship, vocational)
– B3 (senior secondary)
– B4 (University, other post-secondary)
• Labor Force status (two categories)
• Country of Birth (born inside or outside EU-27)
18*2*4*2*2 = 576 cells
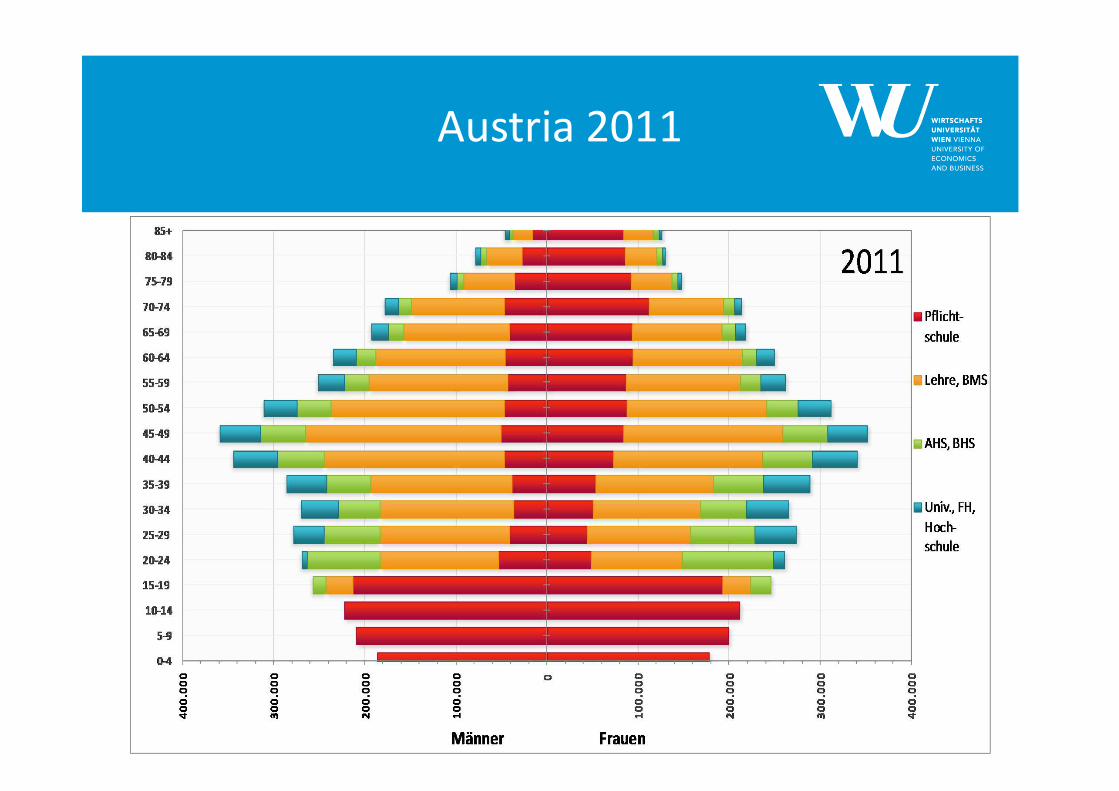
Austria 2011
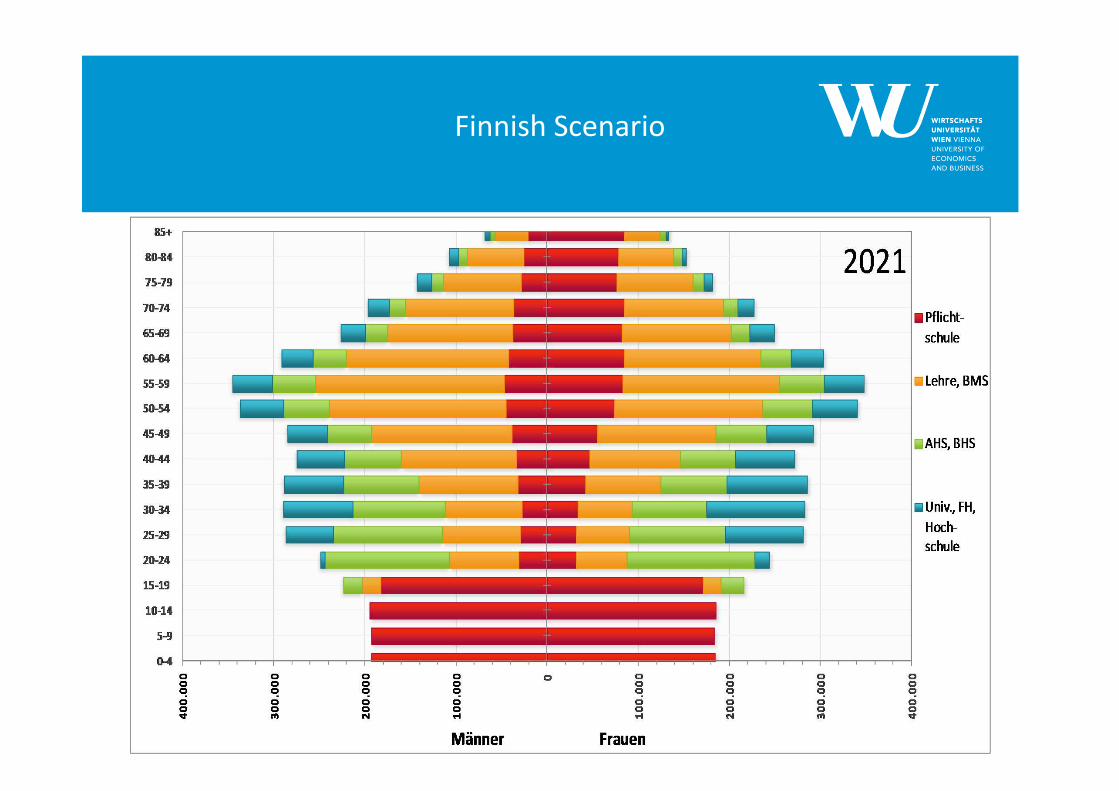
Finnish Scenario
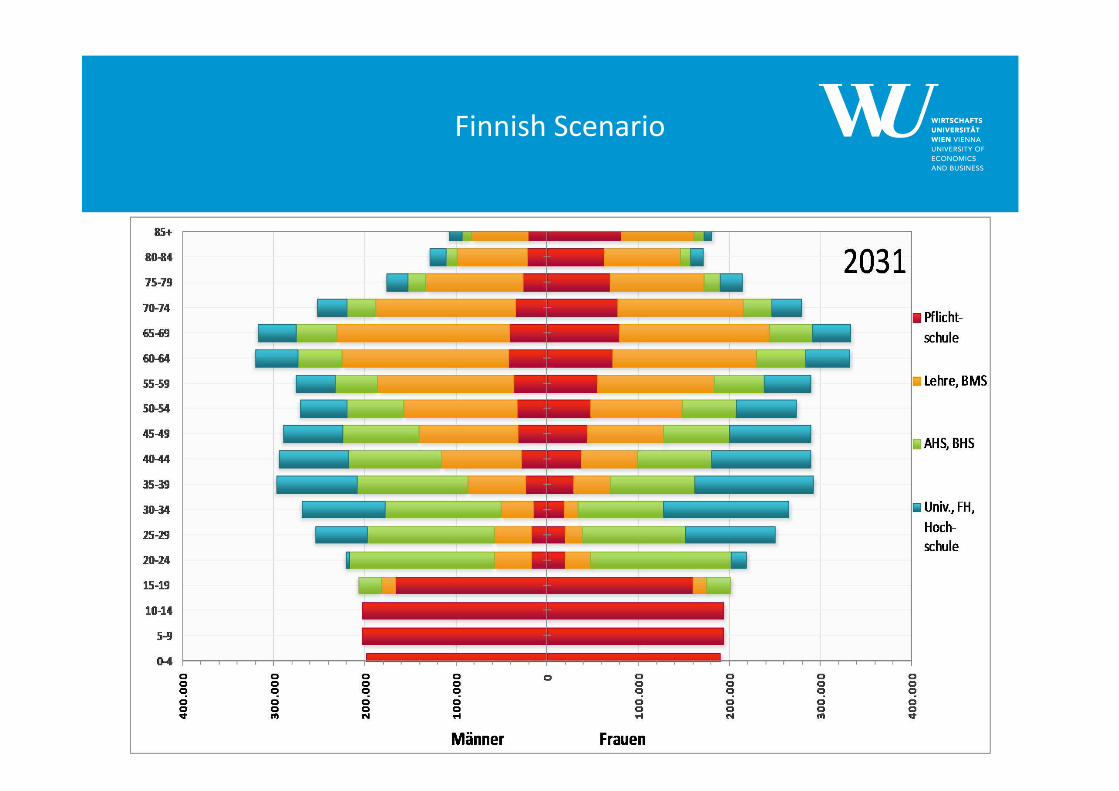
Finnish Scenario
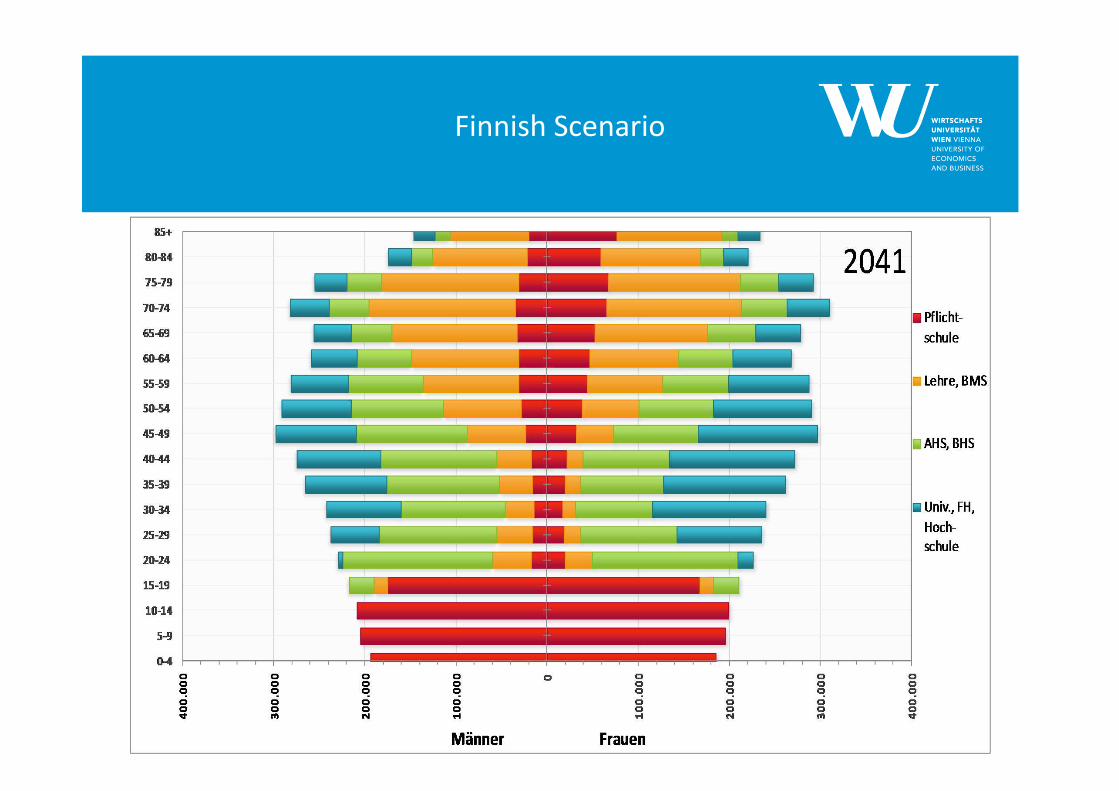
Finnish Scenario
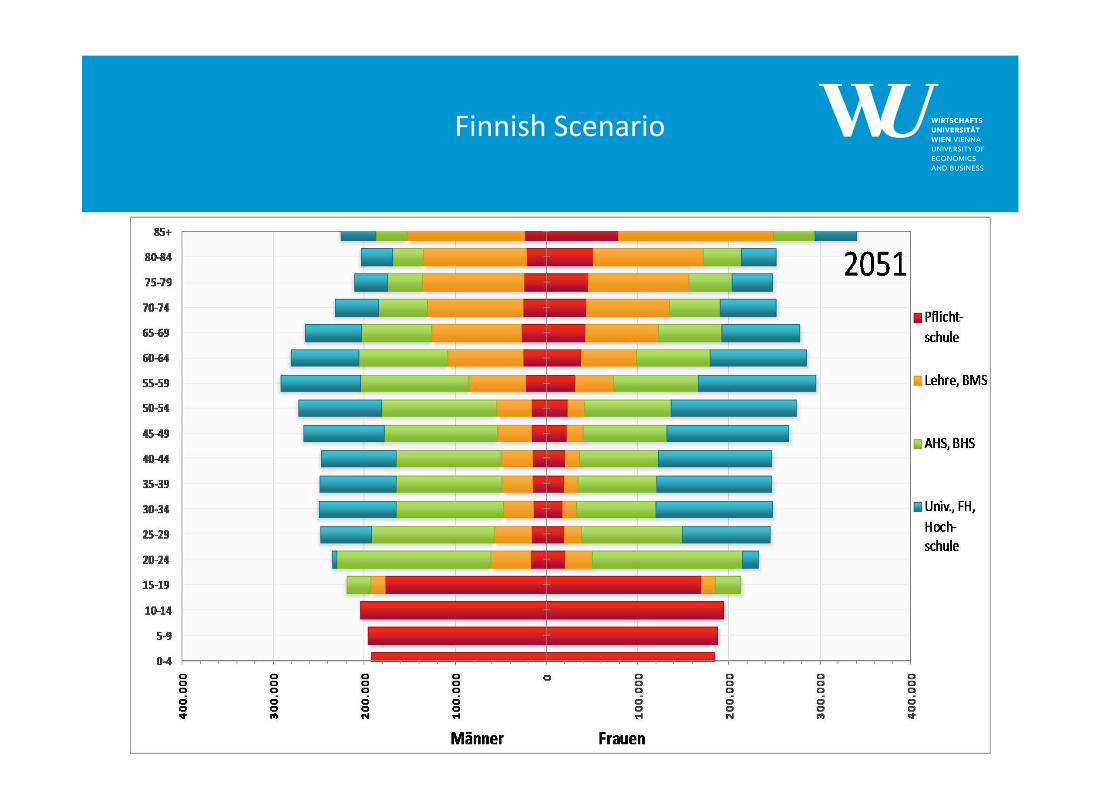
Finnish Scenario
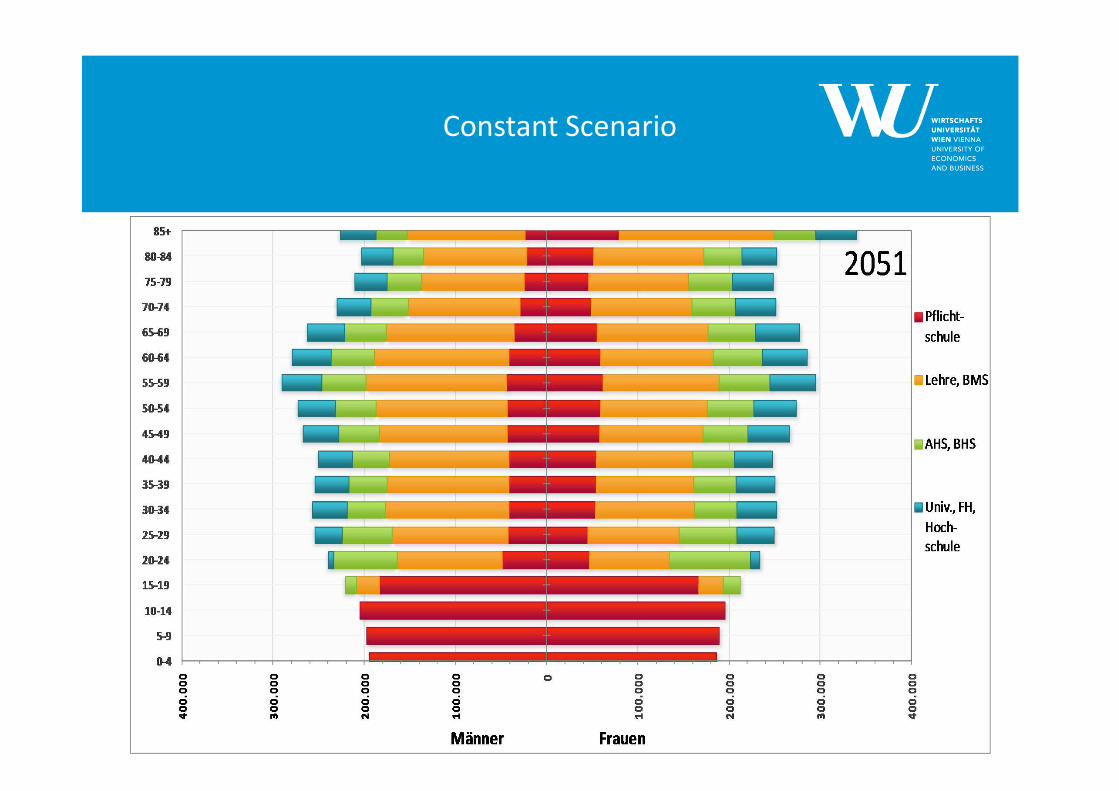
Constant Scenario
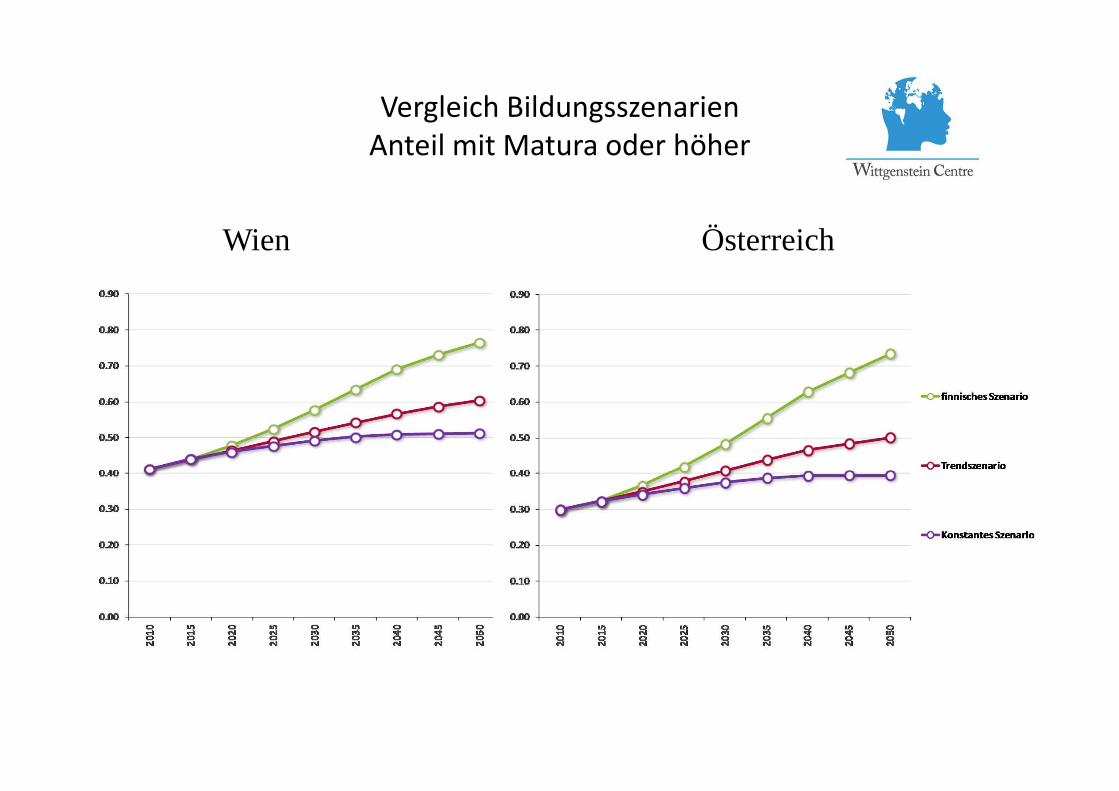
Vergleich Bildungsszenarien
Anteil mit Matura oder höher
31
Wien Österreich
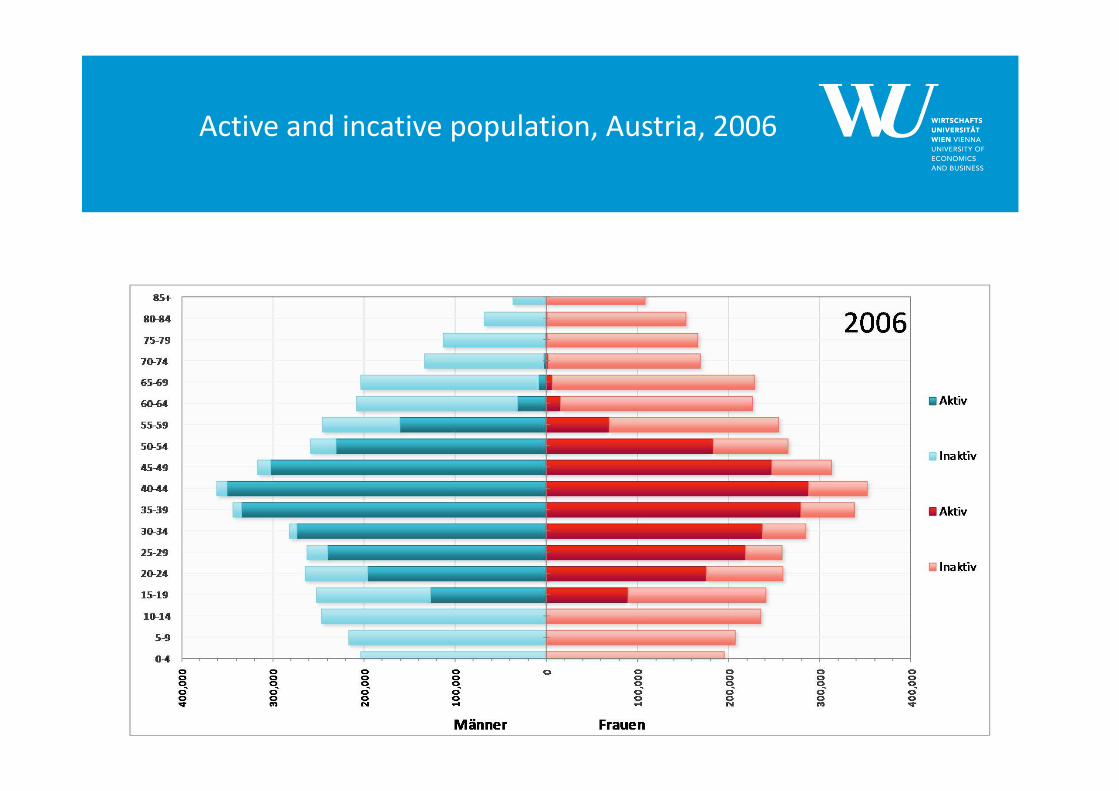
Active and incative population, Austria, 2006
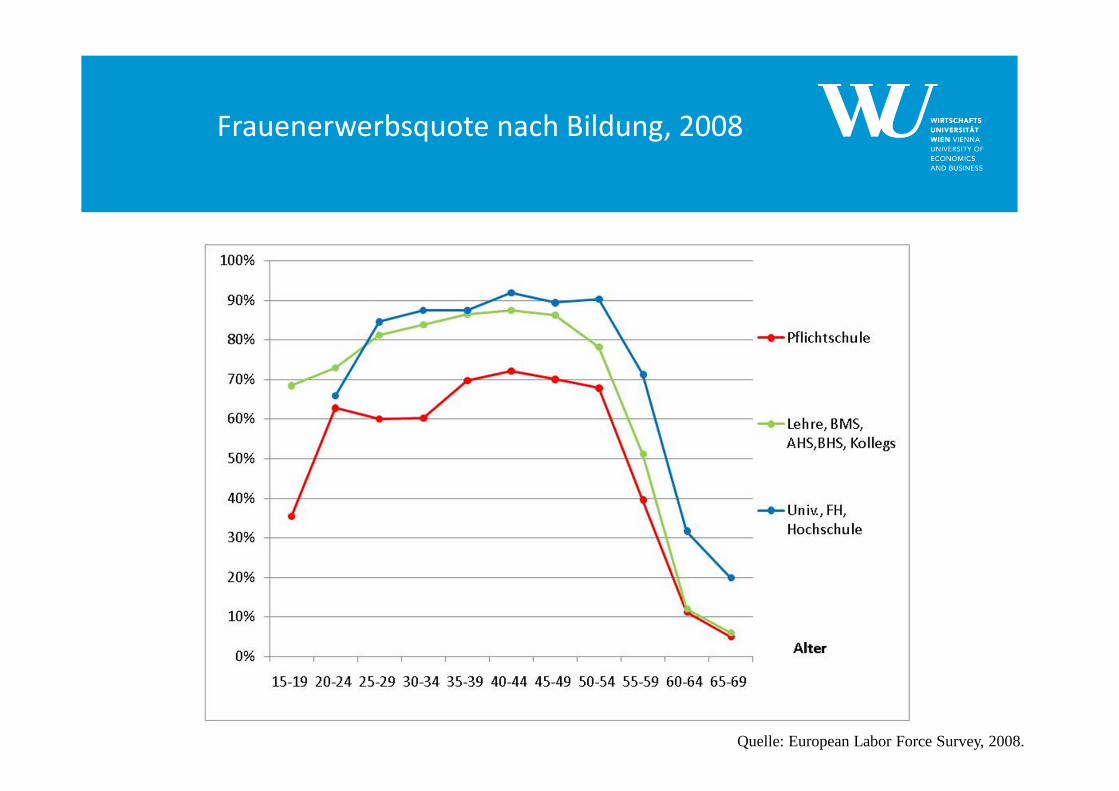
Frauenerwerbsquote nach Bildung, 2008
Quelle: European Labor Force Survey, 2008.
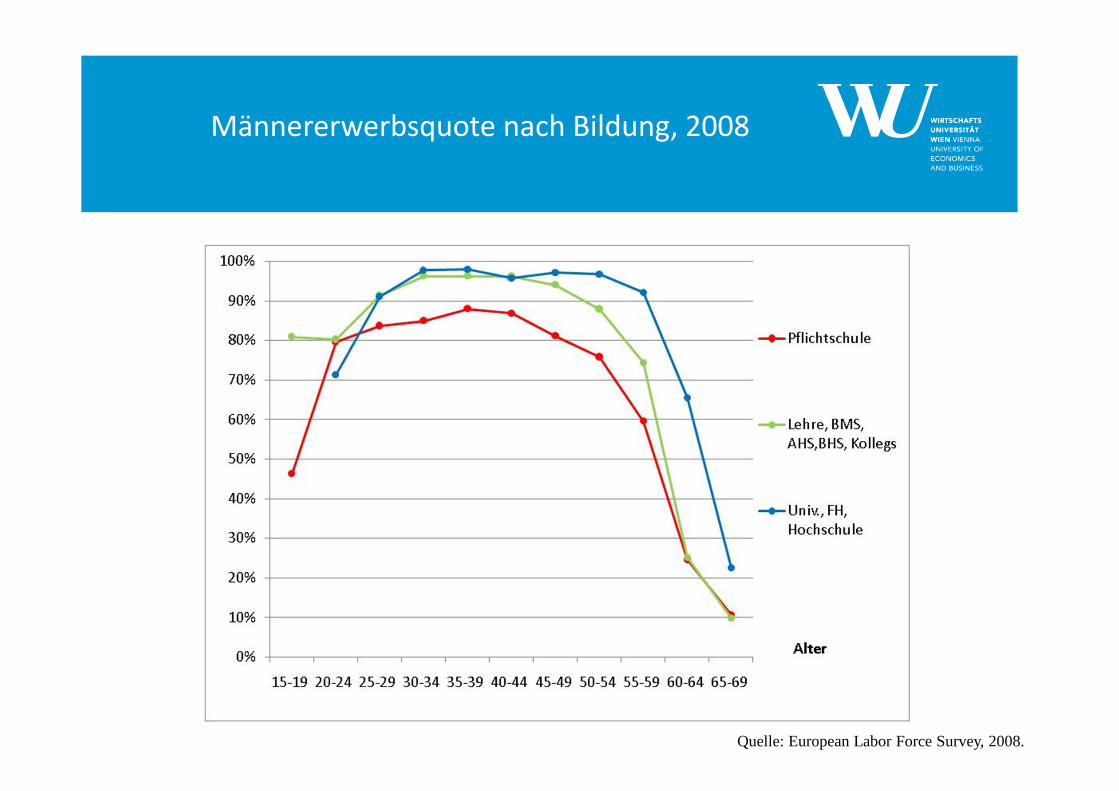
Männererwerbsquote nach Bildung, 2008
Quelle: European Labor Force Survey, 2008.
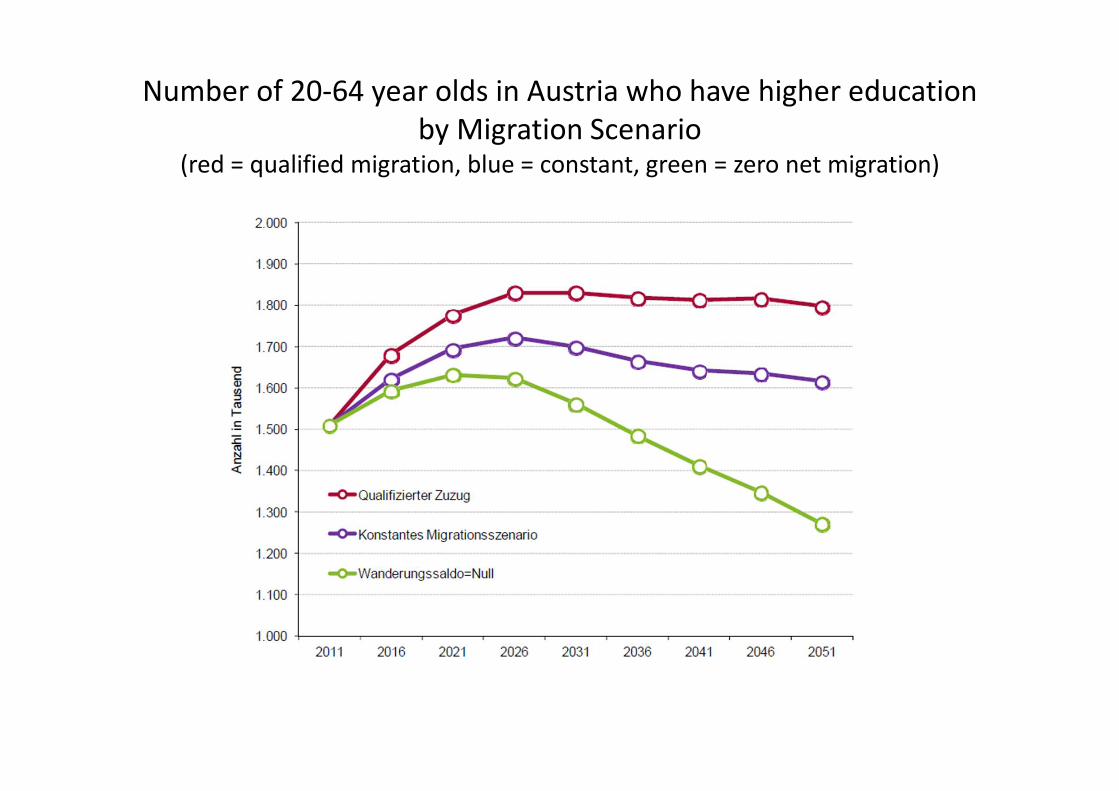
Number of 20-64 year olds in Austria who have higher education
by Migration Scenario(red = qualified migration, blue = constant, green = zero net migration)
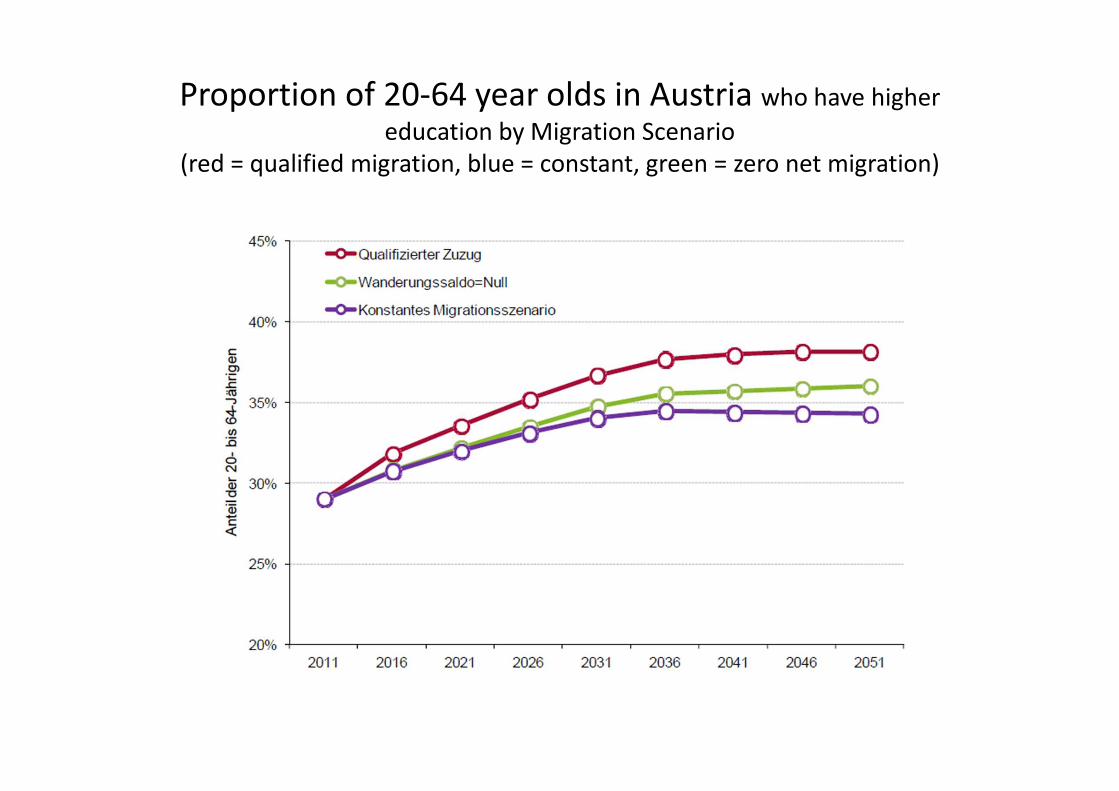
Proportion of 20-64 year olds in Austria who have higher
education by Migration Scenario
(red = qualified migration, blue = constant, green = zero net migration)
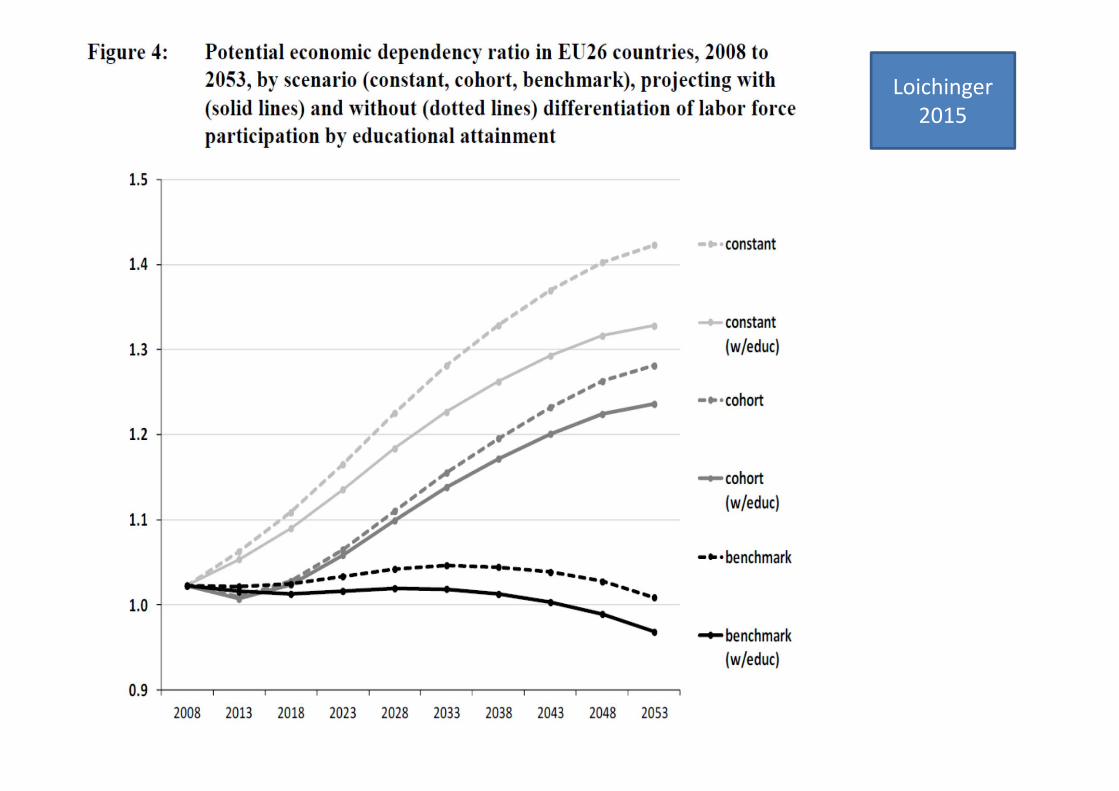
Loichinger
2015
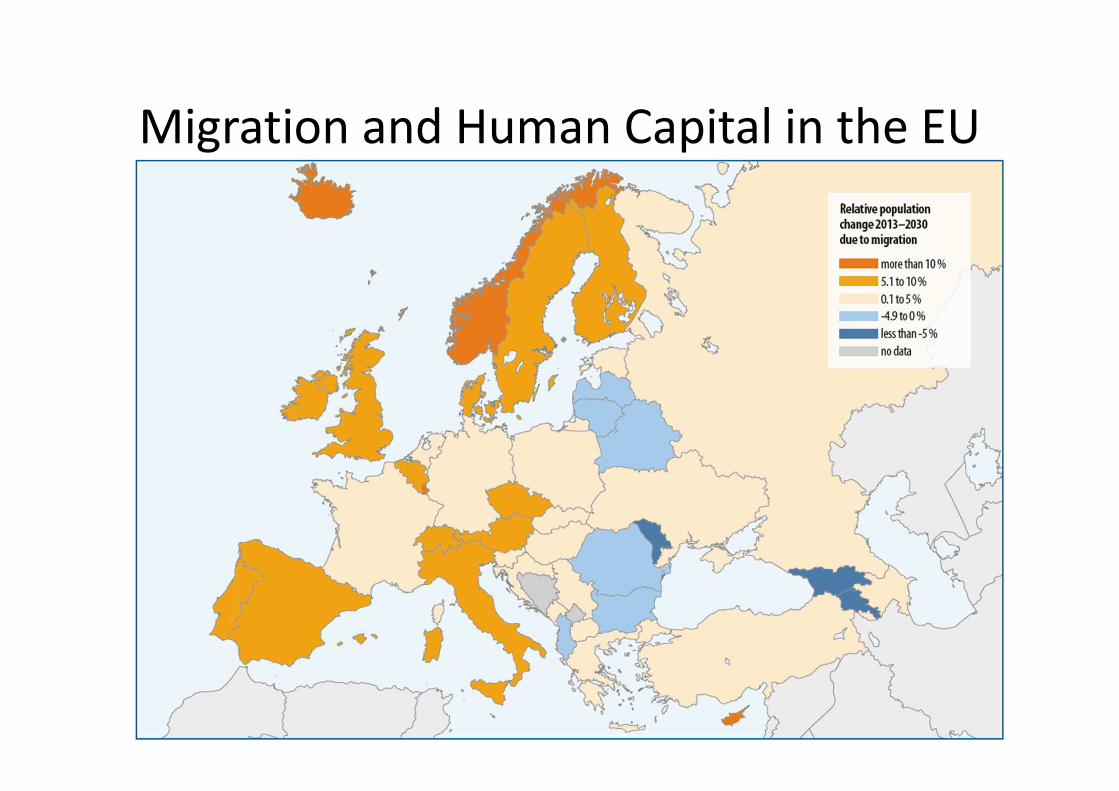
Migration and Human Capital in the EU