Wolfgang Koenig, MD, FESC, FACC Dept. of Internal Medicine II - Cardiology University of Ulm Medical...
39
Wolfgang Koenig, MD, FESC, FACC Wolfgang Koenig, MD, FESC, FACC Dept. of Internal Medicine II - Dept. of Internal Medicine II - Cardiology Cardiology University of Ulm Medical Center University of Ulm Medical Center Ulm, Germany Ulm, Germany RP, Lp-PLA RP, Lp-PLA 2 2 , and Other Serum Marke , and Other Serum Marke of Disease and Vulnerability of Disease and Vulnerability The 2 The 2 nd Vulnerable Patient Satellite Vulnerable Patient Satellite Symposium Symposium Towards a National Screening Program Towards a National Screening Program New Orleans, LA, March 6 New Orleans, LA, March 6 th th , 2004 , 2004
-
Upload
leslie-barton -
Category
Documents
-
view
218 -
download
1
Transcript of Wolfgang Koenig, MD, FESC, FACC Dept. of Internal Medicine II - Cardiology University of Ulm Medical...

Wolfgang Koenig, MD, FESC, FACCWolfgang Koenig, MD, FESC, FACCDept. of Internal Medicine II - CardiologyDept. of Internal Medicine II - Cardiology
University of Ulm Medical CenterUniversity of Ulm Medical CenterUlm, GermanyUlm, Germany
CRP, Lp-PLACRP, Lp-PLA22 , and Other Serum Markers , and Other Serum Markers
of Disease and Vulnerabilityof Disease and Vulnerability
The 2The 2ndnd Vulnerable Patient Satellite Symposium Vulnerable Patient Satellite Symposium Towards a National Screening Program Towards a National Screening Program
New Orleans, LA, March 6New Orleans, LA, March 6thth, 2004, 2004

IdentityIdentityTest PositiveTest PositiveTest NegativeTest Negative
0.50.5
0.40.4
0.30.3
0.20.2
0.10.1
0.00.0 0.05 0.1 0.15 0.20.05 0.1 0.15 0.2
Pre-test Probability of CHD Event in 10 YrsPre-test Probability of CHD Event in 10 Yrs
Post
-test
Pro
babi
lity o
f CHD
Eve
nt in
10
Yrs
Post
-test
Pro
babi
lity o
f CHD
Eve
nt in
10
Yrs
modified after Greenland et al. Circulation 2001;104:1863-1867modified after Greenland et al. Circulation 2001;104:1863-1867
Low-Risk Intermediate-Risk High-RiskLow-Risk Intermediate-Risk High-Risk(~35 % of Pts.) (~40% of Pts.) (~25% of Pts.)(~35 % of Pts.) (~40% of Pts.) (~25% of Pts.)
<6 (10) % 6 (10) -19 % ≥ 20 %<6 (10) % 6 (10) -19 % ≥ 20 % over 10 yearsover 10 years
CHD Risk Assessment in Asymptomatic CHD Risk Assessment in Asymptomatic Patients: Selective Use of Noninvasive TestingPatients: Selective Use of Noninvasive Testing
Modification of Probability Estimates of Modification of Probability Estimates of CHD by Non-invasive TestingCHD by Non-invasive Testing
Assessment by multivariable Assessment by multivariable statistical models: e.g. statistical models: e.g. Framingham Risk Score or Framingham Risk Score or PROCAM ScorePROCAM Score
Clear guidelines for high or low Clear guidelines for high or low risk subjects, but not so for risk subjects, but not so for those at intermediate riskthose at intermediate risk

* ESR, erythrocyte sedimentation rate; PAI-1, plasminogen activator inhibitor-1; vWF, von Willebrand factor; * ESR, erythrocyte sedimentation rate; PAI-1, plasminogen activator inhibitor-1; vWF, von Willebrand factor; CIC, circulating immune complexes; Lp-PLACIC, circulating immune complexes; Lp-PLA2 2 lipoprotein-associated phospholipase Alipoprotein-associated phospholipase A22
Acute Phase Reactants Investigated Acute Phase Reactants Investigated Prospectively in Epidemiological StudiesProspectively in Epidemiological StudiesNon-Protein Non-Protein MarkersMarkers
Frequently Studied Frequently Studied ProteinsProteins
Infrequently Studied Infrequently Studied ProteinsProteins
LeukocytesLeukocytes C-reactive proteinC-reactive protein OrosomucoidOrosomucoidESR*ESR* Serum amyloid ASerum amyloid A AlphaAlpha11-antitrypsin-antitrypsinPlasma viscosityPlasma viscosity FibrinogenFibrinogen HaptoglobinHaptoglobin
AlbuminAlbumin CeruloplasminCeruloplasmin
PlasminogenPlasminogen C3, C4C3, C4
PAI-1*PAI-1* IgA, G, M, and EIgA, G, M, and E
vWF*vWF* Sialic acidSialic acid
Cytokines Cytokines (IL-6, 8, 10, (IL-6, 8, 10, 1818) ) CIC*CIC*
CAMsCAMs Lp (a)Lp (a)
Lp-PLALp-PLA22**, , sPLAsPLA22-IIA-IIA
mod. after Koenig & Rosenson. Sem Vasc Med 2002;2:417-24mod. after Koenig & Rosenson. Sem Vasc Med 2002;2:417-24

Kuller Kuller MRFITMRFIT1996 1996 CHD death CHD deathRidker Ridker PHSPHS 1997 1997 MI MIRidker Ridker PHSPHS19971997 Stroke StrokeTracy Tracy CHS/RHPPCHS/RHPP19971997 CHD CHDRidker Ridker PHSPHS1998,20011998,2001 PAD PADRidker Ridker WHSWHS 1998,2000,2002 1998,2000,2002 CVD CVDKoenig Koenig MONICAMONICA19991999 CHD CHDRoivainen Roivainen HELSINKIHELSINKI 2000 2000 CHD CHDMendall Mendall CAERPHILLYCAERPHILLY 2000 2000 CHD CHDDanesh Danesh BRITAINBRITAIN 2000 2000 CHD CHDGussekloo Gussekloo LEIDENLEIDEN 2001 2001 Fatal Stroke Fatal StrokeLowe Lowe SPEEDWELLSPEEDWELL 2001 2001 CHD CHDPackard Packard WOSCOPSWOSCOPS 20012001 CV Events CV EventsRidker Ridker AFCAPSAFCAPS 20012001 CV Events CV EventsRost Rost FHSFHS 20012001 Stroke StrokePradhan Pradhan WHIWHI 20022002 MI, CVD death MI, CVD death Albert Albert PHSPHS 2002 2002 Sudden Death Sudden DeathSakkinen Sakkinen HHSHHS 2002 2002 MI MI
00 1.0 1.0 2.02.0 3.03.0 4.04.0 5.05.0 6.06.0Relative Risk (upper versus lower quartile)Relative Risk (upper versus lower quartile)
Ridker PM. Circulation 2003;107:363-369Ridker PM. Circulation 2003;107:363-369
CRP as a Risk Factor for Future CVD –CRP as a Risk Factor for Future CVD –Results from Population-Based StudiesResults from Population-Based Studies

0.810.81<0.001<0.0012.32.32.02.01.61.61.41.41.01.0Risk-factor–adj. RRRisk-factor–adj. RR
0.810.81<0.001<0.0011.51.51.31.31.11.10.90.91.01.0Risk-factor–adj. RRRisk-factor–adj. RR0.730.73<0.001<0.0011.71.71.51.51.11.10.90.91.01.0Age-adjusted RRAge-adjusted RR0.600.60<0.001<0.0012.22.21.81.81.31.31.01.01.01.0Crude RRCrude RR
55(>153.9)(>153.9)
44(>132.2- (>132.2- 153.9)153.9)
33(>115.4- (>115.4- 132.2)132.2)
22(>97.6 -(>97.6 -115.4)115.4)
11((97.6)97.6)
0.740.74<0.001<0.0013.63.62.52.51.81.81.51.51.01.0Age-adjusted RRAge-adjusted RR0.640.64<0.001<0.0014.54.53.23.22.32.31.81.81.01.0Crude RRCrude RR
Area Area under under ROC ROC CurveCurve
P-P-ValueValue
55(>4.19)(>4.19)
44(>2.09- (>2.09- 4.19)4.19)
33(>1.08- (>1.08- 2.09)2.09)
22(>0.49-(>0.49-1.08)1.08)
11((0.490.49
))
VariableVariable
Quintile of CRP (mg/L)Quintile of CRP (mg/L)
Quintile of LDL Cholesterol (mg/dL)Quintile of LDL Cholesterol (mg/dL)
Ridker et al. N Engl J Med 2002;347:1557-1565Ridker et al. N Engl J Med 2002;347:1557-1565
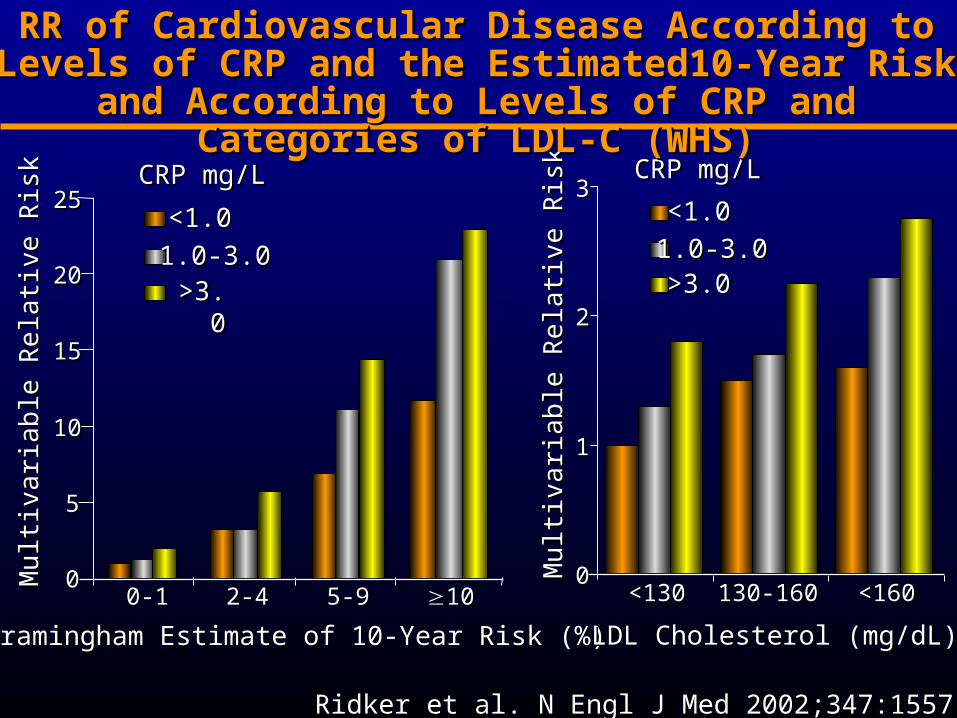
Relative Risk (RR) of a First Cardiovascular Event, Relative Risk (RR) of a First Cardiovascular Event, According to CRP and LDL- C at Baseline (WHS)According to CRP and LDL- C at Baseline (WHS)
00
55
1010
1515
2020
2525
0-10-1 2-42-4 5-95-9 1010
<1.0<1.0
1.0-3.01.0-3.0>3.>3.
00
CRP mg/LCRP mg/L
<1.0<1.0
1.0-3.01.0-3.0>3.0>3.0
CRP mg/LCRP mg/L
00
11
22
33
<130<130 130-160130-160 <160<160
Mu
ltiva
ria
ble
Re
lativ
e R
isk
Mu
ltiva
ria
ble
Re
lativ
e R
isk
Mu
ltiva
ria
ble
Re
lativ
e R
isk
Mu
ltiva
ria
ble
Re
lativ
e R
isk
Framingham Estimate of 10-Year Risk (%)Framingham Estimate of 10-Year Risk (%) LDL Cholesterol (mg/dL)LDL Cholesterol (mg/dL)
RR of Cardiovascular Disease According to Levels of RR of Cardiovascular Disease According to Levels of CRP and the Estimated10-Year Risk and According to CRP and the Estimated10-Year Risk and According to
Levels of CRP and Categories of LDL-C (WHS)Levels of CRP and Categories of LDL-C (WHS)
Ridker et al. N Engl J Med 2002;347:1557-1565Ridker et al. N Engl J Med 2002;347:1557-1565

Class I: Should be performedClass I: Should be performedClass II: Conflicting evidence/opinionClass II: Conflicting evidence/opinion a: Weight in favor of usefulness/efficacya: Weight in favor of usefulness/efficacy b: Usefulness/efficacy less well establishedb: Usefulness/efficacy less well establishedClass III: Should not be performedClass III: Should not be performed
Class I: Should be performedClass I: Should be performedClass II: Conflicting evidence/opinionClass II: Conflicting evidence/opinion a: Weight in favor of usefulness/efficacya: Weight in favor of usefulness/efficacy b: Usefulness/efficacy less well establishedb: Usefulness/efficacy less well establishedClass III: Should not be performedClass III: Should not be performed
AHA/CDC Recommendations for AHA/CDC Recommendations for Clinical and Public Health PracticeClinical and Public Health Practice
Of current inflammatory markers identified, Of current inflammatory markers identified, hs-CRP has hs-CRP has the analyte & assay characteristics most conducive to use the analyte & assay characteristics most conducive to use in practicein practice (Class IIa, Level of Evidence B)(Class IIa, Level of Evidence B)
Other inflammatory markers should not be measured for Other inflammatory markers should not be measured for determination of CV risk in addition to hs-CRPdetermination of CV risk in addition to hs-CRP (Class III, (Class III, Level of Evidence C)Level of Evidence C)
Laboratory TestsLaboratory Tests
AHA/CDC Statement. Circulation 2003;107:499–511AHA/CDC Statement. Circulation 2003;107:499–511

The Value of CRP in Cardiovascular The Value of CRP in Cardiovascular Risk Prediction: The Rotterdam Study Risk Prediction: The Rotterdam Study
Nested case-control study (157/500) within a population based Nested case-control study (157/500) within a population based cohort study of 7983 men and women >55 yearscohort study of 7983 men and women >55 years
Multivariable RR (Q4-Q1) for CRP 1.2 (95% CI, 0.6-2.2)Multivariable RR (Q4-Q1) for CRP 1.2 (95% CI, 0.6-2.2) Assessment of Framingham Risk Score w/o and with CRPAssessment of Framingham Risk Score w/o and with CRP Assessment of AUC by ROC analysisAssessment of AUC by ROC analysis
VariableVariable AUC (SE)AUC (SE)
Basic risk Basic risk ** 0.642 (0.026)0.642 (0.026)Risk function 1 Risk function 1 †† 0.773 (0.021)0.773 (0.021) with CRPwith CRP 0.777 (0.021)0.777 (0.021)Risk function 2 Risk function 2 ‡‡ 0.746 (0.021)0.746 (0.021) with CRPwith CRP 0.748 (0.021)0.748 (0.021)
* Indicated by age, age squared, sex; * Indicated by age, age squared, sex; †† Indicated by age, age squared, sex, current smoking, BMI, Indicated by age, age squared, sex, current smoking, BMI, BP, DM, family hystory of early MI, TC, HDL; BP, DM, family hystory of early MI, TC, HDL; ‡‡ based on the Framingham risk function + LVH based on the Framingham risk function + LVH
Van der Meer et al. Arch Intern Med 2003;163:1323-1328 Van der Meer et al. Arch Intern Med 2003;163:1323-1328

< 6 6-10 11-14 15-19 < 6 6-10 11-14 15-19 202000
11
22
33
44
55
66
77
88
RR of CHD According to the Estimated 10-Yr RR of CHD According to the Estimated 10-Yr Risk Alone and in Combination With CRP: Risk Alone and in Combination With CRP:
MONICA Augsburg CohortMONICA Augsburg Cohort
< 6 6-10 11-14 15-19 < 6 6-10 11-14 15-19 202000
11
22
33
44
55
66
77
88
P=0.19P=0.19P=0.28P=0.28
P=0.02P=0.02
P=0.03P=0.03
P=0.14P=0.14
<1.0<1.01.0 – 3.01.0 – 3.0> 3.0> 3.0
CRP CRP mg/Lmg/L
18 18 32 32 35 50 5635 50 56
Population at risk Population at risk
809 914 650 526 536809 914 650 526 536
Framingham Estimate of 10-Year Risk (%)Framingham Estimate of 10-Year Risk (%)
Mu
ltiva
ria
ble
Re
lativ
e R
isk
Mu
ltiva
ria
ble
Re
lativ
e R
isk
AIC 2776AIC 2776AIC 2789AIC 2789
(N=3,435 Men, 45-74 Yrs; 191 Events, FU 6.6 Yrs)(N=3,435 Men, 45-74 Yrs; 191 Events, FU 6.6 Yrs)
Koenig et al. Circulation (in press)Koenig et al. Circulation (in press)

FactorFactor Events/nEvents/n HR (95%CI)HR (95%CI) P-valueP-value HR (95%CI)HR (95%CI) P-valueP-value
FRS 1FRS 1 <6<6 18/80918/809 Ref.Ref. Ref.Ref.
(%)(%) 6-19 6-19 117/2090117/2090 2.81 (1.71-4.62)2.81 (1.71-4.62) 2.39 (1.45-3.94)2.39 (1.45-3.94)
20 20 56/53656/536 6.19 (3.64-10.54)6.19 (3.64-10.54) <0.0001<0.0001 4.85 (2.82-8.33)4.85 (2.82-8.33) <0.0001<0.0001
AICAIC 28162816 27972797 ∆∆AIC 19AIC 19
AUCAUC 0.7130.713 0.7400.740 0.00770.0077
FRS 2FRS 2 <6<6 18/80918/809 Ref.Ref. Ref.Ref.
(%)(%) 6-106-10 32/91432/914 1.63 (0.91-2.90)1.63 (0.91-2.90) 1.46 (0.82-2.61)1.46 (0.82-2.61)
11-1411-14 35/65035/650 2.70 (1.53-4.77)2.70 (1.53-4.77) 2.35 (1.32-4.16)2.35 (1.32-4.16)
15-1915-19 50/52650/526 5.61 (3.27-9.62)5.61 (3.27-9.62) 4.50 (2.59-7.80)4.50 (2.59-7.80)
2020 56/53656/536 6.21 (3.65-10.57)6.21 (3.65-10.57) <0.0001<0.0001 5.01 (2.91-8.62)5.01 (2.91-8.62) <0.0002<0.0002
AICAIC 27892789 27762776 ∆∆AIC 13AIC 13
AUCAUC 0.7350.735 0.7500.750 0.01630.0163
AIC, Akaike’s Information Criterion; ΔAIC, AIC (model without CRP) – AIC (model with CRP); AIC, Akaike’s Information Criterion; ΔAIC, AIC (model without CRP) – AIC (model with CRP); AUC, Area under the curve AUC, Area under the curve
Risk of a First Coronary Event by Cox Risk of a First Coronary Event by Cox Model Without and With CRP for the FRS Model Without and With CRP for the FRS
With 3 and 5 Categories With 3 and 5 Categories
Koenig et al. Circulation (in press)Koenig et al. Circulation (in press)

MONICA Augsburg Cohort Study: Summary MONICA Augsburg Cohort Study: Summary
Elevated CRP concentrations and an elevated TC/HDL-C ratio Elevated CRP concentrations and an elevated TC/HDL-C ratio were both independently related to incident CHD.were both independently related to incident CHD.
The addition of CRP to a prediction model of TC/HDL-C or the The addition of CRP to a prediction model of TC/HDL-C or the FRS resulted in a better fit of the model containing CRP and FRS resulted in a better fit of the model containing CRP and significantly improved prediction of incident CHD for TC/HDL-C significantly improved prediction of incident CHD for TC/HDL-C and the calculated FRS.and the calculated FRS.
The latter was particularly true for those at intermediate risk The latter was particularly true for those at intermediate risk (10-20% over 10 years).(10-20% over 10 years).
Thus, CRP measurement modulates coronary risk and may Thus, CRP measurement modulates coronary risk and may therefore modify the physician`s interpretation of the patient`s therefore modify the physician`s interpretation of the patient`s risk status.risk status.
However, these findings have to be replicated in other However, these findings have to be replicated in other populations.populations.
Koenig et al. Circulation (in press)Koenig et al. Circulation (in press)

* ESR, erythrocyte sedimentation rate; PAI-1, plasminogen activator inhibitor-1; vWF, von Willebrand factor; * ESR, erythrocyte sedimentation rate; PAI-1, plasminogen activator inhibitor-1; vWF, von Willebrand factor; CIC, circulating immune complexes; Lp-PLACIC, circulating immune complexes; Lp-PLA2 2 lipoprotein-associated phospholipase Alipoprotein-associated phospholipase A22
Acute Phase Reactants Investigated Acute Phase Reactants Investigated Prospectively in Epidemiological StudiesProspectively in Epidemiological StudiesNon-Protein Non-Protein MarkersMarkers
Frequently Studied Frequently Studied ProteinsProteins
Infrequently Studied Infrequently Studied ProteinsProteins
LeukocytesLeukocytes C-reactive proteinC-reactive protein OrosomucoidOrosomucoidESR*ESR* Serum amyloid ASerum amyloid A AlphaAlpha11-antitrypsin-antitrypsinPlasma viscosityPlasma viscosity FibrinogenFibrinogen HaptoglobinHaptoglobin
AlbuminAlbumin CeruloplasminCeruloplasmin
PlasminogenPlasminogen C3, C4C3, C4
PAI-1*PAI-1* IgA, G, M, and EIgA, G, M, and E
vWF*vWF* Sialic acidSialic acid
Cytokines Cytokines (IL-6, 8, 10, (IL-6, 8, 10, 1818) ) CIC*CIC*
CAMsCAMs Lp (a)Lp (a)
Lp-PLALp-PLA22**,, sPLAsPLA22-IIA-IIA
mod. after Koenig & Rosenson. Sem Vasc Med 2002;2:417-24mod. after Koenig & Rosenson. Sem Vasc Med 2002;2:417-24

IL-18 and Risk of CHDIL-18 and Risk of CHD**: PRIME : PRIME
Combined EndpointCombined Endpoint Coronary Death and MI Coronary Death and MI
<160 160-235 >235<160 160-235 >235 <160 160-235 >235<160 160-235 >235[pg/mL][pg/mL] [pg/mL][pg/mL]
Rel
ativ
e R
isk
(95%
CI)
Rel
ativ
e R
isk
(95%
CI)
Rel
ativ
e R
isk
(95%
CI)
Rel
ativ
e R
isk
(95%
CI)
33
22
11
00
33
22
11
00
FF
FF
FF
FFBB
BB
BB
BB
Blankenberg et al. Circulation 2003;108:2453-2459Blankenberg et al. Circulation 2003;108:2453-2459* In tertiles of IL-18* In tertiles of IL-18

Lipoprotein-associated phospholipase ALipoprotein-associated phospholipase A22 (Lp-PLA (Lp-PLA22))
Platelet-activating factor acetylhydrolase Platelet-activating factor acetylhydrolase
50kDa, Ca-insensitive lipase 50kDa, Ca-insensitive lipase
Produced predominantly by macrophages/ Produced predominantly by macrophages/
monocytes, T-cells, and mast cells monocytes, T-cells, and mast cells
Not responsive to IL-1, IL-6, TNF-Not responsive to IL-1, IL-6, TNF- Secretory phospholipase ASecretory phospholipase A22 (sPLA (sPLA22) )
14 kDa, Ca-dependent lipase14 kDa, Ca-dependent lipase
Produced by arterial wall SMC and Produced by arterial wall SMC and macrophages macrophages
Increased by cytokines IL-1, IL-6, TNF-Increased by cytokines IL-1, IL-6, TNF-
Phospholipases APhospholipases A22 and Atherosclerosis and Atherosclerosis

Theory: Lp-PLATheory: Lp-PLA22 Promotes Atherogenesis Promotes Atherogenesis
Generates lyso-PC during oxidation of LDLGenerates lyso-PC during oxidation of LDL Lp-PLALp-PLA22-dependent oxFFA are also bioactive -dependent oxFFA are also bioactive
human monocyte chemoattractantshuman monocyte chemoattractants Anti-atherosclerotic effect of inhibitor Anti-atherosclerotic effect of inhibitor
demonstrated in WHHL rabbitdemonstrated in WHHL rabbit Plasma levels correlate with CHD in patients? Plasma levels correlate with CHD in patients?

LumenLumen
IntimaIntima
MediaMedia
LDLLDL
OxidizedOxidized LDLLDL
Lp-PLALp-PLA22
Lyso-PCLyso-PC++
OxFAOxFA
Adhesion Adhesion MoleculesMolecules
MonocyteMonocyte
PlaquePlaqueFormationFormation
PlaquePlaqueFormationFormationCytokinesCytokines
MacrophageMacrophageMacrophageMacrophage
Foam CellFoam CellFoam CellFoam Cell
Role of Lp-PLARole of Lp-PLA22 in Coronary Heart Disease in Coronary Heart Disease

West of Scotland Coronary West of Scotland Coronary Prevention Study (WOSCOPS)Prevention Study (WOSCOPS)
WOSCOPS StudyWOSCOPS Study DesignDesign randomized, double blind, placebo controlled trialrandomized, double blind, placebo controlled trial 6,595 men, aged 45 to 656,595 men, aged 45 to 65 elevated LDL levels (range 174-232 mg/dL or 4.5-6.0 elevated LDL levels (range 174-232 mg/dL or 4.5-6.0
mM)mM) no previous myocardial infarction (MI)no previous myocardial infarction (MI) mean follow-up of 5 yearsmean follow-up of 5 years
Study ResultsStudy Results treatment with Pravastatin reduced risk of first time treatment with Pravastatin reduced risk of first time
heart attack (by 31%) and death (by 22%)heart attack (by 31%) and death (by 22%)
Packard et al. N Engl J Med 2000;343:1148-1155Packard et al. N Engl J Med 2000;343:1148-1155

Lp-PLALp-PLA22 as a Novel Risk Factor in CHD: as a Novel Risk Factor in CHD:WOSCOPSWOSCOPS
Baseline samplesBaseline samples
(stored @ -70(stored @ -70ooC)C)
plasmaplasma
n=6,595n=6,595 4.9 years4.9 years
580 coronary 580 coronary events events
1,160 event free1,160 event free
(randomly selected, but (randomly selected, but age, smoking matched)age, smoking matched)
CasesCases
ControlsControls
Samples drawn Samples drawn from freezerfrom freezer
Packard et al. N Engl J Med 2000;343:1148-1155Packard et al. N Engl J Med 2000;343:1148-1155
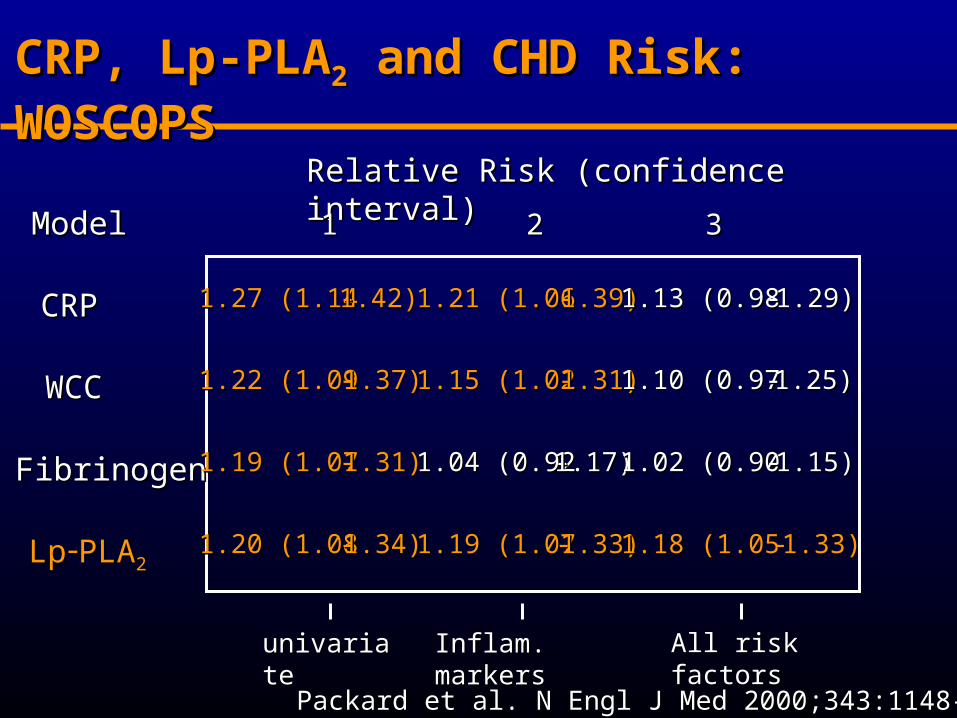
CRP, Lp-PLACRP, Lp-PLA22 and CHD Risk: WOSCOPS and CHD Risk: WOSCOPS
univariateunivariate Inflam. markersInflam. markers All risk factorsAll risk factors
Relative Risk (confidence interval)Relative Risk (confidence interval)
ModelModel 11 22 33
CRPCRP 1.27 (1.141.27 (1.14 --1.42)1.42) 1.21 (1.061.21 (1.06 --1.39)1.39) 1.13 (0.981.13 (0.98 -- 1.29)1.29)
WCCWCC 1.22 (1.091.22 (1.09 --1.37)1.37) 1.15 (1.021.15 (1.02 --1.31)1.31) 1.10 (0.971.10 (0.97 -- 1.25)1.25)
FibrinogenFibrinogen 1.19 (1.071.19 (1.07 --1.31)1.31) 1.04 (0.921.04 (0.92--1.17)1.17) 1.02 (0.901.02 (0.90 -- 1.15)1.15)
LpLp --PLAPLA22 1.20 (1.081.20 (1.08 --1.34)1.34) 1.19 (1.071.19 (1.07 --1.33)1.33) 1.18 (1.051.18 (1.05 -- 1.33)1.33)
Packard et al. N Engl J Med 2000;343:1148-1155Packard et al. N Engl J Med 2000;343:1148-1155

Methods: Patient Population and AssaysMethods: Patient Population and Assays
12,819 apparently healthy men and women free of CHD at ARIC visit 2
608 individuals with incident CHD between visit 2 and visit 4 (6- to 8-year follow-up), with 740 controls from a cohort random sample
Lp-PLA2 : diaDexus PLAC™ test (Dada et al. Expert Re Mol Diagn 2002), dual monoclonal Ab immunoassay standardized to recombinant Lp-PLA2
hs-CRP: Denka Seiken asssay, which has been validated to Dade Behring method (Roberts et al. Clin Chem 2001)
Lp-PLALp-PLA22 and Risk of CHD: ARIC and Risk of CHD: ARIC
Ballantyne et al. Circulation 2004;109:837-842Ballantyne et al. Circulation 2004;109:837-842

Weighted-Adjusted* Means of Risk FactorsWeighted-Adjusted* Means of Risk FactorsVariable Cases (n=608) Noncases(n=740) P-value
DM 28.7 15.1 <0.001BMI 28.7 28.1 0.014TC 219.7 207.2 <0.001TG 144.8 124.5 <0.001HDL-C 45.6 51.2 <0.001LDL-C 145.1 131.2 <0.001SBP 127.5 121.6 <0.001DBP 73.1 72.6 0.350Lp-PLA2
404 373 <0.001hs-CRP 4.05 3.04 <0.001
* Adjusted for age, sex, and race* Adjusted for age, sex, and race Ballantyne et al. Circulation 2004;109:837-842Ballantyne et al. Circulation 2004;109:837-842
Lp-PLALp-PLA22 and Risk of CHD: ARIC and Risk of CHD: ARIC

2 2 (310-422 (310-422 μμg/L)g/L) 3 3 (≥422 (≥422 μμg/L)g/L)
Model 1Model 1†† 1.26 (0.94-1.69)1.26 (0.94-1.69) 1.78 (1.33-2.38)1.78 (1.33-2.38)
Model 2Model 2‡‡ 1.02 (0.73-1.43)1.02 (0.73-1.43) 1.16 (0.82-1.65)1.16 (0.82-1.65)
Model 2Model 2‡‡, LDL-C<130 mg/dL, LDL-C<130 mg/dL 1.83 (1.11-3.00)1.83 (1.11-3.00) 1.99 (1.17-3.38)1.99 (1.17-3.38)
Model 3Model 3§§ 1.00 (0.71-1.41)1.00 (0.71-1.41) 1.15 (0.81-1.63)1.15 (0.81-1.63)
Model 3Model 3§§, LDL-C<130 mg/dL, LDL-C<130 mg/dL 1.83 (1.10-3.05)1.83 (1.10-3.05) 2.08 (1.20-3.62)2.08 (1.20-3.62)
CHD HRs (95% CI) by Lp-PLACHD HRs (95% CI) by Lp-PLA2 2 TertilesTertilesLp-PLALp-PLA2 2 Tertiles *Tertiles *
*Lowest tertile (<310µg/L) is reference; *Lowest tertile (<310µg/L) is reference; ††Adjusted for age, sex, and race; Adjusted for age, sex, and race; ‡‡ Also adjusted Also adjusted for smoking status, SBP, LDL-C, HDL-C, and diabetes; for smoking status, SBP, LDL-C, HDL-C, and diabetes; §§ Additionally adjusted for CRP Additionally adjusted for CRP
Ballantyne et al. Circulation 2004;109:837-842Ballantyne et al. Circulation 2004;109:837-842
Lp-PLALp-PLA22 and Risk of CHD: ARIC and Risk of CHD: ARIC

Weighted-Correlation Between Weighted-Correlation Between Lp-PLALp-PLA22 and Other Risk Factors: ARIC and Other Risk Factors: ARIC
Pearson CorrelationPearson CorrelationRisk FactorRisk Factor Coefficient Coefficient P-P-ValueValue
Total cholesterolTotal cholesterol 0.230.23 <0.0001<0.0001
LDL-CLDL-C 0.360.36 <0.0001<0.0001
HDL-CHDL-C - 0.33- 0.33 <0.0001<0.0001
SBPSBP 0.040.04 NSNS
DBPDBP - 0.01- 0.01 NSNS
hs-CRPhs-CRP - 0.05- 0.05 NSNS
BMIBMI - 0.02- 0.02 NSNS
TriglyceridesTriglycerides 0.130.13 0.00060.0006Ballantyne et al. Circulation 2004;109:837-842Ballantyne et al. Circulation 2004;109:837-842

00
11
22
33
Association of Lp-PLA2 and hs-CRP with Incident Association of Lp-PLA2 and hs-CRP with Incident CHD in Patients with Low LDL-C (<130mg/dL)CHD in Patients with Low LDL-C (<130mg/dL)
CH
D H
azar
d R
atio
CH
D H
azar
d R
atio
Lp-PLALp-PLA22 µg/L µg/L
hs-CRP, mg/Lhs-CRP, mg/L
Lp-PLALp-PLA22 and Risk of CHD: ARIC and Risk of CHD: ARIC
Ballantyne et al. Circulation 2004;109:837-842Ballantyne et al. Circulation 2004;109:837-842
95% CI 1.47 - 5.94,95% CI 1.47 - 5.94,P=0.002P=0.002
High (≥ 422)High (≥ 422)
Low-Med (< 422)Low-Med (< 422)
High (>3) Low-Med (≤3) High (>3) Low-Med (≤3)
2.952.95
1.14 1.001.14 1.00
0.990.99

Lp-PLALp-PLA2 2 and Risk of CHD:and Risk of CHD:
MONICA-Augsburg Cohort 1984-98MONICA-Augsburg Cohort 1984-98 934 men aged 45-64 years, participating in the 934 men aged 45-64 years, participating in the
first MONICA survey 1984/85first MONICA survey 1984/85 Exclusion of prevalent CHD Exclusion of prevalent CHD Standardized assessment of cardiovascular risk Standardized assessment of cardiovascular risk
factors factors Lp-PLALp-PLA22 by diaDexus PLAC by diaDexus PLAC ™ test (enzyme ™ test (enzyme
immunoassay); immunoassay); CRP by a high-sensitivity CRP by a high-sensitivity immunoradiometric assay (Hutchinson et al. Clin immunoradiometric assay (Hutchinson et al. Clin Chem 2000)Chem 2000)
Endpoint determination according to the MONICA Endpoint determination according to the MONICA protocol (fatal and non-fatal MI and SCD) protocol (fatal and non-fatal MI and SCD)
Koenig et al. (AHA 2003)Koenig et al. (AHA 2003)

Age-adjusted Baseline Characteristics of 934 Men, Age-adjusted Baseline Characteristics of 934 Men, Aged 45-64 Years Participating in the MONICA Aged 45-64 Years Participating in the MONICA Augsburg Survey 1984/85 With Follow-up 1998Augsburg Survey 1984/85 With Follow-up 1998
Characteristic Men with event Characteristic Men with event (n=97)(n=97) Men w/o event Men w/o event (n= 837)(n= 837) P-value P-value
BMI (kg/mBMI (kg/m22)) 27.627.6 27.6 27.6 n.s.n.s.
Total cholesterol (mg/dl)Total cholesterol (mg/dl) 259.6259.6 243.3 243.3 0.0010.001
HDL cholesterol (mg/dl)HDL cholesterol (mg/dl) 46.8 46.8 51.8 51.8 0.00370.0037
TC/HDL-RatioTC/HDL-Ratio§§ 5.665.66 4.834.83 < 0.0001< 0.0001
Systolic BP (mmHg)Systolic BP (mmHg) 139.0139.0 136.6136.6 n.s.n.s.
Diastolic BP (mmHg)Diastolic BP (mmHg) 84.984.9 84.5 84.5 n.s.n.s.
Regular smoker %Regular smoker % 53.953.9 28.028.0 <0.0001<0.0001
Physical activity %Physical activity % 25.725.7 35.635.6 0.050.05
Diabetes %Diabetes % 8.48.4 3.13.1 0.00960.0096
Education (<12 years) %Education (<12 years) % 74.274.2 73.773.7 n.s.n.s.
Lp-PLA Lp-PLA 2 2 (ng/ml)(ng/ml) 292.3 292.3 263.4263.4 0.00130.0013
C-reactive proteinC-reactive protein§ § (mg/L)(mg/L) 2.492.49 1.54 1.54 < 0.0001< 0.0001§§ geometric means calculated from the log-transformed distribution geometric means calculated from the log-transformed distribution
Koenig et al. (AHA 2003)Koenig et al. (AHA 2003)

Correlation Between Correlation Between Lp-PLALp-PLA22, CRP and , CRP and
Other Cardiovascular Risk Factors: MONICAOther Cardiovascular Risk Factors: MONICA
Risk factor Spearman correlation coefficient (P-value)Risk factor Spearman correlation coefficient (P-value)
Lp-PLALp-PLA22 CRP CRP
AgeAge 0.13 (<0.0001)0.13 (<0.0001) 0.15 (<0.0001)0.15 (<0.0001)
Total-CTotal-C 0.300.30 (<0.0001) (<0.0001) 0.07 (0.03)0.07 (0.03)
HDL-CHDL-C 0.11 (0.0006)0.11 (0.0006) -0.15 (<0.0001)-0.15 (<0.0001)
TC/HDL-CTC/HDL-C 0.07 (0.04)0.07 (0.04) 0.16 (<0.0001)0.16 (<0.0001)
Systolic BPSystolic BP 0.03 (0.40)0.03 (0.40) 0.11 (0.0013)0.11 (0.0013)
BMIBMI -0.04 (0.24)-0.04 (0.24) 0.21 (<0.0001)0.21 (<0.0001)
CRPCRP 0.07 (0.04)0.07 (0.04) 1.01.0
Koenig et al. (AHA 2003)Koenig et al. (AHA 2003)

MONICA: RR of CHD by a 1 SD Increase MONICA: RR of CHD by a 1 SD Increase in CRP or Lp-PLAin CRP or Lp-PLA2 2 (separate models)(separate models)
ModelModel RR (95% CI)RR (95% CI) P-valueP-value
CRP onlyCRP only
Unadjusted Unadjusted 1.57 (1.30-1.90)1.57 (1.30-1.90) 0.00010.0001
Adjusted for age, DM, smokingAdjusted for age, DM, smoking 1.32 (1.07-1.62)1.32 (1.07-1.62) 0.0080.008
Multivariable adjustment*Multivariable adjustment* 1.28 (1.03-1.60)1.28 (1.03-1.60) <0.03<0.03
Lp-PLALp-PLA22 only only
Unadjusted Unadjusted 1.37 (1.16-1.62)1.37 (1.16-1.62) 0.00020.0002
Adjusted for age, DM, smokingAdjusted for age, DM, smoking 1.26 (1.05-1.54)1.26 (1.05-1.54) 0.010.01
Multivariable adjustment*Multivariable adjustment* 1.23 (1.02-1.47)1.23 (1.02-1.47) 0.030.03
*Age, systolic BP, TC/HDL-ratio, physical activity, BMI, smoking, DM, alcohol *Age, systolic BP, TC/HDL-ratio, physical activity, BMI, smoking, DM, alcohol intake, educationintake, education
Koenig et al. (AHA 2003)Koenig et al. (AHA 2003)

MONICA: RR of CHD by a 1 SD Increase MONICA: RR of CHD by a 1 SD Increase in Lp-PLAin Lp-PLA22 or CRP (same model) or CRP (same model)
ModelModel RR (95% CI)RR (95% CI) P-valueP-value
Unadjusted Unadjusted CRP CRP Lp-PLALp-PLA22
1.55 (1.28-1.89)1.55 (1.28-1.89)1.35 (1.14-1.60)1.35 (1.14-1.60)
<0.0001<0.0001 0.0060.006
Adjusted for age, DM, smokingAdjusted for age, DM, smoking CRP CRP Lp-PLALp-PLA22
1.31 (1.07-1.62)1.31 (1.07-1.62)1.25 (1.04-1.50)1.25 (1.04-1.50)
0.010.01 <0.02<0.02
Multivariable adjustment* Multivariable adjustment* CRP CRP Lp-PLALp-PLA22
1.27 (1.01-1.59)1.27 (1.01-1.59)1.21 (1.01-1.45)1.21 (1.01-1.45)
0.040.04 0.040.04
*Age, systolic BP, TC/HDL-ratio, physical activity, BMI, smoking, DM, alcohol *Age, systolic BP, TC/HDL-ratio, physical activity, BMI, smoking, DM, alcohol intake, educationintake, education
Koenig et al. (AHA 2003)Koenig et al. (AHA 2003)
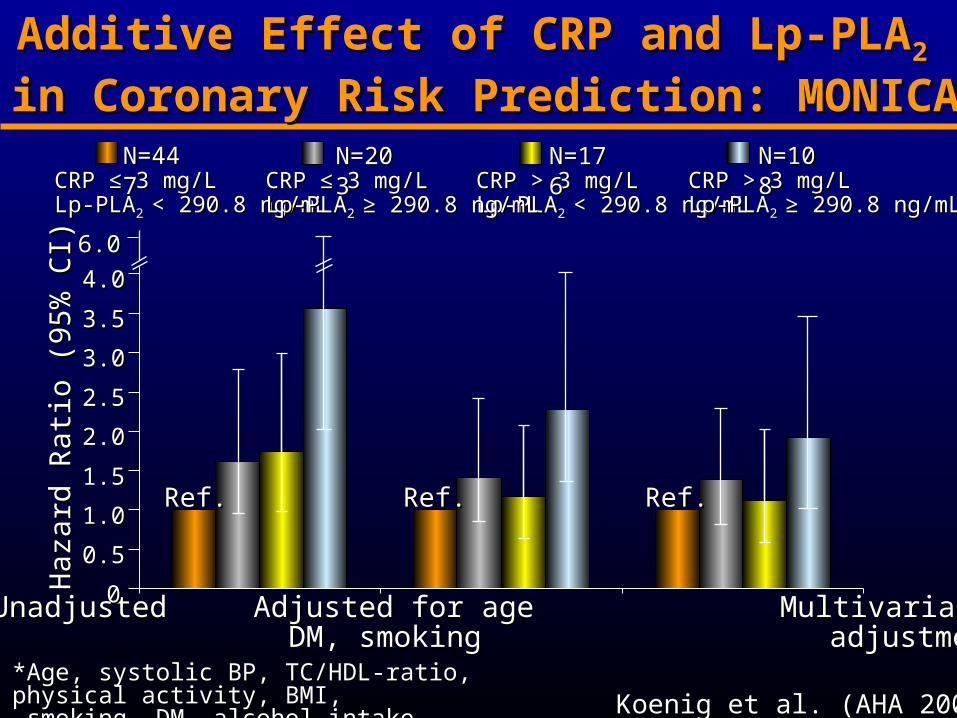
UnadjustedUnadjusted Adjusted for age Multivariable Adjusted for age Multivariable DM, smokingDM, smoking adjustment* adjustment*
*Age, systolic BP, TC/HDL-ratio, physical activity, BMI, *Age, systolic BP, TC/HDL-ratio, physical activity, BMI, smoking, DM, alcohol intake, educationsmoking, DM, alcohol intake, education
00
0.50.5
1.01.0
1.51.5
2.02.0
2.52.5
3.03.0
3.53.5
4.04.0
6.06.0
Ref.Ref. Ref.Ref. Ref.Ref.
CRP ≤ 3 mg/L CRP ≤ 3 mg/L Lp-PLALp-PLA2 2 < 290.8 ng/mL< 290.8 ng/mL
N=447N=447CRP > 3 mg/LCRP > 3 mg/LLp-PLALp-PLA2 2 < 290.8 ng/mL< 290.8 ng/mL
N=176N=176CRP ≤ 3 mg/LCRP ≤ 3 mg/LLp-PLALp-PLA2 2 ≥ 290.8 ng/mL≥ 290.8 ng/mL
N=203N=203CRP > 3 mg/LCRP > 3 mg/LLp-PLALp-PLA2 2 ≥ 290.8 ng/mL≥ 290.8 ng/mL
N=108N=108
Additive Effect of CRP and Lp-PLAAdditive Effect of CRP and Lp-PLA22
in Coronary Risk Prediction: MONICAin Coronary Risk Prediction: MONICA Ha
zard
Rat
io (9
5% C
I)Ha
zard
Rat
io (9
5% C
I)
Koenig et al. (AHA 2003)Koenig et al. (AHA 2003)

Summary and ConclusionsSummary and Conclusions
Lp-PLALp-PLA22 was the strongest predictor/biomarker of coronary was the strongest predictor/biomarker of coronary events, and was independent of traditional and emerging risk events, and was independent of traditional and emerging risk factors, including CRP in hyperlipidemic individuals factors, including CRP in hyperlipidemic individuals (WOSCOPS)(WOSCOPS)
In particular, in individuals with low LDL-C (<130 mg/dL), In particular, in individuals with low LDL-C (<130 mg/dL), levels of Lp-PLAlevels of Lp-PLA22 were independently were independently associated with incident associated with incident CHD in multivariable analysis including CRP CHD in multivariable analysis including CRP (ARIC)(ARIC)
Lp-PLALp-PLA22 was predictive of coronary events in a population- was predictive of coronary events in a population-based sample of initially healthy middle-aged men with based sample of initially healthy middle-aged men with moderately elevated total cholesterol levels during long-term moderately elevated total cholesterol levels during long-term FU of 14 years FU of 14 years (MONICA cohort)(MONICA cohort)
In addition to CRP, Lp-PLAIn addition to CRP, Lp-PLA22 appears to be a promising appears to be a promising marker of atherosclerotic complications and deserves further marker of atherosclerotic complications and deserves further studystudy

BreakBreak
Diagnosing Risk: CRP and Lp-PLADiagnosing Risk: CRP and Lp-PLA22

Case-Control Study: Case-Control Study: Population and Laboratory Methods Population and Laboratory Methods
Patients with Patients with clinicallyclinicallystable CAD stable CAD
aged 40-68 years aged 40-68 years (n=312)(n=312)
Age- and gender-Age- and gender-matched matched
voluntary blood voluntary blood donorsdonors(n=479)(n=479)
Lp-PLALp-PLA22 plasma levels - ELISA, plasma levels - ELISA, diaDexus Inc.diaDexus Inc.
Inflammatory markersInflammatory markers
Hemostatic markersHemostatic markers
Complete lipid profileComplete lipid profile
Khuseyinova et al. (unpublished data)Khuseyinova et al. (unpublished data)

CADCAD patients (n= patients (n=312) Controls (n=312) Controls (n=479479))
Age (yrs)Age (yrs) 57.7 57.7 7.4 7.4 55.855.87.27.2Male (%)Male (%) 85.685.6 74.974.9Family status married (%)Family status married (%) 85.985.9 83.983.9School education <10 yr (%)School education <10 yr (%) 69.269.2 58.558.5Daily alcohol consumption (%)Daily alcohol consumption (%) 29.529.5 28.528.5Smoked pack yearsSmoked pack years 20.320.3 10.810.8Current smokerCurrent smoker 9.69.6 14.214.2BMI (kg/mBMI (kg/m22)) 27.3 27.3 3.6 3.6 26.326.33.23.2History of high blood pressure (%)History of high blood pressure (%) 57.757.7 20.520.5History of diabetes (%)History of diabetes (%) 13.513.5 2.72.7History of hyperlipidemia (%)History of hyperlipidemia (%) 67.367.3 20.920.9
Lp-PLALp-PLA2 2 (ng/mL)*(ng/mL)* 296.1296.1122.5122.5 266.0266.0109.8109.8
C-reactive protein (mg/L)C-reactive protein (mg/L)†† 1.7 (0.7-3.8)1.7 (0.7-3.8) 1.2 (0.5-2.6)1.2 (0.5-2.6)
Demographic Characteristics of Patients with Demographic Characteristics of Patients with Coronary Artery Disease (CAD) and ControlsCoronary Artery Disease (CAD) and Controls
*mean *mean SD; SD; ††median and their interquartile ranges median and their interquartile ranges BMI = body mass indexBMI = body mass index Khuseyinova et al. (submitted)Khuseyinova et al. (submitted)

Distribution of Lipid Variables, Markers of Distribution of Lipid Variables, Markers of Coagulation, Fibrinolysis and Inflammation (I)Coagulation, Fibrinolysis and Inflammation (I)
CAD patients Controls P-value
Lp-PLA2 [ng/mL]* 296.1122.5 266.0109.8 <0.0001
Total cholesterol [mmol/L]* 5.051.06 5.270.85 0.0002
HDL cholesterol [mmol/L]* 1.090.27 1.330.34 0.0001
LDL cholesterol [mmol/L]* 3.100.75 3.190.79 0.11
Apolipoprotein A1 [mg/dL]* 12921.5 14523.0 0.0001
Apolipoprotein A2 [mg/dL]* 457.7 4915.6 0.0001
Apolipoprotein B [mg/dL]* 10727.5 10323.6 0.09
Apolipoprotein C2 [mg/dL]* 4.42.75 4.12.94 0.10
Apolipoprotein C3 [mg/dL]* 15.66.66 14.84.21 0.11
Apolipoprotein E [mg/dL]* 9.44.92 9.02.58 0.91
Lipoprotein (a) [mg/dL] † 14.8 (5.4-47.1) 9.7 (3.5-25.3) <0.0001
*mean *mean SD SD ††median and their interquartile ranges median and their interquartile ranges Khuseyinova et al. (submitted)Khuseyinova et al. (submitted)

CAD patients Controls P-value
Leukocytes [103/µL]* 6.91.81 5.81.53 0.0001C-reactive protein [mg/L]† 1.7 (0.7-3.8) 1.2 (0.5-2.6) 0.0001Serum amyloid A [mg/L]† 3.1 (1.9-4.9) 2.6 (1.7-4.1) 0.002Interleukin-6 [pg/mL]† 2.20 (1.53-3.95) 1.34 (0.92-2.04) 0.0001
TNF-α [pg/mL]† 256 (202-359) 184 (130-262) 0.0001sICAM-1 [ng/mL]* 518166 488141 0.009Fibrinogen [g/L]* 2.820.63 2.520.61 0.0001Plasma viscosity [m Pa•s]* 1.220.07 1.190.05 0.0001Plasminogen [%]* 113.617.4 114.116.8 0.43PAI-1 activity [U/mL]† 11.8 (7.4-19.3) 8.2 (4.1-13.7) 0.0001D-Dimers [ng/mL]† 11.2 (0-28.9) 2.8 (0-15.1) <0.001Von Willebrand factor [activity %]† 144 (110-181) 134 (99-162) 0.0001sCD14 [µg/mL]† 4.07 (3.36-4.81) 4.06 (3.38-4.84) 0.51
*mean *mean SD SD ††median and their interquartile ranges median and their interquartile ranges Khuseyinova et al. (submitted)Khuseyinova et al. (submitted)
Distribution of Lipid Variables, Markers of Distribution of Lipid Variables, Markers of Coagulation, Fibrinolysis and Inflammation (II)Coagulation, Fibrinolysis and Inflammation (II)

VariablesVariables CasesCases P-valueP-value ControlsControls P-valueP-value
AgeAge -0.002-0.002 0.960.96 0.170.17 0.00010.0001TC TC 0.290.29 <0.0001<0.0001 0.100.10 0.030.03HDL-CHDL-C -0.15-0.15 0.0080.008 -0.05-0.05 0.240.24LDL-CLDL-C 0.330.33 <0.0001<0.0001 0.140.14 0.0020.002Apo BApo B 0.270.27 <0.0001<0.0001 0.100.10 0.030.03CRP (log)CRP (log) 0.130.13 0.020.02 0.050.05 0.310.31ICAM-1 ICAM-1 0.150.15 0.0090.009 0.0450.045 0.330.33Plasma viscosityPlasma viscosity 0.140.14 0.010.01 0.060.06 0.200.20D-Dimer (log)D-Dimer (log) 0.110.11 0.050.05 -0.07-0.07 0.110.11vWF vWF 0.080.08 0.120.12 0.180.18 <0.0001<0.0001PlasminogenPlasminogen -0.11-0.11 0.040.04 -0.04-0.04 0.350.35
Spearman Rank Correlation Coefficients Between Spearman Rank Correlation Coefficients Between Traditional Risk Factors, Lipid Variables, Systemic Traditional Risk Factors, Lipid Variables, Systemic
Inflammatory and Hemostatic Markers, and Lp-PLAInflammatory and Hemostatic Markers, and Lp-PLA22
No significant effect for No significant effect for BMI, smoking, lBMI, smoking, leukocytes, feukocytes, fibrinogen, ibrinogen, IL-6, IL-6, TNF-TNF-, , PAI-1 activity, sCD14, Apo A1, Apo A2, Apo C2, Apo C3, Apo E PAI-1 activity, sCD14, Apo A1, Apo A2, Apo C2, Apo C3, Apo E
Khuseyinova et al. (submitted)Khuseyinova et al. (submitted)

Odds Ratios (OR) of CAD Associated With Odds Ratios (OR) of CAD Associated With Lp-PLALp-PLA22 Levels After Various Adjustments Levels After Various Adjustments
Lp-PLALp-PLA22 Distr Distribution (ng/mL)ibution (ng/mL)
Q1 Q1 Q2Q2 ((188.2) (>188.2-249.2 ) 188.2) (>188.2-249.2 )
Q3Q3(>249.2-323.5 )(>249.2-323.5 )
Q4Q4(>323.5 )(>323.5 )
Model 1* ORModel 1* OR (95 % CI) (95 % CI) 11RefRef 0.98 0.98 (0.63-1.52)(0.63-1.52) 1.23 1.23 (0.80-1.88)(0.80-1.88) 1.61 1.61 (1.07-2.44)(1.07-2.44)
Model 2Model 2†† OR OR (95 % CI) (95 % CI) 11RefRef 0.91 0.91 (0.54-1.52)(0.54-1.52) 1.36 1.36 (0.84-2.21)(0.84-2.21) 1.72 1.72 (1.07-2.76)(1.07-2.76)
Model 3Model 3‡‡ OR OR (95 % CI) (95 % CI) 11RefRef 0.93 0.93 (0.55-1.56)(0.55-1.56) 1.40 1.40 (0.85-2.29)(0.85-2.29) 1.84 1.84 (1.12-2.99)(1.12-2.99)
Model 4Model 4§§ OR OR (95 % CI) (95 % CI) 11RefRef 1.03 1.03 (0.58-1.83)(0.58-1.83) 1.74 1.74 (1.01-3.01)(1.01-3.01) 2.04 2.04 (1.19-3.48)(1.19-3.48)
Model 5Model 5¶¶ OR OR (95 % CI) (95 % CI) 11RefRef 0.98 0.98 (0.55-1.76)(0.55-1.76) 1.65 1.65 (0.94-2.91)(0.94-2.91) 1.84 1.84 (1.05-3.12)(1.05-3.12)
* * Adjustment for age and gender (matching variables) Adjustment for age and gender (matching variables) † † Adjustment for matching variables and for BMI, smoking status, alcohol intake, school education years, Adjustment for matching variables and for BMI, smoking status, alcohol intake, school education years, hypertension, diabeteshypertension, diabetes‡ ‡ Model 2 and additional adjustment for TC and HDL cholesterol Model 2 and additional adjustment for TC and HDL cholesterol § Model 3 and additional adjustment for statin intake§ Model 3 and additional adjustment for statin intake¶ Additionally adjusted for CRP, fibrinogen, vWF, sICAM-1, plasma viscosity, plasminogen, D-Dimer¶ Additionally adjusted for CRP, fibrinogen, vWF, sICAM-1, plasma viscosity, plasminogen, D-DimerQ = quartileQ = quartile Khuseyinova et al. (submitted)Khuseyinova et al. (submitted)

Atherogenic Activities of Lyso-PCAtherogenic Activities of Lyso-PC
Endothelial cells
Promotes endothelial dysfunction, upregulates adhesion molecules
Monocytes
Chemoattractant, stimulates cytokine production
Macrophages
Stimulates proliferation, inhibits migration, cytotoxic
T-lymphocytes
Chemoattractant, upregulates cytokine & CD40 ligand expression
Smooth muscle cells
Cytotoxic, upregulates growth factor expression