WJEC Eduqas GCSE in GEOGRAPHY B · settlement (or shanty town) in the city of Jakarta. Jakarta is a...
129
WJEC Eduqas GCSE in GEOGRAPHY B Teaching from 2016 ACCREDITED BY OFQUAL GCSE SAMPLE ASSESSMENT MATERIALS This Ofqual regulated qualification is not available for candidates in maintained schools and colleges in Wales.
Transcript of WJEC Eduqas GCSE in GEOGRAPHY B · settlement (or shanty town) in the city of Jakarta. Jakarta is a...

WJEC Eduqas GCSE in
GEOGRAPHY B
Teaching from 2016
ACCREDITED BY OFQUAL
GCSE
SAMPLE ASSESSMENTMATERIALS
This Ofqual regulated qualification is not available forcandidates in maintained schools and colleges in Wales.

GCSE GEOGRAPHY B Sample Assessment Materials 1
© WJEC CBAC Ltd.
For teaching from 2016 For award from 2018 GCSE (9-1) GEOGRAPHY B SAMPLE ASSESSMENT MATERIALS


GCSE GEOGRAPHY B Sample Assessment Materials 3
© WJEC CBAC Ltd.
Contents
Page COMPONENT 1 – Investigating Geographical Issues Question Paper 5 Marking Scheme 27 COMPONENT 2 – Problem Solving Geography Question Paper 45 Resource Folder 61 Marking Scheme 68 COMPONENT 3 – Applied Fieldwork Enquiry Question Paper 85 Resource Folder 103 Marking Scheme 115


GCSE GEOGRAPHY B Sample Assessment Materials 5
© WJEC CBAC Ltd.
GCSE GEOGRAPHY B COMPONENT 1 INVESTIGATING GEOGRAPHICAL ISSUES SAMPLE ASSESSMENT MATERIALS 1 hour 45 minutes
ADDITIONAL MATERIALS In addition to this paper you will require a calculator and a ruler. INSTRUCTIONS TO CANDIDATES Answer all of the questions in this examination paper. Use black ink or black ball-point pen. Write your name, centre number and candidate number in the spaces at the top of this page. Write your answers in the spaces provided in this booklet. If additional space is required you should use the lined pages at the end of this booklet. The question number(s) should be clearly shown. INFORMATION FOR CANDIDATES The number of marks is given in brackets [ ] at the end of each question or part-question. You are reminded that assessment will take into account your ability to spell, punctuate and use grammar and specialist terms accurately in your answer to question 1(c) (iii).
For examiner’s use only SPaG
Q.1
32
4
Q.2
32
0
Q.3
32
0
Total Marks
96
4

GCSE GEOGRAPHY B Sample Assessment Materials 6
© WJEC CBAC Ltd.
Theme 1: Changing Places – Changing Economics
Answer all questions 1. (a) Markets are one example of a geographical feature of many UK towns and
city centres.
Photograph 1.1 Norwich central market
(i) Tick () two other geographical features of central business districts
(CBDs) in the table below. [2]
Tick ()
Large covered shopping centres
Large free surface car parks
Detached houses with gardens
Restaurants, theatres and cinemas
(ii) Many CBDs have pedestrianised areas. Describe the features of
pedestriansed areas. [2]

GCSE GEOGRAPHY B Sample Assessment Materials 7
© WJEC CBAC Ltd.
(b) The O.S. map extract below shows the location of a proposed retail park on the edge of Whitby.
Map 1.2 O.S. map extract at a scale of 1:25,000
(i) Use map evidence to complete the blank spaces below: [3]
The name of the road at the northern edge of the proposed retail park.
____________________
The direction of the proposed retail park from Whitby West Pier.
____________________
The distance in a direct line from the centre of the proposed
retail park to the post office in Ruswarp (grid square 8809).
____________________ kms.

GCSE GEOGRAPHY B Sample Assessment Materials 8
© WJEC CBAC Ltd.
(ii) Many large retail outlets prefer to locate new stores away from CBDs. They choose retail parks located on the edge of towns and cities.
List two problems that retail outlets have in the CBD and list two attractions (for retailers) of retail parks located on the edge of towns and cities. Do not list opposites. [4]
Problems in the CBD:
1
2 Attractions of retail parks:
1 2 (iii) Companies always need to know the threshold population of a store.
Give one reason why this is important. [2]
(iv) The movement of retail stores from town centre locations to out of town
retail parks has had a significant impact on towns and cities and on the different groups of people who use them.
Discuss the impact of changing retail location on both people and the urban environment. [6]

GCSE GEOGRAPHY B Sample Assessment Materials 9
© WJEC CBAC Ltd.
(c) Study Map 1.3 below. It shows the location of Jembatan Besi, an informal
settlement (or shanty town) in the city of Jakarta. Jakarta is a global city and the capital of Indonesia, a Newly Industrialised Country (NIC). The city is growing at a rapid rate.
Map 1.3 Jakarta
(i) Describe the location of Jembatan Besi within Jakarta. [1]

GCSE GEOGRAPHY B Sample Assessment Materials 10
© WJEC CBAC Ltd.
Study Figure 1.4 below. These proportional pie charts show information about the changing population of Jembatan Besi from 1975 through to 2015.
Figure 1.4
(ii) Compare the population in 1975 to that in 2015. Use the scale and the key to support your answer. [4]
Scale for the proportional circles

GCSE GEOGRAPHY B Sample Assessment Materials 11
© WJEC CBAC Ltd.
Study Photograph 1.5 and Table 1.6 below. They provide more information about the
informal settlement of Jembatan Besi.
Photograph 1.5 Typical housing in Jembatan Besi
Table 1.6 Access to services within the informal settlement of Jembatan Besi 1975 2015
% of residents with access to safe drinking water through stand pipes 1 10
% of residents with access to legal electricity supplies 10 50
% of residents with access to the main city sewer network 0 0
% of residents with access to formal city waste collection services 0 30
(iii) Make use of map 1.3, figure 1.4, photograph 1.5 and table 1.6 to decide
whether you agree with the following statement: ‘The challenges faced in the informal settlement of Jembatan Besi are the same as those found in every global city’. Give reasons to support why you agree or disagree with the statement. [8 + 4]
Marks for spelling, punctuation and the accurate use of grammar and
specialist terminology are allocated to this question.

GCSE GEOGRAPHY B Sample Assessment Materials 12
© WJEC CBAC Ltd.
End of Question 1

GCSE GEOGRAPHY B Sample Assessment Materials 13
© WJEC CBAC Ltd.
Theme 2: Changing Environments
Answer all questions 2. (a) Study the diagram below which shows the greenhouse effect.
Diagram 2.1
(i) Describe how the greenhouse effect works by adding letters from the
box to label diagram 2.1 above. Two have been done for you. [4]
A
Radiation from the sun passes into the atmosphere.
D
Some of the sun’s radiation is absorbed by the greenhouse gases in the Earth’s atmosphere. This warms the Earth.
B
Some of the sun’s radiation is reflected from the Earth’s surface into the atmosphere.
E
Some of the sun’s radiation is reflected back into space.
C
Some of the sun’s radiation passes through the Earth’s atmosphere back into space. F
Human activities have increased the amount of greenhouse gases in the Earth’s atmosphere, for example, burning fossil fuels in power stations.

GCSE GEOGRAPHY B Sample Assessment Materials 14
© WJEC CBAC Ltd.
(ii) Name two greenhouse gases. [2] 1.________________________________ 2.________________________________ (iii) Coal-fired power stations are one source of greenhouse gases. Give
two other human activities which are a source of greenhouse gases. [2]

GCSE GEOGRAPHY B Sample Assessment Materials 15
© WJEC CBAC Ltd.
(b) Study the graph below.
Describe the changes in average global land surface temperatures since 1850. Use figures from graph 2.2 in your answer. [3]

GCSE GEOGRAPHY B Sample Assessment Materials 16
© WJEC CBAC Ltd.
(c) Study the map and the table below. The Environment Agency has estimated the impact of a 2 metre rise in sea level across the UK.
Map 2.3 Table 2.4
(i) Describe the pattern of coastal areas at risk from a 2 metre rise in sea level.
Use map 2.3 only in your answer. [2] (ii) Select one appropriate style of graph to represent the data shown in
table 2.4. [1] Tick () one style of graph from the list below.
Tick ()
One scatter graph showing a line of best fit
A series of block graphs, one for each location in table 2.4
A series of pie charts, one for each location in table 2.4

GCSE GEOGRAPHY B Sample Assessment Materials 17
© WJEC CBAC Ltd.
(iii) Give one reason why the graph style you selected is appropriate to represent the data in table 2.4. [2]
(iv) Give one reason why it is difficult for individuals to reduce the threat of
climate change in the UK. [2]
(v) Explain why government in the UK may wish to reduce the threat of
climate change. [6]

GCSE GEOGRAPHY B Sample Assessment Materials 18
© WJEC CBAC Ltd.
(d) People have different views on the issue of climate change. Read the comments below and answer the question that follows.
A farmer in Bangladesh
An Indian business executive
A UK 'Green' politician
Make use of these comments to decide whether you agree with the following
statement. "The need to create economic growth in NICs such as India far outweighs any
concerns about climate change." Explain your reasons. [8]

GCSE GEOGRAPHY B Sample Assessment Materials 19
© WJEC CBAC Ltd.
End of Question 2

GCSE GEOGRAPHY B Sample Assessment Materials 20
© WJEC CBAC Ltd.
Theme 3: Environmental Challenges
Answer all questions
3. (a) Study the maps and the photograph below. They show information about The Wildfowl & Wetlands Trust (WWT). This organisation conserves small scale wetland ecosystems throughout the UK.

GCSE GEOGRAPHY B Sample Assessment Materials 21
© WJEC CBAC Ltd.
(i) Describe the location of the Martin Mere wetland ecosystem. Use map 3.1 or map 3.2 in your answer. [2] (ii) Complete the table below by giving the correct four figure and six
figure grid references. Use map 3.2. [2]
Grid reference
The four figure grid reference for the village of Rufford.
__ __ __ __
The six figure grid reference for Martin Mere visitor centre.
__ __ __ __ __ __
(iii) Describe the relief of the land shown in map 3.2 and photograph 3.3. [2]

GCSE GEOGRAPHY B Sample Assessment Materials 22
© WJEC CBAC Ltd.
(b) The world map below shows the location of two major biomes across the world.
Map 3.4
(i) Tick () the correct definition of a biome from the three available in
the table. [1]
Tick ()
A biome is a large area named after the dominant type of vegetation found at sea level.
A biome is a unique region where different climates can be found from north to south across the globe.
A biome is a global land area that is characterised by the plants, animals and climate in that area.
(ii) Describe the distribution of the Tropical Rainforest biome. Use map 3.4. [2] ................................................................................................................ ................................................................................................................ ................................................................................................................ ................................................................................................................

GCSE GEOGRAPHY B Sample Assessment Materials 23
© WJEC CBAC Ltd.
(c) The diagram below shows the links which exist in all ecosystems.
Diagram 3.5
(i) Name an ecosystem you have studied. Complete the table below,
giving the names of specific plants or animals found in your chosen ecosystem.
[4] Name of your chosen ecosystem ………………………………….
Plants / animals found in the ecosystem you have named above.
One tertiary consumer
One secondary consumer
One primary consumer
One producer
(ii) Describe three characteristics of the climate for the ecosystem you
have named above. [3]

GCSE GEOGRAPHY B Sample Assessment Materials 24
© WJEC CBAC Ltd.
(d) Study the diagram below. The line A – B shows a cross-section across three biomes in Africa.
Diagram 3.6
Describe how the changes in the vegetation from A to B in diagram 3.6 are
influenced by climate. [2] (e) (i) Explain why human activities lead to damage of ecosystems. [6]

GCSE GEOGRAPHY B Sample Assessment Materials 25
© WJEC CBAC Ltd.
(ii) Name one ecosystem which is being managed for a sustainable
future. Predict how successful the management scheme is likely to be in creating a sustainable future for the ecosystem. Justify your reasoning. [8]
Name of ecosystem

GCSE GEOGRAPHY B Sample Assessment Materials 26
© WJEC CBAC Ltd.
End of question 3
END OF PAPER

GCSE GEOGRAPHY B Sample Assessment Materials 27
© WJEC CBAC Ltd.
This box contains the rationale i.e. it explains the principles that must be applied when marking each sub-question. The examiner must apply this rationale when applying the marking scheme to the response.
COMPONENT 1 – MARK SCHEME
Instructions for examiners of GCSE Geography when applying the marking scheme 1 Positive marking It should be remembered that learners are writing under examination conditions and credit should be given for what the learner writes, rather than adopting the approach of penalising him/her for any omissions. It should be possible for a very good response to achieve full marks and a very poor one to achieve zero marks. Marks should not be deducted for a less than perfect answer if it satisfies the criteria of the mark scheme. GCSE Geography marking schemes are presented in a common format as shown below:
2 Tick marking Low tariff questions should be marked using a points-based system. Each credit worthy response should be ticked in red pen. The number of ticks must equal the mark awarded for the sub-question. The mark scheme should be applied precisely using the expected outcomes box as a guide to the responses that are acceptable. Do not use crosses to indicate answers that are incorrect. If the candidate has not attempted the question then the examiner should strike through the available dotted lines with a diagonal line.
3 (a) (i) Describe the location of the island of Lefkada.
AO
1
AO
2.1
AO
2.2
AO
3
AO
4
To
tal
Credit two simple statements based on map evidence.
Credit accurate use of compass points max 1
Credit accurate use of scale line max 1
In western Greece (1) In Ionian Sea (1) north of Cephalonia (1) 275km (+/-10) from Athens (1) 280km (+/-10) from Thessaloniki (1)
2 2
This box contains the sub-question
The columns to the right indicate the assessment objective(s) targeted by the question and its mark tariff.
This box contains the candidates' expected responses for point-based marking. For some sub-questions, those with a closed question, this box will indicate the only response that is acceptable. For more open ended sub-questions this box will illustrate a number of likely responses that are credit worthy. It may be that this list will be extended at the examiner's conference after actual scripts have been read. For banded mark schemes this box contains indicative content. For further details see below under Banded mark schemes Stage 2.

GCSE GEOGRAPHY B Sample Assessment Materials 28
© WJEC CBAC Ltd.
3 Banded mark schemes Banded mark schemes are divided so that each band has a relevant descriptor. The descriptor for the band provides a description of the performance level for that band. Each band contains marks. Examiners should first read and annotate a learner’s answer to pick out the evidence that is being assessed in that question. Do not use ticks on the candidate’s response. Once the annotation is complete, the mark scheme can be applied. This is done as a two stage process. Stage 1 – Deciding on the band When deciding on a band, the answer should be viewed holistically. Beginning at the lowest band, examiners should look at the learner’s answer and check whether it matches the descriptor for that band. Examiners should look at the descriptor for that band and see if it matches the qualities shown in the learner’s answer. If the descriptor at the lowest band is satisfied, examiners should move up to the next band and repeat this process for each band until the descriptor matches the answer. If an answer covers different aspects of different bands within the mark scheme, a ‘best fit’ approach should be adopted to decide on the band and then the learner’s response should be used to decide on the mark within the band. For instance if a response is mainly in band 2 but with a limited amount of band 3 content, the answer would be placed in band 2, but the mark awarded would be close to the top of band 2 as a result of the band 3 content. Examiners should not seek to mark candidates down as a result of small omissions in minor areas of an answer. Stage 2 – Deciding on the mark Once the band has been decided, examiners can then assign a mark. During standardising (marking conference), detailed advice from the Principal Examiner on the qualities of each mark band will be given. Examiners will then receive examples of answers in each mark band that have been awarded a mark by the Principal Examiner. Examiners should mark the examples and compare their marks with those of the Principal Examiner. When marking, examiners can use these examples to decide whether a learner’s response is of a superior, inferior or comparable standard to the example. Examiners are reminded of the need to revisit the answer as they apply the mark scheme in order to confirm that the band and the mark allocated is appropriate to the response provided. Indicative content is also provided for banded mark schemes. Indicative content is not exhaustive, and any other valid points must be credited. In order to reach the highest bands of the mark scheme a learner need not cover all of the points mentioned in the indicative content but must meet the requirements of the highest mark band. Where a response is not creditworthy, that is contains nothing of any significance to the mark scheme, or where no response has been provided, no marks should be awarded.

GCSE GEOGRAPHY B Sample Assessment Materials 29
© WJEC CBAC Ltd.
Theme 1, Question 1
1 (a) Markets are one example of a geographical feature of many UK towns and city centres. (i) Tick () two other geographical features of central business districts (CBDs) in the table below.
AO
1
AO
2.1
AO
2.2
AO
3
AO
4
To
tal
Credit these responses only. If three ticks are given with two of the ticks being correct, award one mark. If 4 ticks are given award zero marks.
Large covered shopping centres (1) Restaurants, theatres and cinemas (1)
2 2
(ii) Many CBDs have pedestrianised areas. Describe the features of pedestrianised areas.
AO
1
AO
2.1
AO
2.2
AO
3
AO
4
To
tal
Credit up to two valid statements each with one mark.
No vehicles are allowed (1) except delivery vehicles / except during defined delivery times (1) Seating provided (1) Landscaping such as flower beds (1) Paving not roads (1)
2 2
(b) The O.S. map extract shows the location of a proposed new retail park on the edge of Whitby. (i) Use map evidence to complete the blank spaces below: A
O1
AO
2.1
AO
2.2
AO
3
AO
4
To
tal
Credit these responses only for the
first and second blank spaces.
Credit this response, within given
tolerance, for the third blank space.
B1460 (1)
south-west (1)
1.3kms-1.5kms (1)
3 3

GCSE GEOGRAPHY B Sample Assessment Materials 30
© WJEC CBAC Ltd.
(ii) Many large retail outlets prefer to locate new stores away from CBDs. They choose retail parks located on the edge of towns and cities. List two problems that retail outlets have in the CBD and list two attractions (for retailers) of retail parks located on the edge of towns and cities. Do not list opposites.
AO
1
AO
2.1
AO
2.2
AO
3
AO
4
To
tal
Credit up to four valid statements each with one mark (to max 4). Do not credit opposites
Problems in the CBD:
Insufficient / expensive parking (1)
Insufficient space/no room for expansion (1)
High rents (1)
Supply lorries find access difficult (1)
Attractions of retail parks:
Room for large parks (1)
Room to expand (1)
Lower rents (1)
Easy access from main roads/ring roads (1)
New build allows appropriate design for
modern shops (1)
4 4
(iii) Companies always need to know the threshold population of a store. Give one reason why this is important.
AO
1
AO
2.1
AO
2.2
AO
3
AO
4
To
tal
Credit responses that demonstrate understanding that all stores must have a sufficient number of potential customers to make the store profitable. Credit up to two valid statements each with one mark.
They need enough customers (1) to make money/ profit (1)
2 2

GCSE GEOGRAPHY B Sample Assessment Materials 31
© WJEC CBAC Ltd.
(iv) The movement of retail stores from town centre locations to out of town retail parks has had a significant impact on towns and cities and on the different groups of people who use them.
Discuss the impact of changing retail location on both people and the urban environment.
AO
1
AO
2.1
AO
2.2
AO
3
AO
4
To
tal
Use the banded mark scheme. This question assesses AO2.2, the inter-relationship between the process of retail change and retail environment.
Band Mark Descriptor
3 5-6
A sophisticated level of understanding is shown through well-developed observations relating to both positive and negative impact on people and the urban environment.
2 3-4
Understanding is shown through a developed response where discussion is focused on a positive or negative impact on the people and the urban environment.
1 1-2 A basic understanding of impact on people and/or the urban environment.
0 Award 0 marks if the answer is incorrect or wholly irrelevant.
Responses may incorporate both positive and negative impacts of change on people/the urban environment. Responses may include references to the changes in the urban environment: - traffic flow, exploring positives and negatives at different locations - land-use (e.g. the relative impacts of using Greenfield / Brownfield sites) - city centres such as the spiral of decline for retailing in some city centres. - trade areas for towns / attracting inward investment. Responses may include references to the changes for specific groups / stakeholders or individuals. The effects of change may be related to: - age (social contacts / community issues) - mobility (access issues) - living in specific locations (noise / traffic - convenience) - those affected by employment outcomes (gains and losses). - existing shop owners in the vicinity (gains and losses)
6 6

GCSE GEOGRAPHY B Sample Assessment Materials 32
© WJEC CBAC Ltd.
(c) (i) Describe the location of Jembatan Besi within Jakarta.
AO
1
AO
2.1
AO
2.2
AO
3
AO
4
To
tal
Credit one valid statement with one mark.
Do not credit ‘near to the CBD’.
Do not credit ‘in Indonesia’.
No half marks.
North-west of the CBD (1)
In the northern part of the city (1)
Adjacent to a waterway (1)
Adjacent to a main road (1)
1 1
(c) (ii) Compare the population in 1975 to that in 2015. Use the scale and the key to support your answer.
AO
1
AO
2.1
AO
2.2
AO
3
AO
4
To
tal
4
4
Use a banded mark scheme. Work upwards from the lowest band.
Band Mark Band descriptor
2 3 - 4
Elaborated statements
accurately use figures from the
pie charts to make direct
comparisons. Meaning is
unambiguous. The response
has purpose, is organised and
well structured.
1 1 – 2
Valid statements describe
changes. Meaning is clear.
Statements are linked by a
basic structure.
0
Award 0 marks if the answer is
incorrect or wholly irrelevant.
This question targets two elements of AO4: the use of techniques and the ability to communicate findings.
Expected comparative statements:
The population has doubled.
The proportion of residents born in the city has increased (or) the proportion of the residents from rural areas has decreased.
Accurate figures for the population size ascertained using the scale and key:
Population 1975 was 2000 (+/-100)
Population 2015 was 4000 (+/-100)
Accurate figures for the origin of dwellers:
1975: 1000 from rural areas
1000 born within Jakarta
2015: 1000 born in rural areas.
3000 born within Jakarta.

GCSE GEOGRAPHY B Sample Assessment Materials 33
© WJEC CBAC Ltd.
(c) (iii) Make use of map 1.3, figure 1.4, photograph 1.5 and table 1.6 to decide whether you agree with the following statement: ‘The challenges faced in the informal settlement of Jembatan Besi are the same as those found in every global city’. Give reasons to support why you agree or disagree with the statement.
AO
1
AO
2.1
AO
2.2
AO
3
AO
4
SP
aG
To
tal
Marks for spelling, punctuation and the accurate use of grammar are allocated to this question.
8 4 12
Use a banded mark scheme. Work upwards from the lowest band.
Band Mark Descriptor
4 7-8 Exceptional application of knowledge and understanding:
Comprehensive chains of reasoning provide sophisticated analysis
Balanced and coherent appraisal draws together wider geographical understanding to justify decision(s).
3 5-6 Thorough application of knowledge and understanding:
Chains of reasoning provide elaborated analysis
Balanced appraisal draws together wider geographical understanding to support decision(s).
2 3-4 Sound application of knowledge and understanding:
Some connections provide valid but limited analysis
Limited appraisal uses wider geographical understanding to support decision(s).
1 1-2 Some basic application of knowledge and understanding:
Basic levels of meaning ascribed to the information/issue
Limited and weak appraisal uses some wider geographical understanding to support decision(s).
0 Award zero marks if the answer is incorrect or wholly irrelevant.
With reference to the target elements (a, b, c and d) of AO3, responses will apply knowledge and understanding by: a) ascribing meaning to information in section c of question 1 (the maps, population data, the photograph and the table of data. b) analysing information in relation to expected norms / patterns found in informal settlements. c) evaluating the degree to which Jembatan is typical / atypical. d) making a judgement about the statement, which is supported by a rationale. Responses will make connections between the novel context (of this particular informal settlement) to other global cities (which could be NIC or HIC). Where the candidates looks to support the notion that Jembatan faces the same challenges as other global cities. Attention will be drawn to (for example): relatively poor sanitation; absence of waste disposal; inadequate building materials; unplanned development; and poor infrastructure. Where the candidates looks to support the notion that Jembatan faces different challenges to other global cities. Attention will be drawn to (for example): the relative levels of poverty experienced in HICs compared to NICs; demographic differences (origin / longevity within the settlement). Reward appraisal which identifies unknowns in terms a balanced appraisal - based on the information provided (e.g. no info on transport issues, so appraisal is compromised). Reward chains of reasoning that identify similarities and differences when analysing typicality.

GCSE GEOGRAPHY B Sample Assessment Materials 34
© WJEC CBAC Ltd.
After awarding a level and mark for the geographical response, apply the performance
descriptors for spelling, punctuation and the accurate use of grammar (SPaG) and specialist
terms that follow.
Band Marks Performance descriptions
High 4 Learners spell and punctuate with consistent accuracy
Learners use rules of grammar with effective control of meaning overall
Learners use a wide range of specialist terms as appropriate
Intermediate
2 - 3 Learners spell and punctuate with considerable accuracy
Learners use rules of grammar with general control of meaning overall
Learners use a good range of specialist terms as appropriate
Threshold
1 Learners spell and punctuate with reasonable accuracy
Learners use rules of grammar with some control of meaning and any errors do not significantly hinder meaning overall
Learners use a limited range of specialist terms as appropriate
0 The learner writes nothing
The learner’s response does not relate to the question
The learner’s achievement in SPaG does not reach the
threshold performance level, for example errors in spelling,
punctuation and grammar severely hinder meaning
End of Question 1

GCSE GEOGRAPHY B Sample Assessment Materials 35
© WJEC CBAC Ltd.
Theme 2, Question 2
(a) Study the diagram below which shows the greenhouse effect.
(i) Describe how the greenhouse effect works by adding letters from the box to label diagram 2.1 above. Two have been done for you. A
O1
AO
2.1
AO
2.2
AO
3
AO
4
To
tal
Credit these responses only.
Do not credit if the same letter is used more than once.
From left to right:
B (1)
C (1)
D (1)
F (1)
4 4
(ii) Name two greenhouse gases.
AO
1
AO
2.1
AO
2.2
AO
3
AO
4
To
tal
Credit up to two valid names each with one mark.
Carbon dioxide (1) Carbon monoxide (1) Methane (1)
Nitrous oxide (1) Chlorofluorocarbons /CFCs (1)
Hydro-fluorocarbons / HFCs (1) Perfluorocarbons / PF’s (1)
2 2
(iii) Coal-fired power stations are one source of greenhouse gases. Give two other human activities which are a source of greenhouse gases.
AO
1
AO
2.1
AO
2.2
AO
3
AO
4
To
tal
Credit up to two valid statements each with one mark.
Car and aircraft emissions (1) Landfill sites (1)
Farming livestock (1)
2 2
(b) Study the graph below.
Describe the changes in average global land surface temperature since 1850. Use figures from graph 2.2 in your answer. A
O1
AO
2.1
AO
2.2
AO
3
AO
4
To
tal
The key elements are
use of the graph to
communicate findings.
Reserve one mark for
overall trend.
Credit valid description
of changes over shorter
periods or accurate
quantification or
qualification, each for
one mark to max 2
marks.
overall trend: fluctuates / overall increase (1)
changes over shorter periods / accurate
quantification or qualification: below
average until 1980 (1) or above average since
1980 (1) overall increase from -0.4 in 1850 to
+0.5 in 2010 (1) lowest figure -0.5 in 1910 (1)
highest figure +0.5 in 2005-10 (1) steep rise after
1970 (1) Steep rise between 1910 and 1940 (1)
3 3

GCSE GEOGRAPHY B Sample Assessment Materials 36
© WJEC CBAC Ltd.
(c) Study the map and the table below. The Environment Agency has estimated the impact of a 2 metre rise in sea level across the UK. (i) Describe the pattern of coastal areas at risk from a 2 metre rise in sea level. Use map 2.3 only in your answer.
AO
1
AO
2.1
AO
2.2
AO
3
AO
4
To
tal
Credit up to two valid statements each with one mark.
Credit information taken from the map only.
Credit statements about the pattern revealed.
Do not credit “all the areas threatened are on the coast”.
Nearly all areas of the UK are at risk (1) east coast is more vulnerable (1) much of the west coast of Scotland / N Ireland is not at risk (1)
2 2
(ii) Select one appropriate style of graph to represent the data shown in Table 2.4.
AO
1
AO
2.1
AO
2.2
AO
3
AO
4
To
tal
Credit this response only. A series of block graphs, one for each location in Table 2.4.
1 1
(iii) Give one reason why the graph style you selected is appropriate to represent the data in Table 2.4.
AO
1
AO
2.1
AO
2.2
AO
3
AO
4
To
tal
Credit one valid statement (for 1 mark) and a valid explanation/reason for the second mark.
You may credit reasons for not selecting the scatter graph or pie charts.
Block graphs are easy to compare (1) so it is clear to see which of the locations has the greatest number of properties at risk (1)
Block graphs are used to represent actual / whole numbers (1) which is what is given in the table (1)
Scatter graphs are not appropriate because they are used to show relationships between two variables (1) and only one variable is presented in the table (1)
Pie charts are not appropriate because they are used to show percentages (1) whereas the data in the table is actual/absolute numbers (1)
2 2

GCSE GEOGRAPHY B Sample Assessment Materials 37
© WJEC CBAC Ltd.
(iv) Give one reason why it is difficult for individuals to reduce the threat of climate change in the UK.
AO
1
AO
2.1
AO
2.2
AO
3
AO
4
To
tal
This question assesses AO2.1, the concept of mitigating risk.
Credit one valid statement for one mark and its explanation with one mark.
Responses must refer to individuals in the UK. The focus must be on why individuals find it difficult to reduce the threat.
Individuals cannot make a difference given the scale of the issue (1) whereas emissions from industry are largely to blame (1) Many individuals are ignorant of the causes of climate change (1) so they do not do enough to tackle poor energy management / conservation (1)
Many individuals do not accept that they have a role in reducing climate change (1) because they may not be affected by sea level rise or wild weather events/may not care about the effects in other parts of the world (1)
2 2

GCSE GEOGRAPHY B Sample Assessment Materials 38
© WJEC CBAC Ltd.
(v) Explain why government in the UK may wish to reduce the threat of climate change.
AO
1
AO
2.1
AO
2.2
AO
3
AO
4
To
tal
This question assesses AO2.1, the concept of mitigating risk.
Use the descriptors in the banded mark scheme below. Work upwards from the lowest band.
Band Mark Descriptor
3 5-6
A sophisticated response where the candidate shows a very clear understanding through a chain of reasoning.
2 3-4
Elaboration in the response shows a clear understanding.
1 1-2
Valid but basic points are made with no elaboration.
0
Award 0 marks if the answer is incorrect or wholly irrelevant.
Responses may make reference to the national UK government and/or local government within the UK. The explanation could be based around: * a commitment to global target setting and/or international agreements (Kyoto/Copenhagen Accord) * economics and practicalities of dealing with sea level rise and/or wild weather events at a local or national scale
* a political dimension of appearing to be ‘green’.
6 6

GCSE GEOGRAPHY B Sample Assessment Materials 39
© WJEC CBAC Ltd.
(d) People have different views on the issue of climate change. Make use of these views to decide whether you agree with the following statement: ‘The need to create economic growth in NICs such as India far outweighs any concerns about climate change’. Explain your reasons.
AO
1
AO
2.1
AO
2.2
AO
3
AO
4
To
tal
8 8
Use the banded mark scheme below. Work upwards from the lowest band.
Band Mark Descriptor
4 7-8 Exceptional application of knowledge and understanding:
Comprehensive chains of reasoning provide sophisticated analysis
Balanced and coherent appraisal draws together wider geographical understanding to justify decision(s).
3 5-6 Thorough application of knowledge and understanding:
Chains of reasoning provide elaborated analysis
Balanced appraisal draws together wider geographical understanding to support decision(s).
2 3-4 Sound application of knowledge and understanding:
Some connections provide valid but limited analysis
Limited appraisal uses wider geographical understanding to support decision(s).
1 1-2 Some basic application of knowledge and understanding:
Basic levels of meaning ascribed to the information/issue
Limited and weak appraisal uses some wider geographical understanding to support decision(s).
0 Award zero marks if the answer is incorrect or wholly irrelevant.
With reference to the target elements (a, b, c and d) of AO3, responses will apply knowledge and understanding by: a) ascribing meaning to the views provided b) analysing information in to find connections between economic growth and climate change, thus allowing chains of reasoning to be developed. c) evaluating the extent to which NICs should be able to foster economic growth without being concerned about climate change. d) making a judgement about the statement, which is supported by a rationale. Popular starting points for those who support the statement will stem from one of the three viewpoints provided, e.g. they may be given from the perspective of NICs who wish to rapidly develop by exploiting carbon resources for electricity. Evaluation will be strengthened when candidates draw on their wider geography. They might, for example, draw upon the views of politicians within NICs about the need to create wealth to support a growing population (to develop education and health services). An alternative stance, again starting with one of the three viewpoints provided, is to argue about the negative impacts of climate change such as the drowning of low-lying coastal communities in Bangladesh. Evaluation will be strengthened when candidates draw on their wider geography. They might, for example draw upon the critical situation for small island states such as Tuvalu. The most sophisticated responses will weigh up and evaluate before making the final decision. Balance and a coherent appraisal will draw together a wide range of views disparate views. The judgement will draw on a wide spectrum of geographical information in terms of costs and benefits of economic growth (in NICs), and the links to climate change.
End of Question 2

GCSE GEOGRAPHY B Sample Assessment Materials 40
© WJEC CBAC Ltd.
Theme 3 Question 3
3 (a) Study the maps and the photograph below. They show information about The Wildfowl & Wetlands Trust (WWT). This organisation conserves small scale wetland ecosystems throughout the UK. (i) Describe the location of the Martin Mere wetland ecosystem. Use map 3.1 or map 3.2 in your answer.
AO
1
AO
2.1
AO
2.2
AO
3
AO
4
To
tal
Credit up to two valid statements each with one mark. Credit accurate use of scale/compass to the visitor centre if map 3.2 is used. Do not credit ‘near to’.
In north-west (1) England (1) 3km from Rufford (1) west south west of Rufford (1) less than 1km from Tarlscough (1)
2 2
(ii) Complete the table below by giving the correct four figure and six figure grid references. Use map 3.2 A
O1
AO
2.1
AO
2.2
AO
3
AO
4
To
tal
Credit this response only for Rufford (no mark for the use of a 6 fig GR). Credit this response for the visitor centre. Allow some tolerance in the third and sixth figure as shown (no mark for a 4 figure GR).
4515 (1) 42[8/9]14[3/4] (1)
2 2
(iii) Describe the relief of the land shown in map 3.2 and photograph 3.3. A
O1
AO
2.1
AO
2.2
AO
3
AO
4
To
tal
Credit up to two valid statements each with one mark. For consistent marking, please use this definition for ‘relief’: The physical shape, configuration or general unevenness of a part of the Earth's surface, considered with reference to variation of height and slope or to irregularities of the land surface; the elevation or difference in elevation, considered collectively, of a land surface. Do not credit description of landscape features such as small lakes / dykes etc.
The land is flat / undulating (1) low lying (1) The land is around 10 metres above sea level / between 4 and 14 metres high (1)
2 2

GCSE GEOGRAPHY B Sample Assessment Materials 41
© WJEC CBAC Ltd.
(b) The world map below shows the location of the major biomes across the world. (i) Tick () the correct definition of a biome from the three available in the table.
AO
1
AO
2.1
AO
2.2
AO
3
AO
4
To
tal
Credit this response only.
A biome is a global land area that is characterised by the plants, animals and climate in that area (1)
1 1
(ii) Describe the distribution of the Tropical Rainforest biome. Use map 3.4.
AO
1
AO
2.1
AO
2.2
AO
3
AO
4
To
tal
Credit up to two valid statements each with one mark. Do not credit responses that describe the location of areas of Tropical Rainforest within a continent, as the question asks for distribution. Do not credit 'All of the Rainforest is found within the Tropics.'
Most of the Rainforest is found within the tropics (1) The rainforest is found mostly in three continents, South America, Africa and Asia (1) The largest area of rainforest is in South America/Asia (1) There are small areas of Rainforest in Australasia / Central America / North America (1) (allow one reference)
2 2
(c) The diagram below shows the links which exist in all ecosystems. (i) Name an ecosystem you have studied. Complete the table below, giving the names of specific plants or animals found in your chosen ecosystem.
AO
1
AO
2.1
AO
2.2
AO
3
AO
4
To
tal
Credit up to four valid names each with one mark. No mark should be awarded for the ecosystem named. Max 1 mark for each of the 4 rows in the table. Allow any ecosystem. The indicative content uses the hot semi-arid grasslands.
Tertiary Consumer: lion (1) hyena (1) vulture (1) Secondary Consumer: meerkat (1) mongoose (1) anteater (1) Primary Consumer: zebra (1) mouse (1) grasshopper (1) Producer: grass (1) acacia tree (1) baobab tree (1)
4 4

GCSE GEOGRAPHY B Sample Assessment Materials 42
© WJEC CBAC Ltd.
(ii) Describe three characteristics of the climate for the ecosystem you named above.
AO
1
AO
2.1
AO
2.2
AO
3
AO
4
To
tal
Credit up to three valid statements each with one mark. Credit responses that refer to:
precipitation, amounts and
pattern throughout the year
temperatures and temperature
patterns throughout the year
the inter-relationship of
temperature and precipitation
diurnal range
distinct seasons.
There is no need for candidates to quote climate figures but these should be credited if accurate.
Named ecosystem for example Savanna distinct wet and dry seasons (1) the dry season can last for 4 to 6 months (1) annual rainfall figures are relatively low / below 600mm (1) daytime temperatures remain high throughout the year (1) range
is between 24C and 35C (1) Named ecosystem for example tropical rainforest There are distinct wet and drier seasons (1) annual rainfall figures are relatively high / above 2,500mm (1) daytime temperatures remain high throughout the year (1) range is very small (1).
3 3
(d) Study the map below. The line A – B shows a cross-section across three biomes in Africa. Describe how the changes in the vegetation from A to B are influenced by climate.
AO
1
AO
2.1
AO
2.2
AO
3
AO
4
To
tal
Credit up to two valid statements each with one mark. Candidates may include reference to tropical (high) temperatures. Please accept this inference.
Rainfall all year promotes lush / dense / thick vegetation (1) Where there is no rain (dry all year), vegetation is non-existent (1) Where it is both hot and wet, rainforest trees grow (1) The more rain there is, the more vegetation there is (1)
2 2

GCSE GEOGRAPHY B Sample Assessment Materials 43
© WJEC CBAC Ltd.
(e) (i) Explain why human activities lead to damage of ecosystems.
AO
1
AO
2.1
AO
2.2
AO
3
AO
4
To
tal
Use the banded mark scheme for AO2.2 – an understanding of the inter-relationship between human activity and damage within ecosystems. Work upwards from the lowest band.
Band Mark Descriptor
3 5-6
A clear understanding is shown by linking human activity to specified damage in the ecosystem. The links are accurate, well developed and pertinent to named locations.
2 3-4
A sound understanding is shown by making some links between human activity and damage to ecosystems. Responses relate to generic locations / activities.
1 1-2
A basic understanding is given. Candidates use simplistic and generic ideas to link human activity to damage in unspecified terms and locations.
0 Award 0 marks if the answer is incorrect or wholly irrelevant.
Candidates may initially explore ways that people exploit ecosystems and then link the exploitation to damage processes. Alternatively, they may focus on a damaged ecosystem and then explain how the exploitation caused the damage. Accept a range of entry points, e.g. tourist exploitation within coral reefs / deforestation for mining or timber products/ drowning through HEP / water schemes / clearance for farming (for example, subsistence or large scale oil palm plantations). Responses may link damage within the ecosystem to interruption to processes operating within the ecosystem: - a break in / damage to the nutrient cycle - energy flows - atmospheric change.
6 6

GCSE GEOGRAPHY B Sample Assessment Materials 44
© WJEC CBAC Ltd.
(ii) Name one ecosystem which it is being managed for a sustainable future. Predict how successful the management scheme is likely to be in creating a sustainable future for the ecosystem. Justify your reasoning. A
O1
AO
2.1
AO
2.2
AO
3
AO
4
To
tal
8 8
Use the banded mark scheme. Work upwards from the lowest band.
Band Mark Descriptor
4 7-8 Exceptional application of knowledge and understanding. Balanced and coherent appraisal draws together wider geographical understanding to justify decision(s).
3 5-6 Thorough application of knowledge and understanding. Balanced appraisal draws together wider geographical understanding to support decision(s).
2 3-4 Sound application of knowledge and understanding. Valid but limited appraisal uses wider geographical understanding to support decision(s).
1 1-2 Some basic application of knowledge and understanding. Limited and weak appraisal uses some wider geographical understanding to support decision(s).
0 Award zero marks if the answer is incorrect or wholly irrelevant.
With reference to the target elements (c and d) of AO3, responses will apply knowledge and understanding by: c) evaluating the degree to which an existing sustainable management scheme is showing signs of success (and possibly failure). d) making a judgement about the likely degree of success in the longer term, i.e. predicting the outcome. The prediction must be supported by a clear rationale. Responses will vary depending on the location chosen and the scale of the ecosystem. An appreciation of the degree to which the management assures a sustainable future is the key for the rationale. Analysis should incorporate chains of reasoning focused upon the way management is more likely / unlikely to facilitate a sustainable future. Balance and a coherent appraisal will be facilitated when candidates consider the positives and negatives of the scheme. The judgement will draw on a wide spectrum of geographical information in terms of ecosystem function, exploitation and preservation. Popular responses will include an evaluation of management schemes employed in, for example: Tropical rain forests, such as protected areas / selective logging / eco-tourism / tree planting programmes / agroforestry.
Semi-arid grasslands, such as multi-national approaches like the Great Green Wall of trees / changing agricultural practice (drought resistant crops) / NGO projects e.g. irrigation schemes / contour ploughing.
End of Question 3

GCSE GEOGRAPHY B Sample Assessment Materials 45
© WJEC CBAC Ltd.
GCSE GEOGRAPHY B COMPONENT 2 PROBLEM SOLVING GEOGRAPHY SAMPLE ASSESSMENT MATERIALS 1 hour 30 minutes
For examiner’s use only SPaG
Part A
32
0
Part B
28
0
Part C
12
4
Total Marks
72
4
ADDITIONAL MATERIALS Resource folder. You will also require a calculator and a ruler. INSTRUCTIONS TO CANDIDATES Answer all of the questions in this examination paper. Use black ink or black ball-point pen. Write your name, centre number and candidate number in the spaces at the top of this page. Write your answers in the spaces provided in this booklet. If additional space is required you should use the lined pages at the end of this booklet. The question number(s) should be clearly shown. INFORMATION FOR CANDIDATES The number of marks is given in brackets [ ] at the end of each question or part-question. You are reminded that assessment will take into account your ability to spell, punctuate and use grammar and specialist terms accurately will be assessed in your answer to Part C.

GCSE GEOGRAPHY B Sample Assessment Materials 46
© WJEC CBAC Ltd.
Bauchi state is located in Nigeria. The environment here suffers from desertification.
Part A: provides background information about Bauchi state. Details about the climate and the causes of desertification are included. 32 marks Part B: considers three options for solving desertification in Bauchi state. 28 marks Part C: asks you to advise the national government of Nigeria on the order
in which the three options should be carried out to reduce desertification in Bauchi state. 16 marks
Total 76 marks
Part A You are advised to spend about 30 minutes on this part. This part provides you with background information about Bauchi state. Details about the climate and the causes of desertification are included. (a) Study the maps on page 2 of the separate Resource Folder.
They show the location of Bauchi state, which is a region of Nigeria. (i) Name the continent in which Nigeria is located. [1] (ii) Circle the correct answer in the sentence below: Bauchi state is in the north-east / south-west / north-west of Nigeria. [1] (iii) Give two more statements about the location of Bauchi state. [2]

GCSE GEOGRAPHY B Sample Assessment Materials 47
© WJEC CBAC Ltd.
(b) Study Graph 1 below. It shows the hot semi-arid climate of Bauchi state.
Graph 1 The hot semi-arid climate of Bauchi
(i) Complete graph 1 using the following information. [1]
(ii) Use information from graph 1 to complete the statements below: [4] The highest monthly precipitation is ………..mm in August.
The lowest monthly temperature is 28°C in the month of……………….
The temperature range is …………….. There is a dry season from ……………………to……………………….
(iii) Contrast this hot semi-arid climate with the climate of the UK. Identify
four differences. [4]
The average maximum temperature in April 37 C

GCSE GEOGRAPHY B Sample Assessment Materials 48
© WJEC CBAC Ltd.
(c) Desertification is a problem in Bauchi state. The main causes are climate change, deforestation and farming methods used by some farmers.
(i) Tick () the correct meaning of desertification in the table below: [1]
The process by which desert becomes fertile land
The process by which fertile land becomes even more fertile
The process by which fertile land turns into desert
(ii) Some scientists think that the burning of fossil fuels is making drought
in Bauchi state worse. Use words from the box below to complete the
sentences that follow. [4]
uranium wetter greenhouse gases oil ash timber radiation greenhouse effect nitrogen oxides drier global cooling colder
Fossil fuels such as …………………………. are burnt in power
stations in countries around the world. This adds
…………………………………. to the atmosphere which trap heat from
the sun, a process known as the ………………………………. This
leads to climate change, which may increase drought in Bauchi state
as the climate there becomes hotter and ……………………….….

GCSE GEOGRAPHY B Sample Assessment Materials 49
© WJEC CBAC Ltd.
(d) Desertification can also occur when trees are removed (deforestation). Study Diagram 2 below.
Diagram 2
(i) Place each letter for the following processes in its correct box on Diagram 2. One box will remain empty. [2]
(A) Interception (B) Infiltration
(ii) Explain why deforestation damages soils. [3]

GCSE GEOGRAPHY B Sample Assessment Materials 50
© WJEC CBAC Ltd.
(e) Study the diagram on page 3 of the separate Resource Folder. It shows some activities in Bauchi state that can lead to desertification.
Choose two of these activities. For each activity explain why it may lead to
desertification. [4] Activity 1 _________________________________ …………………………………………………………………………………………. …………………………………………………………………………………………. …………………………………………………………………………………………. …………………………………………………………………………………………. Activity 2 _________________________________ …………………………………………………………………………………………. …………………………………………………………………………………………. …………………………………………………………………………………………. …………………………………………………………………………………………. (f) Bauchi is one of the poorest parts of Nigeria. Daily life for many
people is always very challenging. Study the data in Table 3 below.
Table 3 Selected development indicators
Development indicators Bauchi State Nigeria
The % of adults unable to read or write (illiterate) 62 46
The % of people who use unsafe drinking water 65 51
The % of people who suffer from food poverty 54 41
(i) Identify the patterns shown by the data in Table 3. [2]

GCSE GEOGRAPHY B Sample Assessment Materials 51
© WJEC CBAC Ltd.
(ii) Suggest how desertification may make the daily lives of people who live in Bauchi state even more challenging.
Use information from Table 3. [3]
End of Part A

GCSE GEOGRAPHY B Sample Assessment Materials 52
© WJEC CBAC Ltd.
Part B You are advised to spend about 35 minutes on this part. In this part you will consider three options for solving desertification in Bauchi state. Option 1: A solution at an international scale - the Great Green Wall (a) Study the map and information on page 4 of the separate Resource Folder.
(i) Give the length (between X and Y) and the mean width of the Great Green Wall. [2]
Length between X and Y: Mean width:
(ii) Explain why planting trees and shrubs may help prevent desertification. [3]
(iii) Desertification is an international problem. Explain why it may be difficult for the Great Green Wall to solve the problem in this region of Africa. Use information in the Resource Folder. [2]

GCSE GEOGRAPHY B Sample Assessment Materials 53
© WJEC CBAC Ltd.
Option 2: A solution at a large scale - the proposal to build the Kafin Zaki Dam (b) Study the diagram and photograph on page 5 of the separate
Resource Folder. If it is built, the Kafin Zaki Dam will create a large
reservoir.
(i) Explain why building a dam may help reduce the local effects of
desertification. [4]
(ii) The dam would have different effects on villages A, B and C. Which
village would benefit most from the dam and why? [4] (iii) Give one reason why large scale water projects are controversial. [3]

GCSE GEOGRAPHY B Sample Assessment Materials 54
© WJEC CBAC Ltd.
Option 3: A solution at a small scale - a proposal to fund a number of self-help
projects for farmers
(c) Study the photograph and information on page 6 of the separate Resource
Folder. It shows a drip irrigation system that has been funded by a Non-
Governmental Organisation (NGO). A number of small schemes like this have
been set up in Bauchi state.
(i) Explain why drip irrigation is used in hot semi-arid climates. [3]

GCSE GEOGRAPHY B Sample Assessment Materials 55
© WJEC CBAC Ltd.
(ii) Make use of information on page 6 of the separate Resource Folder
to suggest the long term benefits for local farmers of this project. [3]
(iii) Explain why there are disadvantages to relying on a number of small
scale self-help projects to solve the problem of desertification. [4]
End of Part B

GCSE GEOGRAPHY B Sample Assessment Materials 56
© WJEC CBAC Ltd.
Part C You are advised to spend about 25 minutes on this part. This part asks you to advise the national government of Nigeria on the order in which the three options should be carried out to reduce desertification in Bauchi state. The three options are:
Option 1: a proposal to extend the Great Green Wall
Option 2: a proposal to build the Kafin Zaki Dam
Option 3: a proposal to fund a number of self-help projects for farmers
Write a letter to the government of Nigeria in which you advise on the order in which the three options should be carried out to reduce desertification in Bauchi state. In your letter you should:
• rank the options in the order that you consider they should be carried out • justify your decision. You should take into account the social, economic and
environmental sustainability of the options.
The Factfile on page 7 of the separate Resource Folder gives further information about the
three options.
Make use of the Factfile and information from other parts of this paper to help your answer.
You may plan your letter on the blank page that follows. You may use this space to organise
your ideas.

GCSE GEOGRAPHY B Sample Assessment Materials 57
© WJEC CBAC Ltd.
Blank page for your planning:

GCSE GEOGRAPHY B Sample Assessment Materials 58
© WJEC CBAC Ltd.
To the government of Nigeria, I am advising you to carry out the options in the following order: In the box below, state the order in which you think they should be carried out. Your ability to spell, punctuate and use grammar and specialist terminology accurately will be assessed in your answer. (4 marks) I have decided on this order because [12 + 4]
Order Option
Extend the Great Green Wall
Build the Kafin Zaki dam
Fund a number of self-help projects for farmers

GCSE GEOGRAPHY B Sample Assessment Materials 59
© WJEC CBAC Ltd.

GCSE GEOGRAPHY B Sample Assessment Materials 60
© WJEC CBAC Ltd.
End of Part C
END OF PAPER

GCSE GEOGRAPHY B Sample Assessment Materials 61
© WJEC CBAC Ltd.
GCSE GEOGRAPHY B COMPONENT 2 SAMPLE ASSESSMENT MATERIALS
RESOURCE FOLDER
This folder is for use with questions in Component 2.
This folder need not be handed in with your answer booklet.
1

GCSE GEOGRAPHY B Sample Assessment Materials 62
© WJEC CBAC Ltd.
The location of Bauchi State
2

GCSE GEOGRAPHY B Sample Assessment Materials 63
© WJEC CBAC Ltd.
How human activities lead to desertification
3

GCSE GEOGRAPHY B Sample Assessment Materials 64
© WJEC CBAC Ltd.
Option 1: A solution at an international scale
The Great Green Wall is a cross-border project involving many countries. Governments are encouraging people who l ive in the region to plant trees, shrubs, and crops.
46

GCSE GEOGRAPHY B Sample Assessment Materials 65
© WJEC CBAC Ltd.
Option 2: A solution at a large scale - a proposal to build the Kafin Zaki Dam
The proposed dam would:
be designed with the potential to install hydro-electric power
allow an area 4 times the size of London to be irrigated.
The new reservoir would:
permanently flood many villages
lose a lot of water through evaporation.
5

GCSE GEOGRAPHY B Sample Assessment Materials 66
© WJEC CBAC Ltd.
Option 3: a solution at a small scale – fund a number of self-help projects for farmers
Disadvantages of NGO aided self-help projects
Water for irrigation may not be available on a regular basis
NGOs pay for these systems to be set up, but may withdraw their support at any time
Not all farmers are members of these projects
D) Crops are planted where water drips from holes in the hosepipe
C) Crops are planted in soil ridges one metre apart
A) Water bucket is placed on a stand
B) Water is transferred to the crops through hosepipes
6

GCSE GEOGRAPHY B Sample Assessment Materials 67
© WJEC CBAC Ltd.
Factfile
Option 1: The Great Green Wall
• The scheme encourages co-operation between countries
• The scheme costs very little money to maintain
• Most land in rural areas is needed for growing crops
• Most of the money needed comes from outside Nigeria
Option 2: a proposal to build the Kafin Zaki Dam
• Building the dam would create over one million new jobs in Bauchi state
• 10 million people living further downstream would have less water for
everyday use
• Abuja, the capital city, suffers from electricity shortages
• The cost of the dam is around US $117 million
Option 3: to fund a number of self-help projects for farmers
• Planting a variety of crops increases the reliability of food supplies
• Schemes like this cost very little money to set up
• Some farmers can be reluctant to change farming methods
• Villagers work together for the benefit of all
7

GCSE GEOGRAPHY B Sample Assessment Materials 68
© WJEC CBAC Ltd.
COMPONENT 2 – MARK SCHEME
Instructions for examiners of GCSE Geography when applying the marking scheme 1 Positive marking It should be remembered that learners are writing under examination conditions and credit should be given for what the learner writes, rather than adopting the approach of penalising him/her for any omissions. It should be possible for a very good response to achieve full marks and a very poor one to achieve zero marks. Marks should not be deducted for a less than perfect answer if it satisfies the criteria of the mark scheme. GCSE Geography marking schemes are presented in a common format as shown below:
2 Tick marking Low tariff questions should be marked using a points-based system. Each credit worthy response should be ticked in red pen. The number of ticks must equal the mark awarded for the sub-question. The mark scheme should be applied precisely using the expected outcomes box as a guide to the responses that are acceptable. Do not use crosses to indicate answers that are incorrect. If the candidate has not attempted the question then the examiner should strike through the available dotted lines with a diagonal line.
3 (a) (i) Describe the location of the island of Lefkada.
AO
1
AO
2.1
AO
2.2
AO
3
AO
4
To
tal
Credit two simple statements
based on map evidence.
Credit accurate use of compass
points max 1
Credit accurate use of scale line
max 1
In western Greece (1) In Ionian Sea
(1) north of Cephalonia (1) 275km
(+/-10) from Athens (1) 280km (+/-10)
from Thessaloniki (1)
2 2
This box contains the sub-question
The columns to the right indicate the assessment objective(s) targeted by the question and its mark tariff.
This box contains the rationale i.e. it explains the principles that must be applied when marking each sub-question. The examiner must apply this rationale when applying the marking scheme to the response.
This box contains the candidates' expected responses for point-based marking. For some sub-questions, those with a closed question, this box will indicate the only response that is acceptable. For more open ended sub-questions this box will illustrate a number of likely responses that are credit worthy. It may be that this list will be extended at the examiner's conference after actual scripts have been read. For banded mark schemes this box contains indicative content. For further details see below under Banded mark schemes Stage 2.

GCSE GEOGRAPHY B Sample Assessment Materials 69
© WJEC CBAC Ltd.
3 Banded mark schemes Banded mark schemes are divided so that each band has a relevant descriptor. The descriptor for the band provides a description of the performance level for that band. Each band contains marks. Examiners should first read and annotate a learner’s answer to pick out the evidence that is being assessed in that question. Do not use ticks on the candidate’s response. Once the annotation is complete, the mark scheme can be applied. This is done as a two stage process. Stage 1 – Deciding on the band When deciding on a band, the answer should be viewed holistically. Beginning at the lowest band, examiners should look at the learner’s answer and check whether it matches the descriptor for that band. Examiners should look at the descriptor for that band and see if it matches the qualities shown in the learner’s answer. If the descriptor at the lowest band is satisfied, examiners should move up to the next band and repeat this process for each band until the descriptor matches the answer. If an answer covers different aspects of different bands within the mark scheme, a ‘best fit’ approach should be adopted to decide on the band and then the learner’s response should be used to decide on the mark within the band. For instance if a response is mainly in band 2 but with a limited amount of band 3 content, the answer would be placed in band 2, but the mark awarded would be close to the top of band 2 as a result of the band 3 content. Examiners should not seek to mark candidates down as a result of small omissions in minor areas of an answer. Stage 2 – Deciding on the mark Once the band has been decided, examiners can then assign a mark. During standardising (marking conference), detailed advice from the Principal Examiner on the qualities of each mark band will be given. Examiners will then receive examples of answers in each mark band that have been awarded a mark by the Principal Examiner. Examiners should mark the examples and compare their marks with those of the Principal Examiner. When marking, examiners can use these examples to decide whether a learner’s response is of a superior, inferior or comparable standard to the example. Examiners are reminded of the need to revisit the answer as they apply the mark scheme in order to confirm that the band and the mark allocated is appropriate to the response provided. Indicative content is also provided for banded mark schemes. Indicative content is not exhaustive, and any other valid points must be credited. In order to reach the highest bands of the mark scheme a learner need not cover all of the points mentioned in the indicative content but must meet the requirements of the highest mark band. Where a response is not creditworthy, that is contains nothing of any significance to the mark scheme, or where no response has been provided, no marks should be awarded.
GCSE GEOGRAPHY B Sample Assessment Materials 70
© WJEC CBAC Ltd.
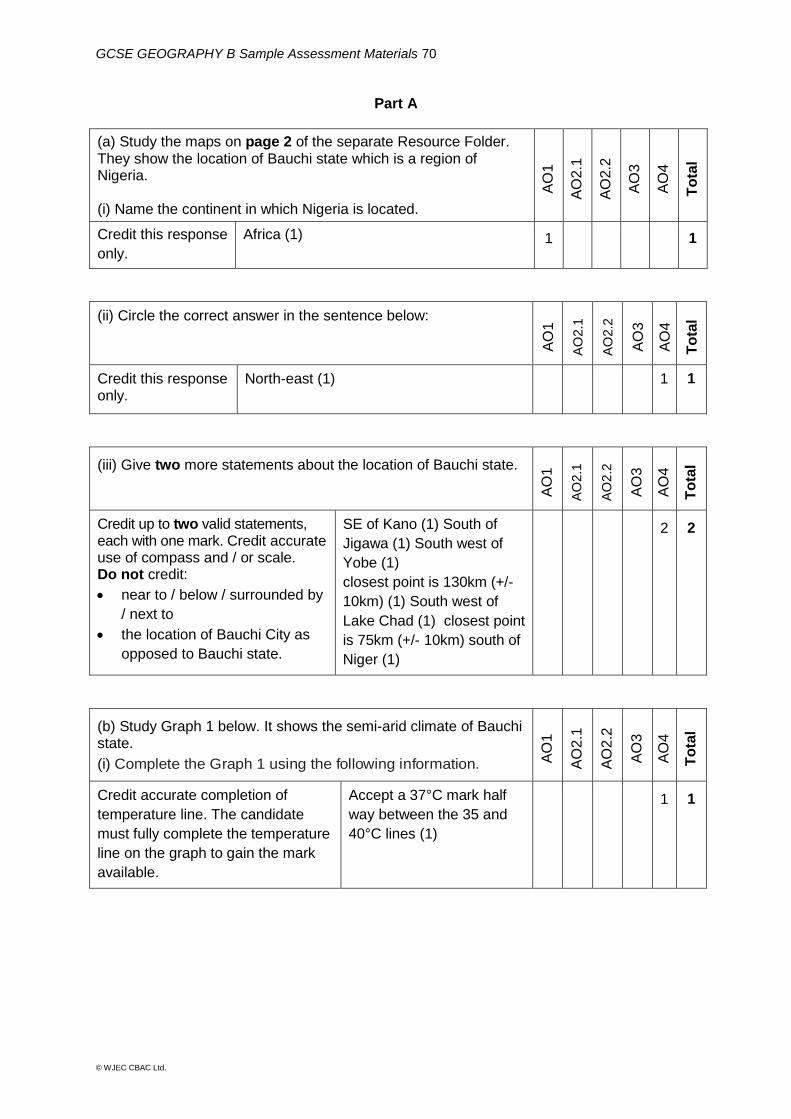
Part A
(a) Study the maps on page 2 of the separate Resource Folder. They show the location of Bauchi state which is a region of Nigeria. (i) Name the continent in which Nigeria is located.
AO
1
AO
2.1
AO
2.2
AO
3
AO
4
To
tal
Credit this response
only.
Africa (1) 1 1
(ii) Circle the correct answer in the sentence below:
AO
1
AO
2.1
AO
2.2
AO
3
AO
4
To
tal
Credit this response only.
North-east (1) 1 1
(iii) Give two more statements about the location of Bauchi state.
AO
1
AO
2.1
AO
2.2
AO
3
AO
4
To
tal
Credit up to two valid statements, each with one mark. Credit accurate use of compass and / or scale. Do not credit:
near to / below / surrounded by
/ next to
the location of Bauchi City as
opposed to Bauchi state.
SE of Kano (1) South of
Jigawa (1) South west of
Yobe (1)
closest point is 130km (+/-
10km) (1) South west of
Lake Chad (1) closest point
is 75km (+/- 10km) south of
Niger (1)
2 2
(b) Study Graph 1 below. It shows the semi-arid climate of Bauchi state.
(i) Complete the Graph 1 using the following information. AO
1
AO
2.1
AO
2.2
AO
3
AO
4
To
tal
Credit accurate completion of
temperature line. The candidate
must fully complete the temperature
line on the graph to gain the mark
available.
Accept a 37°C mark half
way between the 35 and
40°C lines (1)
1 1

GCSE GEOGRAPHY B Sample Assessment Materials 71
© WJEC CBAC Ltd.
(ii) Use information from Graph 1 to complete the sentences below:
AO
1
AO
2.1
AO
2.2
AO
3
AO
4
To
tal
Credit one mark for each correct
response (allowing tolerances for
first and third blank space).
Both months should be correct for
the fourth blank space.
Allow 270-280mm (1)
August (1)
Allow 8 - 10 °C (1)
November to March (1)
4 4
(iii) Contrast this hot semi-arid climate with the climate of the UK. Identify four differences.
AO
1
AO
2.1
AO
2.2
AO
3
AO
4
To
tal
Credit up to four valid comparative statements, each with one mark.
Statements must be
comparative i.e. they must
consider differences
between the Savanna and
Temperate Maritime
climates, using sentence
connectives.
Bauchi state has two distinct
seasons whereas the UK has four
distinct seasons (1)
Temperature range is 9°C in
Bauchi state but in the UK it tends
to be greater than this / double /
twice as much / accept between
15-20°C (1)
The warmest period (may be
expressed as summer) is
February – April compared to the
UK when it is June- August (1)
The peak temp in Bauchi is in
April whereas in the UK it is in
July / August (1)
There is an obvious wet / dry
season in Bauchi from May to
October whereas in the UK there
is rainfall all year (1)
London has about the same
amount of rainfall per month
whereas Bauchi has extremes of
rainfall across months (1)
4 4

GCSE GEOGRAPHY B Sample Assessment Materials 72
© WJEC CBAC Ltd.
(c) Desertification is a problem in Bauchi state. The main causes
are climate change, deforestation and farming methods used by
some farmers.
(i) Tick () the correct meaning of desertification in the table
below.
AO
1
AO
2.1
AO
2.2
AO
3
AO
4
To
tal
Credit this
response only.
The process by which fertile land turns into
desert (1) 1 1
(ii) Some scientists think that the burning of fossil fuels is making
drought in Bauchi state worse. Use words from the box below to
complete the sentences that follow. AO
1
AO
2.1
AO
2.2
AO
3
AO
4
To
tal
Credit these
responses only.
Oil (1)
Greenhouse gases (1)
Greenhouse effect (1)
Drier (1)
4 4
(d) Desertification can also occur when trees are removed
(deforestation). Study Diagram 2 below.
(i) Place each letter for the following processes in its correct box
on Diagram 2. One box will remain empty.
AO
1
AO
2.1
AO
2.2
AO
3
AO
4
To
tal
Credit these responses only.
The box below the roots should
remain empty.
Do not credit if letters A or B are
placed in more than one box.
Letter A in the empty box in
the tree (1)
Letter B in the empty box on
the surface of the soil (1)
2 2

GCSE GEOGRAPHY B Sample Assessment Materials 73
© WJEC CBAC Ltd.
(ii) Explain why deforestation damages soils.
AO
1
AO
2.1
AO
2.2
AO
3
AO
4
To
tal
Credit up to two valid statements each with one mark (to max 2). For either valid statement, credit a valid explanation for one additional mark (1+2 or 2+1). Or credit one valid statement that is explained by a chain of reasoning (1+1+1).
Soil dries out (1) because protection from the
sun’s heat has been removed (1) so can be
blown/washed away /eroded more easily as
it is dust (1)
No roots to bind the soil (1) so soil is lost (1)
through wind erosion / sheet erosion /
gullying (1)
Less evapotranspiration leads to less water
in the cycle (1) so less precipitation (1) leads
to drier soil (1)
Leaves no longer fall (1) so less organic
matter to decompose (1) so soil becomes
infertile (1)
3 3

GCSE GEOGRAPHY B Sample Assessment Materials 74
© WJEC CBAC Ltd.
(e) Study the diagram on page 3 of the separate Resource Folder. It shows some activities in Bauchi state that can lead to desertification. Choose two of these activities. For each activity explain why it may lead to desertification.
AO
1
AO
2.1
AO
2.2
AO
3
AO
4
To
tal
Credit up to two valid statements each with one mark (to max 2). For each valid statement, credit a valid explanation for one additional mark (2+2).
No mark for naming the
activity.
Max 2 marks if only one
activity is mentioned
(the paper structure
clearly indicates that
two are required).
Land clearance using fire: fire destroys plant cover (1) so exposes soil to heavy rain/ wind /sun / nutrients can more easily be washed away / nutrients are leached (1) Overgrazing: animals eat vegetation plant cover (1) so exposed to sun / dries up (1) Animals trample / compact the soil (1) so making it harder for rainfall to infiltrate soil (1) Overcropping: plants compete for water (1) so soil dries out quickly/ soil is easily eroded (1) OR plants compete for nutrients (1) so soil structure is damaged (1) Lack of fertilising: soil loses fertility (1) and soil structure is damaged leading to wind erosion (1) Not allowing land to rest: land is never allowed to lie fallow /rest (1) so nutrients are depleted faster than they are restored (1)
4 4

GCSE GEOGRAPHY B Sample Assessment Materials 75
© WJEC CBAC Ltd.
(f) Bauchi is one of the poorest parts of Nigeria. Daily life for many
people is always very challenging. Study the data in the table below.
(i) Identify the patterns shown by the data in Table 3. AO
1
AO
2.1
AO
2.2
AO
3
AO
4
To
tal
Credit up to two valid statements each with one mark.
The emphasis is on recognising
patterns as revealed by the
data.
All three indices indicate that
Bauchi is disadvantaged
compared to Nigeria as a
whole (1)
Across all three indices, more
than half of the population of
Bauchi suffer from serious
poverty related issues (1)
The widest gap between
Bauchi and Nigeria as a
whole is in literacy levels (1)
2 2
(ii) Suggest how desertification may make the daily lives of people
who live in Bauchi state even more challenging. Use information
from Table 3. AO
1
AO
2.1
AO
2.2
AO
3
AO
4
To
tal
Responses will apply understanding to a novel context when ascribing meaning to the development indicators in Table 3. Credit up to two valid statements each with one mark (to max 2).
For either valid statement, credit a valid explanation / development point for one additional mark (1+2 or 2+1).
Or credit one valid statement that is explained by a chain of reasoning (1+1+1).
Over half of Bauchi residents suffer
food poverty, desertification will
create even greater problems (1) so
less food may be available to eat
(1) which will mean greater
malnourishment (1) or possibly
starvation (1)
Safe water is already limited,
desertification will put even more
pressure on water supplies (1) as
more water will be needed for crop
irrigation (1)
Education to improve literacy rates
will be even less of a priority (1) as
people will be focussed on survival
first (1) so there will be fewer
resources available to spend on
education (1)
3 3
End of Part A

GCSE GEOGRAPHY B Sample Assessment Materials 76
© WJEC CBAC Ltd.
Part B
Option 1: A solution at an international scale - the Great
Green Wall
(a) Study the map and information on page 4 of the separate
Resource Folder.
(i) Give the length (between X and Y) and the mean width of the
Great Green Wall.
AO
1
AO
2.1
AO
2.2
AO
3
AO
4
To
tal
Credit one mark for each
correct response (allow
tolerances as shown).
The length of the Great Green
Wall from X to Y is 5,800km (+/-
150km) (1)
The mean width of the Great
Green Wall is 250km (+/- 25km)
(1)
2 2
(ii) Explain why planting trees and shrubs may help prevent desertification.
AO
1
AO
2.1
AO
2.2
AO
3
AO
4
To
tal
Credit up to two valid statements each with one mark (to max 2).
For either valid statement, credit a valid explanation for one additional mark (1+2 or 2+1).
Or credit one valid statement that is explained by a chain of reasoning (1+1+1).
Do not credit statements
lifted from the resource
without extension.
Bind the soil (1) so reducing soil
erosion (1)
Keep moisture in the soil (1) so
allows continued crop growth (1)
Provide organic material to the
soil (1) thereby keeping it fertile
(1)
Stop the desert spreading
southwards / acts as a barrier (1)
so fertile land/farmland is
protected / food supplies
protected (1)
3 3

GCSE GEOGRAPHY B Sample Assessment Materials 77
© WJEC CBAC Ltd.
(iii) Desertification is an international problem. Explain why it
may be difficult for the Great Green Wall to solve the problem
in this region of Africa. AO
1
AO
2.1
AO
2.2
AO
3
AO
4
To
tal
This question requires candidates to synthesise links when information on page 4 of the Resource Folder is analysed.
Credit one valid statement (for 1 mark) and a valid explanation/reason for one additional mark.
The wall will have to be created across a huge area to stop the advance of the desert (1) so the distance of over 5000 km make the project challenging (1)
At least 12 countries need to co-operate (1) so not all may have the resources / willingness to get involved (1)
Virtually all the countries in this region are relatively poor (1) so they may not have the resources to support the project (1)
Some of this area is troubled by conflict (1) such a project needs settled times to carry out the work (1)
2 2
Option 2: A solution at a large scale - the proposal to build the Kafin Zaki Dam. (b) Study the diagram and photograph on page 5 of the separate Resource Folder. If it is built, the Kafin Zaki Dam will create a large reservoir. (i) Explain why building a dam may help reduce the local effects of desertification.
AO
1
AO
2.1
AO
2.2
AO
3
AO
4
To
tal
Credit up to two valid statements each with one mark (to max 2).
For each valid statement, credit a valid explanation/ development for one additional mark (2+2).
Or one valid statement (1) and a second valid statement that is explained by a chain of reasoning (1+1+1).
Or credit one valid statement that is explained by a chain of reasoning (1+1+1+1).
Irrigation of crops is possible (1) reliable
water supply allows crops 2 crops a year
(1) so family is fed (1) and can have more
to sell / cash crops (1) leading to greater
income (1) more disposable income /
invest back into the farm (1)
Irrigation water gives more possibility for
crop growing (1) there may be less
reliance on livestock (1) which will reduce
over grazing (1) and trampling of soils (1)
Dam controls flooding (1) so crops are
protected (1)
Fish means more balanced diet (1) so
healthier (1) able to work more (1) earn
more income (1)
4 4

GCSE GEOGRAPHY B Sample Assessment Materials 78
© WJEC CBAC Ltd.
(ii) The dam would have different effects on villages A, B and C.
Which village would benefit most from the dam and why?
AO
1
AO
2.1
AO
2.2
AO
3
AO
4
To
tal
This question requires candidates to develop material beyond pure conceptual understanding when they develop lines of argument to:
b) Analyse information on the diagram on page 5
d) Make a judgement.
Credit up to two valid statements each with one mark (to max 2).
For each valid statement, credit a valid explanation/ development for one additional mark (2+2).
Or one valid statement (1) and a second valid statement that is explained by a chain of reasoning (1+1+1).
Or credit one valid statement
that is explained by a chain of
reasoning (1+1+1+1).
Do not credit statements
that are copied from the
Resource Folder.
The justification may be
based on advantages for the
village selected or a
comparison with benefits for
one village compared to the
others.
Employment will be created (1) in fishing/ fish processing / market trading / farming (1)
Reliable water supply (do not credit) which will be safer than wells/streams (1) so health will improve / child mortality will fall (1)
Water can be used for irrigation increase in farming income (1)
HEP could be installed (do not credit) so electricity in homes / at work (1) which means homes can be lit at night (1) making them safer (1)
2 or 3 crops a year (do not credit) so more jobs for farm labourers (1)
Cash crops (do not credit) means more income for local farmers (1) which will be spent in the local economy (1)
Fish added to diet (do not credit) so there will be less mal-nourishment (1)
4 4

GCSE GEOGRAPHY B Sample Assessment Materials 79
© WJEC CBAC Ltd.
(iii) Give one reason why large scale water projects are controversial.
AO
1
AO
2.1
AO
2.2
AO
3
AO
4
To
tal
This question assesses understanding of potential damage made by the process of water abstraction/water transfer on people, the economy or environment. Credit one valid statement that is explained by a chain of reasoning (1+1+1).
Credit responses that show an
understanding of the negative
impacts of dam construction or
water transfer schemes.
Large scale projects are
expensive (1) so money has to
be borrowed (1) and country
goes into debt (1)
Forced movement of people
(1) so breakup of villages (1)
and compensation may be low
(1)
High loss of water through
evaporation (1) so climate
becomes even drier (1) and
land becomes less fertile /
eroded (1)
3 3

GCSE GEOGRAPHY B Sample Assessment Materials 80
© WJEC CBAC Ltd.
Option 3: A solution at a small scale – a proposal to fund a number of self-help projects for farmers. (c) Study the photograph and information on page 6 of the separate Resource Folder. It shows a drip irrigation system that has been funded by a Non-Governmental Organisation (NGO). A number of small schemes like this have been set up in Bauchi state.
(i) Explain why drip irrigation is used in hot semi-arid climates.
AO
1
AO
2.1
AO
2.2
AO
3
AO
4
To
tal
This question assesses an understanding of the concept of the water cycle in relation to the processes of evaporation and evapotranspiration. Credit one valid statement that is explained by a chain of reasoning (1+1+1).
Water is only released where the plant
is located (1) slow release of water
means that soil absorbs most of it (1)
so more water gets to the plant
roots/less lost to
evaporation/evapotranspiration (1)
3 3

GCSE GEOGRAPHY B Sample Assessment Materials 81
© WJEC CBAC Ltd.
(ii) Make use of information on page 6 of the separate Resource
Folder to suggest one long term benefit for local farmers of this
project. AO
1
AO
2.1
AO
2.2
AO
3
AO
4
To
tal
This question requires
candidates to apply their
understanding to a novel
context and develop lines of
argument.
Credit one valid statement
that is elaborated by a chain
of reasoning (1+1+1).
Soil condition will gradually
improve (1) so yields will be
higher (1) and food security will
improve (1).
Less water will be needed for
irrigation (1) so health will improve
(1) because of improved water
security (1).
Higher yields from irrigated crops
(1) will mean higher incomes for
farmers (1) reducing
poverty/reliance on aid (1).
3 3
(iii) Explain why there are disadvantages to relying on a number
of small scale self-help projects to solve the problem of
desertification. AO
1
AO
2.1
AO
2.2
AO
3
AO
4
To
tal
This question assesses understanding of the concept of self-help. Credit up to two valid statements each with one mark (to max 2). For each valid statement, credit a valid explanation or development point for one additional mark (2+2). Or one valid statement (1) and a second valid statement that is explained by a chain of reasoning (1+1+1). Or credit one valid statement that is explained by a chain of reasoning (1+1+1+1).
Desertification covers too large an
area (1) there would need to be
hundreds of small scale projects
(1) NGOs don’t have the
resources for so many (1)
Local people may not have the
skills (1) commitment (1) to see
the project through after the
NGOs have left (1)
One of the root causes of
desertification is climate change
(1) this is not addressed as part of
this solution (1) small scale
projects can’t work if the water
supply problems (drought)
become worse (1)
4 4
End of Part B

GCSE GEOGRAPHY B Sample Assessment Materials 82
© WJEC CBAC Ltd.
Part C
Write a letter to the government of Nigeria in which you advise on the order in which the three options should be carried out to reduce desertification in Bauchi state. In your letter you should:
rank the options in the order that you consider they
should be carried out
justify your decision. You should take into account
the social, economic and environmental
sustainability of the options.
AO
1
AO
2.1
AO
2.2
AO
3
AO
4
SP
aG
To
tal
Use the descriptors in the banded mark scheme below. Work upwards from the lowest to the highest band.
Award max band 1 if the planning page is complete but no letter has been written.
12 4 16
With reference to the target elements (a, b, c and d) of AO3, responses will:
a) Interpret information from the Resource Folder/Question Paper
b) Analyse that information
c) Evaluate the issue of desertification in Bauchi
d) Make a judgement by ranking the options.

GCSE GEOGRAPHY B Sample Assessment Materials 83
© WJEC CBAC Ltd.
Band Mark Descriptor
4 10-12
The candidate writes a comprehensive response that:
reaches a substantiated decision that includes a clear justification for
the order of the three options
provides consistently detailed elaboration throughout that is
substantiated by a range of evidence in the Resource Folder
provides effective comparison of the options
applies wider geographical knowledge and understanding to
effectively substantiate the chain of reasoning.
3 7-9
The candidate writes a detailed response that:
reaches a decision that ranks and justifies the option order
provides detailed elaboration that is supported by evidence in the Resource Folder
provides some comparison of positive/negative features of the options
applies wider geographical knowledge and understanding to support reasoning.
2 4-6
The candidate writes a response that:
provides a decision that ranks and simply justifies the option order of more than one option
provides some elaboration that is supported by evidence in the Resource Folder
makes limited comparisons of positive/negative features of the options
applies some limited geographical knowledge/understanding.
1 1-3
The candidate writes a basic response that:
provides a simple but unsubstantiated decision
briefly explores some positive or negative features of one or more option.
0 Award 0 marks if the answer is incorrect or wholly irrelevant.
Once a mark (out of 12) has been awarded for the geographical content, apply the performance descriptors for spelling, punctuation and the accurate use of grammar and specialist terms that follow.

GCSE GEOGRAPHY B Sample Assessment Materials 84
© WJEC CBAC Ltd.
Band Marks Performance descriptions
High 4 Learners spell and punctuate with consistent accuracy
Learners use rules of grammar with effective control of meaning overall
Learners use a wide range of specialist terms as appropriate
Intermediate
2 - 3 Learners spell and punctuate with considerable accuracy
Learners use rules of grammar with general control of meaning overall
Learners use a good range of specialist terms as appropriate
Threshold
1 Learners spell and punctuate with reasonable accuracy
Learners use rules of grammar with some control of meaning and any errors do not significantly hinder meaning overall
Learners use a limited range of specialist terms as appropriate
0 The learner writes nothing
The learner’s response does not relate to the question
The learner’s achievement in SPaG does not reach the
threshold performance level, for example errors in spelling,
punctuation and grammar severely hinder meaning

GCSE GEOGRAPHY B Sample Assessment Materials 85
© WJEC CBAC Ltd.
GCSE GEOGRAPHY B COMPONENT 3 APPLIED FIELDWORK ENQUIRY SAMPLE ASSESSMENT MATERIALS 1 hour 30 minutes
For examiner’s use only SPaG
Part A 18 0
Part B 18 0
Part C 36 4
Total Marks 72 4
ADDITIONAL MATERIALS Resource folder. You will also require a calculator and a ruler.
INSTRUCTIONS TO CANDIDATES
Answer all of the questions in this examination paper.
Use black ink or black ball-point pen.
Write your name, centre number and candidate number in the spaces at the top of this page.
Write your answers in the spaces provided in this booklet.
If additional space is required you should use the lined pages at the end of this booklet. The
question number(s) should be clearly shown.
INFORMATION FOR CANDIDATES
The number of marks is given in brackets [ ] at the end of each question or part-question.
You are reminded that assessment will take into account your ability to spell, punctuate and use grammar and specialist terms accurately in your answer to Part C, Question 3 (d) (ii).

GCSE GEOGRAPHY B Sample Assessment Materials 86
© WJEC CBAC Ltd.
BLANK PAGE

GCSE GEOGRAPHY B Sample Assessment Materials 87
© WJEC CBAC Ltd.
Part A: Investigating flows through fieldwork Answer all parts of this question. You should use your fieldwork experience of measuring flows to support your answers. 1. (a) Study Photographs 1.1 and 1.2. They show two places where data could be
collected about flows.
Photograph 1.1
Photograph 1.2
Photo A: Andy Owen, Photo B: Bob Digby
State what data could be collected about flows in each place. [2] Photograph 1.1 ……………………………………………………………………
Photograph 1.2 ……………………………………………………………………

GCSE GEOGRAPHY B Sample Assessment Materials 88
© WJEC CBAC Ltd.
(b) Study page 2 of the separate Resource Folder.
Students carried out an enquiry into the movement of pebbles along a beach. Their enquiry question was 'How does the prevailing wind direction affect the flow of pebbles along this beach?'
Their data is shown in Graph 1.3 below.
Graph 1.3 The relationship between pebble size (mm)
and distance along the beach (m)
(i) Draw a line of best fit on Graph 1.3 to show the relationship between
pebble size and distance along the beach. [2]
0
5
10
15
20
25
30
35
40
45
0 200 400 600 800 1000
Siz
e o
f pebb
les (
mm
)
Distance along the beach (metres)

GCSE GEOGRAPHY B Sample Assessment Materials 89
© WJEC CBAC Ltd.
(ii) The students decided to collect some more evidence about pebble size at the beach.
They randomly collected pebbles at site A and site B. These sites are shown on the sketch map on page 2 of the separate Resource Folder. The size of the pebbles is shown in Table 1.4 below.
Table 1.4 Raw data on pebble sizes
Pebble size (mm)
Site A 40 32 45 18 55 15 28 43 16 42 38 Site B 13 12 15 13 15 12 14 13 15 14 14
Calculate the median sediment size and the inter quartile range (IQR) for each site.
Show your workings in the space below. [4]
Site A median = ………. Site A IQR = ……….
Site B median = ………. Site B IQR = ………. (iii) Using your answers to parts (i) and (ii), which of the following two
statements about the movement of pebbles along this beach is true? Place a tick () beside the two correct answers. [2]
Tick () two correct answers
The process of longshore drift is moving pebbles in an easterly direction (from site A to site B).
The process of longshore drift is moving pebbles in a westerly direction (from site B to site A).
There is no evidence that longshore drift is moving pebbles along the beach.
The process of longshore drift has sorted the pebbles so that they are more uniform at site A than at site B.
The process of longshore drift has sorted the pebbles so that they are more uniform at site B than at site A.
There is no evidence that the process of longshore drift has sorted the pebbles.

GCSE GEOGRAPHY B Sample Assessment Materials 90
© WJEC CBAC Ltd.
(c) Another group of students collected data about traffic flows in a small town. They counted the cars going in both directions along three main roads at 8:30am for 5 minutes. They repeated the survey at 5:00pm. The aim of the enquiry was to prove that patterns of traffic are affected by commuter movements.
You can see how they represented their results on page 3 of the separate Resource Folder.
Study the patterns shown on both maps on page 3 of the separate Resource
Folder. What conclusion(s) can you reach? [4] ………. ................................................................................................................ ………. ................................................................................................................ ………. ................................................................................................................ ………. ................................................................................................................ ………. ................................................................................................................ ………. ................................................................................................................ ………. ................................................................................................................ ………. ................................................................................................................ ………. ................................................................................................................ ………. ................................................................................................................ (d) This question is about your own experience of collecting data in the field on
flows. Explain why it is better to measure flows several times during a day (or over a
few days) rather than once when collecting data about flows. [4] ………. ................................................................................................................ ………. ................................................................................................................ ………. ................................................................................................................ ………. ................................................................................................................ ………. ................................................................................................................ ………. ................................................................................................................ ………. ................................................................................................................

GCSE GEOGRAPHY B Sample Assessment Materials 91
© WJEC CBAC Ltd.
………. ................................................................................................................ ………. ................................................................................................................ ………. ................................................................................................................ ………. ................................................................................................................ ………. ................................................................................................................
End of Part A

GCSE GEOGRAPHY B Sample Assessment Materials 92
© WJEC CBAC Ltd.
Part B: Investigating inequalities through fieldwork Answer all parts of this question. You should use your fieldwork experience of inequalities to support your answers. 2. A group of students carried out fieldwork in east London. Their enquiry was located in
Newham which is where the Olympic Games were held in 2012. (a) Study Photograph 2.1 and Photograph 2.2 which show two areas of housing
in Newham. The photos were taken by students on their fieldtrip. They wanted to show how the well-being of local people can be affected by the environment.
Add annotations (explanatory notes) to Photographs 2.1 and 2.2 to show how
the environment may affect the well-being of local residents. [3]
Photograph 2.1 Housing in Newham (built around 1960)
Photo: Bob Digby

GCSE GEOGRAPHY B Sample Assessment Materials 93
© WJEC CBAC Ltd.
Photograph 2.2 Housing overlooking the Olympic Park (built around 2010)
Photo: Bob Digby

GCSE GEOGRAPHY B Sample Assessment Materials 94
© WJEC CBAC Ltd.
(b) The students used a bi-polar technique to record how they felt about different parts of Newham. Part of their draft survey is given in Table 2.3 below.
Table 2.3 Draft bi-polar survey
The area would be safe at night
+5 +4 +3 +2 +1 -1 -2 -3 -4 -5 The area could be
unsafe at night
Neighbours look out for one another
Neighbours keep
themselves to themselves
(i) Add two more pairs of bi-polar statements to Table 2.3 that you could
use to investigate access to services in a study of inequality. [2]

GCSE GEOGRAPHY B Sample Assessment Materials 95
© WJEC CBAC Ltd.
(ii) The students decided to use their bi-polar technique at 15 survey sites
around Newham. At each site they recorded the views of 10 people. The raw values for three of their sites are shown in Table 2.4.
Table 2.4 The raw bi-polar scores for three of the 15 sites
The scores given by 10 different people
Site A +5 +4 +3 -1 +4 +2 +5 +1 -1 -1 Site B +3 -2 -4 -1 -1 -3 +1 -3 -5 -4 Site C +4 +1 +2 +1 +2 +2 +3 +1 -1 +3
Which of these three sites had the highest mean score and which site had the largest range of scores? Show your working in the space below. [4]
Site with the highest mean is site ….
The site with the largest range of scores is …. (iii) The students calculated the mean bi-polar score for each site.
Study page 4 of the separate Resource Folder which shows their results. What three conclusions can you reach? [3]
................................................................................................................ ................................................................................................................ ................................................................................................................ ................................................................................................................ ................................................................................................................ ................................................................................................................

GCSE GEOGRAPHY B Sample Assessment Materials 96
© WJEC CBAC Ltd.
(c) Newham is one of the UK’s most deprived (poor) areas. The students collected
some secondary data about Newham from the internet which included census data from the Office for National Statistics. Evaluate the use of the internet as a source of secondary data to support fieldwork into inequality. You should support your answer by referring to actual examples from your own fieldwork. [6]
................................................................................................................ ................................................................................................................ ................................................................................................................ ................................................................................................................ ................................................................................................................ ................................................................................................................ ................................................................................................................ ................................................................................................................ ................................................................................................................ ................................................................................................................ ................................................................................................................ ................................................................................................................ ................................................................................................................ ................................................................................................................ ................................................................................................................ ................................................................................................................ ................................................................................................................ ................................................................................................................
End of Part B

GCSE GEOGRAPHY B Sample Assessment Materials 97
© WJEC CBAC Ltd.
Part C: The wider UK dimension Answer all parts of this question. You should use your understanding of UK geography to support your answers. 3. (a) Inequalities exist at a national scale as well as within local communities.
Study page 5 of the separate Resource Folder. It shows the location of the 10 towns and cities which had the UK’s highest average wages (2012).
(i) Name the town or city located 75km to the south of central London. [1] ........................................................................................................................... (ii) Describe the distribution of the UK’s towns and cities which have the highest
weekly wages. Tick () two true statements in the list below. [2]
Tick () two
statements
The pattern is random
The cities are evenly spread across the UK
There is a significant cluster within 100km of London
They form a linear pattern
They are all in England
50% are in the south-east region
10% are in Scotland
(b) Study the map on page 6 of the separate Resource Folder. The line on the map is known as the North-South divide. The economy of the UK is growing faster to the south of this line.
(i) Compare the patterns shown by the map and graph on page 6 of the
separate Resource Folder. [6]
......................................................................................................................... ......................................................................................................................... ......................................................................................................................... ......................................................................................................................... ......................................................................................................................... .........................................................................................................................

GCSE GEOGRAPHY B Sample Assessment Materials 98
© WJEC CBAC Ltd.
......................................................................................................................... ......................................................................................................................... ......................................................................................................................... ......................................................................................................................... ......................................................................................................................... ......................................................................................................................... ......................................................................................................................... ......................................................................................................................... ......................................................................................................................... ......................................................................................................................... ......................................................................................................................... .........................................................................................................................
(ii) Explain why the population of UK cities is increasing. [6] .......................................................................................................................................
....................................................................................................................................... ....................................................................................................................................... ....................................................................................................................................... ....................................................................................................................................... .......................................................................................................................................
....................................................................................................................................... ....................................................................................................................................... ....................................................................................................................................... ....................................................................................................................................... ....................................................................................................................................... ....................................................................................................................................... .......................................................................................................................................

GCSE GEOGRAPHY B Sample Assessment Materials 99
© WJEC CBAC Ltd.
....................................................................................................................................... ....................................................................................................................................... ....................................................................................................................................... ....................................................................................................................................... .......................................................................................................................................
(c) Explain why population change puts pressure on access to services in rural locations of the UK. [6]
....................................................................................................................................... ....................................................................................................................................... ....................................................................................................................................... ....................................................................................................................................... ....................................................................................................................................... ....................................................................................................................................... ....................................................................................................................................... ....................................................................................................................................... ....................................................................................................................................... ....................................................................................................................................... ....................................................................................................................................... ....................................................................................................................................... ....................................................................................................................................... ....................................................................................................................................... ....................................................................................................................................... ....................................................................................................................................... ....................................................................................................................................... .......................................................................................................................................

GCSE GEOGRAPHY B Sample Assessment Materials 100
© WJEC CBAC Ltd.
(d) Study the information on page 7 of the separate Resource Folder.
(i) Describe the location of Lincoln. Use distance and direction to support your
answer. [3]
....................................................................................................................................... ....................................................................................................................................... ....................................................................................................................................... ....................................................................................................................................... ....................................................................................................................................... .......................................................................................................................................
(ii) Study the information on pages 7 to 12 of the separate Resource Folder.
What should the priority be for reducing the problems of inequality in Lincolnshire?
Choose one of the three issues from the list below: Issue 1: The ageing coastal communities of East Lindsey Issue 2: Rural population change Issue 3: Urban deprivation
Write a letter to Lincolnshire County Council. Explain why your chosen issue should become a priority. Justify your decision using information from pages 7 to 12 of the separate Resource Folder. [12+4]
Your ability to spell, punctuate and use grammar and specialist terms
accurately will be assessed in your answer to this question.
In tackling inequality in Lincolnshire, my priority would be to target:
Tick () one issue
Issue 1: The ageing coastal communities of East Lindsey
Issue 2: Rural population change
Issue 3: Urban deprivation

GCSE GEOGRAPHY B Sample Assessment Materials 101
© WJEC CBAC Ltd.
I would make this a priority because
................................................................................................................ ................................................................................................................ ................................................................................................................ ................................................................................................................ ................................................................................................................ ................................................................................................................ ................................................................................................................ ................................................................................................................ ................................................................................................................ ................................................................................................................ ................................................................................................................ ................................................................................................................
................................................................................................................ ................................................................................................................ ................................................................................................................ ................................................................................................................ ................................................................................................................ ................................................................................................................ ................................................................................................................ ................................................................................................................ ................................................................................................................ ................................................................................................................ ................................................................................................................ ................................................................................................................ ................................................................................................................ ................................................................................................................

GCSE GEOGRAPHY B Sample Assessment Materials 102
© WJEC CBAC Ltd.
................................................................................................................ ................................................................................................................ ................................................................................................................ ................................................................................................................ ................................................................................................................ ................................................................................................................ ................................................................................................................ ................................................................................................................ ................................................................................................................ ................................................................................................................
End of Part C
END OF PAPER

GCSE GEOGRAPHY B Sample Assessment Materials 103
© WJEC CBAC Ltd.
GCSE GEOGRAPHY B COMPONENT 3 SAMPLE ASSESSMENT MATERIALS
RESOURCE FOLDER
This folder is for use with questions in Component 3.
This folder need not be handed in with your answer booklet.

GCSE GEOGRAPHY B Sample Assessment Materials 104
© WJEC CBAC Ltd.
Students collected data about the size of pebbles at 12 locations along the beach. They started
at site A and finished at site B. These sites are shown on the sketch map below. Sites A and B
are 1000 metres apart.
Sketch map showing the sites of the beach survey
Page 2

GCSE GEOGRAPHY B Sample Assessment Materials 105
© WJEC CBAC Ltd.
Traffic flows at 8:30am
Traffic flows at 5:00pm
Page 3

GCSE GEOGRAPHY B Sample Assessment Materials 106
© WJEC CBAC Ltd.
Students collected bi-polar scores at a number of sites.
The aim of their enquiry was to see how living next to a busy road or next to a green space
or park might affect well-being of local residents. They plotted their results onto a sketch
map of their study area. You can see their results below.
Student sketch map of bi-polar mean values
Page 4

GCSE GEOGRAPHY B Sample Assessment Materials 107
© WJEC CBAC Ltd.
Towns / cities in the UK with the highest weekly wages (in rank order)
Page 5

GCSE GEOGRAPHY B Sample Assessment Materials 108
© WJEC CBAC Ltd.
Population Increase 2001-12 in each of the UK economic regions (in hundreds of thousands) Source: Office of National Statistics
Total number of jobs (in millions) in each of the UK economic regions
Page 6

GCSE GEOGRAPHY B Sample Assessment Materials 109
© WJEC CBAC Ltd.
Issues created by inequality in Lincolnshire
Lincolnshire is a large rural county in the East of England. Many people are employed in farming occupations. Since 2001 many migrants have moved from Eastern Europe to work on Lincolnshire farms. Lincoln is the largest city in the county. There are a number of old seaside towns along the coast including Skegness and Ingoldmells. These towns are popular with people who want to retire. Many small towns and villages in Lincolnshire are isolated from larger towns in the county and from the rest of England. The county has only one motorway, the M180, which connects Grimsby in the north of the county to the UK motorway network.
Map of Lincolnshire
Page 7

GCSE GEOGRAPHY B Sample Assessment Materials 110
© WJEC CBAC Ltd.
Individual issues that may lead to multiple problems of deprivation and inequality
Page 8
Low pay and season work e.g farm labourer
Unemployment due to factory or office closures
Poor urban environment. Lack of retail and leisure facilities due to 'death of the high street.
Rural isolation because of long distances to health or education services
Specific social or health issues perhaps as a result of migration or ageing of the population

GCSE GEOGRAPHY B Sample Assessment Materials 111
© WJEC CBAC Ltd.
Issue 1 The ageing coastal communities of East Lindsey
Skegness and Ingoldmells are seaside towns that used to be popular holiday resorts. The tourist industry has declined. Some jobs remain on static caravan sites and small hotels but jobs are seasonal. Levels of deprivation in these seaside towns are more than twice as high as the UK average. The biggest inequality issues here are related to health and disability. Unemployment is also a problem.
The average age of the coastal communities of East Lindsey is greater than anywhere else in the county. 28% of the population is over 65. This compares to 17% for England as a whole. The ageing population of Skegness and other coastal communities means that small schools face merger or closure.
Static caravan site and 'Fantasy Island' holiday park in Ingoldmells
Page 9

GCSE GEOGRAPHY B Sample Assessment Materials 112
© WJEC CBAC Ltd.
Issue 2 Rural population change
The districts of Boston and South Holland are at the centre of a large farming region which employs thousands of farm labourers. About 10,000 people in Boston were born abroad. 3,000 are from Poland. This is the highest number of Polish migrants in any area of the UK, outside the South East of England.
Many migrant workers have young children and this is putting pressure on local services such as primary schools. Some schools in Boston and South Holland are full. Schools find it difficult to provide resources and staffing to support children who speak English as an additional language. Deprivation in Boston is lower than the average for England, however about 17.7% (2,100) children live in poverty.
Migrant workers picking daffodils in South Holland
Page 10

GCSE GEOGRAPHY B Sample Assessment Materials 113
© WJEC CBAC Ltd.
Issue 3 Urban deprivation
Lincoln is the largest city in the county. The city contains some deprived neighbourhoods where unemployment is high. The National Census provides detailed information about every local area across England. One neighbourhood within Lincoln is ranked as 132nd out of 32,482 neighbourhoods in England for its high levels of deprivation.
Unemployment is a key factor in creating deprivation. In recent years a number of small manufacturing firms have closed in Lincoln. A specialist communications firm closed in 2014 with a loss of 85 jobs. A fertiliser manufacturer employing 74 people closed in 2015.
Measures of inequality in Lincolnshire from the 2011 census
People's general health
The 2011 Census asked people to describe their general health over the preceding 12 months as 'very good', 'good', 'fair', 'bad' or 'very bad'.
Place Very good (%) Bad (%)
Suburb of NE Lincoln 40.8 5.5
Suburb of SW Lincoln 50.3 2.4
Lincoln (mean) 44.2 4.2
Ingoldmells (in East Lindsey) 32.0 8.9
East Lindsey (mean) 38.2 6.4
Long Sutton (in South Holland) 35.7 6.4
South Holland (mean) 40.5 4.7
England (mean) 47.2 4.2
Employment
The 2011 Census asked people to describe their occupation. Managers are usually highly qualified. Elementary occupations are low skilled, they include jobs such as farm work or supermarket work.
Place Managers (%) Elementary
occupations (%)
NE suburb of Lincoln 5.2 28.0
SW suburb of Lincoln 8.7 14.0
Ingoldmells 12.5 34.0
Long Sutton 8.0 19.1
England 10.9 11.1
Page 11

GCSE GEOGRAPHY B Sample Assessment Materials 114
© WJEC CBAC Ltd.
Multiple deprivation
The 2011 Census has ranked all 32,482 neighbourhoods in England on a range of deprivation topics. This information is shown on a scale of 1 to 20 in the table below where 1 shows that the neighbourhood is among the least deprived in England and where a score of 20 is the most deprived.
NE suburb of Lincoln
Ingoldmells in East Lindsey
Sutton Bridge in South Holland
Page 12

GCSE GEOGRAPHY B Sample Assessment Materials 115
© WJEC CBAC Ltd.
COMPONENT 3 – MARKSCHEME
Instructions for examiners of GCSE Geography when applying the marking scheme 1 Positive marking It should be remembered that learners are writing under examination conditions and credit should be given for what the learner writes, rather than adopting the approach of penalising him/her for any omissions. It should be possible for a very good response to achieve full marks and a very poor one to achieve zero marks. Marks should not be deducted for a less than perfect answer if it satisfies the criteria of the mark scheme.
GCSE Geography marking schemes are presented in a common format as shown below:
3 (a) (i) Describe the location of the island of Lefkada.
AO
1
AO
2.1
AO
2.2
AO
3
AO
4
To
tal
Credit two simple statements
based on map evidence.
Credit accurate use of compass
points max 1
Credit accurate use of scale line
max 1
In western Greece (1) In Ionian Sea
(1) north of Cephalonia (1) 275km
(+/-10) from Athens (1) 280km (+/-10)
from Thessaloniki (1)
2 2
2 Tick marking Low tariff questions should be marked using a points-based system. Each credit worthy response should be ticked in red pen. The number of ticks must equal the mark awarded for the sub-question. The mark scheme should be applied precisely using the expected outcomes box as a guide to the responses that are acceptable. Do not use crosses to indicate answers that are incorrect. If the candidate has not attempted the question then the examiner should strike through the available dotted lines with a diagonal line.
This box contains the sub-question.
The columns to the right indicate the assessment objective(s) targeted by the question and its mark tariff.
This box contains the rationale i.e. it explains the principles that must be applied when marking each sub-question. The examiner must apply this rationale when applying the marking scheme to the response.
This box contains the candidates expected responses for point-based marking. For some sub-questions, those with a closed question, this box will indicate the only response that is acceptable. For more open ended sub-questions this box will illustrate a number of likely responses that are credit worthy. It may be that this list will be extended at the examiner's conference after actual scripts have been read. For banded mark schemes this box contains indicative content. For full details see below under Banded mark schemes Stage 2.

GCSE GEOGRAPHY B Sample Assessment Materials 116
© WJEC CBAC Ltd.
3 Banded mark schemes Banded mark schemes are divided so that each band has a relevant descriptor. The descriptor for the band provides a description of the performance level for that band. Each band contains a range of marks. Examiners should first read and annotate a learner’s answer to pick out the evidence that is being assessed in that question. Do not use ticks on the candidate’s response. Once the annotation is complete, the mark scheme can be applied. This is done as a two stage process. Stage 1 – Deciding on the band When deciding on a band, the answer should be viewed holistically. Beginning at the lowest band, examiners should look at the learner’s answer and check whether it matches the descriptor for that band. Examiners should look at the descriptor for that band and see if it matches the qualities shown in the learner’s answer. If the descriptor at the lowest band is satisfied, examiners should move up to the next band and repeat this process for each band until the descriptor matches the answer. If an answer covers different aspects of different bands within the mark scheme, a ‘best fit’ approach should be adopted to decide on the band and then the learner’s response should be used to decide on the mark within the band. For instance if a response is mainly in band 2 but with a limited amount of band 3 content, the answer would be placed in band 2, but the mark awarded would be close to the top of band 2 as a result of the band 3 content. Examiners should not seek to mark candidates down as a result of small omissions in minor areas of an answer. Stage 2 – Deciding on the mark Once the band has been decided, examiners can then assign a mark. During standardising (marking conference), detailed advice from the Principal Examiner on the qualities of each mark band will be given. Examiners will then receive examples of answers in each mark band that have been awarded a mark by the Principal Examiner. Examiners should mark the examples and compare their marks with those of the Principal Examiner. When marking, examiners can use these examples to decide whether a learner’s response is of a superior, inferior or comparable standard to the example. Examiners are reminded of the need to revisit the answer as they apply the mark scheme in order to confirm that the band and the mark allocated is appropriate to the response provided. Indicative content is also provided for banded mark schemes. Indicative content is not exhaustive, and any other valid points must be credited. In order to reach the highest bands of the mark scheme a learner need not cover all of the points mentioned in the indicative content but must meet the requirements of the highest mark band. Where a response is not creditworthy, that is contains nothing of any significance to the mark scheme, or where no response has been provided, no marks should be awarded.

GCSE GEOGRAPHY B Sample Assessment Materials 117
© WJEC CBAC Ltd.
Part A: Investigating flows through fieldwork
(ii) Calculate the median sediment size and the inter quartile range (IQR) for each site.
Show your workings in the space below. AO
1
AO
2.1
AO
2.2
AO
3
AO
4
To
tal
Credit these responses only
with no tolerance.
If there is a wrong answer indicated on the answer line, check the working in the body of the script, and award any marks appropriate from the mark scheme.
Site A median = 38 (1) Site A IQR = 25 (1) Site B median = 14 (1) Site B IQR = 2 (1) Numbers from Table 1.4 are written in rank order but medians / IQRs are incorrectly calculated award max 1 mark
4 4
(iii) Using your answers to parts (i) and (ii), which of the following two
statements about the movement of beach sediment along this beach is
true? Place a tick () beside the two correct answers. AO
1
AO
2.1
AO
2.2
AO
3
AO
4
To
tal
Credit these responses
only.
The process of longshore drift is moving pebbles
in an easterly direction (from site A to site B) (1)
The process of longshore drift has sorted the
pebbles so that it is more uniform at site B than
at site A (1)
2 2
1 (a) Study Photographs 1.1 and 1.2. They show two places where data
could be collected about flows.
State what data could be collected about flows in each place. AO
1
AO
2.1
AO
2.2
AO
3
AO
4
To
tal
Credit one correct statement
per photo. Max1 mark for
each photo.
The answer must refer to a
flow in each case.
Do not credit ‘flow’ if it is not
qualified.
Photo 1.1
Flow of water/discharge/channel flow (1)
Infiltration rate (1) wind (1)
Photo 1.2
Movement /flow of people / pedestrians (1)
Traffic (1) wind (1)
2 2
1 (b) (i) Draw a line of best fit on Graph 1.3 to show the relationship between pebble size and distance along the beach.
AO
1
AO
2.1
AO
2.2
AO
3
AO
4
Tota
l
Credit up to two marks: One mark for the correct direction of the line. One mark if the number of points above the line is equal to the number of points below the line. Award zero marks if a diagonal line is drawn through the origin of the graph.
A straight line must be drawn sloping in a negative direction (1) Six points on either side of line (1)
2 2

GCSE GEOGRAPHY B Sample Assessment Materials 118
© WJEC CBAC Ltd.
(c) Another group of students collected data about traffic flows in a small
town. They counted the cars going in both directions along three main
roads at 8:30am for 5 minutes. They repeated the survey at 5:00pm.
The aim of their enquiry was to prove that patterns of traffic are affected
by commuter movements.
Study the patterns shown on both maps on page 3 of the Separate
Resource folder. What conclusion(s) can you reach?
AO
1
AO
2.1
AO
2.2
AO
3
AO
4
To
tal
Use the descriptors below, working
upwards from the lowest band.
Band Marks Descriptor
3 4
Substantiated
conclusion(s) are
developed which
take into account the
aim of the enquiry
and the patterns on
both maps.
2 2-3
Statements are
elaborated which
take into account the
patterns on both
maps.
1 1
Simple statements
based on the
direction and width
of the arrows.
0
Award 0 marks if the
answer is incorrect
or wholly irrelevant.
This question requires
candidates to apply their
understanding of the use of
techniques to analyse
patterns on the maps and
relate the conclusion to the
aim stated in the stem of
the question i.e. the
conclusion relates the
patterns of the maps to
commuting. Responses
might conclude that:
The north-south road is
always busier than the east-
west road which suggests
more people live to the
north and south than the
east.
On every road there is more
traffic travelling into the
town in the morning and
less in the evening which
suggests that people are
commuting into work.
4 4

GCSE GEOGRAPHY B Sample Assessment Materials 119
© WJEC CBAC Ltd.
(d) This question is about your own experience of collecting data in the
field on flows.
Explain why it is better to measure flows several times during a day (or over
a few days) rather than once when collecting data about flows.
AO
1
AO
2.1
AO
2.2
AO
3
AO
4
To
tal
This question targets AO3, specifically the candidates’ ability to evaluate/identify limitations and strengths.
Credit up to two valid statements each with one mark (to max 2).
For either valid statement, credit up to two valid elaboration/ development points for one additional mark each (1+3 or 2+2).
Or credit one valid statement that is explained by a chain of reasoning (1+1+1+1).
Do not award marks for
fieldwork which is unrelated to
flows.
This question requires candidates to apply their understanding of the use of techniques to evaluate sampling strategies.
The responses will depend on the context of the fieldwork. The following are examples only:
River flow: Discharge varies constantly, so you need to measure it several times a day / season (1) It will increase after a rainfall event (1) The lag time will be variable depending on the season (1) or intensity of the rainfall (1).
Pedestrian flow: The movement of people in any town or city varies constantly, so you need to measure it several times a day or across days of the week / times of the year (1) At commuting times it will be higher as people walk from the bus station (1) lunchtimes are busier as office workers take a lunch break (1) On Sundays many shops are closed so city centres are less busy (1) In the middle of the night people are generally at home asleep (1)
4 4
End of Part A

GCSE GEOGRAPHY B Sample Assessment Materials 120
© WJEC CBAC Ltd.
Part B: Investigating deprivation and inequalities through fieldwork
2 (a) Study Photograph 2.1 and Photograph 2.1 which show two areas of
housing in Newham. The photos were taken by students on their fieldtrip.
They wanted to show how the well-being of local people can be affected
by the environment.
Add annotations (explanatory notes) to Photographs 2.1 and 2.2 to show
how the environment may affect the well-being of local residents.
AO
1
AO
2.1
AO
2.2
AO
3
AO
4
To
tal
Use the descriptors below, working
upwards from the lowest band.
Band Marks Descriptor
3 3
Elaborated
statements based on
features of the urban
environment are
linked to well-being
of local residents.
2 2
Elaborated
statements based on
features of the urban
environment.
1 1
Simple statements
based on features of
the urban
environment.
0
Award 0 marks if the
answer is incorrect
or wholly irrelevant.
This question requires candidates to apply their understanding to ascribe meaning to the photograph.
The effect of the environment may be positive or negative.
Annotations should link features of the urban environment (such as parks, open space, places to park vehicles, building design) to the well-being of local residents.
Photo 2.1: parking spaces close to homes is a benefit for local residents.
On street parking means that the roads may be dangerous to cross, especially for young children / those with mobility problems.
Photo 2.2: the large area of green space provides a safe environment for leisure e.g. ball games or cycle rides so people can keep fit.
3 3
(b) The students used a bi-polar technique to record how they felt about
different parts of Newham. Part of their draft survey is given in Table 2.3.
(i) Add two more pairs of bi-polar statements to Table 2.3 that you could
use to investigate access to services in a study of inequality.
AO
1
AO
2.1
AO
2.2
AO
3
AO
4
To
tal
Award one mark for each
pair.
Credit statements that are
bi-polar i.e. opposites. The
positive statement must be
on the left.
Credit statements that refer
to services only.
The following are examples only:
Schools are close by <> there are no local
schools (1)
Local schools are high achieving <> local
schools are failing (1)
Regular bus services <> Irregular / no bus
services (1)
2 2

GCSE GEOGRAPHY B Sample Assessment Materials 121
© WJEC CBAC Ltd.
(b) (ii) Which of these three sites had the highest mean score and which site had the largest range of scores?
Show your working in the space below. AO
1
AO
2.1
AO
2.2
AO
3
AO
4
To
tal
Credit these responses only.
If there is a wrong answer indicated on the answer line, check the working in the body of the script, and award any marks appropriate from the mark scheme.
Award max two marks if the correct responses are given but the candidate does not show working.
Credit working to show mean mark
at site B (1)
Credit working to show mean mark
at site C (1)
The highest mean mark is +2.1/at
A (1)
The largest range is 8/at site B (1)
4 4
(b) (iii) The students calculated the mean bi-polar score for each site. The aim of their enquiry was to see how living next to a busy road or next to a green space or park might affect well-being of local residents. They plotted their results onto a sketch map of their study area. You can see their results on page 4 of the separate Resource Folder.
Study page 4 of the separate Resource Folder. What three conclusions can you reach?
AO
1
AO
2.1
AO
2.2
AO
3
AO
4
To
tal
Credit up to three
separate valid conclusions, each for one mark.
NB that the results are
'messy' because they do
not necessarily meet the
students' expectations.
Conclusions must relate
directly to the evidence
from the sketch map.
This question requires candidates to apply their understanding of the use of techniques to analyse and find connections.
The scores for locations near green spaces are always high and positive/well-being is enhanced (1)
The scores adjacent to main roads are mostly negative/well-being is harmed (1)
The scores near main roads where shops are present are particularly low/ well-being is badly affected (1)
The highest scores are close to a school/well-being is enhanced (1)
3 3

GCSE GEOGRAPHY B Sample Assessment Materials 122
© WJEC CBAC Ltd.
(c) Evaluate the use of the internet as a source of secondary data to
support fieldwork into inequality.
You should support your answer by referring to actual examples from
your own fieldwork.
AO
1
AO
2.1
AO
2.2
AO
3
AO
4
To
tal
Use the descriptors below, working upwards
from the lowest band.
Band Marks Descriptor
3 5-6
Detailed/specific
evaluation which address
advantages and
disadvantages and which
use relevant illustrations
from the candidate's own
fieldwork.
2 3-4
Elaborated statements
which provide evaluation
of the advantages /
disadvantages and which
use illustrations from the
candidate's own
fieldwork.
1 1-2
Simple statements based
on general advantages /
disadvantages of
secondary sources.
0
Award 0 marks if the
answer is incorrect or
wholly irrelevant.
This question requires candidates to apply their understanding of the use of techniques to evaluate the advantages and disadvantages (or strengths and limitations) of using the internet in the candidate's own fieldwork.
Inequalities can be social, economic, or environmental.
Secondary sources could refer to objective data, for example, census data on unemployment, local authority data on housing need, house price data. It may also be a reference to opinions expressed in, for example, an on-line news article or weblog.
Advantages / disadvantages could refer to the validity or accuracy of the evidence, or the reliability of the source of the evidence.
6 6
End of Part B

GCSE GEOGRAPHY B Sample Assessment Materials 123
© WJEC CBAC Ltd.
Part C: The wider UK dimension
3 (a) Inequalities exist at a national scale as well as within local
communities. Study Figure 7. It shows the location of the 10 towns and
cities which had the UK’s highest average wages (2012).
(i) Name the town or city located 75km to the south of central London.
AO
1
AO
2.1
AO
2.2
AO
3
AO
4
To
tal
Credit this response only. Brighton (1 mark) 1 1
(ii) Describe the distribution of the UK’s towns and cities which have the
highest weekly wages.
AO
1
AO
2.1
AO
2.2
AO
3
AO
4
To
tal
Credit these responses
only. There is a significant cluster within 100km of London (1)
50% are in the south-east region (1)
2 2

GCSE GEOGRAPHY B Sample Assessment Materials 124
© WJEC CBAC Ltd.
(b) (i) Compare the patterns shown by the map and graph on page 6 of the separate Resource Folder.
AO
1
AO
2.1
AO
2.2
AO
3
AO
4
To
tal
6 6
This question targets the skills elements of use of the
map and graph and the ability to communicate findings.
Use the descriptors below, working upwards from the
lowest band.
Band Mark Descriptor
3 5-6
Elaborated statements which make direct comparisons between the regions to the north and south and which make effective use of both sets of data. Meaning is unambiguous. The response has clear purpose, is fluent and logically structured.
2 3-4
Statements which make comparisons between the regions to the north and south. Meaning is clear. The response has purpose, is organised and well structured.
1 1-2
Simple valid statements that describe patterns. Meaning is generally clear. Statements are linked by a basic structure.
0 Award 0 marks if the answer is incorrect or wholly irrelevant.
Responses will use map evidence to
make comparisons between population
increase with total number of jobs. Some
candidates will note that both sets of data
are higher to the south of the north/south
divide which is marked on the map.
Population increase is lower to the north
of the line / higher to the south.
The lowest area is the North East which
has only increased by 63000 whereas
London and the South East have the two
largest increases.
The South East has grown 10 times
more than the North East.

GCSE GEOGRAPHY B Sample Assessment Materials 125
© WJEC CBAC Ltd.
(b) (ii) Explain why the population of cities in the UK is increasing.
AO
1
AO
2.1
AO
2.2
AO
3
AO
4
To
tal
6 6
This question assesses AO2.1 the concept of
population change.
Use the descriptors below, working upwards from the
lowest band.
Band Mark Band Descriptor
3 5-6
Thorough and elaborated understanding of reasons for population change. Some demonstrate depth of understanding through chains of reasoning.
2 3-4
Elaborated understanding of some reasons for population change which demonstrates breadth of understanding.
1 1-2
Simple, valid statements demonstrate basic understanding of the reasons for population change.
0 Award 0 marks if the answer is incorrect or wholly irrelevant.
The question does not explicitly ask for push or pull
factors but these should be credited if they are given.
Do not double credit unless further detail or elaboration
is provided that would indicate a higher band has been
achieved.
Responses should demonstrate
understanding of a range of push factors
that are responsible for population
change in one major UK city.
Migration
Booming urban economies attract young
adults to find work. Some jobs are better
paid than in rural regions (eg London
weighting allowance) and other jobs are
advertised widely because of skill
shortages (eg in health and education
services). Some migrants are from within
the UK, others are foreign migrants.
Responses may focus on pull factors
(such as 'bright lights') or push factors.
Natural increase
Youthful populations, attracted initially by
booming urban economies are in the
fertile age range and are likely to have
young children which leads to further
growth of the urban population.

GCSE GEOGRAPHY B Sample Assessment Materials 126
© WJEC CBAC Ltd.
(c) Explain why population change puts pressure on access to services in rural locations of the UK. A
O1
AO
2.1
AO
2.2
AO
3
AO
4
To
tal
6 6
This question assesses AO2.2, the relationship between
population change and access to services in rural places.
Use the descriptors below, working upwards from the
lowest band.
Band Mark Descriptor
3 5-6
Elaborated statements which demonstrate a clear understanding of the links between population change and the consequential pressures on a wide range of services.
2 3-4
Elaborated statements which demonstrate an understanding of the link between population change and the consequential pressure on services.
1 1-2
Simple, valid statements demonstrate a general understanding of how population change may impact on service provision.
0 Award 0 marks if the answer is incorrect or wholly irrelevant.
Responses should link population change to named services. Credit responses that refer to either population growth or loss (or both) in rural areas. Population change is likely to be based on population growth as the question asks candidates to explain the 'pressure' on the services. Examples will include pressure on the availability of schools (places / class sizes), health services (doctors / maternity services), roads (congestion / new build) and policing. More sophisticated responses may refer to socio-economic aspects of population change and / or demographics. Examples include the inward migration of younger people (maternity provision / school places) or older people (health care / community services). Credit responses which make the link between de-population and the closure of services (isolated rural villages losing post offices / bus services).
(d) (i) Describe the location of Lincoln. Use distance and direction to support your answer.
AO
1
AO
2.1
AO
2.2
AO
3
AO
4
To
tal
Credit up to three valid
statements, each with one
mark.
Max 1 if no use of
distance or direction.
It is in Lincolnshire (1) in the west of the
county (1)
It is 45km (1) south west of Grimsby (1)
It is 60km (1) west north west of Skegness
(1)
3 3

GCSE GEOGRAPHY B Sample Assessment Materials 127
© WJEC CBAC Ltd.
(d) (ii) Write a letter to Lincolnshire County Council. Explain why your chosen issue should become a priority. Justify your decision using information from pages 7 to 12 of the separate Resource Folder.
Your ability to spell, punctuate and use grammar and specialist terms accurately will be assessed in your answer to this question.
AO
1
AO
2.1
AO
2.2
AO
3
AO
4
SP
aG
To
tal
Use the descriptors in the banded mark scheme below. Work upwards from the lowest to the highest band.
12 4 16
Band Mark Descriptor
4 10-12
The candidate writes a comprehensive response that:
reaches a substantiated decision that includes an effective justification
provides consistently detailed analysis throughout that is substantiated by a range of evidence in the Resource Folder
provides effective evaluation of the issue(s)
applies wider geographical knowledge and understanding of the UK to effectively substantiate the chain of reasoning.
3 7-9
The candidate writes a detailed response that:
reaches a decision that is justified
provides detailed analysis that is supported by evidence in the Resource Folder
provides some evaluation of the issue(s)
applies wider geographical knowledge and understanding of the UK to support reasoning.
2 4-6
The candidate writes a response that:
provides a decision that is simply justified
provides some analysis that is supported by evidence in the Resource Folder
makes limited evaluation of the issue(s)
applies some limited geographical knowledge/understanding of the UK.
1 1-3 The candidate writes a basic response that:
provides a simple but unsubstantiated decision
briefly explores some of the issues in one place
0 Award 0 marks if the answer is incorrect or wholly irrelevant.
Once a mark (out of 12) has been awarded for the geographical content, apply the performance descriptors for spelling, punctuation and the accurate use of grammar and specialist terms that follow.

GCSE GEOGRAPHY B Sample Assessment Materials 128
© WJEC CBAC Ltd.
Band Marks Performance descriptions
High 4 Learners spell and punctuate with consistent accuracy
Learners use rules of grammar with effective control of meaning overall
Learners use a wide range of specialist terms as appropriate
Intermediate
2 - 3 Learners spell and punctuate with considerable accuracy
Learners use rules of grammar with general control of meaning overall
Learners use a good range of specialist terms as appropriate
Threshold
1 Learners spell and punctuate with reasonable accuracy
Learners use rules of grammar with some control of meaning and any errors do not significantly hinder meaning overall
Learners use a limited range of specialist terms as appropriate
0 The learner writes nothing
The learner’s response does not relate to the question
The learner’s achievement in SPaG does not reach the
threshold performance level, for example errors in spelling,
punctuation and grammar severely hinder meaning
WJEC Eduqas GCSE Geography B SAMs from 2016/MLJ 26/10/15