Bradley John Witham - Accounting, Finance & Computer Services

Witham Catchment Flood Map Improvements – Phase 2 Lower Witham: Volume 1 - Modelling and Flood Mapping Report
Environment Agency – Commission No. AN769
30th October 2009


Prepared by: ................................................ Checked by: ................................................. Andrew Heath-Brown John Higginbottom Modeller Principal Modeller Approved by: ................................................ Andy Yarde Regional Director Witham Catchment Flood Map Improvements
Rev No
Comments Checked by
Approved by
Date
1 Draft version for Environment Agency review JAH AJY 28/09/09
2 Final Issue JAH AJY 30/10/09 5th Floor, 2 City Walk, Leeds, LS11 9AR Telephone: 0113 391 6800 Fax: 0113 391 6899 Website: http://www.aecom.com Job No 60045419 Reference Date Created 19
th June 2009
This document has been prepared by AECOM Limited (“AECOM”) for the sole use of our client (the “Client”) and in accordance with generally accepted consultancy principles, the budget for fees and the terms of reference agreed between AECOM and the Client. Any information provided by third parties and referred to herein has not been checked or verified by AECOM, unless otherwise expressly stated in the document. No third party may rely upon this document without the prior and express written agreement of AECOM. f:\projects\rivers & coastal - wicsm phase 3\m004 - lower witham\reports\final report - revision 2 - final\vol1 - modelling report\re02 - jun09_lower witham_vol 1_modelling_mapping_report_rev2(final).doc


1 Introduction ..................................................................................................................... 4 PROJECT BACKGROUND ............................................................................................... 4 LOWER WITHAM CATCHMENT DESCRIPTION ............................................................ 5 SCOPE OF STUDY & KEY OUTPUTS ............................................................................ 7
2 Hydrology ....................................................................................................................... 12 INTRODUCTION ............................................................................................................. 12 HYDROLOGICAL MODELLING ..................................................................................... 12 IWRS INFLOW BOUNDARIES ....................................................................................... 23
3 Defended Model Development ..................................................................................... 28 INTRODUCTION ............................................................................................................. 28 MODELLING SOFTWARE .............................................................................................. 28 MODELLING APPROACH .............................................................................................. 29 TOPOGRAPHIC DATA ................................................................................................... 29 REPRESENTATION OF FLOODPLAINS ....................................................................... 31 2D FLOW MODELLING .................................................................................................. 35 DOWNSTREAM BOUNDARY ........................................................................................ 39 HYDRAULIC CONTROL STRUCTURES ....................................................................... 41 DESIGN RUNS ............................................................................................................... 43
4 Flood Mapping ............................................................................................................... 48 INTRODUCTION ............................................................................................................. 48 INFOWORKS RS FLOOD MAPPING SET-UP ............................................................... 48 FLOOD EXTENT GENERATION .................................................................................... 48 MANUAL EDITING OF FLOOD EXTENTS .................................................................... 49 QUALITY ASSURANCE CHECKING ............................................................................. 52 KNOWN ISSUES WITH THE FLOOD MAPPING ........................................................... 52
5 Sensitivity Analysis ...................................................................................................... 56 INTRODUCTION ............................................................................................................. 56 MODEL SET-UP ............................................................................................................. 56 SIMULATIONS AND RESULTS...................................................................................... 56
6 Standard of Protection Analysis ................................................................................. 62 INDICATIVE STANDARD OF PROTECTION ................................................................ 62 CURRENT BANK TOP ANNUAL EXCEEDANCE PROBABILITY ................................. 63 FREEBOARD ANALYSIS ............................................................................................... 63
7 Conclusions ................................................................................................................... 68 SUMMARY ...................................................................................................................... 68 RECOMMENDATIONS ................................................................................................... 69 CONCLUSIONS .............................................................................................................. 70
Appendix A – Barlings Eau Pre-Feasibility ............................................................................. 74
Appendix B - Lower Witham Peak Flows - Defended ............................................................ 90
Appendix C - Lower Witham Peak Water Levels - Defended ................................................ 92
Appendix D - Lower Witham Long Sections - Defended ....................................................... 94
Appendix E - Lower Witham Sensitivity Analysis – Defended ............................................. 96
Appendix F - Lower Witham Freeboard AEP & SoP Analysis – Defended .......................... 98
Table of Contents


Introduction

This page is left blank intentionally

AECOM Witham Catchment Flood Map Improvements – Phase 2 4
PROJECT BACKGROUND
1.1 AECOM (formerly Faber Maunsell) was commissioned by the Environment Agency – Anglian
Region to undertake a series of studies to determine flood map improvements and map areas
benefiting from defences for the River Witham catchment. Phase 2 of the Witham Flood Map
Improvements (FMI) project is concerned with the Lower Witham catchment (watercourses
downstream of Lincoln), including the River Bain, Barlings Eau/Stainfield Beck, River Slea and
South Forty Foot sub-catchments. This report documents the methodology for determination of
flood map improvements in the Lower Witham catchment, excluding the River Bain1 and South
Forty-Foot sub-catchments which were modelled and mapped separately.
1.2 An existing InfoWorks RS (IWRS) hydraulic model of the Lower Witham was constructed
previously by Faber Maunsell under the Witham Catchment Strategic Model (WiCSM)
commission. This model build included all Environment Agency main river channels in the
Lower Witham catchment, including the Barlings Eau, Stainfield Beck and River Slea. The
model was calibrated to the November 2000 and February 2001 events.
1.3 This report explains the methodology and approach undertaken in order to develop the Lower
Witham WiCSM parent model for the purposes of producing improved flood outlines. The
development of the model involved three key elements:
� Development of design hydrology for a suite of return periods up to the 0.1% AEP event;
� Development of the hydraulic model to contain all flow up to the 0.1% AEP event plus climate
change;
� Development of the flood mapping model within IWRS.
1.4 The development of the design flood hydrology used in the hydraulic modelling was undertaken
at the start of the project, and an interim hydrology report was issued to the Environment
Agency for approval. This report (Volume 1) provides a summary of the design flood hydrology,
whilst the full interim hydrology report has been finalised to form Volume 2.
1.5 As well as flood map improvements, the scope of work for the Lower Witham study included a
summer sensitivity analysis, freeboard analysis, standard of protection assessment and a
preliminary hydraulic analysis for a pre-feasibility study in the Barlings Eau catchment. The
sensitivity analyses, standard of protection assessment and freeboard analysis are presented in
this document. The preliminary analysis for the pre-feasibility study was originally presented to
the Environment Agency as an interim technical note in April 2009. A copy of this technical
note is included in Appendix A of this report.
1.6 It should be noted that the flood mapping produced by this study downstream of Coningsby
supersedes the mapping produced for this area by the River Bain Flood Map Improvements
study. This is because the latter did not fully account for the interaction between the Lower
Witham floodplains and the River Bain, and the fact that more accurate 2D modelling of flow
paths was undertaken in this location for the Lower Witham study.
1 Witham Catchment Flood Map Improvements, Faber Maunsell, River Bain: Volume 1 –
Modelling and Flood Mapping Report, Environment Agency, March 2009
1 Introduction

AECOM Witham Catchment Flood Map Improvements – Phase 2 5
LOWER WITHAM CATCHMENT DESCRIPTION
1.7 The Lower Witham sub-catchment is located in the central part of the wider Witham catchment
as shown in Figure 1.1.
Figure 1.1: Catchment Location Plan

AECOM Witham Catchment Flood Map Improvements – Phase 2 6
1.8 The primary watercourses of the Lower Witham catchment are:
� River Witham/Old River Witham
� South Delph
� River Bain/Horncastle Canal
� Barlings Eau and Welton Beck
� Stainfield Beck
� Duckpool Drain
� Snakeholme Drain
� Heighington Beck
� Heighington Catchwater / Washingborough Roadside North &South
� River Slea / Kyme Eau
� Billinghay Skirth
� Car Dyke and Delphs drainage system
� Dorrington and Farroway drainage system
� Leasingham Beck
� Ruskington Beck
1.9 All of the above watercourses are classified as Environment Agency main river and are
therefore included in the hydraulic model, together with a number of other minor tributaries
which are also classified as main river. In addition, the model was extended at the Environment
Agency’s request, to include the following non-main river reach:
� Ruskington Beck (Upper Reaches, chainage 1526m to 4919m)
The network of land drains within the Lower Witham catchment are not explicitly modelled but
contribute flow to Internal Drainage Board (IDB) pumping stations, which are represented in the
model.
1.10 The principal watercourse in the Lower Witham catchment is the River Witham, which flows
between the city of Lincoln at the upstream limit and the major town of Boston at the
downstream limit. The other main towns in the Lower Witham catchment are Sleaford,
Woodhall Spa and Tattershall with smaller communities scattered throughout the study area.
1.11 The Lower Witham catchment is a complex river system in which the Lower River Witham acts
as a central spine into which a series of natural and engineered channels contribute flow. The
system is complicated further by a network of pumped IDB drains, draining the surrounding
lowland fens via a network of 26 pumping stations. Operated by the Witham First IDB and
Witham Third IDB, these pumping stations also contribute significant flow in the system. The
lowland fens are mainly rural with a significant number of villages and farms. The main land use
is arable farming.
1.12 The Lower Witham catchment as defined by the extents of the Lower Witham sub-model has a
total area of 995 km2. This includes the subcatchment areas associated with the modelled
inflows from the River Slea and Barlings Eau, but excludes the catchment areas of the Upper
Witham and River Bain. There are in excess of 260 km of modelled watercourses within the
Lower Witham sub model.
1.13 The Lower Witham model commences immediately downstream of Lincoln, with the River
Witham and South Delph water courses running east in parallel towards Branston Island.
Upstream of Branston Island, the River Witham splits, with the course of the Old River Witham
looping to the east and the engineered River Witham continuing south. The Barlings Eau sub-
catchment drains into the Old River Witham to the north of Branston Island, with the combined
flow continuing round the Old Witham loop to rejoin the engineered River Witham and South
Delph downstream of Bardney Lock. The River Witham then flows south-east, collecting major

AECOM Witham Catchment Flood Map Improvements – Phase 2 7
inflows from the Rivers Bain and Slea (Kyme Eau), eventually discharging into the tidal River
Haven via a gravity sluice (Grand Sluice) in Boston.
1.14 The land to the west of the River Witham is drained into the main channel by via number of
‘Delphs’ entering the Witham at right angles. The Delphs are engineered drainage channels
conveying flow from Car Dyke, which runs parallel to the River Witham and intercepts runoff
from the ‘Heath’ catchment further to the west. Towards the southern end of the Heath,
Billinghay Skirth also takes flow from the downstream end of Car Dyke to supplement its
primary flow from the Farroway Drain/Dorrington Dyke pumped drainage system.
1.15 A number of additional tributaries also provide significant inputs into the Lower Witham system.
Stainfield Beck drains into the Barlings Eau catchment approximately 2km upstream of the
confluence with the Old River Witham. Snakeholme Drain also flows into the Old River Witham,
approximately 0.5km downstream of the confluence with Barlings Eau. Eight kilometres
downstream of Branston Island, Duckpool Drain enters the River Witham from the east.
1.16 The Lower Witham catchment lies to the east of a ridge of limestone running north-south
through Lincoln. Immediately to the east of this ridge, the solid geology is Oxford Clay and
Kellaway Sands, which underlies the Barlings Eau, River Slea and ‘Heath’ subcatchments. The
remaining subcatchments that lie further east still are underlain by Ampthill Clay, Kimmeridge
Clay and Corallian (Clay and Limestone).
1.17 The mudstone and clay areas of the catchment are not very permeable, and as a result cannot
store large quantities of water. Consequently these areas will generate runoff and lead to high
river flows which can pose a flood risk. The limestone and chalk areas of the catchment are
more permeable than the mudstone and clay, and do absorb and store rainwater thereby
reducing the flood risk. Most groundwater is therefore located in the limestone and chalk areas.
1.18 The extent of water absorbed and stored by the solid geology is also influenced by the soil
moisture conditions at the time. When storage is limited by high soil moisture content, i.e.
following long-term wet weather (as in 2000), the runoff rate is higher. This can result in the
water stored within the geology emerging as base flow in streams and rivers, or as springs.
High groundwater levels have been experienced in limestone areas of the Lower Witham
catchment, specifically between Heighington and Sleaford, and can pose an increased flood
risk.
1.19 Drift geology in the Barlings Eau subcatchment consists predominantly of till while the fen areas
in the south-east are comprised of alluvium and peat. Most of the watercourses flow across
areas of alluvium or river terrace deposits. Groundwater flow through the peat is slow; most of
the groundwater flow will be through the till and alluvium, although how quickly it flows is
dependent on the amount of fine material.
1.20 In the west where there is little drift geology and there is less material to store rainfall.
Therefore runoff into rivers is encouraged, causing high river flows. In contrast peat is capable
of storing large volumes of rainfall and would slow the speed with which water gets into the river
channels.
1.21 The average annual rainfall varies across the Lower Witham catchment between 578 and
631mm of rainfall per year. The highest average rainfall of 631mm per year occurs over the
upland areas of the Stainfield Beck catchment. Rainfall totals decrease to 578mm per year in
the ‘Heath’ parts of the Lower Witham catchment, close to Digby and Scopwick. These
average annual rainfall figures are particularly low for the United Kingdom. The average annual
rainfall for the UK is typically 900 – 1000mm per year, consequently the Lower Witham is
classified as a ‘dry catchment’.
SCOPE OF STUDY & KEY OUTPUTS
1.22 The scope of the study covers the following items, all of which are documented in this report
unless otherwise stated:
� Development of design hydrology for the following return periods: 50%, 20%, 10%, 5%, 4%,
2%, 1.33%, 1%, 0.5% and 0.1% Annual Exceedance Probability (AEP) events, as well as the

AECOM Witham Catchment Flood Map Improvements – Phase 2 8
1% and 0.1% AEP events representing climate change (for 2115) based on current DEFRA
guidance;
� Development of the InfoWorks RS hydraulic model (with defences) to contain all flow up to
the 0.1% AEP event plus climate change;
� Development of the flood mapping model within IWRS;
� Model simulations and flood mapping for the ‘with defences’ case for the full suite of design
hydrology;
� Model simulations and flood mapping for the ’without defences’ case for 1% and 0.1% AEP
events, with and without climate change (To be reported separately, see 1.25 below);
� Determination of Areas Benefiting from Defences (ABDs) for the 1% AEP event by
comparison the ‘with defences’ and ‘without defences’ flood mapping (To be reported
separately, see 1.25 below);
� Model simulations of sensitivity scenarios as advised by the Environment Agency;
� Analysis of the actual and indicative Standard of Protection (SoP) and Annual Exceedance
Probability (AEP) for all modelled watercourses;
� Analysis of freeboard requirements for all modelled watercourses;
� Preliminary analysis in preparation of a pre-feasibility study in the Barlings Eau catchment.
1.23 The following items are the key deliverables for the Lower Witham flood map improvements
study:
� Defended flood extents in ArcGIS .shp format for the 50%, 20%, 10%, 5%, 4%, 2%, 1.33%,
1%, 0.5%, 0.1%, 1%+climate change and 0.1%+climate change AEP events;
� Undefended flood extents in ArcGIS .shp format for the 1%, 0.1%, 1%+climate change and
0.1%+climate change AEP events;
� Areas Benefiting from Defences ArcGIS .shp format polygon for the 1% AEP event;
� Tabulated results (peak levels and flows) for the ‘with defences’ scenario all return periods,
plus long sections for all lengths of modelled channel;
� An ArcGIS .shp format file identifying those defences with a shortfall in SoP within the Lower
Witham catchment, plus tabulated results of the freeboard analysis;
� InfoWorks RS models and results files for the Lower Witham Catchment as used in the
derivation of the above outputs;
� A Technical Report.
1.24 The following are provided as additional to the key deliverables detailed in the brief:
� Tabulated results identifying the Annual Exceedance Probability of overtopping at each
cross-section within the model.
Undefended Modelling and Mapping
1.25 At an early stage in the project AECOM identified the possibility of using a TUFLOW 2D model
to generate the undefended mapping for the Lower Witham, South Forty Foot, and Stonebridge
catchments. This approach sought to overcome the potential problems of 1D modelling of the
undefended scenario such as model stability and interaction of flows between the three sub-
catchments. Following discussions with the Environment Agency, it was agreed that this
TUFLOW 2D approach would be appropriate and that the undefended modelling, flood mapping
and derivation of areas benefitting from defences would be presented separately in a
standalone report covering all three sub-catchments.

AECOM Witham Catchment Flood Map Improvements – Phase 2 9
This page is left blank intentionally

Hydrology

This page is left blank intentionally

AECOM Witham Catchment Flood Map Improvements – Phase 2 12
INTRODUCTION
2.1 The first step in producing design flood mapping is to derive estimates of the magnitude of
extreme flood events, in order to generate flows to drive the hydraulic model.
2.2 The hydrological assessment was carried out prior to the commencement of the hydraulic
modelling and flood mapping aspects of this project, and delivered to the Environment Agency
in the form of an Interim Hydrology Report 2
. A revised version of this report, incorporating
changes as a result of comments provided by the Environment Agency, is provided as Volume
2 of the Final Report3.
2.3 A brief summary of the hydrological assessment is provided below. Any changes to the
methods used, along with any finalisations that were not covered in the Interim Hydrology
Report, are additionally detailed.
HYDROLOGICAL MODELLING
2.4 The Lower Witham catchment has previously been divided into subcatchments as part of the
Witham Catchment Strategic Model (WiCSM) commission. The majority of these
subcatchments were unaltered following review. However, there were some exceptions:
� The boundaries of the Queen Dyke (LW_QD) and Metheringham Delph (LW_MD)
subcatchments were adjusted following review against the FEH CD-ROM v2. This resulted
in a larger, elongated subcatchment associated with LW_MD. Catchment descriptors were
updated accordingly.
� No subcatchments previously existed for Heighington Catchwater. The FEH CD-ROM
defined the area that bounded such that it lies between the Sandhill Beck pumped
subcatchment to the north (LW_Sandhill Beck) and the Heighington Beck catchment to the
south (LW_HI).
� A review of Anglian Water sewer plans and information from the Environment Agency
indicated that only the eastern part of the previously defined Heighington catchwater
catchment actually drains to Heighington Catchwater, whilst the western part drains under
Washingborough Road into the Sandhill Beck IDB catchment. Therefore the Heighington
Catchwater subcatchment was split into two parts – LW_HCW_1 to the east and
LW_HCW_2 to the west.
2.5 Initially, hydrometric data was collated for the Lower Witham catchment which was used to
develop the hydrological models. This included gauging station details (including theoretical
rating equations), level and flow data, rainfall data and soil moisture deficit (MORECS) data. A
complete historical review was also undertaken to provide guidance during the flood estimation
process.
2.6 A complete review of the available flow gauging stations was carried out in order to determine
their potential use in statistical flood frequency analysis. Six gauging stations were deemed
suitable enough to estimate QMED from their records, and to also use in developing growth
curves.
2.7 The six level and flow gauging stations providing information on river flows are listed in Table
2.1 with a summary of the type of gauge.
2 Faber Maunsell (2008) Witham Flood Map Improvements – Phase 2, Lower Witham - Hydrology Report.
3AECOM (2009) Witham Catchment Flood Map Improvements – Phase 2, Lower Witham: Volume 2 -
Hydrology Report
2 Hydrology
AECOM Witham Catchment Flood Map Improvements – Phase 2 13
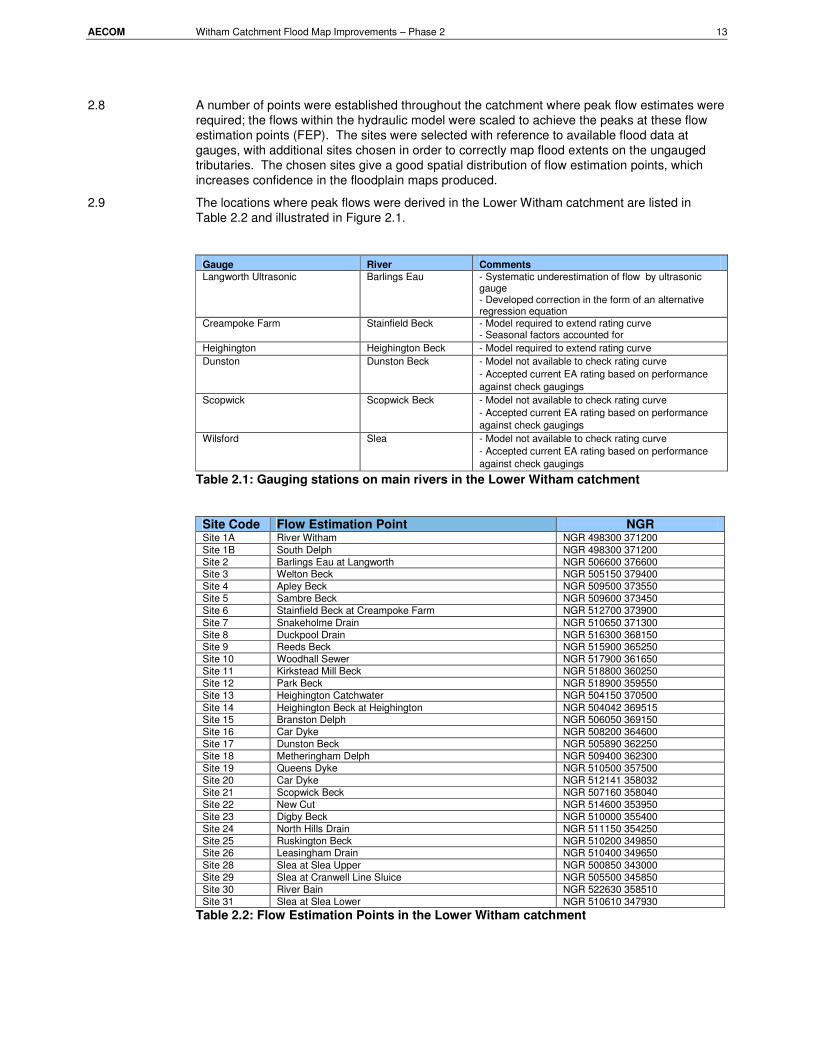
2.8 A number of points were established throughout the catchment where peak flow estimates were
required; the flows within the hydraulic model were scaled to achieve the peaks at these flow
estimation points (FEP). The sites were selected with reference to available flood data at
gauges, with additional sites chosen in order to correctly map flood extents on the ungauged
tributaries. The chosen sites give a good spatial distribution of flow estimation points, which
increases confidence in the floodplain maps produced.
2.9 The locations where peak flows were derived in the Lower Witham catchment are listed in
Table 2.2 and illustrated in Figure 2.1.
Gauge River Comments
Langworth Ultrasonic Barlings Eau - Systematic underestimation of flow by ultrasonic gauge - Developed correction in the form of an alternative regression equation
Creampoke Farm Stainfield Beck - Model required to extend rating curve - Seasonal factors accounted for
Heighington Heighington Beck - Model required to extend rating curve
Dunston Dunston Beck - Model not available to check rating curve
- Accepted current EA rating based on performance
against check gaugings
Scopwick Scopwick Beck - Model not available to check rating curve
- Accepted current EA rating based on performance
against check gaugings
Wilsford Slea - Model not available to check rating curve
- Accepted current EA rating based on performance
against check gaugings
Table 2.1: Gauging stations on main rivers in the Lower Witham catchment
Site Code Flow Estimation Point NGR Site 1A River Witham NGR 498300 371200
Site 1B South Delph NGR 498300 371200
Site 2 Barlings Eau at Langworth NGR 506600 376600 Site 3 Welton Beck NGR 505150 379400
Site 4 Apley Beck NGR 509500 373550
Site 5 Sambre Beck NGR 509600 373450
Site 6 Stainfield Beck at Creampoke Farm NGR 512700 373900
Site 7 Snakeholme Drain NGR 510650 371300
Site 8 Duckpool Drain NGR 516300 368150 Site 9 Reeds Beck NGR 515900 365250
Site 10 Woodhall Sewer NGR 517900 361650
Site 11 Kirkstead Mill Beck NGR 518800 360250
Site 12 Park Beck NGR 518900 359550
Site 13 Heighington Catchwater NGR 504150 370500
Site 14 Heighington Beck at Heighington NGR 504042 369515 Site 15 Branston Delph NGR 506050 369150
Site 16 Car Dyke NGR 508200 364600
Site 17 Dunston Beck NGR 505890 362250
Site 18 Metheringham Delph NGR 509400 362300
Site 19 Queens Dyke NGR 510500 357500
Site 20 Car Dyke NGR 512141 358032
Site 21 Scopwick Beck NGR 507160 358040
Site 22 New Cut NGR 514600 353950
Site 23 Digby Beck NGR 510000 355400
Site 24 North Hills Drain NGR 511150 354250
Site 25 Ruskington Beck NGR 510200 349850 Site 26 Leasingham Drain NGR 510400 349650
Site 28 Slea at Slea Upper NGR 500850 343000
Site 29 Slea at Cranwell Line Sluice NGR 505500 345850
Site 30 River Bain NGR 522630 358510
Site 31 Slea at Slea Lower NGR 510610 347930
Table 2.2: Flow Estimation Points in the Lower Witham catchment

AECOM Witham Catchment Flood Map Improvements – Phase 2 14
Figure 2.1: Flow Estimation Points in the Lower Witham Catchment

AECOM Witham Catchment Flood Map Improvements – Phase 2 15
Estimation of peak flows
2.10 Sites 1A, 1B and 30 were termed flow estimation points in that they required input of the correct
design flows. However, as they are major tributary inflows derived from other Witham Flood
Map Improvement project models, the flows from them were determined prior to the
development of the Lower Witham design event hydrological models. The sites were added to
the Lower Witham FMI model as Flow-Time boundaries, based on the flow outputs from the
relevant upstream models.
2.11 It was previously stated that the Heighington Catchwater subcatchment had been subdivided
further into eastern (LW_HCW_1) and western (LW_HCW_2) parts. However, no flow
estimation point or subsequent boundary unit was created for LW_HCW_2. This was because
the runoff generated from this subcatchment was accounted for in the scaling factor derived for
the pumped subcatchment of Sandhill Beck (LW_Sandhill Beck) since the two subcatchments
are hydraulically connected. The only boundary unit created for Heighington Catchwater was
termed site 13, and exclusively represents the runoff generated from LW_HCW_1.
2.12 The Lower Witham Hydrology Report2
stated that Site 27 – Slea at Wilsford would be a flow
estimation point. Subsequent review of the hydraulic model has revealed that this site is not on
the modelled reach, and it has therefore been removed.
2.13 Site 31 – Slea at Slea Lower is a flow estimation point that was added during the development
of the hydrological model in conjunction with the hydraulic model development. The Slea at
Slea Lower is a relatively impermeable sub-catchment of the Slea. Being relatively
impermeable, this subcatchment peaks earlier than the rest of the Slea catchment, and it was
decided that it would be appropriate to derive a peak flow estimate for it. Further explanation is
provided in Section 2.30 below.
2.14 A subcatchment within the Lower Witham system (model subcatchment LW_HC contributing
flow to ‘Gibsons Cut’) that was delineated during the development of the Lower Witham
Strategic Model has not been assigned a flow estimation point. This is because the
subcatchment is too small for application of the FEH statistical method. An unscaled FEH/FSR
rainfall-runoff model was applied to this subcatchment – this was considered acceptable as the
volume generated from this would be precautionary but would still be a negligible addition to the
overall volume in the Lower Witham.
2.15 An estimate of QMED at each site was made using standard FEH methods. For all sites, a
pooled growth curve was generated either by creating a pooling group at that site, or by
transferring a pooled growth curve from a suitable gauged analogue site within the Lower
Witham catchment. Consequently, a pooled flood frequency curve was generated at each FEP.
At the six gauged sites on the Lower Witham, single site flood frequency curves were also
generated as alternatives. The final choice of peak flood estimates was based on knowledge
about flow and recurrence as determined from the historical record. For the majority of sites,
the pooled flood frequency curve estimates were used. The only exception was for Heighington
at Heighington Beck, where the single site growth curve was found to be more appropriate.
This was due to a combination of the urbanisation and permeability of the site. The final peak
flow estimates are provided in Table 2.3.
2.16 Estimation of peak flows for the 0.1% AEP event used a hybrid approach combining statistical
and rainfall-runoff methods, and the final peak flow estimates are also provided in Table 2.3.
Full details are given in the Lower Witham: Volume 2 – Hydrology Report3.

AECOM Witham Catchment Flood Map Improvements – Phase 2 16
FES Annual Exceedance Probability (%)
50% 20% 10% 5% 4% 2% 1.33% 1% 1% CC 0.5% 0.1% 0.1% CC
Site 1A 35.4 29.5 29.3 n/a 30.6 32.6 33.0 33.8 35.2 34.8 37.1 37.6
Site 1B 33.1 26.9 27.2 n/a 28.2 29.9 30.6 30.6 33.6 32.2 36.1 37.1
Site 2 22.7 30.8 35.7 40.3 41.7 46.2 48.8 50.6 60.7 55.1 89.3 107.2
Site 3 0.8 1.2 1.4 1.6 1.7 1.9 2.0 2.2 2.6 2.4 6.0 7.2
Site 4 3.4 5.0 6.1 7.3 7.6 8.8 9.6 10.1 12.1 11.5 18.1 21.7
Site 5 2.2 3.3 4.0 4.7 4.9 5.7 6.2 6.6 7.9 7.4 11.8 14.1
Site 6 6.9 10.3 12.6 14.9 15.6 18.1 19.6 20.7 24.8 23.4 37.1 44.6
Site 7 7.7 11.6 14.2 16.8 17.6 20.4 22.1 23.4 28.0 26.6 41.8 50.1
Site 8 5.4 8.1 9.8 11.6 12.2 14.2 15.3 16.2 19.5 18.4 29.5 35.4
Site 9 2.1 3.2 3.9 4.6 4.8 5.6 6.0 6.4 7.7 7.3 11.7 14.1
Site 10 1.4 2.2 2.7 3.2 3.3 3.8 4.2 4.4 5.3 5.0 8.3 9.9
Site 11 0.2 0.3 0.3 0.4 0.4 0.5 0.5 0.6 0.7 0.6 1.1 1.3
Site 12 1.1 1.7 2.0 2.4 2.5 2.9 3.2 3.3 4.0 3.8 6.2 7.5
Site 13 0.2 0.6 0.9 1.2 1.3 1.8 2.1 2.4 2.9 3.3 6.1 7.3
Site 14 0.6 1.5 2.0 2.7 3.0 4.0 4.8 5.5 6.6 7.6 17.1 20.5
Site 15 0.8 1.0 1.2 1.4 1.4 1.6 1.8 1.8 2.2 2.1 3.9 4.6
Site 16 1.3 1.8 2.1 2.4 2.5 2.8 3.0 3.2 3.8 3.6 6.5 7.8
Site 17 1.1 1.4 1.7 1.9 2.0 2.3 2.5 2.6 3.1 2.9 7.4 8.9
Site 18 0.9 1.1 1.3 1.5 1.6 1.8 2.0 2.1 2.5 2.3 6.0 7.2
Site 19 1.6 2.4 3.0 3.5 3.7 4.3 4.7 4.9 5.9 5.6 9.0 10.7
Site 20 1.0 1.6 1.9 2.3 2.4 2.8 3.0 3.2 3.8 3.6 6.9 8.3
Site 21 0.5 0.6 0.8 0.9 0.9 1.0 1.1 1.2 1.4 1.3 3.4 4.1
Site 22 0.7 1.0 1.2 1.5 1.6 1.8 1.9 2.1 2.5 2.3 3.7 4.5
Site 23 1.1 1.5 1.7 2.0 2.0 2.3 2.5 2.6 3.2 3.0 7.6 9.2
Site 24 2.2 3.4 4.1 4.9 5.1 5.9 6.4 6.8 8.1 7.7 12.4 14.9
Site 25 1.3 2.0 2.3 2.7 2.8 3.2 3.4 3.6 4.3 4.0 10.5 12.6
Site 26 1.3 1.7 2.0 2.3 2.4 2.8 3.0 3.1 3.8 3.5 8.8 10.6
Site 28 0.3 0.3 0.4 0.5 0.5 0.6 0.6 0.6 0.7 0.7 1.8 2.1
Site 29 2.0 2.8 3.2 3.6 3.8 4.5 4.7 5.0 6.0 5.5 13.7 16.5
Site 30* 17.6 24.1 29.6 35.9 38.5 41.8 50.6 55.2 66.2 66.4 120.4 141.6
Site 31 0.5 0.8 1.0 1.2 1.3 1.5 1.6 1.7 2.0 1.9 5.2 6.2
Table 2.3: Design flow (m3s
-1) estimates at the Flood Estimation Points
*Note that the peak flow from the River Bain is totalled from the channel section and corresponding floodplain sections
Generation of hydrographs – direct runoff dominated gravity subcatchments
2.17 The generation of design event hydrographs for direct runoff dominated gravity subcatchments
was made using the FSR/FEH rainfall-runoff method. Full details regarding the choice of this
method are given in the Final Report - Volume 2. Analysis of hydrometric data from gauged
direct runoff dominated gravity subcatchments in the Lower Witham catchment provided design
values of the time-to-peak parameter and the Catchment Wetness Index parameter. These
were incorporated into the FSR/FEH rainfall-runoff model prior to scaling the hydrographs to the
statistical flows. Full details regarding the estimation of these parameters are given in the Final
Report - Volume 2.
Generation of hydrographs – pumped subcatchments
2.18 The generation of design event hydrographs for pumped subcatchments was made using the
FSR/FEH rainfall-runoff method. These boundaries were scaled by a factor derived by analysis
of pumped volumes during observed events. Full details of this method are given in the Final
Report - Volume 2. The unit hydrograph and time-to-peak values for the pumped
subcatchments were set based on the method described by Samuels (1993)4
4 Samuels, P.G., (1993). The Hydraulics and Hydrology of Pumepd Drainage Systems, An
Engineering Guide, HR Wallingford Report SR 331, MAFF

AECOM Witham Catchment Flood Map Improvements – Phase 2 17
Generation of hydrographs – groundwater dominated gravity subcatchments
2.19 The generation of design event hydrographs for groundwater dominated gravity subcatchments
was made using an alternative method which derives a typical hydrograph shape from
observed events, as set out by Archer et al. (2000)5. Full details regarding the choice of this
method, and an outline of its basic application, are given in the Final Report - Volume 2
(Chapter 6). However, during the development of the hydrological model in combination with
the hydraulic model, some limitations in the method were uncovered and a number of
adaptations were made. These are discussed in the following paragraphs.
2.20 As stated in the Final Report - Volume 2, the typical hydrograph shape is derived by combining
observed hydrographs from events recorded by the gauging stations of the groundwater
dominated subcatchments. The output is dimensionless as it was necessary to remove the
effect of magnitude from the source observed events. The output at Dunston gauge is given in
Figure 2.2.
Figure 2.2: Dimensionless hydrograph following hydrograph shape analysis at Dunston Beck gauging station
2.21 This output raised a number of issues:
� If the observed events are relatively small, then the ratio of the starting and end flow /
baseflow to the peak will be relatively large;
� Additionally, due to the need to centralise the peaks of the source observed hydrographs,
and the varying time bases of the events themselves, the rising and falling limbs of the
dimensionless typical hydrographs are truncated;
� The method states that to generate a design hydrograph, the ordinate/ratio at each time
interval is multiplied by the required peak flow. Therefore, for rarer events, the starting and
end flow / baseflow is significantly larger than for less rare events;
� If the starting and end flow / baseflow of the design hydrograph from the permeable
catchments is greater than the flow at which spilling into storage areas occurs, then these
storage areas will fill earlier than expected, and continue to fill at the end of the event,
potentially causing unrealistic flood extents.
A series of adaptations were applied to overcome the issues stated above.
5 Archer, D., Foster, M., Faulkner, D. and Mawdsley, J. (2000) The synthesis of design flood hydrographs.
In: Proc. ICE/CIWEM Conf. Flooding – Risks and Reactions. Terrace Dalton, London

AECOM Witham Catchment Flood Map Improvements – Phase 2 18
2.22 The first issue to address was the truncation of the rising limb. The truncation removes the lead
in period where hydrograph is rising from the baseflow condition. To overcome this, the
average time of the peak flow from the observed hydrographs was calculated at each gauge.
The typical dimensionless hydrograph was then shifted along the time axis, causing the initial
ordinate to become applicable at a time beyond that of 0 hours. This is shown in Figure 2.3.
Figure 2.3: Dimensionless hydrograph at Dunston Beck gauging station following lateral shift
2.23 The second issue then becomes the lack of a complete lead-in section to the typical
dimensionless hydrograph. In the hydraulic model, each subcatchment has a separate flow
component required to ensure the model will start. Therefore all event inflows should
commence at zero flow. In reality, the separate flow component is not necessarily equal to the
baseflow, so consideration was given to what the more typical baseflow value would be in the
groundwater dominated subcatchments. This was done by calculating the average ratio of
initial to peak flow from the observed events at each gauge. The typical hydrograph was then
ramped up to this ratio (ordinate) after the first 10 hours, as seen in Figure 2.4.

AECOM Witham Catchment Flood Map Improvements – Phase 2 19
Figure 2.4: Dimensionless hydrograph at Dunston Beck gauging station with lead in sections added based on proposed method
2.24 The final issue is that the falling limb needs to be extended to an ordinate that will not cause
spilling at the highest return period event at the end of the event. To do this, the falling limb
was extrapolated based on the gradient over the final few hours of the existing falling limb, to an
ordinate at which the channel would not be spilling during the 0.1% AEP plus climate change
event. Figure 2.5 shows the extrapolated falling limb.
Figure 2.5: Dimensionless hydrograph at Dunston Beck gauging station showing extrapolation of falling limb

AECOM Witham Catchment Flood Map Improvements – Phase 2 20
2.25 These adaptations provide an appropriate inflow hydrograph from the groundwater dominated
subcatchments of Dunston Beck and Heighington Beck (and the subcatchments to which they
provide analogue hydrograph shapes to). They have retained the typical shape derived from
the application of the basic method, whilst using information from the observed data to extend
the rising and falling limbs.
2.26 For the groundwater dominated subcatchments of Scopwick Beck and the Slea at Wilsford,
further adaptation was needed because the falling limb of the typical hydrographs did not
recede at a rate suitable to apply the extrapolation step. This is apparent in Figure 2.6, where
the extrapolation has been applied to 600 hours and yet is only at an ordinate of 0.8.
Figure 2.6: Dimensionless hydrograph at Scopwick Beck gauging station showing how extrapolation of falling limb does not cause reduction to a suitably low ordinate within an appropriate time period
2.27 In order to overcome this issue, the time taken to return to the starting ordinate was calculated
for each observed event, based on the standard extrapolation process described previously.
An average value was obtained, and it was assumed that the hydrograph would return to zero
over this time period. An amalgamation of the extrapolated falling limb and the extension to
zero at the calculated time base was made, resulting in an appropriate hydrograph to apply in
the design event scenarios., as shown in Figure 2.7

AECOM Witham Catchment Flood Map Improvements – Phase 2 21
Figure 2.7: Dimensionless hydrograph at Scopwick Beck gauging station showing how extrapolated falling limb was reduced to zero over calculated average time base
2.28 In summary, the typical hydrograph method as proposed by Archer et al. (2000)5 was deemed
to be the most appropriate approach for deriving hydrograph shapes in groundwater dominated
subcatchments of the Lower Witham catchment. However, it has limitations which mean the
user must apply it with necessary adaptations. The most significant limitations result from the
following factors:
� The number of observed events available from which to derive the typical hydrograph may be
limited, and are often not of a magnitude close to that of the rarer AEP events;
� Very few observed events result from a single design profile storm of consistent duration and
similar antecedent conditions.
2.29 The adaptations that have been applied as described above are considered to be appropriate to
the requirements of this study.
Slea hydrological inputs
2.30 The hydrological model for the Slea catchment (including Ruskington Beck and Leasingham
Drain) was previously developed and described in the Final Hydrology Report2. In summary,
two FEPs were identified on the River Slea itself – one at the upstream limit and one
immediately upstream of Cranwell Line Sluice – and on the Ruskington Beck and Leasingham
Beck watercourses (both at the downstream limits of these reaches).
2.31 The Slea catchment was subdivided into five subcatchments – one each for Ruskington Beck
and Leasingham Beck, and an upper, middle and lower subcatchment for the River Slea. The
Ruskington Beck, Leasingham Beck and upper Slea subcatchments were expected to be
scaled directly and the middle Slea subcatchment scaled in order to achieve the correct peak
flow at Cranwell Line Sluice. All four of these subcatchments would have flow-time boundaries
to reflect their permeable nature. The lower Slea subcatchment was expected to include an
unscaled FEH/FSR rainfall-runoff boundary.
2.32 During the development of the hydraulic model in conjunction with the hydrological model, it
was found that using an unscaled inflow for the lower Slea subcatchment resulted in an

AECOM Witham Catchment Flood Map Improvements – Phase 2 22
unrealistically high peak flow which caused unrealistically precautionary flood extents. To
address this issue, an FEH statistical analysis was conducted to achieve a more realistic idea of
the peak flow that would be generated from the lower Slea subcatchment. The catchment
descriptors were compared with gauged sites in the Lower Witham catchment and it was
concluded that Stainfield Beck at Creampoke Farm was the most applicable site from which a
QMED transfer could be made. This site was also used as the donor for a pooling group and
hence growth curve.
2.33 The calculated peak flows for the lower Slea subcatchment are given in Table 2.4. Note that
the 0.1% AEP flows were derived using the hybrid method as described in the Final Hydrology
Report2.
AEP (%) 50 20 10 5 4 2 1.33 1 0.5 0.1
Flow (m3s
-1) 0.5 0.8 1.0 1.2 1.3 1.5 1.6 1.7 1.9 5.2
Table 2.4: Statistical peak flows from the lower Slea subcatchment (FEP 31)
Choice of storm duration
2.34 It was originally proposed that the design event model runs would need to be undertaken for a
maximum of three storm durations, reflecting how peak flows generated by a given return
period rainfall event are larger in the tributary subcatchments and upper reaches of the Lower
Witham catchment for short duration storms, and larger in the lower reaches of the Lower
Witham catchment for longer duration storms.
2.35 Investigations into the effect on peak flow of varying the duration of the storm concluded that
the 20.5 hour storm could be applied in all tributary subcatchments and still be within 5% of the
(unscaled) peak flow, as calculated for the critical duration of that particular subcatchment.
2.36 The critical duration on the River Witham within the Lower Witham catchment is highly
dependent on the critical durations of the subcatchments feeding it. The approximation formula
cited in FEH Volume 3 for determining the critical duration is less applicable for large, complex
catchments. This is particularly the case for the Lower Witham, where inputs from pumped
subcatchments, groundwater dominated subcatchments and direct runoff dominated
subcatchments are combined.
2.37 The critical duration on the River Witham through the lowland areas of the Lower Witham
catchment is more concerned with peak volume than peak flow. As the critical duration at
Lincoln in the Upper Witham catchment was 50 hours, and the critical duration in the Bain
catchment was 45.5 hours – both of which account for peak volumes in the system – it was
considered appropriate to choose a similar duration to apply in the Lower Witham catchment.
2.38 In order to consider the impact at any other storm duration, it would be necessary to run models
of the Upper Witham and Bain to obtain the appropriate inflows from these catchments.
However, this was outside the scope of the project.
2.39 Therefore, an average value of 48.5 hours was determined to be appropriate to the Lower
Witham catchment. This was only applicable to the FSR/FEH rainfall-runoff based inflows (i.e.
the pumped subcatchments and the direct runoff dominated subcatchments). It is not possible
to account for the storm duration within the method used to determine the inflows from the
groundwater dominated subcatchments, although it could be argued that the additional rainfall
volume generated from a longer event would result in greater groundwater recharge, with little
impact on the resulting flows to the main channel.
Upper Witham Inflows
2.40 It should be noted that there is a known inconsistency in the 50% AEP flow boundary inputs into
the Witham and South Delph at the upstream end of the model. The issue is that the 50% AEP
boundary has a slightly higher peak flow than most of the other modelled events of higher
magnitude. This issue is illustrated graphically in Figure 2.8. It can be seen that the flow from
for the 50% AEP event has a higher initial peak than much rarer events, although the peak is
relatively short-lived. The reason why this occurs is that for the Upper Witham FMI model runs,
the Witham washlands do not operate in the 50% AEP event, but do operate for rarer events.

AECOM Witham Catchment Flood Map Improvements – Phase 2 23
Figure 2.8: Inflow hydrograph from Upper Witham model at Stamp End
2.41 The discontinuity in peak flows at Stamp End is not reflected in the peak water levels; the 50%
AEP water level is the lowest of all modelled return periods as would be expected. This
discontinuity was discussed with the Environment Agency and it was concluded that this is a
possible and realistic scenario that could occur for an event in which the washlands were not
operable.
IWRS INFLOW BOUNDARIES
2.42 Following the development of the peak flow estimates and the decisions regarding the most
appropriate method to develop the design event hydrographs, the hydrological boundaries were
set up in InfoWorks RS.
2.43 For the groundwater dominated subcatchments, the inflow hydrographs were incorporated
within the model as Flow-Time boundaries. Application of a Flow-Time boundary in InfoWorks
RS combines a network based boundary data with the event based flow-time data. The
majority of Flow-Time boundaries had been scaled to the required statistical peak separately
from the InfoWorks RS model. The only exception was for the Slea – Middle subcatchment
(LW_S_SM). Firstly, this inflow boundary was divided equally into three components,
representing spring inflows to the main river (namely Cobbler’s, Boiling Wells and Guildhall).
Secondly, as the flow estimation point (site 29 – Slea at Cranwell Line Sluice) is on the main
river, it was necessary to perform trials with these inflows scaled until the required peak flow at
the estimation point was achieved.
2.44 For the direct runoff dominated and pumped subcatchments, the inflows were generated by
FSR/FEH Rainfall-Runoff boundaries. Application of the FSR/FEH Rainfall-Runoff model in
InfoWorks RS combines a network based boundary node (containing catchment descriptor and
unit hydrograph details) with an event based rainfall boundary (containing rainfall depth,
duration and profile details, return period specification, catchment wetness and baseflow
values, and the boundary scaling factor).
2.45 As the network based boundary node data is fixed and does not alter for different design
events, only the event based rainfall boundary information requires adjustment depending on
the design event being simulated.
AECOM Witham Catchment Flood Map Improvements – Phase 2 24
2.46 For each design event return period, a set of rainfall boundaries was developed (one for each
subcatchment) with the required design event parameters. All the pumped subcatchments had
fixed scaling factors irrespective of the event return period. The majority of the direct runoff
subcatchments were scaled for each return period separately from the InfoWorks RS model.
This was because they were either direct inputs to the model, or the modelled reach within the
subcatchment was of negligible length.
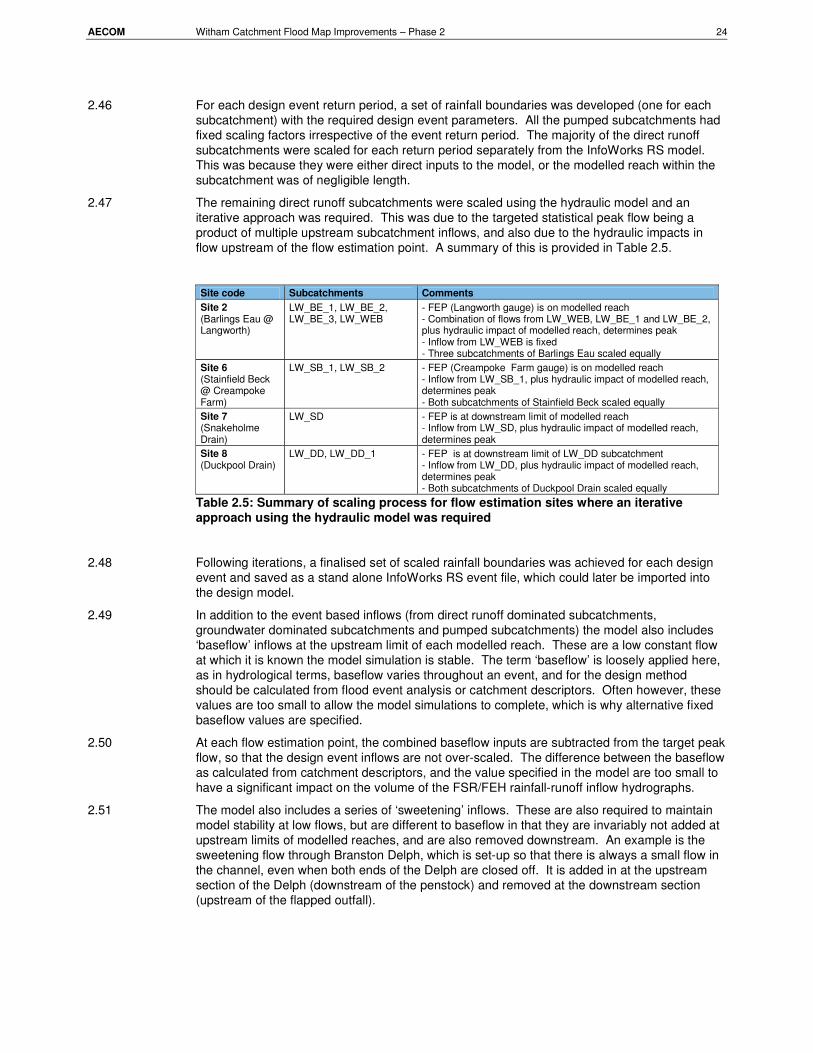
2.47 The remaining direct runoff subcatchments were scaled using the hydraulic model and an
iterative approach was required. This was due to the targeted statistical peak flow being a
product of multiple upstream subcatchment inflows, and also due to the hydraulic impacts in
flow upstream of the flow estimation point. A summary of this is provided in Table 2.5.
Site code Subcatchments Comments
Site 2 (Barlings Eau @ Langworth)
LW_BE_1, LW_BE_2, LW_BE_3, LW_WEB
- FEP (Langworth gauge) is on modelled reach - Combination of flows from LW_WEB, LW_BE_1 and LW_BE_2, plus hydraulic impact of modelled reach, determines peak - Inflow from LW_WEB is fixed - Three subcatchments of Barlings Eau scaled equally
Site 6 (Stainfield Beck @ Creampoke Farm)
LW_SB_1, LW_SB_2 - FEP (Creampoke Farm gauge) is on modelled reach - Inflow from LW_SB_1, plus hydraulic impact of modelled reach, determines peak - Both subcatchments of Stainfield Beck scaled equally
Site 7 (Snakeholme Drain)
LW_SD - FEP is at downstream limit of modelled reach - Inflow from LW_SD, plus hydraulic impact of modelled reach, determines peak
Site 8 (Duckpool Drain)
LW_DD, LW_DD_1 - FEP is at downstream limit of LW_DD subcatchment - Inflow from LW_DD, plus hydraulic impact of modelled reach, determines peak - Both subcatchments of Duckpool Drain scaled equally
Table 2.5: Summary of scaling process for flow estimation sites where an iterative approach using the hydraulic model was required
2.48 Following iterations, a finalised set of scaled rainfall boundaries was achieved for each design
event and saved as a stand alone InfoWorks RS event file, which could later be imported into
the design model.
2.49 In addition to the event based inflows (from direct runoff dominated subcatchments,
groundwater dominated subcatchments and pumped subcatchments) the model also includes
‘baseflow’ inflows at the upstream limit of each modelled reach. These are a low constant flow
at which it is known the model simulation is stable. The term ‘baseflow’ is loosely applied here,
as in hydrological terms, baseflow varies throughout an event, and for the design method
should be calculated from flood event analysis or catchment descriptors. Often however, these
values are too small to allow the model simulations to complete, which is why alternative fixed
baseflow values are specified.
2.50 At each flow estimation point, the combined baseflow inputs are subtracted from the target peak
flow, so that the design event inflows are not over-scaled. The difference between the baseflow
as calculated from catchment descriptors, and the value specified in the model are too small to
have a significant impact on the volume of the FSR/FEH rainfall-runoff inflow hydrographs.
2.51 The model also includes a series of ‘sweetening’ inflows. These are also required to maintain
model stability at low flows, but are different to baseflow in that they are invariably not added at
upstream limits of modelled reaches, and are also removed downstream. An example is the
sweetening flow through Branston Delph, which is set-up so that there is always a small flow in
the channel, even when both ends of the Delph are closed off. It is added in at the upstream
section of the Delph (downstream of the penstock) and removed at the downstream section
(upstream of the flapped outfall).

AECOM Witham Catchment Flood Map Improvements – Phase 2 25
This page is left blank intentionally

Defended Model Development

This page is left blank intentionally

AECOM Witham Catchment Flood Map Improvements – Phase 2 28
INTRODUCTION
3.1 The defended hydraulic model of the Lower Witham was developed from the parent InfoWorks
RS (IWRS) model constructed and calibrated by AECOM under the Witham Catchment
Strategic Model (WiCSM) commission6. This model was in turn based on an ISIS model of the
Lower Witham developed previously for the Lower Witham Strategy Study. One benefit of this
model lineage was that the WiCSM parent model already contained basic 1D representations of
the main flood plains and fens, and these were carried forward to the Lower Witham FMI model.
However, significant lengths of modelled tributaries were also added during construction of the
WiCSM model, and improvements were made to the schematisation of the 1D storage areas
representing the lowland fens. During this development of the WICSM parent model, the
additional modelling of floodplains was limited to the levels/extents observed during the
calibration events. Based on the hydrological analysis carried out for this study, the two flood
events against which the parent model was calibrated and verified were relatively small in
magnitude (for example, the largest calibration event flow was close to a 20% AEP on the
Barlings Eau and Stainfield Beck tributaries and a 5% event on Dunston Beck).
3.2 Due to the combination of the extension of the model prior to recalibration, the relatively small
magnitude of the calibration/verification events, and the requirement for the Lower Witham FMI
model to accurately model/map all flows up to and including the newly derived 0.1% AEP event
plus an allowance for climate change, significant development of the WiCSM parent model was
required to make it fit for flood map improvements modelling. This primarily involved extending
cross-sections, expanding storage areas and adding new storage areas and lateral
spills/floodplain sections. Additional refinements were also made to the model to add detail,
improve the schematisation, and to represent design scenarios for hydraulic control structures
where necessary.
3.3 This section describes development of hydraulic representation of the model. A description of
the flood mapping components of the model is provided in Section 4.
MODELLING SOFTWARE
3.4 The modelling software used was InfoWorks RS, developed by Wallingford Software.
InfoWorks RS is a modelling software package that combines the ISIS 1D flow simulation
engine7, GIS functionality and database storage within a single software package. This offers
the capability to undertake model building, data management, flood mapping and damage
assessment within one software package. The software includes full solutions of open
channels, floodplains, embankments and hydraulic structures for steady and unsteady flow
conditions. Rainfall-runoff simulation uses both event based and conceptual hydrological
methods known as design events. Full interactive views of data are available using
geographical plan views, sectional views, long sections, spreadsheet and time varying graphical
data. At the time of selection of the IWRS software for the WiCSM project, the main
advantages of InfoWorks RS over modelling software such as ISIS were that it can produce
flood extent maps by combining the model results with a Digital Terrain Model (DTM) and the
data base storage facility. However, ISIS has caught up somewhat in the interim with the
introduction of the ‘ISIS Mapper’ add-on.
6 Witham Catchment Strategic Model, Hydraulic Modelling Report – Volume 4: Lower Witham
sub-model. September 2007 (DRAFT). 7 With the release of InfoWorks RS v9.0 in April 2008, 2D capability was introduced into the
software subject to the purchase of an additional 2D licence.
3 Defended Model Development
AECOM Witham Catchment Flood Map Improvements – Phase 2 29
3.5 The GIS functionality and the database storage within InfoWorks RS have been very useful for
the Witham Flood Map Improvements project due to the large volumes of data involved. The
software has allowed the creation of hyperlinks to photographs of the structures, survey
drawings, structure data sheets and any other useful information to the relevant nodes within
the model. GIS data and model structure has been overlaid within the software package, which
has greatly aided the modelling process. Extended cross-sections and level area relationships
for storage areas have been derived from the LiDAR/SAR DTM data within InfoWorks RS.
MODELLING APPROACH
3.6 The Lower Witham WiCSM calibration model was originally conceived and developed as a
purely one-dimensional (1D) hydraulic model. However, the release of InfoWorks RS 2D
software7 presented the opportunity to incorporate two-dimensional (2D) representations of
some of the floodplains for the defended flood map improvements model. It was agreed at the
proposal stage that AECOM would include a limited amount of 2D modelling in the Lower
Witham where this offered an obvious benefit, and this is described in more detail in section
3.36.
3.7 Following development of the Lower Witham defended flood map improvements model,
unsteady simulations were undertaken to generate water levels within the river channel and
associated floodplains using flows derived from the hydrological analysis.
3.8 The hydraulic model simulates the attenuation and the lag effects of a river channel, floodplain
and artificial influences on flow and level as water moves through the river system. A variety of
structures and controls can be modelled within hydraulic models such as IWRS.
3.9 The representation of any complex system by a model requires a number of assumptions to be
made. The key assumptions of a computational hydraulic model are:
� The hydrological analysis based on the gauged data (where available) can be extrapolated to
other parts of the system;
� The design flows are an accurate representation of flows of a given return period;
� The survey data accurately represent the geometry of the river channel and banks;
� The physical processes in the fluvial system are accurately described by the underlying
equations;
� The fluvial system has been adequately schematised by the modeller;
� In the case of a 1D hydraulic model it is assumed that the hydraulic processes operating
within the catchment are essentially 1-dimensional and do not vary within a cross section
either horizontally or vertically.
3.10 These assumptions are generic for all computational hydraulic models and therefore apply to all
Witham Flood Map Improvements studies. However, a number of assumptions specific to the
Lower Witham study have also been made and these are detailed in the remainder of this
section as appropriate.
3.11 If recorded data is available calibration and validation of hydraulic models should be undertaken
to ensure comparison between simulated and observed data. This has previously been carried
out as part of the WiCSM – Lower Witham calibration study using two discrete flood events:
November 2000 and February 2001.
TOPOGRAPHIC DATA
3.12 In the WiCSM Lower Witham parent model, the in-bank model was constructed using channel
survey data from a variety of sources:
� ESL survey 1992;

AECOM Witham Catchment Flood Map Improvements – Phase 2 30
� Redland survey 1998/2000;
� Surveyline 2006;
� Halcrow 1992;
� EDI 2006;
� CSL 2006;
� Ratcliff 1998;
� Bullen 2001;
� Atkins 2002.
� Lower Witham Phase 2/3 as-built drawings, Bullen 2004.
3.13 During development of the defended Lower Witham flood map improvements model, it was
necessary to extend significant numbers of cross-sections and add significant numbers of
lateral spills and storage areas to model the floodplains. Lateral spills were defined using long
section bank top data from the associated channel surveys where these were available. In
other cases, it was necessary to base lateral spills and storage areas on the best available
digital terrain data.
3.14 Two forms of digital terrain data were made available by the Environment Agency for this study:
LiDAR and SAR data. The resolution of the LiDAR data is on a 2m grid and was provided in
filtered (v_ascii) format, whilst the SAR data is based on a coarser 5km grid. Generally
speaking, LiDAR is considered the more accurate of the two data products and was used in
preference to SAR where available. LiDAR coverage was virtually complete for all main river
and floodplains in the Lower Witham catchment (Figure 3.1).
Figure 3.1: Extent of LiDAR coverage (shaded) in the Lower Witham catchment (green outline).

AECOM Witham Catchment Flood Map Improvements – Phase 2 31
3.15 It should be noted that since the construction of the WiCSM parent model, the LiDAR data
provided by the Environment Agency for most of the area off the left bank of the Witham
between the River Bain and Duckpool Drain, has been deemed as being of poor quality by the
Environment Agency’s National Centre for Environmental Data and Surveillance (NCEDS) and
has therefore been removed from the national LiDAR dataset. Following consultation with the
Environment Agency, it was agreed that the available LiDAR would be used for this study
despite these concerns, in the absence of more accurate data. It is noted that the LiDAR level
data used in the Lower Witham FMI model development broadly matches levels from the
various surveys and the SAR data, and therefore, whilst it may not be accurate enough to
satisfy NCEDS strict quality assurance checks, it is considered to be of sufficient accuracy to
produce reasonably reliable flood mapping.
3.16 In order to use the digital terrain data to extend the model in InfoWorks RS, it was necessary to
import the data into the IWRS software to produce a DTM. Prior to doing this, a composite set
of ascii data was produced by ‘stamping’ the LiDAR data on top of the SAR data using the
Vertical Mapper software. This produces a single ascii dataset giving complete coverage of the
catchment, with the more accurate LiDAR data taking precedence where available. This
technique has the added benefit of filling in gaps in the LiDAR, such as those left where ponds
exist, and aids in the flood mapping process.
REPRESENTATION OF FLOODPLAINS
3.17 This section details the approach taken in development of the Lower Witham defended FMI
model to model floodplain flow. This involved the addition of schematic representations of the
floodplain to the Lower Witham WiCSM calibration model. The main four types of hydraulic
units used to represent the floodplain were: extended cross-sections, spill units, floodplain
sections, and storage areas.
3.18 Specific details of where floodplain representations were added in comparison to the WiCSM
calibrated parent model are not provided since this is best demonstrated within the IWRS
software, either using a visual side-by-side comparison, or by using the compare networks
functionality.
3.19 Development of the flood mapping model, which sits alongside the hydraulic model and enables
InfoWorks RS to produce the flood mapping, is described in Section 4.
Extending cross-sections
3.20 Where there are no formalised embankments on the channel and the adjacent floodplain does
not fall away significantly from the bank top level, the floodplain may be modelled by extending
cross-sections onto the valley sides. This is the simplest method of modelling the floodplains
and is relatively straightforward using InfoWorks RS, which can pick up levels from the DTM
using a designated spacing and an extension line drawn onto the Geoplan. This method of
floodplain representation was used wherever possible in developing the Lower Witham
defended FMI model and was appropriate to large parts of the Barlings Eau and small
tributaries of the Witham where the river is undefended and falls in the lowest point of a well
defined valley.
3.21 In extending cross-sections, it is important to ensure that cross-section lines do not cross each
other as this goes against the assumptions of 1D floodplain flow and makes flood mapping
problematic. Instead, the required approach is to ensure that cross-section extensions follow
the general direction of flow along the valley, even though this can require a ‘dog-leg’ in the
cross-section line.
3.22 Figure 3.2 shows an example of a cross-section extended using the DTM and its location in the
upper reaches of the Barlings Eau. Building on the experience of undertaking the River Bain
FMI study, cross-sections were generally extended using a resolution of 5m minimum spacing
as a spacing of 2m was considered to be unnecessarily small in most cases.

AECOM Witham Catchment Flood Map Improvements – Phase 2 32
Figure 3.2: Example of a cross-section extended using DTM data (right) and the location illustrating the general approach to the orientation of cross-sections (left)
Spill and Floodplain Units
3.23 Where the channel is embanked, or the adjacent floodplain falls away significantly from the
bank top level, it is better to model flow overtopping the banks by means of an overbank
(lateral) spill unit in IWRS. Such a spill unit is typically connected to an adjacent storage area in
a 1D model, although it can also be connected to a parallel channel representing the floodplain.
In the case of a linked 1D-2D model, a spill can also be connected to a 2D simulation polygon.
3.24 Spill units can also be used to allow flow to spill between adjacent storage areas on the
floodplain during periods of high flow. This is done where the floodplain is modelled as a series
of interconnecting storage areas, having boundaries along topographic boundaries such as
man-made embankments or natural ridges of higher land. In the Lower Witham defended FMI
model, Floodplain sections were typically used in preference to spill units for the connection of
floodplain storage areas. Floodplain sections are considered to be more physically realistic for
this application due to the fact that they can calculate flow between connected flood storage
areas using the Manning equation, thereby taking into account friction in the floodplain.
3.25 Spill units can also be used to model flow overtopping a structure, such as the bypassing of a
surcharged bridge by means of flow over the deck or around the parapet. In this application the
spill unit usually connects flow back into the channel downstream.
3.26 Spill and Floodplain units are identical in terms of their topographic data requirement within
IWRS: both require a series of chainage and elevation data points along the high point of the
embankment. For lateral spills representing flow over the banks between successive river
sections, there are three potential sources of data available to define the spill:
• Long section bank top survey data;
• Bank elevations from cross-sections;
• LiDAR/SAR DTM data.
3.27 In theory the long section bank top survey should be the most accurate data source for
definition of the spill. However investigations showed that in many cases the long section
survey picked up the main break of slope of the embankment rather than the true crest. In
addition, incoming drainage ditches were often included in long section bank top datasets when
in reality these do not form the actual line of defence. Following consultation with the
Environment Agency it was agreed that as a general approach the bank elevations from cross-
section surveys would be used to define spills with additional low spots from the bank top long-
section in-between. Where the low spot represents an incoming drain it was agreed to ignore
the low spot if it appeared that the drain is embanked on the OS 10,000 scale basemap. Where
this banktop survey data was not available it was necessary to use the bank elevations from the
upstream and downstream cross-sections and assume a linear interpolation in between. Any

AECOM Witham Catchment Flood Map Improvements – Phase 2 33
significant low spots in the spills were queried with the Environment Agency as part of the
review of the draft flood mapping. Where appropriate unrealistic low spots were raised to a
more appropriate defence level.
3.28 In most cases the LiDAR/SAR DTM was found to be unsuitable for defining bank top spills
because the filtering technique has left unrealistic gaps in the embankments, and in some
cases filtered the embankments out completely.
3.29 For spills modelling flow bypassing a structure, elevation data was obtained from the upstream
structure cross-section, although in a number of cases it was necessary to extend these spills
beyond the lateral extents of the surveyed section. The data for extending these spill units was
taken from the LiDAR/SAR DTM within InfoWorks RS. Similarly, the DTM was the main source
of data for definition of spills and floodplain sections between storage areas. In both cases a
typical spacing of 5 to 10m between points was used. An example of a floodplain section on
the River Slea is shown in Figure 3.3.
Figure 3.3: Example of a Floodplain spill unit (right), and its use in connecting two floodplain storage areas (left) adjacent to the River Slea
3.30 Wherever spills were generated using the LiDAR/SAR DTM, visual checks were made using 3D
views in IWRS to check that the spill followed the line of maximum elevation. In some cases
the route of the spill picked up anomalies in the DTM such as unrealistic ‘holes’ or ‘spikes’ in the
data. Where it was considered that such anomalies would have had a significant effect on the
flood mapping results, the data anomalies were manually removed from the spill units.
Between 2002 and 2007 a programme of bank works, referred to by the Environment Agency
as ‘Lower Witham Phase 2/3 works’ was undertaken. This involved mainly structural
remediation works but included some bank raising, thereby superseding parts of the last full
topographic survey of the banks. It is understood that the Lower Witham strategy ISIS model
has previously been updated to include this work. However, as a precaution, all relevant spill
units were checked against the Phase 2/3 as-built drawings and updated if necessary.
Storage Areas
3.31 Storage areas were used to model areas of floodplain where over bank flow would collect.
Water from the main channel can flow into these areas via spill units and may drain back into
the main channel as the flood subsides. Water may also pass downstream along the floodplain
to an adjacent storage area, connected by a spill or floodplain section unit.
3.32 The storage areas representing the floodplain were manually defined within the Lower Witham
FMI defended model taking into account topographic boundaries such as roads, embankments
and natural high ground. In a 1D model such as this, the storage areas model floodplain
inundation using a ‘spilling bucket’ principle. Each storage area will fill, gradually inundating an
area, until it reaches a threshold spill level where it spills into another unit such as a storage

AECOM Witham Catchment Flood Map Improvements – Phase 2 34
area or river channel (Figure 3.4). The inundated area ignores the location of where any water
enters the storage area and fills the lowest point on the storage area first. Therefore, the
resultant flood mapping does not show the flow path and this must either be added manually in
post-processing or modelled more accurately using a 2D approach to determine the flow path.
3.33 The use of 1D storage areas to model the floodplains in this way can therefore be a source of
inaccuracy in the flood mapping, especially if there is a significant gradient on the floodplain,
and a lack of topographical barriers that lead to ponding of flood water in reality. Such
inaccuracies can be minimised by carefully selecting the boundaries of the storage areas
representing the floodplain, and by ensuring that each floodplain is broken down into an
appropriate number of storage areas to ensure that the mapping is not overly dependant on the
manual definition of flow paths. In some cases the 1D storage area approach may be
considered too inaccurate to represent floodplain flow and these cases a linked 1D-2D model or
a simplified 2D model to define the flow path is the better alternative. In the Lower Wiitham
study, the main hydraulic model was set up using a 1D approach, with a series of child sub
models using 2D modelling developed to improve the mapping where required. Further details
of the 2D approach adopted are provided in Section 3.36.
Figure 3.4: Example of a 1D (‘spilling bucket’) representation floodplain inundation using connected floodplain storage areas
3.34 Generally, the more problematic areas to model using a 1D storage area approach in the Lower
Witham FMI defended model, tended to be in the lowland fen areas, such as those bordered by
the Delphs to the west of the River Witham (Figure 3.5). These fens are so vast and flat that it is
very difficult to accurately map inundation from overbank spills, even if the Fen is sub-divided
into a series of connected storage areas.
River Channel Storage Area 1 Storage Area 2
Flow Route

AECOM Witham Catchment Flood Map Improvements – Phase 2 35
Figure 3.5: Lowland Fens bordered by ‘The Delphs’ on the Lower Witham in which a 1D approach to mapping proved to be inaccurate
3.35 For each 1D storage area that was defined, a level-area relationship was generated
automatically using the LiDAR/SAR DTM within InfoWorks RS. This level-area relationship
enables the model to calculate the volume at a particular elevation, and therefore to calculate
the flood level from the balance of flows in and out of each storage area. The level-area
relationship can be updated quickly and easily within the software should a more accurate DTM
be obtained in the future.
2D FLOW MODELLING
3.36 For areas where 1D modelling using the main model proved to be too inaccurate to map flow
paths, a series of child sub-models using 2D modelling were developed in Infoworks RS to
improve the mapping. In the case of the lower reaches of the River Bain adjacent to Coningsby
and Tattershall, this was done using a hydraulically linked 1D-2D approach. For other locations
such as in the Fens to the west of the Witham, a simplified 2D approach to define the flow path
was considered to be adequate. Further details of these two approaches are provided below:
Lower Bain 1D-2D Linked Modelling
3.37 In the River Bain FMI study it was found that a 1D approach to floodplain modelling was
inadequate to describe the potential flow path of water overtopping the right bank of the Bain
around Wharfe Lane in Coningsby. This was because the floodplain falls away gradually in
both a southerly direction (across Wharfe Lane and back towards the watercourse) and in a
south-westerly direction towards the urban area of Tattershall. In addition, a dismantled railway
embankment runs east to west across the floodplain in this area which provides a discontinuous
barrier to flow. Given these issues, and the importance of obtaining accurate mapping for a
large urban area such as this, it was concluded that this area should be modelled using a linked
1D-2D approach. Subsequent discussions with the Environment Agency concluded that the
best approach would be to undertake this work as part of the Lower Witham FMI study.

AECOM Witham Catchment Flood Map Improvements – Phase 2 36
3.38 For initial development of the Lower Bain linked 1D-2D model, a truncated version of the River
Bain FMI model was extracted from the full River Bain 1D FMI model. This truncated model
extended from the confluence with the Witham to a point just upstream of Wharfe Lane in
Coningsby. Design inflow boundaries were extracted from the full River Bain model for use as
upstream flow boundaries for the truncated model.
3.39 Unfiltered LiDAR was provided by the Environment Agency to get a better handle on the height
and extent of the disused railway embankment, although ultimately the filtered LiDAR data was
used to specify a 2D simulation polygon to model flow moving in a south-westerly direction
towards the floodplain of the Witham. The default Infoworks RS resolution of 100m2 maximum
triangle size, and 25m2 min element area was considered appropriate for the 2D simulation
polygon. Within this 2D simulation polygon, the continuous length of the disused rail
embankment was represented by an impermeable breakline. The 2D simulation polygon was
linked to the 1D overbank spills from the right bank of the River Bain.
3.40 Following discussions with the Environment Agency, it was agreed that the linked 1D-2D model
would be extended to also include the left bank floodplain of the Lower Bain as a linked 2D
area, in order to provide more accurate modelling of flows over the left bank of the River Bain
around Coningsby and subsequent flow paths in a southerly direction behind the existing
defences. This was driven by a proposal to ‘mothball’ a large section of left bank defences on
the Lower Bain with the provision of a crossbank to contain flooding within the natural
topography of this essentially rural area. As part of this extension data, AECOM incorporated
the two Environment Agency siphons (NGR 521922, 357955 and 521447,357788) passing
beneath the River Bain to directly link the two sides of the floodplain. The Environment Agency
confirmed that these siphons do not have penstocks that allow them to be closed off and would
therefore be allowed to pass flow beneath the River Bain during a flood event.
3.41 The initial intention was to paste this linked 1D-2D sub-model back into the main model to run
as part of the main model. However, attempting to link the 2D simulation polygons back into
existing 1D storage areas bordering the Witham proved problematic, with much non-
convergence caused by recirculation over the long connecting spills. Similar problems were
encountered in linking the 1D representations of the IDB pumps into the 2D domain as this had
to be done via a dummy 1D storage area. In addition it was found that the 2D domain required
a much smaller timestep than the main 1D model and thus incorporating the 2D areas into the
main model would severely affect the run time of the main model. It was subsequently decided
to keep the Lower Bain 1D-2D linked model as a separate sub-model with the flow paths
generated by the model superimposed onto the 1D mapping during post processing. A linked
1D-2D approach was also attempted on parts of the floodplain of the River Slea and
Leasingham Beck, but similar problems with recirculation, non-convergence and small
timesteps were encountered. Therefore it was decided it would be more appropriate to define
these flow paths using the simplified 2D flow path methodology detailed below.

AECOM Witham Catchment Flood Map Improvements – Phase 2 37
Figure 3.6: Extents of the Lower Bain linked 1D-2D sub-model (2D simulation polygons highlighted in green)
3.42 Figure 3.6 shows the extents of the Lower Bain linked 1D-2D model. It was found that flow over
the right bank of the River Bain eventually ponded behind the defences on the Witham, whilst
flow over the left bank could in theory continue flowing south-east towards Boston. However, in
reality it was found that the flow did not progress much further south than Dogdyke due to its
dissipation into the existing drainage network and/or topographic features. This was proved by
completing a test run which extended the 0.1% AEP plus climate change model run-time.
3.43 The final Lower Bain1D-2D linked model was run for the 1% and 0.1% AEP events plus their
climate change equivalents. It was not considered necessary to simulate lower magnitude
events because there were no significant flow paths at these return periods and the existing 1D
mapping from the main model was considered adequate.
Simplified 2D Flow Paths
3.44 In examining the draft mapping from the initial 1D simulations using the main Lower Witham
FMI model, it became apparent that there were a large number of locations where flow was
overtopping into 1D storage areas but the mapping was not showing any flooding in the
immediate vicinity. This is because the 1D storage area approach assumes that flow fills the
fen from the lowest elevation which in the case of large fens can be tens of kilometres away. A
related problem is that the fen storage areas are so vast that even significant overbank flows
can fail to show significant flooding at any concentrated location because the flows into the
storage areas preferentially fill up the vast volume available in the network of IDB drains.
3.45 The option of manually generating flow paths was considered as this was successfully applied
on the River Bain FMI project. However, with the areas in question being so flat, and the
location of any ponded flooding being so distant, it was considered that this would be simply too
subjective and inaccurate. The option to add fully linked 2D areas to the existing 1D model was
also considered, but was considered to be too costly and time consuming based on the

AECOM Witham Catchment Flood Map Improvements – Phase 2 38
experience of using this approach on the lower reaches of the Bain. An alternative
methodology based on constructing simplified 2D flow paths was devised as the best way to
produce accurate flow path mapping at minimum cost.
3.46 The simplified 2D flow path method involved generation of a number of 2D simulation polygons
in Infoworks RS, each one representing a particular fen or flow path route. A relatively coarse
resolution was used for the 2D mesh with a maximum triangle size of 1500m2, with a minimum
computational element area of 50m2. This was considered adequate to describe the flow paths
with reasonable accuracy. Overbank spill hydrographs were then extracted from the 1D
hydraulic model and applied to the relevant 2D simulation polygon as point sources. It was only
necessary to run the 2D simulations for those return periods that resulted in overtopping of
spills in the main 1D model.
3.47 Initial trials using the simplified 2D flow path methodology proved successful, providing a
relatively quick and easy method of accurately determining the likely flow path to enhance the
1D flood mapping. As a result, the methodology was extended to more areas. A total of 13
separate 2D simulation polygons within 9 separate models were eventually constructed to
determine flow paths. The areas covered by these models are shown in Figure 3.7 and are
summarised in Table 3.1.
2D Area No. Description Primary Flow Sources* 1 Washingborough Fen Sandhill Beck LB
2 Heighington Fen Sandhill Beck RB, Heighington Beck RB
3 Langworth to Low Barlings
Barlings Eau RB
4 Branston Fen, Potterhanworth Fen & Nocton Fen
Nocton Delph LB
5 Bardney & Southrey Duckpool Drain RB, Snakeholme Drain LB
6 Dunston Fen & Metheringham Fen
Nocton Delph RB and Car Dyke LB
7 Blankney Fen & Martin Fen
Timberland Delph LB and Car Dyke LB
8 Timberland Dales & Thorpe Tilney Fen
Timberland Delph RB and Car Dyke LB
9 North Kyme Fen & Damford Grounds
Billinghay Skirth RB and Kyme Eau LB
10 Leasingham Moor Leasingham Beck RB
11 Upper Slea @ Bouncing Hill
River Slea RB
12 South Kyme Fen & Holland Fen
Kyme Eau RB
13 Dogdyke to Boston River Witham LB
Table 3.1: Summary of 2D Areas covered by 2D Flow Path Modelling *(RB = Right Bank, LB = Left Bank)
3.48 The main limitation of the simplified 2D flow path approach is that there is no hydraulic
feedback between the overbank spill and the adjacent ground. This feedback has the potential
to cause a drowned flow condition, and thereby reduce the flow over the spill in comparison to a
1D spill unit flowing freely into a 1D storage area. However, in the majority of cases the height
of the river embankments and the size of the adjacent fens is such that free weir flow is likely to
be a reasonable assumption at most overtopping locations. In any case, the assumption of free
flow in determining the flow paths would be the same as for a 1D model and is precautionary.
3.49 Once model runs were completed, a number of sensitivity runs were undertaken with a longer
simulation period to check the spreading of the flow had reached its maximum. The final flow
path outlines were superimposed on the 1D outlines from the main model to produce a
composite flood extent. Examples of the improvement in the accuracy of the flood mapping
resulting from this process are presented in Section 4.
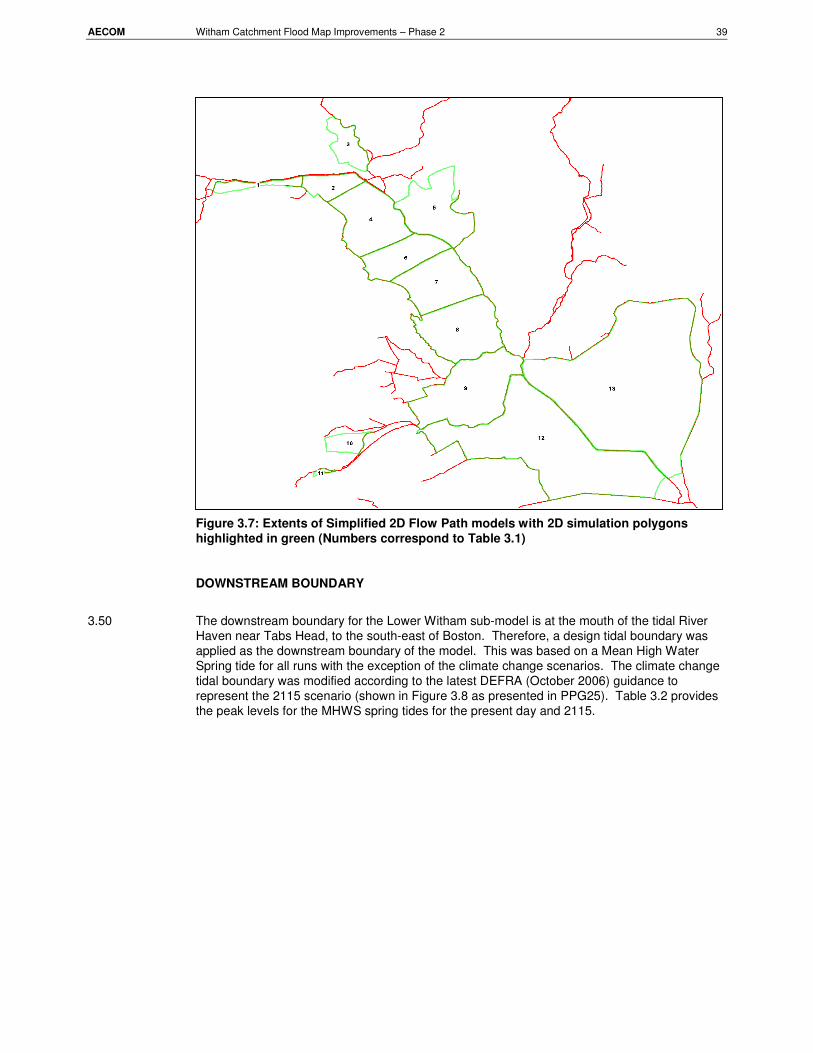
AECOM Witham Catchment Flood Map Improvements – Phase 2 39
Figure 3.7: Extents of Simplified 2D Flow Path models with 2D simulation polygons highlighted in green (Numbers correspond to Table 3.1)
DOWNSTREAM BOUNDARY
3.50 The downstream boundary for the Lower Witham sub-model is at the mouth of the tidal River
Haven near Tabs Head, to the south-east of Boston. Therefore, a design tidal boundary was
applied as the downstream boundary of the model. This was based on a Mean High Water
Spring tide for all runs with the exception of the climate change scenarios. The climate change
tidal boundary was modified according to the latest DEFRA (October 2006) guidance to
represent the 2115 scenario (shown in Figure 3.8 as presented in PPG25). Table 3.2 provides
the peak levels for the MHWS spring tides for the present day and 2115.

AECOM Witham Catchment Flood Map Improvements – Phase 2 40
Figure 3.8: Climate Change Guidance in Planning Policy Statement 25 Document
MHWS-Present Day MHWS-2115
Tabs Head Tidal Peak 3.860m AOD 5.001m AOD
Table 3.2: Tidal Boundary Peak Water Levels for the Haven in the Lower Witham Flood Map Improvements Model
3.51 In addition, inflows into to the Haven from the Black Sluice and Stonebridge catchments can
have an impact on the water level immediately downstream of the Lower Witham outfall at
Grand Sluice, with knock-on effects in terms of the rate of outflow through Grand Sluice
affecting levels in the River Witham. The inflows from the Black Sluice model were obtained
from the existing Black Sluice Strategy Study ISIS model from which the Black Sluice WiCSM
model was originally developed. This was used as the South Forty Foot FMI model had not
been completed prior to the Lower WItham FMI modelling. The Black Sluice Strategy Study
ISIS model had results up to a 0.5% AEP event which were used in the Lower Witham FMI
model. Additionally, it did not include the 5% AEP event, therefore the 4% AEP event was used
as an appropriate substitute. The inflows from the Stonebridge catchment were taken from the
Stonebridge Flood Map Improvements model8. Table 3.3 summarises the peak flows for each
event for these two inflows The peaks for the Black Sluice do not necessarily follow a smooth
increasing pattern with increasing return period due to ‘spikes’ in the peak flow caused when
the Black Sluice pumps turn on and off at the start and end of each period of tide lock
AEP Black Sluice Peak Inflow (m
3s
-1)
Stonebridge Peak Inflow (m
3s
-1)
50% 123.99 32.41
20% 119.33 38.76
10% 119.65 39.99
5% 4% Flow Used 41.91
4% 123.69 42.15
2% 126.96 43.75
1.30% 129.34 44.51
8 Faber Maunsell, (2008), Witham Flood Map Improvements Phase 2: Stonebridge Sub-Catchment Hydraulic Modelling
Report

AECOM Witham Catchment Flood Map Improvements – Phase 2 41
1% 131.72 45.33
0.50% 154.214 46.10
0.10% 0.5% Flow Used 47.06
Table 3.3: Peak inflows from the Black Sluice and Stonebridge models into the Lower Witham FMI model for various AEP events.
HYDRAULIC CONTROL STRUCTURES
3.52 Flow and levels in the Lower Witham catchment are influenced by a number of hydraulic control
structures maintained and operated by the Environment Agency. Some of these are variable
whilst others are fixed, and of the variable control structures, some are manually operated
whilst others are automatically controlled. A number of the control structures in the Lower
Witham FMI model were modified from those used in the calibration of the Lower Witham
WiCSM parent model. These modifications were made either because the structure (or its
current configuration) post-dates the calibration runs, the operating procedures have changed,
or because it was necessary to use logical rules rather than observed manual settings to
simulate a design condition. Details of the control mechanism for the major control structures in
the Lower Witham FMI model are provided below. For structures not detailed below, it can be
assumed that the operational settings from the Lower Witham WiCSM parent model were
carried forward to FMI design runs.
Grand Sluice, Boston
3.53 Grand Sluice is the gravity outfall at the downstream end of the River Witham that allows
discharge into the tidal River Haven when tidal conditions are favourable. Outflow is controlled
by three vertical sluice gates that open clear of the water during flood conditions. During low
flow conditions the gates seek to retain the water level within the Witham of +0.9m AOD during
the winter season and levels of +1.4m AOD during the summer season. The gates are
designed to operate automatically and adjust their opening based on remotely sensed water
levels at Boston, Langrick and Bardney. In the Lower Witham WiCSM calibration model the
control of the gates was undertaken using the ‘remote water level’ mode using levels at
Bardney. This configuration was carried forward from the Lower Witham ISIS model and was
found to produce satisfactory calibration results.
3.54 In the period between the completion of the Lower Witham WiCSM calibration work and the
development of the Lower Witham FMI model, the Witham Flood Forecasting project used a
copy of the WiCSM parent model to produce an ISIS flood forecasting model of the Witham
catchment. As part of this work, the control of the Grand Sluice gates was updated to use
logical control, utilising new data from the Swantel system to devise 28 logical control rules that
sought to mimic the actual control rules used by the gates. The polling interval for the logical
rules is 300 seconds. Whilst it was found that these new control rules behaved very similarly to
the original control rules during a flood event, it was considered appropriate to update the
Lower Witham FMI design model to include these latest updated rules. Following consultation
with the Environment Agency, it was determined that the logical rules for the winter retained
level would be used for the flood mapping design runs.
3.55 Similarly, the schematic representation of the tidal pointing doors at Grand Sluice was updated
in the Lower Witham FMI model to match the latest Witham flood forecasting model. This
involved replacing the Bernoulli loss units previously used to prevent backflow up the Witham
with a flapped orifice unit of appropriate dimensions. Essentially, these two schematisations of
the tidal pointing doors have the same effect, but the latter is considered to be current best
practice.
Fiskerton Sluice
3.56 Fiskerton Sluice has 3 sluice gates which are designed to maintain the water level in the Lincoln
to Bardney stretch of the River Witham between 2.92 and 3.0 mAOD. The model setup and
logical rules devised for the Lower Witham WiCSM calibration model were carried forward to
the Lower Witham FMI model as this produced satisfactory calibration results. The model

AECOM Witham Catchment Flood Map Improvements – Phase 2 42
representation includes three identical sluice gates which operate simultaneously based on the
upstream water level. The logical rules open the gates as the upstream water level rises above
3.0m AOD, and close them if water levels drop below 2.92m AOD. Between 2.92m and 3.0m
AOD the gate retains its previous position, so as to provide a ‘dead band’ to prevent hunting.
The polling interval for the logical rules is 300 seconds.
Branston Island Sluice
The hydraulic structure used to fill Branston Island storage area is similar to Fiskerton Sluice in
that it comprises of 3 sluice gates. As with Fiskerton sluice, the model setup and logical rules
were carried forward from the Lower Witham WiCSM calibration model as this produced
satisfactory calibration results. In the model, the three identical sluice gates operate
simultaneously based on the upstream water level. The logical rules begin to open the gates
when the upstream water level rises above 3.87m AOD. If water levels continue to rise, the
three gates open incrementally, opening fully if the water level reaches 3.97m AOD. The
polling interval for the logical rules is 300 seconds.
Branston Delph Overflow
3.57 An overflow culvert and penstock was recently constructed to allow overflow from Branston
Delph to the Branston IDB system. The purpose of this is to allow the transfer of water from
Car Dyke into the IDB system via Branston Delph, thereby relieving water levels on Car Dyke
during a flood event. To enable this to occur, the penstock at the head of Branston Delph is
opened simultaneously with the Branston Delph overflow penstock.
3.58 Details of the Branston Delph overflow penstock were provided by the Environment Agency
with a view to including it in the Lower Witham FMI model. The overflow was represented in the
model by a vertical sluice gate of appropriate dimensions and controlled by logical rules.
Logical rules were also set up for the penstock controlling flow from Car Dyke into Branston
Delph, such that it opens to attempt to limit the level to between 4.0 and 4.1m AOD upstream.
Once the flow into Branston Delph raises the water levels in the Delph above 2m AOD, the
logical rules on the overflow culvert begin to open the overflow penstock; the rules are set up to
attempt to keep the level on Branston Delph below 2.2m AOD.
3.59 Following discussions with the Environment Agency, it was agreed that the Branston Delph
penstock would be set to stay open at higher order events even if this overwhelms the IDB
pumping station. This is a precautionary approach for flood mapping purposes.
Siphons and Penstocks
3.60 There are numerous siphons in the Lower Witham catchment that allow flow to be conveyed in
low level drainage channels beneath embanked main river watercourses. Some of these are
maintained and operated by the Environment Agency, but the majority are maintained and
operated by the IDBs. In most cases, the purpose of the IDB siphons is to allow runoff to drain
to the pumping stations from areas that would otherwise be hydraulically disconnected.
3.61 Most of the siphons in the Lower Witham have penstocks that allow flow through the siphon to
be controlled. For example, it may be necessary to close the penstock to limit the extent of
flooding occurring on one side of the siphon. Similarly, penstocks are also common on open
channel watercourses that act as connections between IDB drainage sub-catchments. These
penstocks are usually kept closed but may be opened in an emergency if the pumps in one
sub-catchment fail and it is necessary to divert flow to the pumping station in an adjacent sub-
catchment.
3.62 The Environment Agency provided GIS layers showing the location of siphons and penstocks in
the Lower Witham catchment. AECOM determined that some of these were already
represented in the Lower Witham FMI model whilst other were not. Following discussions with
the Environment Agency, it was agreed that for the purpose of the design flood mapping it could
be reasonably assumed that the majority of connecting penstocks would be closed by IDB or
Environment Agency operations staff during a flood event. Where siphons/penstocks had not
previously been added to the model, this meant that it was not necessary to model them.
However, in the case of IDB penstocks connecting adjacent IDB sub-catchments it was agreed
AECOM Witham Catchment Flood Map Improvements – Phase 2 43
that floodplain sections should be included in the model to allow flow to pass between the sub-
catchments in the event of flooding based on the natural topography.
3.63 There were a small number of exceptions to the general approach stated above, and the
following configurations were agreed with the Environment Agency for the design condition:
• The siphon beneath Stainfield Beck (NGR 509727,372978) was not present on any of the
GIS layers provided but was left in the Lower Witham FMI model for design runs;
• The penstock on the open channel connection at Shortferry Road (NGR 508590,371980)
was modelled as permanently open for the design condition;
• The two Environment Agency penstocks conveying flow beneath the River Bain at
Coningsby (See 3.37) do not have penstocks that allow them to be closed off and were
therefore left in the main 1D Lower Witham FMI model, and the lower Bain 1D-2D
linked sub-model.
DESIGN RUNS
3.64 Once finalised, the main Lower Witham FMI defended 1D model was run in combination with
the appropriate design hydrology and downstream boundary for each return period to produce
the required series of flood outlines.
3.65 A total of 24 design runs were undertaken for derivation of the defended flood mapping: the full
suite of 12 return periods using the design hydrological boundaries critical for the upper parts of
the tributaries, and a further set of 12 return periods using the design hydrological boundaries
critical for the main Witham/lower tributaries.
Model Run Parameters
3.66 The InfoWorks RS model was run over a 312 hour period (13 days) which was sufficiently long
to ensure that all river sections and storage areas had experienced their peak stage, thereby
producing the maximum flood map extent. This was extended to a 744 hour period (31 days)
for all events greater than the 1% AEP event (i.e. the 0.5% AEP event, 0.1% AEP event and
both climate change scenarios).
3.67 The simulations were carried out on a desktop PC using a 2.13GHz Intel dual core processor
with 2 GB of RAM. The default InfoWorks RS run parameters were used with the following
exceptions:
� Adaptive timestepping, initial timestep = 10 seconds, min = 10 seconds, max = 300 seconds;
� Save interval = 900 seconds (Default is 300)
� Maximum iterations set to 20 (Default is 6)
� Flow convergence parameter (qtol) set to 0.05 (Default is 0.01)
� Level convergence parameter (htol) set to 0.02 (Default is 0.01)
� Spill threshold set to 0.005m (Default is 0.000001m)
3.68 Of these non-default parameters, it was the flow and level convergence parameter changes that
produced the most benefit in terms of improving convergence and reducing run times to a
reasonable level. These changed parameters slacken the tolerance of the model calculations
slightly so that flow and level calculations do not have to be solved to as high a degree of
accuracy before convergence is reached and the calculations move on to the next timestep.
The revised values used in the model were those applied as standard practice for flood
forecasting models. In theory this change has the potential to alter the modelling results
slightly. In order to check that this change was not having an adverse effect on the flood
mapping produced by the model, sensitivity tests were undertaken to compare flood mapping
produced using the default parameters against those with the raised flow and level
convergence parameters. It was found that for the 1% AEP event, in-channel maximum water
levels varied by an average of just 1mm across all nodes, with a maximum increase of 0.034m

AECOM Witham Catchment Flood Map Improvements – Phase 2 44
when using the default parameters. For storage areas which mapped flooding, the average
change in maximum water levels was 3mm with a maximum increase of 0.041m when using the
default parameters. Most importantly, there was negligible visual difference in the mapped
outlines in all cases.
3.69 Using the above run parameters, model simulation run times averaged approximately 12 hours
for the 312 hour simulations (for events less than or equal to the 1% AEP), and between 29 and
180 hours for the 744 hour simulations (for events greater than the 1% AEP).
3.70 Aside from the increase in the simulation period, there was a general increase in model run
time associated with increasing return period. This was mainly caused by periods of non-
convergence of the model run as more of the floodplain representations were utilised by flow
within the model. Such convergence issues are commonly experienced in complex floodplain
modelling such as this. Efforts were made to minimise the non-convergence with the help of
the diagnostic log, however, it was not possible to eradicate the non-convergence completely.
In light of the remaining non-convergence, the results of the modelling were examined carefully
to check for any obvious errors in the calculation of flows and water levels. Based on these
checks it was considered that the model results were sufficiently accurate and realistic to be
used for the production of flood mapping.

AECOM Witham Catchment Flood Map Improvements – Phase 2 45
This page is left blank intentionally

Flood Mapping

This page is left blank intentionally

AECOM Witham Catchment Flood Map Improvements – Phase 2 48
INTRODUCTION
4.1 The main outputs from this study are flood extent outlines for a range of return period design
flood events. The flood extents have been derived for the defended scenario by combining
hydrological models with the Lower Witham FMI hydraulic model, the development of which has
been described in the previous sections.
4.2 InfoWorks RS is capable of producing the flood extent outlines by combining the hydraulic
model results with a flood mapping model and a Digital Terrain Model (DTM). This integrated
approach saves time compared to extrapolating river levels across a floodplain surface
manually, especially if the models need to be re-run several times to iron out issues identified in
the initial drafts of the flood mapping.
4.3 Despite the integrated production of flood extents offered by the InfoWorks RS software, it is
still necessary to undertake some manual editing of the output extents. Such manual editing
addresses issues such as flow path definition, LiDAR anomalies and ‘dry islands’. Details of
the approach to manual editing that has been undertaken on the Lower Witham FMI flood
extents is given below.
4.4 It should be noted that the flood mapping produced by this study downstream of Coningsby is
considered to be of greater accuracy than that which was produced by the Bain FMI model.
This is because the Lower Witham FMI model includes the downstream reach of the River Bain,
allowing the simulation of the interaction of flows and water levels in the channels and
floodplains between the two watercourses. In addition, a linked 1D-2D sub-model of the Lower
Bain was developed to more accurately map the flow paths as part of the Lower Witham FMI
study.
INFOWORKS RS FLOOD MAPPING SET-UP
4.5 InfoWorks RS produces flood extents by applying the water surface calculated by the hydraulic
model (from water levels at any given time of a model simulation) across the DTM. This
requires the definition of a flood mapping model in InfoWorks RS. The flood mapping model is
built up by specification of flood mapping objects within the same network as the hydraulic
model.
4.6 Full details of how the flood mapping model is set-up was provided in the Bain FMI modelling
report1.
FLOOD EXTENT GENERATION
4.7 The flood extent is derived from the model simulation results by applying the calculated water
surface against the ground model levels. A surface is then produced which outlines the
boundary where the calculated water level and ground level are equal. ‘In-filling’ occurs where
the calculated water level is above the ground level. This process is done only within the
extents of the flood mapping compartments. InfoWorks RS can generate contours showing
different depths within the flooded areas.
4.8 When developing a flood mapping model it is good practice to visually examine the flood
mapping output to ensure the hydraulic/mapping model has sufficient coverage to contain the
extents of the flooding. If the ‘in-filled’ flood extent is shown to coincide with the edge of the
flood mapping compartment this usually indicates that flooding could extend further than is
4 Flood Mapping

AECOM Witham Catchment Flood Map Improvements – Phase 2 49
being shown. In such instances it is necessary to expand the hydraulic model and flood
mapping compartments to ensure the flood extent outline is contained.
4.9 Once the flood extent has been finalised, it can be exported from InfoWorks RS to MapInfo (or
other GIS software) for editing and formatting. It is usual to export a single contour at the
maximum depth of flooding. This exports as a series of unformatted polygons into MapInfo.
MANUAL EDITING OF FLOOD EXTENTS
4.10 Following the export of the raw flood extents to MapInfo, a process of manual checking and
editing was undertaken to produce the final flood outlines and ensure these were accurate. The
first task was to merge the flood mapping for the 20.5hr duration (critical for the tributaries) with
the flood mapping for the 48.5hr duration (critical for the lower reaches).
4.11 The merged flood extent polygons were cleaned in MapInfo to remove any isolated polygons
and holes <250m2. Each cleaned polygon extent was then trimmed to the NFCDD defence
polyline dataset to ensure that the mapped extent did not encroach into the channel where
there is a formal defence. After the cleaning process was complete the outlines were manually
checked and edited. The IWRS model results were used to verify the accuracy of the flood
extents and to define any flow paths.
Derivation of flow paths
4.12 One of the main purposes of the manual editing process was to add appropriate flow paths to
the 1D flood extents generated from the main Lower Witham FMI model. These flow paths
were defined either by 2D flow modelling (as described in Section 3.36), or by manual definition
based on the topography.
4.13 In the main Lower Witham FMI 1D model, Infoworks RS maps the modelled water levels in
each 1D floodplain storage area by filling it from the lowest elevation. This mapping
methodology gives no indication of where the flow generating the mapped extents has
originated from. Where areas of flooding appeared to have little connectivity to the channel, the
surrounding spill units were checked to establish the source of the flow into the storage area. A
decision was then taken on whether it would be most appropriate to generate flow paths using
2D flow modelling, or whether manual definition would be adequate.
4.14 2D flow modelling was considered to be most appropriate in areas such as the lowland Fens,
where the topography is flat and overtopping flows tended to dissipate into the IDB drainage
network and/or the flooding ponded a significant distance from the point of overtopping. In
these situations the manual definition of flow paths was considered to be too inaccurate and
subjective. Manual definition of flow paths was considered to be adequate where there was a
short distance between the point of overtopping and the ponded area, with an obvious flow
route based on the DTM.
4.15 Figures 5.1 and 5.2 show examples of the benefit of the derivation of flow paths in the lowland
Fens using 2D modelling. The flow paths generated by 2D modelling were superimposed on
the base 1D mapping to produce the final flood extents.

AECOM Witham Catchment Flood Map Improvements – Phase 2 50
Figure 5.1: Branston Fen to Metheringham Fen (2D Area No.s 4 & 6). 1% AEP Flood Extents showing 1D output (left) vs. Final mapping with 2D flow paths added (right).
Figure 5.2: North Kyme Fen & Damford Grounds (2D Area No. 9). 2% AEP Flood Extents showing 1D output (left) vs. Final mapping with 2D flow paths added (right).
4.16 Figure 5.3 shows an example of the manual addition of a flow path. In this example the spills
indicated overtopping some distance from the ponded flooding and a flow path was manually
added in to connect the flooding to the channel. This illustrates the usefulness of the 3D view
functionality in Infoworks RS when determining likely flow paths.

AECOM Witham Catchment Flood Map Improvements – Phase 2 51
Figure 5.3: Spill units (highlighted in red) indicate overtopping on the right bank but the raw IWRS outline (orange) does not show any flow path. Flow path manually added using the DTM to ensure flow path followed the floodplain valley floor, the purple outline is the modified flood extent
Editing due to LiDAR anomalies
4.17 In several locations within the Lower Witham catchment the LiDAR filtering process had failed
to remove large buildings. These were left as high mounds in the DTM and appeared as dry
islands in the flood mapping. Where such anomalies were identified the buildings were filled in
manually for the final flood map. Other anomalies in the DTM were also identified and manually
corrected: The example in Figure 5.4 represents the tile boundary between two LiDAR tiles.
This boundary caused a discontinuity in the DTM leading to a distinct edge in the flood extent;
where possible the outlines were smoothed to minimise the edge. Such discontinuities are also
possible at the LiDAR/SAR interface.
Figure 5.4: DTM anomaly caused by the boundary between two LiDAR tiles resulted in an edge in the modelled outlines in this area.
Removal of IDB Drains
4.18 At the request of the Environment Agency, IDB drains shown as inundated within the flood
extents were removed. This was done within the MapInfo GIS software. The technique for
removal was semi-automated whereby drains were removed manually from the 0.1%+CC flood
extent which was then subsequently used as a mask for the other AEP flood extents. A final
check and manual clean up was also required for each AEP flood extent. In some areas the
inundated drain was attached to an area of flooding and was the principal flow path and in
these instances the drain was left in the flood extents.

AECOM Witham Catchment Flood Map Improvements – Phase 2 52
Other Manual Edits
4.19 At the request of the Environment Agency, the river channel between defences was removed
from the final flood extents. Where no formal defences are present the channel was included in
the mapped extents. Where formal defences exist on only one bank, the channel was left in the
mapped extents, but with a gap between the channel and the defence to the defended side.
4.20 Any other minor errors in the flood mapping that were picked up during the QA checking were
manually amended in production of the final outlines as appropriate. Further details are
provided in the ‘Known Issues’ section below.
QUALITY ASSURANCE CHECKING
4.21 Quality Assurance checking of the final flood outlines was undertaken, primarily to check for the
following:
• Errors in the flood mapping model which cause inappropriate levels to be mapped;
• Ensuring that flood extents become sequentially more extensive with increasing flood
event magnitude;
• Flow paths which do not fall along the lowest elevations when compared to the DTM.
4.22 The processed flood outlines were also reviewed by the Environment Agency staff at draft
stage to check that they match their perceptions of the areas flooded in historical events of
known return periods. This checking process resulted in amendments to some spill unit levels
in the model where it was considered that the draft model included an unrealistically low low-
spot. Where this was done a comment was inserted into the model.
4.23 When checking the mapped flood extent for a given design event, it should be borne in mind
that due to the hydraulic coefficients and control structure settings adopted for the ‘design’
scenario, it is possible that flooding in historical events may have been more extensive than that
shown for the same approximate return period in the flood mapping produced by this study. It
is also important to remember that some historical flood extents are exacerbated by the
incorrect operation or failure of control structures, and by blockages neither of which are
represented in the design hydraulic model.
4.24 The finalised defended flood outlines for the defended flood mapping were converted from
MapInfo .TAB format into ArcView shapefile format and delivered to the Environment Agency in
electronic format.
KNOWN ISSUES WITH THE FLOOD MAPPING
4.25 A number of issues with the flood mapping produced by this study were identified, some of
which were dealt with by additional manual editing of the flood mapping output, whilst others
offer opportunities for further development of the model in the future.
Washingborough Roadside North
4.26 Following review of the draft flood mapping outputs by the Environment Agency, the flood
mapping at Washingborough Roadside North was specifically queried. The upstream end of
the main river is culverted beneath Fen Road, and there have been recent flood events
affecting properties along the culverted section close to the confluence of Fen Road and Keeble
Drive (NGR 502969, 370595). The topographic survey undertaken for the model did not
include internal CCTV survey of culverts and therefore the data only commences at the outlet
into the open channel. It was also acknowledged by the Environment Agency that the flooding
issues at this location are potentially complex with possible surface water contributions and
siltation of the culvert. It was therefore agreed that it is beyond the scope of the current
model/study to replicate the flooding in this area, and that this issue would be best investigated
using a detailed locailsed model, possibly using Infoworks CS software.

AECOM Witham Catchment Flood Map Improvements – Phase 2 53
Langworth Gauging Station
4.27 The Environment Agency’s review of the draft flood extents also highlighted potential concerns
with the accuracy of water levels and flood mapping in the vicinity of Langworth Gauging
Station. Both in the model and in reality, flow overtops both the left and right banks immediately
upstream of the gauging station and floods the adjacent land. The flood extent produced by the
model on the left bank was consistent with the observed pattern of flooding from recent events.
The flooding on the right bank was less straightforward to map as it consists of a shallow flow
path travelling south towards Manor Farm. Initially this flow path was manually derived based
on the DTM and the observed flooding pattern from the July 2007 event. A simplified 2D flow
path model was also produced for comparison. It was noted that the 2D flow path was less
extensive and this lead to investigations into the design water level produced by the model at
the gauging station for various return periods.
4.28 It was found that the model appeared to underestimate the water level upstream of Langworth
gauging station despite the design flows being consistent with the historical flow record and the
selected design flood frequency curve. This was found to be attributable to the schematisation
of the left bank floodplain, which was modelled as extended cross-sections. This
schematisation is able to produce the expected flood extent in the left bank floodplain, but
underestimates the water level within the channel as it allows water to be conveyed in the
floodplain prior to overtopping of the left bank. As this issue was highlighted after production of
the final draft of the flood extents, it was agreed that the model would not be amended and re-
run to improve the results, as this would be costly and time consuming. Instead the right bank
flood extents were taken as the original 1D extents with manual editing of flow paths based on
recent flood events.
4.29 As a result of the issue highlighted at Langworth Gauging Station, the water levels between
Langworth Bridge and the gauging station as tabulated in Appendix C are underestimated by up
to 300mm. This will also affect the calculated AEP/SoP in Appendix F. The reported peak
flows and the mapped extents in this area are considered to be accurate. It is intended that the
schematisation of the model will be updated to address this issue as part of the next project to
utilise the model. This is likely to be the Lower Witham Strategy Review modelling.
Kyme Eau at Chapel Hill
4.30 The Environment Agency also queried the mapping from flows overtopping the left bank of
Kyme Eau in the model close to Chapel Hill IDB pumping station at low return periods. The low
spot which overtops in the model is slightly lower than the minimum level quoted in the as-built
drawings from bank works carried out in 2006. However, following investigations it was found
that this as-built minimum level is also lower than the latest 1 in 2 year design water level.
There is an outstanding query as to why the standard of protection at this location is so low
despite recent bank works, and this will be picked up in the Lower Witham Strategy Review
project. Despite this, it was agreed with the Environment Agency that the mapped overtopping
of the left bank at low return periods is appropriate and that the associated flood extents would
be retained in the final deliverables.
4.31 A GIS layer detailing all known issues with the flood mapping and locations of manual edits was
provided along with the electronic versions of the finalised flood outlines. This layer provides an
auditable record of the decision processes in undertaking manual edits to the raw flood
mapping output.

Sensitivity Analysis

This page is left blank intentionally

AECOM Witham Catchment Flood Map Improvements – Phase 2 56
INTRODUCTION
5.1 As part of the flood map improvements work on the Lower Witham catchment, it was necessary
to investigate the sensitivity to the seasonal changes in channel and floodplain roughness. As
the model was built to represent a typical winter scenario, the analysis involved increasing the
roughness values by a specified percentage so that they reflect the increased channel and
floodplain vegetation of the summer season. Seasonal changes to the operation of Grand
Sluice gravity outfall, as specified by the Environment Agency, were also included.
5.2 The summer sensitivity analysis was undertaken using the 50%, 10%, 4%, 2% &1% AEP
design events as set out in the project proposal. As with the standard scenario design event
runs, it was necessary to run the 20.5 hour and 48.5 hour storm durations in order to ensure the
appropriate peak water levels were obtained at each model node.
MODEL SET-UP
5.3 A copy of the defended base model was made. This model was modified to represent the
summer scenario, from which the sensitivity runs could be made.
5.4 The first modification was to the rules at the Grand Sluice outfall near Boston. The logical rules
applied at Grand Sluice are set up to open the gates based on levels sensed at Boston,
Langrick Bridge and Bardney. The objective of the gates is to maintain retained water levels of
0.9m AOD during the winter season and levels of 1.4m AOD during the summer season. The
rules were modified to reflect the summer season scenario.
5.5 The second modification was to the channel and floodplain roughness throughout the model. A
global change was applied which increased all the Manning’s ‘n’ roughness values associated
with river sections by 20%. This reflects the increased roughness that would be associated with
increased vegetation growth during the summer months.
SIMULATIONS AND RESULTS
5.6 No issues arose in running the models with the modified conditions, and so a complete set of
results for the required design events was obtained.
5.7 The peak water levels at each node were extracted for each return period design event (using
the maximum of the results from the two durations that were run). These results are tabulated
in Appendix E.
5.8 The impact of the seasonal change of roughness was analysed by comparing the peak water
levels from the sensitivity runs against those from the base case. Table 6.1 summarises the
maximum and average change in peak water levels for each modelled watercourse within the
Lower Witham catchment (for the 10% and 1% AEP design events only).
5.9 The average change takes account of both increases and decreases in the peak water levels
between the sensitivity runs and the equivalent design run undertaken for the base case
scenario. Small decreases in peak water levels are counter-intuitive for an increase in
roughness, but these can occur at some nodes due to redistribution of flows within the model,
or more simply due to rounding errors in the model computations.
5 Sensitivity Analysis

AECOM Witham Catchment Flood Map Improvements – Phase 2 57
10% AEP event 1% AEP event
Watercourse Max.
diff. (m)
Average
diff. (m)
Max
diff. (m)
Average
diff. (m)
Anwick Fen Drain 0.75 0.63 0.03 0.01
River Bain 0.17 0.07 0.17 0.07
Branston Delph 0.14 0.11 0.03 0.00
Barlings Eau 0.13 0.06 0.09 0.04
Billinghay Skirth 0.01 0.00 0.02 0.00
Car Dyke 0.09 0.03 0.14 0.01
Dorrington Catchwater 0.03 0.01 0.03 0.02
Duckpool Drain 0.13 0.05 0.14 0.04
Dorrington Dyke 0.01 0.01 0.02 0.01
Digby Beck 0.09 0.06 0.10 0.07
Farroway Drain 0.17 0.16 0.01 0.01
Grand Sluice/Haven 0.01 0.00 0.01 0.00
Heighington Catchwater 0.05 0.04 0.05 0.02
Heighington Beck 0.15 0.06 0.11 0.03
Kyme Eau 0.03 0.01 0.02 0.00
Leasingham Drain 0.10 0.07 0.11 0.07
Lower River Witham – Lincoln to Bardney 0.01 0.00 -0.01 -0.02
Lower River Witham – Bardney to Chapel Hill 0.03 0.02 0.02 0.00
Lower River Witham –Chapel Hill to Boston 0.09 0.06 0.11 0.06
Marsh Drain 0.03 0.03 0.01 0.01
Metheringham Delph 0.02 0.00 0.00 0.00
New Cut 0.10 0.06 0.10 0.05
Nine Foot River 0.02 0.02 0.01 0.01
Nocton Delph 0.10 0.08 0.14 0.11
North Hills Drain 0.02 0.01 0.02 0.02
Old River Slea 0.10 0.04 0.11 0.05
Old River Witham 0.03 0.03 0.03 0.02
Queen Dyke 0.06 0.02 0.08 0.01
Ruskington Catchwater 0.16 0.06 0.06 0.04
River Slea 0.13 0.06 0.16 0.06
Ruskington Beck 0.12 0.05 0.11 0.04
Sandhill Beck 0.06 0.02 0.07 0.00
Stainfield Beck 0.20 0.09 0.27 0.07
Snakeholme Drain 0.16 0.07 0.17 0.04
South Delph 0.10 0.06 0.10 0.06
Timberland Delph 0.02 0.01 0.00 0.00
Welton Beck 0.13 0.02 0.09 0.05
Table 6.1: Maximum and average change in peak water levels for each watercourse in the Lower Witham catchment, resulting from seasonal sensitivity analysis

AECOM Witham Catchment Flood Map Improvements – Phase 2 58
5.10 In summary, the seasonal sensitivity of Manning’s n for the summer scenario shows the
following:
• A rise in the average maximum peak water level for all watercourses except Billinghay
Skirth and Timberland Delph for the 10% and 1% AEP events
• A maximum increase of 110mm on the River Witham for the 1% AEP event; with a
maximum increase of 90mm for the 10% AEP event
• A maximum increase of 270mm on the tributaries at Stainfield Beck for the 1% AEP
event; with a maximum increase of 200mm for the 10% AEP event
• A typical average increase of less than 120mm for all watercourses at the two AEP
events in Table 6.1
5.11 The peak water levels at each model node for each modelled return period are tabulated in
Appendix E.

AECOM Witham Catchment Flood Map Improvements – Phase 2 59
This page is left blank intentionally

Standard of Protection Analysis

This page is left blank intentionally

AECOM Witham Catchment Flood Map Improvements – Phase 2 62
6.1 A key requirement of Phase 2 of the Witham Catchment Flood Map Improvements project was
to determine the indicative and actual Standard of Protection (SoP) for each NFCDD asset
within the Witham catchment. The indicative standard was set in consultation with the
Environment Agency, being appropriate to the land use adjacent to the modelled reaches of the
study. The first stage of the analysis was to calculate the actual Annual Exceedance Probability
(AEP) at all nodes within the modelled reaches. The second stage involved calculating the
freeboard allowance and hence effective height at each node, which in turn determined the
actual SoP. This provided an accurate assessment of the current defence levels in comparison
to the indicative SoP levels.
INDICATIVE STANDARD OF PROTECTION 6.2 The indicative SoPs were decided upon following guidance specified in section 6 of the Flood
and Coastal Defence Project Appraisal Guidance: Economic Appraisal Document (PAG3). The
relevant table from this document is reproduced in Table 6.1
Land Use Band
Indicative Range of Housing Units (or Equivalent)
per km of Single River Bank
Description Fluvial Return Period (SoP %)
Annual Probability of Failure
A ≥50 Intensive developed urban at risk from
flooding.
50-200
(2-0.5%)
0.005-0.02
B ≥25 to<50 Less intensive urban areas with some
high-grade agricultural land and/or
environmental assets of international
importance requiring protection.
25-100
(4-1%)
0.01-0.04
C ≥5 to <25 Large areas of high-grade agricultural
land and/or environmental assets of
national significance requiring protection
with some properties at risk.
5-50
(20-2%)
0.02-0.2
D ≥1.25 to<5 Mixed agricultural land with occasional,
often agriculturally related, properties at
risk. Agricultural land may be prone to
flooding. May also apply to environmental
assets of local significance.
1.25-10
(80-
10%)
0.1-0.8
E >0 to <1.25 Low-grade agricultural land, often grass,
at risk from flooding with isolated
agricultural or seasonally occupied
properties at risk, or environmental
assets at little risk from frequent
inundation.
<2.5
(40%)
>0.4
Table 6.1: Summary of Indicative SoP from the Flood and Coastal Defence Project Appraisal Guidance: Economic Appraisal Document
6.3 The land use band set for the Lower Witham catchment ranged from land use band A to land
use band C. This was confirmed by the Environment Agency. Based on the chosen land use
band, the indicative SoPs for the Lower Witham catchment were used in the freeboard analysis
(see below).
6 Standard of Protection Analysis

AECOM Witham Catchment Flood Map Improvements – Phase 2 63
CURRENT BANK TOP ANNUAL EXCEEDANCE PROBABILITY
6.4 In order to assess the actual AEP at which the existing banks overtop on the modelled
watercourses within the Lower Witham catchment, the results of the defended model runs were
required. As stated previously, model runs were completed for the 50%, 20%, 10%, 5%, 4%,
2%, 1.33%, 1%, 0.5% and 0.1% as well as the 1% and 0.1% AEP climate change events. The
modelled peak water levels were extracted for all model runs, with the maximum between the
two durations being carried forward to the Freeboard and SoP analysis. The bed level, left and
right banks were also extracted from the InfoWorks RS model network.
6.5 The extracted model results were compared against the bank levels to establish the actual AEP
at each river section on all modelled watercourses. The results from this analysis are tabulated
in Appendix F.
FREEBOARD ANALYSIS
6.6 As part of the SoP analysis it was necessary to assess the required freeboard for the existing
defence assets within the Lower Witham catchment. Freeboard is defined as “an allowance to
take account of the physical processes that affect the defence level and the uncertainty in the
prediction of physical processes that affect the defence level”9.
6.7 In order to determine the required freeboard the following methodology, originally developed for
the Stonebridge catchment and based on guidance from the Fluvial Freeboard Guidance Note9
was applied to the Lower Witham catchment. Firstly the Lower Witham defences within the
National Fluvial and Coastal Defence Database (NFCDD) were identified, and the freeboard for
these defences was calculated. Once the freeboard allowance was determined for the
defences it was possible to apply the measure of freeboard to the river sections within the
length of each defence. This enabled a detailed freeboard assessment of the asset whilst also
identifying areas of low bank height as shown in the survey data.
Freeboard Analysis
6.8 The freeboard allowance was determined in two stages following the Fluvial Freeboard
Guidance Note9. This involves the assessment of first the physical processes and secondly the
uncertainty.
6.9 The first stage looks at the physical processes to determine the freeboard allowance. This
requires the use of section 4 in the Fluvial Freeboard Guidance Note to ascertain the freeboard
allowance of a particular defence based on physical process such as:
� Wave Overtopping;
� Settlement;
� Degradation;
� The act of cracking and vermin;
� Super-elevation at bends;
� Boatwash;
� Wind Set up;
� Sedimentation.
6.10 Note that with regard to the allowance for wave overtopping, the calculation undertaken was
dependent on the fetch (i.e. distance from bank top/defence to defence perpendicular to flow
channel). If the fetch was greater than 50m, the calculation associated with the Floods and
Reservoir Safety guide10
was applied rather than the standard relationship described in the
Fluvial Freeboard Guidance Note9. In both cases, the calculated wave surcharge allowance
was rounded to the nearest 0.05m. This is explicitly stated as a requirement for all values less
than 0.125m (i.e. those calculated by the standard relationship), but was applied to those
values calculated from the method in the Floods and Reservoir Safety guide for consistency.
9 Fluvial Freeboard Guidance Note: Technical Report W187, Environment Agency, 2000.
10 Floods and Reservoir Safety guide, 1996, Institute of Civil Engineers, Thomas Telford Ltd.

AECOM Witham Catchment Flood Map Improvements – Phase 2 64
6.11 Each process was assessed for each defence type and the sum of all the allowances was used
as a freeboard allowance for physical processes. For all other physical processes, no
allowance has been made for their impact. This is the default approach as described by the
advice notes in the Fluvial Freeboard Guidance Note9. These assumptions are not
unreasonable:
� the defences are likely to have been in place long enough for any settlement to have taken
place.
� maintenance is assumed to render the impacts of degradation and cracking negligible.
� the majority of the watercourses are not navigable, so boatwash is not an issue.
The assumptions made are restated in an example pro-forma, which is presented in Appendix
F.
6.12 Stage two requires the identification and assessments of the uncertainties relating to the:
� Accuracy of hydrological data;
� Accuracy of hydrological analysis;
� Accuracy of hydraulic data;
� Accuracy of a hydraulic model;
� Significance of physical parameters;
� Consequences of failure.
6.13 The quick method presented in section 5 of the Fluvial Freeboard Guidance Note8 was used to
calculate an uncertainty score based on scores from a number of criteria (total score out of 30).
This is then used in conjunction with simulated water levels to provide a freeboard allowance to
account for uncertainties. The water levels used were based on the indicative SoP. The
indicative SoP is based on the Flood and Coastal Defence Project Appraisal Guidance:
Economic Appraisal Document11
and assigns a land use band to each area for which there is a
range of indicative standard of protection to be provided. For example, land use band A has a
standard of protection between 2 – 0.5% AEP. The uncertainty freeboard allowance analysis
was completed for a high SoP (eg, 0.5%) which is considered the most precautionary.
6.14 Once both stages are complete, the freeboard allowance for physical processes and for
uncertainties are summed to give a total freeboard allowance for each defence asset.
6.15 Following discussions with the Environment Agency regarding the freeboard method and
presentation of results, a few refinements to the methodology were made in comparison to the
results presented previously for the Stonebridge and River Bain catchments. Previously, a
freeboard value was calculated for defended sections only, with this freeboard value accounting
for both physical processes and uncertainty. In the revised method, a freeboard value is also
calculated for undefended sections, and with a slightly different methodology as described
below.
6.16 For the undefended sections, the contribution of the physical processes was assumed to be
negligible. This is because physical processes such as settlement, degradation and wave
overtopping will not be important. Therefore only the uncertainty measure is used in the
freeboard calculation.
6.17 In the calculation of the uncertainty measure in the freeboard calculation for undefended nodes,
the multi-attribute test described above will have the same scores for 5 of the 6 categories
(tables 5.1-5.4 and 5.6 in Technical Report W1879). However, for the ‘significance of physical
parameters’ element of the multi-attribute test (table 5.5 in Technical Report W1879), a score of
1 is assumed at undefended nodes which assumes that uncertainties in physical parameters
are negligible.
6.18 The actual SoP provided by the existing defences within the Lower Witham catchment was also
assessed. This was calculated by deducting the freeboard allowance from the defence level to
produce an effective height (see Figure 6.1).
11
Flood and Coastal Defence Project Appraisal Guidance: Economic Appraisal Document,
Ministry of Agriculture, Fisheries and Food, 2000, 104pp.

AECOM Witham Catchment Flood Map Improvements – Phase 2 65
Figure 6.1: Standard of Protection and Required Freeboard
6.19 This effective height was then compared to all of the simulated water levels to determine the
actual standard of protection for each node within the Lower Witham flood map improvements
model. The actual SoPs are provided in Appendix F.
Effective Defence Height for High Indicative Return Period, X.
Required Freeboard Allowance
Defence Level

Conclusions

This page is left blank intentionally
AECOM Witham Catchment Flood Map Improvements – Phase 2 68
SUMMARY
7.1 In order to produce the required outputs for the Lower Witham catchment, under Phase 2 of the
Witham Catchment Flood Map Improvements commission, an InfoWorks RS hydraulic model
was developed. This hydraulic model, referred to as the Lower Witham FMI model, was based
upon the InfoWorks RS parent model developed and calibrated for the Lower Witham under the
Witham Catchment Strategic Model commission.
7.2 The Lower Witham FMI ‘with defences’ model was refined and developed to include
representations of all floodplains required to contain events up to and including the 0.1% AEP
event with an allowance for climate change. An integrated flood mapping model was set up in
InfoWorks RS to enable the software to map the model results.
7.3 Hydrological boundaries were developed using FEH methodologies for a suite of return periods:
50%, 20%, 10%, 5%, 4%, 2%, 1.33%, 1%, 0.5% and 0.1% AEP events, plus the 1% and 0.1%
AEP events representing climate change (for 2115) based on current DEFRA guidance.
7.4 Two storm duration events (20.5 hours and 48.5 hours) were found to be adequate to represent
the required peak flows and volumes at all points in the catchment following scaling of the
rainfall-runoff boundaries to the peak flow estimates. The shorter duration reflected the faster
and more peak dependent nature of the upper parts of the tributaries in the Lower Witham
catchment, whilst the longer duration reflected the slower, volume dependent nature of the
River Witham itself and the lower parts of the tributaries.
7.5 The western part of the Lower Witham catchment – known as the ‘Heath’ catchments – were
represented by ‘typical’ hydrograph shapes (i.e. not dependent on storm duration) scaled to the
required design event peak flow. This was due to the permeable nature of these
subcatchments, where slow, prolonged response to rainfall input was prevalent.
7.6 Pumped subcatchments within the Lower Witham catchment were scaled based on analysis of
previous events, in which a scaling factor/ratio between the volumetric input generated by the
FSR/FEH rainfall-runoff method (based on known rainfall depths) and the pumped volume
recorded by the IDBs was calculated. This scaling factor was assumed to be applicable to
design rainfall inputs, and therefore applied to all design event models (with an increase of 20%
to account for climate change where necessary).
7.7 The hydrological boundaries were added to the Lower Witham FMI ‘with defences’ model and
run for the full suite of return periods to produce flood extents. These were exported to the
MapInfo GIS package in order to add flow paths and undertake additional manual post
processing.
7.8 For areas where 1D modelling using the main model proved to be too inaccurate to map flow
paths, a series of child sub-models using 2D modelling were developed in Infoworks RS to
improve the mapping. In the case of the lower reaches of the River Bain adjacent to Coningsby
and Tattershall, this was done using a hydraulically linked 1D-2D approach. For other locations
such as in the Fens to the west of the Witham, a simplified 2D approach to define the flow path
was considered to be adequate. The flow paths were added to the 1D flood extents from the
main Lower Witham FMI model during processing.
7.9 Quality Assurance checking of the final flood outlines was undertaken both by AECOM and the
Environment Agency, to check for errors in the flood mapping process, and for consistency with
observed historical patterns of flooding. Where issues were raised, these were addressed
either making amendments to the model and re-running, undertaking manual edits to the flood
map extents, or by making recommendations for further work. A full audit trail of all remaining
issues and manual edits to the flood mapping was provided with the final output in the form of a
GIS layer containing comments.
7 Conclusions

AECOM Witham Catchment Flood Map Improvements – Phase 2 69
7.1 It should be noted that the flood mapping produced by this study downstream of Coningsby
supersedes the mapping produced for this area by the River Bain Flood Map Improvements
study. This is because the latter did not fully account for the interaction between the Lower
Witham floodplains and the River Bain, and the fact that more accurate 2D modelling of flow
paths was undertaken in this location for the Lower Witham study.
7.2 It should also be noted that the flood extents produced by this study may be less extensive than
in a known historical event of the same approximate return period. This can occur because the
hydraulic coefficients and control structure settings adopted for the ‘design’ scenario may result
in lower levels than those observed during historical events. Similarly, the design condition
assumes ‘normal’ operation of hydraulic structures and does not account for blockages.
7.3 An analysis of the standard of protection and freeboard was also undertaken as part of the
study. This involved calculation of the indicative standard of protection, the required freeboard
and the actual standard of protection at each river cross-section.
7.4 The final deliverables to the Environment Agency included all flood extent maps in ArcGIS .shp
format as requested in the brief, plus a technical report including tables detailing the water level
and flow at each model node, and long section plots for each watercourse for the ‘with
defences’ model results.
7.5 Modelling of the undefended scenario and the generation of areas benefitting from defences is
being undertaken separately for the three fenland sub-catchments (Lower Witham, South Forty
Foot and Stonebridge) using a TUFLOW 2D model. The methodology and deliverables will be
presented separately.
RECOMMENDATIONS
7.6 The following actions should be considered in any future work to improve the Lower Witham
FMI model and accuracy of flood mapping:
� The model should be updated with new survey data as it becomes available;
� The LiDAR data on which part of the DTM used in the mapping is based, has been deemed
as being of questionable accuracy by the Environment Agency, but was used in this study in
the absence of more accurate data. The DTM, model and resultant mapping should be
updated when more accurate LiDAR data becomes available in the future.
� There are many individual siphons and penstocks in the Lower Witham catchment which link
individual drains with other parts of the floodplain and main river system. It was agreed with
the Environment Agency that the majority of these should be assumed to be closed during
the design event and as a result there was no requirement to add these to the model. Where
siphons and penstocks have been modelled as open in the design condition it was necessary
to make assumptions concerning dimensions and inverts in a number of cases as they are
not included in the surveys. The collection of further survey data would be beneficial to
improve the accuracy of the model, both for the existing siphons and penstocks in the model
and those which are not currently modelled in case they need to be added in the future.
� The upper part of Ruskington Beck was not joined to the main 1D model for the final design
runs due to some non-convergence issues and the requirement for a small timestep which
would have significantly increased the run time of the main model. Further work to improve
the convergence and run time would be beneficial to allow this part of the model to be
permanently joined to the main model.
� The left bank floodplain at Langworth Gauging Station should be re-schematised to utilise
overbank spills rather than extended cross-sections. This will enable the model to produce
more accurate water levels at the gauging station.

AECOM Witham Catchment Flood Map Improvements – Phase 2 70
CONCLUSIONS
7.7 This report has provided details of the hydraulic modelling and flood mapping undertaken in the
course of the Lower Witham Flood Map Improvements study. The study has resulted in a
hydraulic model that is considered ‘fit for purpose’ and flood extents that are of the required
accuracy for use by the Environment Agency.
7.8 All deliverables specified in the Environment Agency’s original brief have been supplied. This
report has documented the methodology applied to produce these deliverables.

AECOM Witham Catchment Flood Map Improvements – Phase 2 71
This page is left blank intentionally

Appendix A – Barlings Eau Pre-Feasibility

This page is left blank intentionally

AECOM Witham Catchment Flood Map Improvements – Phase 2 74
Introduction
The Witham Flood Map Improvements (Phase 2) brief included a pre-feasibility analysis for
floodplain optimisation on the Barlings Eau. The brief set out that this analysis should occur
following the completion of the Standard of Protection Analysis, prior to the undefended and
ABD elements of the project. It was agreed with the Environment Agency at a meeting on the
17th July 2008 that a full pre-feasibility study is not required. Instead it was agreed that Faber
Maunsell would undertake a preliminary pre-feasibility analysis (PPFS) to look at the hydraulic
effects of flood management options using the updated InfoWorks RS model, but not a cost-
benefit analysis and environmental assessment. Consequently, our proposal included a fee
estimate for the preliminary analysis not the full pre-feasibility study.
It was agreed with the Environment Agency that the analysis of flood management options
would cover the Barlings Eau from the confluence with the Witham upstream as far as
Langworth. The flood management options would focus on the lower reaches of the Barlings
Eau and also on the village of Langworth, since these are the locations where overtopping of
defences has caused significant flood risk to property during recent historical events. The
purpose of the analysis is to investigate flood management options to increase the standard of
protection at these locations without reducing the standard of protection at upstream or
downstream locations.
Overview of Hydrology and Modelling Updates Faber Maunsell updated and re-calibrated the Lower Witham catchment hydraulic model using
InfoWorks RS software in 2007. This update of the modelling was undertaken as part of the
larger Witham Catchment Strategic Model (WiCSM) project which commenced in 2005. The
calibration process included the November 2000 and February 2001 events and a good match
to the observed flood levels and extents was achieved.
Following calibration of the model, new design hydrology estimates were developed, and the
model is currently undergoing development for the purposes of flood mapping. The
development of the model has focussed on extending the model to accommodate the 1 in 1000
year flow plus an allowance for climate change, and on the scaling of inflow boundaries to
match the design hydrology estimates. The Lower Witham ISIS model, from which the WiCSM
calibration model originates, already included representations of the fens bordering the Lower
Witham and Delphs. Therefore, the development of floodplains has primarily focussed on the
tributaries of the Witham.
As part of the model development process, the schematisation of all floodplains is being
reviewed to ensure it is appropriate for the purposes of flood mapping. In addition, any
additional survey data which has become available since the WiCSM model calibration is being
incorporated to improve the accuracy of the model.
Although the WiCSM calibration model included the floodplains of the Barlings Eau, these were
represented in the model as extended cross-sections which is a legacy of the original ISIS
model. This schematisation was considered acceptable during WICSM model calibration
because there was not significant out of bank flow in the two calibration events. However,
during model development for the flood map improvements (FMI) project, it was considered
necessary to re-schematise large parts of the Barlings Eau floodplain using overbank spills to
1D storage areas. In the areas where it was applied, this schematisation is considered more
representative of the real flooding mechanism for more extreme events; it will result in more
accurate flood mapping than using extended cross-sections, and will facilitate linked 1D-2D
modelling in the future.
Appendix A – Barlings Eau Pre-
Feasibility

AECOM Witham Catchment Flood Map Improvements – Phase 2 75
The latest design hydrology estimates adopt an FEH statistical approach, in contrast to the
original study which was based on a calibrated rainfall-runoff approach. The differences in
hydrological approach have the potential to change the peak flows and volumes, and therefore
the standards of protection which are produced by the updated model may not match those
currently accepted based on the results of the previous Lower Witham ISIS model.
Because the results of the Barlings Eau PPFS were required prior to completion of the model to
be used for the final flood mapping and SoP outputs, the model used in the PPFS is necessarily
an interim version. However, efforts in model development have concentrated on producing
accurate representations of the floodplain on the Barlings Eau, Marsh Drain and Lower reaches
of Stainfield Beck. Similarly, efforts in scaling the hydrological inputs to match the design
hydrological estimates have focussed on attaining the required flows for the Barlings Eau,
Stainfield Beck, and all the major inputs to the Lower Witham which are important in
determining water levels around the confluence of the Barlings Eau and the Old Witham. The
water levels in this area are important as there is a significant backwater effect which
contributes to the flood risk on the Barlings Eau.
Despite the fact that the PPFS is based on an interim version of the FMI model, it is considered
that the model is sufficiently well developed to produce meaningful results for the study, at least
in terms of the relative changes in water levels. Although it is not anticipated that the flood
mapping extents and the standards of protection will vary significantly between the PPFS study
and the final flood map improvements model, there is a risk that this could occur. Changes to
the modelled water levels are most likely to occur as a result of ongoing work to refine the rules
at the Grand Sluice. This has the potential to affect water levels on the Witham at Bardney,
which in turn would alter the backwater effect on Barlings Eau.
Existing Flooding Pattern and Mechanism
In developing the model for use in the PPFS, it was necessary to check that the model was
accurately simulating the pattern and mechanisms of flooding as observed during recent
events. This allowed the model development to focus on correcting inaccuracies in overbank
spill levels, and resulted in an ‘existing’ model which gives realistic standards of protection to
provide a base case against which to judge the PPFS options.
Observed Flooding
Environment Agency staff provided a detailed account of the locations where flood defences
were overtopped during recent extreme flood events, and details of any remedial works which
have been carried out since. The two main locations where formal defences were overtopped
in the Summer 2007 flood events were:
� On the right bank of the Barlings Eau, downstream of the road bridge in Langworth village;
� On the left bank of the Barlings Eau into Stainfield Fen, approximately 1km upstream of the
confluence with the Old Witham.
Developing flood management options to increase the standard of protection at these locations,
without reducing the standard elsewhere, is the main objective of this PPFS.
In addition there was flooding out of the main channel at other locations along the Barlings Eau,
but these occurred in areas that are allowed to flood naturally where there are no formal
defences. Further details of these locations are provided in Table A1 below.
Modelled Flooding
The FMI model was developed from the WiCSM calibration model to ensure that the simulated
flooding pattern and mechanism is consistent with the observed. Of primary importance in this
was the correct definition of overbank spill levels, and the following data sources were used to
define these in the updated FMI model:
� Stainfield Fen flood bank survey, EDI 2008;
� Long section bank survey of Barlings Eau, Ratcliff 1998;
� LiDAR data;
� Discussions with Environment Agency Staff.

AECOM Witham Catchment Flood Map Improvements – Phase 2 76
In a number of cases the bank top/defence levels provided by the survey and LiDAR were
considered to be inappropriate for entry into the model, either because the survey did not pick
up a realistic maximum line of defence, or the Environment Agency have undertaken works to
raise defences since the summer 2007 events. Notable such locations are:
� On the right bank upstream of Langworth road bridge, Langworth. This area is not formally
defended and water overtops to flood the adjacent field. The spill level was not accurately
picked up by the survey data or LiDAR. EA staff advised that a spill level of 6.2m AOD is
appropriate.
� For the setback defence at Scothern Lane, Langworth. EA staff advised that this defence
was constructed to 7.2m AOD in 1994 but was subsequently raised to 7.3m AOD following
the summer 2007 floods.
� At the low spot which overtops into Stainfield Fen from the left bank of the Barlings Eau at
approximate chainage 1km, EA staff advised that the low spot was raised to 4.25m AOD
following the summer 2007 floods. The elevation of the low spot prior to raising (from the
2008 survey) was 4.14m AOD.
Once all the spill levels in the model had been appropriately set to existing levels, the 1 in 5 and
1 in 10 year events were modelled. The preliminary flood mapping output for these two events
can be seen in Figures A4 and A5 respectively.
The modelling shows that the standards of protection at the key locations are:
� Barlings Eau RB, downstream of the road bridge in Langworth Village – approximately 1 in 5
years;
� Barlings Eau LB chainage 1km – 1 in 5 to 1 in 10 years.
Further details on the relative order at which banks/defences are overtopped is provided in
Table A1. This includes areas which are not formally defended and gives an idea of the relative
standard at different locations during a catchment wide design flood event. During a localised
or multi-peaked observed event the order of overtopping is likely to be different.
The locations of flooding in Table A1, their relative order and likely extents (Figure A5) were
reviewed by Environment Agency staff and confirmed to be realistic. It was therefore concluded
that the model was sufficiently accurate to use as an ‘existing situation’ (base case) for the
investigation of flood management options.
Order Channel Bank Chainage (m)
Location Formal Defence
Comment
1 Barlings Eau Left 4500 Gatecliff Wood No
2 Barlings Eau Left 5200 Opposite Stainfield Grange No
3 Abbey Island Right 150 Abbey Island No
First spill to start filling Abbey Island between Barlings Eau and Marsh Drain (followed quickly by other spills from both watercourses)
5 Barlings Eau Right 7900 U/s of Langworth Bridge No Embanked but not part of EA formal defence
6 Barlings Eau Left 3500 U/s of Ferry House No
7 Barlings Eau Right 6000 Newball Wood Cottages No Contained by higher ground behind bank
8 Barlings Eau Right 7767 D/s of Langworth Bridge Yes
Fills area adjacent to gauging station
9 Old Witham n/a Branston Island Sluice n/a
Gates open when level in Old Witham reaches 3.87m AOD
10 Stainfield Beck Left 992
Opposite Stainfield Grange Yes
Spills from low spot of 4.48m as advised by EA
11 Barlings Eau Left 1000 Stainfield Fen Yes
Spills from low spot of 4.25m AOD as advised by EA
Table A1: Relative order of overtopping at 1 in 10 year return period (Defended areas in Bold

AECOM Witham Catchment Flood Map Improvements – Phase 2 77
Options Considered
At the proposal stage, it was identified by Faber Maunsell that flooding over the left bank of the
Barlings Eau into Stainfield Fen is likely to be more significantly influenced by high water levels
in the River Witham than flows from the Barlings Eau. Therefore the hydraulic benefit of
floodplain optimisation measures on the Barlings Eau is unlikely to be significant in increasing
the standard of service at this location. This view was based on Faber Maunsell’s previous
knowledge and experience of modelling in the catchment. As a result of this it was proposed
that the analysis of flood management options would be undertaken in two parts, to look at
options for the standard of protection in Langworth village separately from options for the lower
reaches of the Barlings Eau. It was agreed that the interaction between options for the two
areas would be ignored at the preliminary pre-feasibility stage.
Lower Reaches of Barlings Eau
In order to test the hypothesis that the backwater effect from the Lower Witham is the most
significant factor in overtopping of the Barlings Eau embankment into Stainfield Fen, it was
considered appropriate to undertake a sensitivity analysis whereby the Lower Witham model is
run with a baseflow on the Barlings Eau, but with full flood inflows on the Lower Witham and
other tributaries. This would determine whether floodplain optimisation measures on the lower
reaches of the Barlings Eau are appropriate. If the flooding mechanism is predominantly from
the backwater effect from the Lower Witham then the options for alleviation would revert to the
off-line storage options identified during the Lower Witham Strategy Review.
Langworth Village
It was agreed at a meeting between Faber Maunsell and the Environment Agency on 18th
March 2009 that the following specific options would be investigated with a view to increasing
the standard of protection in Langworth Village:
• Option 1 - Raising defences on the right bank of the Barlings Eau downstream of the
road bridge
• Option 2 – Providing on-line flood storage upstream of the railway embankment
• Option 3 – Setting back the left embankment of the Barlings Eau, chainage 6km to
7km.
For all options in Langworth it was necessary to assess the impact on water levels at other
critical locations to ensure there are no negative impacts.
The results were analysed to determine if there is an option which decreases flood levels in
Langworth whilst not increasing flood levels downstream of Langworth.
Options Modelling
Details of the model set-up required to investigate each of the options is provided below:
Lower Reaches of Barlings Eau
The full Lower Witham model was set up with 1 in 10 year design hydrology for all inputs except
Barlings Eau and Welton Beck which were set to baseflow. It was not considered necessary to
model the 1 in 5 year event.
Langworth Village Option 1 – Bank Raising
The full Lower Witham model was set up with spills on the right bank between the road bridge
(chainage 7.77km) and chainage 6.5km raised well above the 1 in 10 year flood level. The
model was run with the 1 in 5 and 1 in 10 year hydrology.

AECOM Witham Catchment Flood Map Improvements – Phase 2 78
Langworth Village Option 2 - Storage
Using the existing situation model it was determined that water would begin to overtop the
defence on the right bank downstream of the road bridge at a flow of 31 cumecs. Between the
railway embankment and the road bridge there are two significant incoming tributary inflows on
the left bank as shown in Figure A1:
Figure A1: Significant tributary inflows between the railway embankment and Langworth Bridge
The downstream tributary is referred to as Bullington Beck, whilst the upstream tributary will be
referred to as Stainton Beck. The inflow from these two tributaries is calculated in the model as
part of a larger lumped hydrological catchment. These flows are input into the model as lateral
inflows which weight the flow from the larger lumped catchment according to the catchment
area of the two becks. Although this method will only approximately calculate the inflow of the
two tributaries, it is sufficiently accurate to demonstrate that they contribute a significant
proportion of the flows reaching Langworth Bridge. This matches the perceptions of
Environment Agency staff.
Given that the inflows from Bullington and Stainton Becks are significant, and these enter the
Barlings Eau downstream of the proposed storage site, a greater degree of throttling of flows is
required upstream of the railway bridge than would otherwise be the case. Table A2 shows the
peak flows that can be allowed to pass through the railway embankment at a 1 in 10 year return
period to limit flows reaching Langworth Bridge to 31 cumecs
Flows (cumecs) Return Period
Existing @ Rail Embankment
Combined from Becks (A)
Max d/s Langworth Bridge (B)
Throttle Max (B-A)
1 in 10 21.56 24.74 31.00 6.26
Table A2: Calculation of the maximum allowable pass forward flow at railway embankment
This map is reproduced from Ordnance Survey material with the permission of Ordnance Survey on behalf of the Controller of Her Majesty’s Stationery Office © Crown copyright. Unauthorised reproduction infringes on the Crown copyright and may lead to prosecution or civil proceedings. Environment Agency. 100026380, 2009

AECOM Witham Catchment Flood Map Improvements – Phase 2 79
The throttle at Langworth railway embankment was modelled using a QH relationship, in which
the existing QH relationship was used up to the maximum flow target, with the flow kept
constant at the target value with increasing stage beyond this point. The QH relationship was
entered into a copy of the full Lower Witham model and was run with the 1 in 10 year hydrology.
It was not considered necessary to run this option with the 1 in 5 year hydrology.
Langworth Village Option 3 – Setting back the left bank
For option 3, a change to the set-up of the existing model was required. In the existing model,
the floodplain on the left bank between chainages 6 and 7km was initially set up as extended
cross-sections. The model was set up in this way because the embankment is relatively low in
this area and is not a formal defence, therefore it overtops at a relatively low return period.
Therefore, modelling this reach as extended cross-sections was considered appropriate in
order to produce more accurate 1D flood mapping. The problem with this model
schematisation for investigation of the benefits of setting back the banks at low return periods,
is that flow will be conveyed behind the embankment before it is overtopped in the existing
situation, and therefore the full benefit of setting back the embankment would not be
demonstrated using the model.
To fully demonstrate the effects of setting back the banks at the 1 in 5 and 1 in 10 year return
periods, the existing model was amended to represent the floodplain as spills into a storage
area between chainages 6km and 7km. A second model was then set up to represent Option
3, in which the spill units were populated with approximate floodplain levels behind the
embankment to represent a scenario without the embankment in place. Simulations for the 1 in
5 and 1 in 10 year return periods were run and the modelled water levels were assessed and
compared to the existing Barlings Eau levels.
Model Results and Discussion
The full results of the PPFS modelling are presented in terms of the maximum water level at
each cross-section on the Barlings Eau in Tables A3 to A6. The model results at key locations
and their implications are discussed below.
Lower Reaches of Barlings Eau
The results in Table A4 show the effect on water levels of reducing flows on the Barlings Eau to
baseflow levels during a 1 in 10 year event (See column ‘Stainfield Sensitivity’). This shows
that the maximum reduction in water levels achieved at the location of the low spot on the left
bank of the Barlings Eau (Chainage ~1km) is 0.16m. This is the maximum reduction in water
levels that could be achieved by floodplain optimisation on the Barlings Eau and this
demonstrates that the water levels at this location are mainly a function of the backwater effect
from the Lower Witham system.
In reality, any floodplain optimisation on the Barlings Eau would reduce peak flows by a much
lesser amount than that modelled, and therefore any reduction in water levels in the lower
reaches of the Barlings Eau is likely to be small or insignificant. This is backed up by the
results from Options 1-3 for Langworth Village.
Langworth Village Option 1 - Bank raising
The results in Table A3 and A4 show that there is no significant change in water levels at any
point along the Barlings Eau as a result of raising the right bank downstream of Langworth
bridge. Initially this may seem surprising as logic would suggest that this option would push
more flow downstream thereby raising water levels. Following a closer inspection of the results
it appears that this effect does occur, but downstream water levels are only raised by a
maximum of 4mm, which is not enough to register an increase to 2 decimal places in the results
table.

AECOM Witham Catchment Flood Map Improvements – Phase 2 80
Another contributing factor is that the existing overtopping flow is only 0.28 cumecs at the 1 in
10 year return period, and therefore the flow increase as a result of raising this low spot would
be relatively insignificant in comparison to the 1 in 10 year existing flow of 36.5 cumecs at the
gauge.
In the lower reaches of the Barlings Eau it should not be expected that levels would be
significantly increased as a result of this option as the sensitivity analysis has shown that water
levels in this area are primarily influenced by backwater effects from the Lower Witham.
If this option is progressed to a full pre-feasibility study then the effects of bank raising at higher
return period events should be investigated as it is possible that increases in water level at
some downstream locations may be more significant.
Langworth Village Option 2 - Storage
The results in Table A4 show that the 1 in 10 year in-line storage option would reduce water levels by 0.2m at Langworth gauging station. With this reduction in water levels the spill on the right bank is just on the verge of overtopping and so it can be concluded that the standard of protection has increased from approximately 1 in 5 years to 1 in 10 years in Langworth village. As would be expected the benefits of storage are reduced further downstream with a reduction in water levels of 0.05m at the confluence with the Lower Witham. The trade off for this benefit is an increase in water levels upstream of the railway embankment of up to 1.00m. The increase in the flooded extent as a result of this is illustrated in Figure A2.
Figure A2: Option 2 Storage - Comparison of flooded extent upstream Of Langworth for existing situation (left) vs storage option (right)
A significant increase in standard of protection using on-line storage would require use of a
second storage site since the flows produced by Bullington and Stainton Becks would exceed
the 31 cumecs maximum ignoring the inflow from the upper reaches of the Barlings Eau. It
would therefore be necessary to identify a second storage site on one of the two incoming
becks. A preliminary review has identified the A158 road embankment which crosses
Bullington Beck near Bullington as a potential site. Figure A3 shows a 3D view of this location
where it may be possible to store water up to a level of 11m AOD.

AECOM Witham Catchment Flood Map Improvements – Phase 2 81
Figure A3: 3D view of potential secondary storage location on Bullington Beck showing 11m AOD contour
Langworth Village Option 3 – Setting back the left bank
The results in Tables A5 and A6 show that the change in the schematisation of the existing
model undertaken in order to investigate Options 3 has resulted in a slight change in existing
water levels. The increase in water levels is a maximum of 0.11m around Langworth village at
the 1 in 5 year event. The change in water levels is much less marked for the 1 in 10 year
return period with many locations actually showing a decrease in water levels. This is not
particularly surprising as it is likely that the revised schematisation will have less impact on
water levels with increasing return period as the storage behind the embankment becomes fully
utilised well before the peak of the event. For the purpose of assessing the benefit of Options 3
the results were compared against the revised existing schematisation (spills into a storage
area) to ensure consistency.
The results show that as a result of removing the left embankment between chainages 6 and
7km, water levels are reduced upstream by up to 0.2m for the 1 in 5 year event and 0.12m for
the 1 in 10 year return period at Langworth gauging station. It is to be expected that there is a
bigger reduction in water levels at a lower return period because the area behind the
embankment will have a greater unused storage volume. As return periods increase it is likely
that the benefit of this option will diminish to zero, because the storage behind the embankment
would fill up prior to the peak of the event. It can also be seen that there is benefit from this
option in the lower reaches of the Barlings Eau with water levels reduced by 0.05m at the 1 in 5
year event. At the 1 in 10 year event and above this benefit disappears as the influence of the
backwater effect from the Lower Witham increases.
The observed hydraulic effects makes this an attractive hydraulic option for flood risk
management on the Barlings Eau because the existing standard of service for Langworth and
the Lower reaches of the Barlings Eau is between a 1 in 5 and 1 in 10 year return period. The
option is most effective at reducing water levels all along the Barlings Eau at the 1 in 5 year
event, and therefore it will achieve a small increase in the standard of service at both upstream

AECOM Witham Catchment Flood Map Improvements – Phase 2 82
and downstream locations. The maximum increase in standard that can be achieved in the
lower reaches of the Barlings Eau appears to be to a 1 in 10 year event as by this return period
the backwater effect from the Lower Witham is more dominant. However, the results suggest
that at Langworth village this option can increase the standard of protection beyond the 1 in 10
year return period.
Conclusions and Recommendations The conclusions that were drawn from the Barlings Eau PPFS modelling, and
recommendations for future work are as follows:
Lower Reaches of Barlings Eau
The modelling has shown that water levels in the lower reaches of the Barlings Eau are mainly
caused by the backwater effect from the Lower Witham, rather than the flows in the Barlings
Eau. It was shown that the maximum reduction in water levels that can be achieved by reducing
peak flows in the Barlings Eau is 0.16m at the 1 in 10 year event and in reality any reduction
due to flood management options on the Barlings Eau is likely to be insignificant.
In light of the above, it is recommended that the Environment Agency refer to the off-line
storage options identified during the Lower Witham Strategy Review in order to determine
whether an increase in standards of protection can be achieved in this area.
Langworth Village Option 1 - Bank raising
The modelling has shown that raising the defences on the right bank downstream of Langworth
Bridge has not significantly increased water levels at any location along the Barlings Eau during
a 1 in 5 or 1 in 10 year return period. It is therefore concluded that this is a hydraulically
feasible option to increase the standards of protection in Langworth Village, and it would be
worth considering this option as part of a full pre-feasibility study.
It is recommended that if this option is investigated further, the hydraulic effects are investigated
for all return periods, since there is the potential for events of greater return period than the 1 in
10 year event to produce a more significant downstream water level increase.
Langworth Village Option 2 - Storage
The modelling has shown that on-line storage upstream of the railway embankment at
Langworth has the potential to reduce water levels in Langworth village by approximately 0.2m
at the 1 in 10 year return period event. This would increase the standard of service of the
existing defence on the right bank downstream of Langworth Bridge from the current 1 in 5 year
to a 1 in 10 year standard. In order to achieve this, water needs to be stored upstream of the
railway embankment to a level 1m higher than the existing 1 in 10 year water level. This results
in a significant increase in the flood extents upstream of the railway embankment. If the
Environment Agency wish to investigate storage to a standard greater than 1 in 10 years it will
be necessary to investigate a secondary storage site on either Bullington or Stainton Becks. As
part of this, it would be advisable to calculate the hydrological inputs from Stainton and
Bullington Becks in more detail, rather than relying on the current (strategic level) lumped
approach.
It is considered unlikely that upstream storage would turn out to be the preferred option if it was
investigated as part of a full pre-feasibility study. This is because of the large volumes of water
that need to be stored and the likely high costs of providing the required storage for a relatively
modest increase in standards of protection. It is recommended that these points are
considered by the Environment Agency in deciding whether to include a storage option as part
of any full pre-feasibility study.

AECOM Witham Catchment Flood Map Improvements – Phase 2 83
Langworth Village Option 3 – Setting back the left bank
The modelling has shown that there is a significant benefit to setting back the left bank between
chainages 6 and 7km on the Barlings Eau. This option will increase the standard of protection
at Langworth village beyond the 1 in 10 year event and also shows a benefit in the lower
reaches of the Barlings Eau for events less than the 1 in 10 year return period. As the existing
standard of protection from the left bank of the lower reaches of Barlings Eau is between 1 in 5
and 1 in 10 years, it is likely that this option will result in modest increase in the standard of
protection at this location. At the 1 in 10 year event and above, the backwater effect from the
Lower Witham becomes dominant, negating any benefits seen further upstream.
It is therefore concluded that this is a hydraulically feasible option to increase the standards of
protection in Langworth Village and in the Lower reaches of the Barlings Eau, and it would be
worth considering this option as part of a full pre-feasibility study. It is considered likely that this
option would stand a good chance of becoming the preferred option when considered as part of
a full pre-feasibility study, since the costs would be relatively low and benefits are seen at both
upstream and downstream locations. If this option is progressed to full pre-feasibility study
stage, then it is recommended that the effects at return periods greater than the 1 in 10 year
event are investigated using the model.
Summary
This preliminary pre-feasibilty study has investigated the hydraulic performance of a number of
flood risk management options for the Barlings Eau, with the objective of increasing the
standards of protection in the Lower reaches of the Barlings Eau and at Langworth village.
It was found that water levels in the lower reaches of the Barlings Eau are dominated by the
backwater effect from the Lower Witham at return periods of 1 in 10 years and above.
Therefore, to increase standards of protection beyond the 1 in 10 year return period would
require an option that achieved a reduction in water levels in the whole of the Lower Witham
system, such as the off-line storage options identified during the Lower Witham Strategy
Review.
At Langworth village, three options were investigated to increase the standard of protection and
all three achieved a significant benefit without a reduction in standards elsewhere. The
upstream storage option produced the most significant benefit in terms of reduction in water
levels but the costs of this option are likely to be significant and further investigation into the
most appropriate storage site(s) will be necessary.
The option to set back the left bank between chainages 6 and 7km on the Barlings Eau would
appear to be the best option hydraulically since this results in an increase in standards of
protection at both upstream and downstream locations. The costs involved with this option are
likely to be relatively modest and it is therefore considered likely that it would be the preferred
option in a full pre-feasibility study.
The Environment Agency may wish to consider investigating the benefits of combining Option 1
(bank raising) with Option 2 (setting back the left bank) as it is likely that this could achieve a
further increase in standard of protection at Langworth without affecting standards downstream.
Initially this could be done as a preliminary hydraulic feasibility as an extension of this report.
It is recommended that the Environment Agency give consideration to the findings of this
preliminary pre-feasibility study to decide whether it would be worth progressing to a full pre-
feasibility assessment. If this is the case, Faber Maunsell would need to review the outline
costs submitted as part of the original Lower Witham FMI proposal.

AECOM Witham Catchment Flood Map Improvements – Phase 2 84
Figure A4: Existing 1 in 5 year Event – Preliminary Flood Mapping Extents (Spills which are operating highlighted red)
This map is reproduced from Ordnance Survey material with the permission of Ordnance Survey on behalf of the Controller of Her Majesty’s Stationery Office © Crown copyright. Unauthorised reproduction infringes on the Crown copyright and may lead to prosecution or civil proceedings. Environment Agency. 100026380, 2009

AECOM Witham Catchment Flood Map Improvements – Phase 2 85
Figure A5: Existing 1 in 10 year Event – Preliminary Flood Mapping Extents (Spills which are operating highlighted red)
This map is reproduced from Ordnance Survey material with the permission of Ordnance Survey on behalf of the Controller of Her Majesty’s Stationery Office © Crown copyright. Unauthorised reproduction infringes on the Crown copyright and may lead to prosecution or civil proceedings. Environment Agency. 100026380, 2009

AECOM Witham Catchment Flood Map Improvements – Phase 2 86
Modelling Results
1 in 5 year Water Levels (m AOD)
Location Model Node Existing
Langworth
Option 1
Change vs
Existing
Welton Beck confluence BE_11714!!_ESL 7.40 7.40 0.00
BE_11224_ESL 7.26 7.26 0.00
BE_10272_ESL 7.05 7.05 0.00
BE_10215_ESL 6.89 6.89 0.00
BE_09702_ESL 6.79 6.79 0.00
Stainton Lane bridge u/s BE_09588_ESL! 6.77 6.77 0.00
Stainton Lane bridge d/s BE_09588_ESL 6.75 6.75 0.00
BE_09206_ESL 6.70 6.70 0.00
Railway Embankment u/s BE_08820_ESL 6.61 6.61 0.00
Railway Embankment d/s BE_08775 6.59 6.59 0.00
Stainton Beck confluence BE_08600 6.57 6.57 0.00
BE_08300 6.55 6.55 0.00
BE_08200 6.53 6.53 0.00
BE_08100 6.52 6.52 0.00
BE_08000 6.52 6.52 0.00
Bullington Beck confluence BE_07900 6.51 6.51 0.00
Langworth Bridge u/s BE_07792 6.40 6.40 0.00
Langworth Bridge d/s BE_07767 6.36 6.36 0.00
BE_07700 6.33 6.33 0.00
Langworth gauging station BE_07700! 6.32 6.32 0.00
BE_07682d 6.29 6.29 0.00
BE_07600 6.28 6.28 0.00
BE_07500 6.25 6.25 0.00
BE_07000 6.00 6.00 0.00
BE_06500 5.77 5.78 0.00
Newball Wood House BE_06000 5.51 5.51 0.00
BE_05500 5.12 5.12 0.00
BE_05200 4.91 4.91 0.00
BE_05000 4.88 4.88 0.00
BE_04500 4.84 4.84 0.00
BE_04102 4.57 4.57 0.00
Gate Cliffe Farm bridge BE_04102! 4.57 4.57 0.00
BE_04000 4.54 4.54 0.00
BE_03900 4.48 4.48 0.00
BE_03600 4.35 4.35 0.00
BE_03500 4.34 4.34 0.00
BE_03000 4.34 4.34 0.00
BE_02900 4.34 4.34 0.00
Barlings Abbey BE_02800 4.34 4.34 0.00
BE_02688 4.33 4.33 0.00
BE_02677 4.33 4.33 0.00
BE_02500 4.33 4.33 0.00
BE_02300 4.33 4.33 0.00
BE_02100 4.33 4.33 0.00
BE_02000 4.33 4.33 0.00
BE_01800 4.33 4.33 0.00
Stainfield Beck confluence BE_01700 4.33 4.33 0.00
BE_01700! 4.33 4.33 0.00
BE_01590 4.33 4.33 0.00
BE_01500 4.33 4.33 0.00
BE_01000 4.33 4.33 0.00
BE_00790 4.33 4.33 0.00
BE_00500 4.33 4.33 0.00
Short Ferry Bridge BE_00430! 4.33 4.33 0.00
BE_00430 4.33 4.33 0.00
BE_00400 4.33 4.33 0.00
BE_00100 4.33 4.33 0.00
BE_00100! 4.33 4.33 0.00
Table A3: Barlings Eau PPFS Modelling Results – 1 in 5 year Existing and Option 1

AECOM Witham Catchment Flood Map Improvements – Phase 2 87
1 in 10 year Water Levels (m AOD)
Location Model Node Existing
Stainfield
Sensitivity
Change
vs
Existing
Langworth
Option 1
Change
vs
Existing
Langworth
Option 2
Change
vs
Existing
Welton Beck confluence BE_11714!!_ESL 7.51 5.67 -1.85 7.51 0.00 7.77 0.25
BE_11224_ESL 7.40 5.44 -1.96 7.40 0.00 7.74 0.35
BE_10272_ESL 7.17 5.07 -2.10 7.17 0.00 7.74 0.57
BE_10215_ESL 7.00 4.78 -2.22 7.01 0.00 7.73 0.73
BE_09702_ESL 6.89 4.63 -2.27 6.90 0.00 7.73 0.84
Stainton Lane bridge u/s BE_09588_ESL! 6.88 4.60 -2.28 6.88 0.00 7.73 0.85
Stainton Lane bridge d/s BE_09588_ESL 6.86 4.60 -2.26 6.86 0.00 7.73 0.87
BE_09206_ESL 6.81 4.53 -2.28 6.81 0.00 7.73 0.93
Railway Embankment u/s BE_08820_ESL 6.73 4.43 -2.30 6.74 0.00 7.73 1.00
Railway Embankment d/s BE_08775 6.71 4.43 -2.28 6.71 0.00 6.47 -0.25
Stainton Beck confluence BE_08600 6.69 4.41 -2.29 6.70 0.00 6.46 -0.23
BE_08300 6.67 4.37 -2.30 6.67 0.00 6.46 -0.22
BE_08200 6.66 4.36 -2.30 6.66 0.00 6.45 -0.21
BE_08100 6.65 4.35 -2.30 6.66 0.00 6.44 -0.21
BE_08000 6.65 4.35 -2.30 6.65 0.00 6.44 -0.21
Bullington Beck confluence BE_07900 6.64 4.33 -2.31 6.64 0.00 6.43 -0.21
Langworth Bridge u/s BE_07792 6.52 4.32 -2.20 6.52 0.00 6.33 -0.19
Langworth Bridge d/s BE_07767 6.46 4.32 -2.14 6.46 0.00 6.29 -0.17
BE_07700 6.45 4.32 -2.13 6.45 0.00 6.26 -0.18
Langworth gauging station BE_07700! 6.44 4.32 -2.12 6.45 0.00 6.25 -0.19
BE_07682d 6.41 4.32 -2.10 6.42 0.00 6.22 -0.20
BE_07600 6.40 4.31 -2.08 6.40 0.00 6.21 -0.19
BE_07500 6.37 4.31 -2.06 6.38 0.00 6.18 -0.19
BE_07000 6.11 4.30 -1.81 6.12 0.00 5.93 -0.18
BE_06500 5.88 4.29 -1.59 5.88 0.00 5.71 -0.17
Newball Wood House BE_06000 5.61 4.29 -1.32 5.61 0.00 5.43 -0.17
BE_05500 5.18 4.28 -0.90 5.18 0.00 5.08 -0.11
BE_05200 4.94 4.28 -0.66 4.94 0.00 4.88 -0.05
BE_05000 4.91 4.28 -0.63 4.91 0.00 4.85 -0.06
BE_04500 4.89 4.28 -0.61 4.89 0.00 4.81 -0.08
BE_04102 4.63 4.28 -0.35 4.63 0.00 4.55 -0.09
Gate Cliffe Farm bridge BE_04102! 4.63 4.28 -0.35 4.63 0.00 4.54 -0.08
BE_04000 4.60 4.28 -0.32 4.60 0.00 4.52 -0.08
BE_03900 4.52 4.28 -0.24 4.52 0.00 4.46 -0.06
BE_03600 4.47 4.28 -0.19 4.47 0.00 4.38 -0.09
BE_03500 4.47 4.28 -0.19 4.47 0.00 4.38 -0.09
BE_03000 4.47 4.28 -0.19 4.46 0.00 4.38 -0.08
BE_02900 4.47 4.28 -0.19 4.46 0.00 4.38 -0.08
Barlings Abbey BE_02800 4.47 4.28 -0.19 4.46 0.00 4.38 -0.08
BE_02688 4.45 4.28 -0.18 4.45 0.00 4.38 -0.07
BE_02677 4.46 4.28 -0.18 4.46 0.00 4.38 -0.08
BE_02500 4.45 4.28 -0.18 4.46 0.00 4.38 -0.07
BE_02300 4.45 4.28 -0.18 4.46 0.00 4.38 -0.07
BE_02100 4.45 4.28 -0.18 4.46 0.00 4.38 -0.07
BE_02000 4.46 4.28 -0.18 4.46 0.00 4.38 -0.08
BE_01800 4.46 4.28 -0.18 4.46 0.00 4.38 -0.08
Stainfield Beck confluence BE_01700 4.45 4.28 -0.17 4.45 0.00 4.38 -0.07
BE_01700! 4.45 4.28 -0.17 4.45 0.00 4.38 -0.07
BE_01590 4.45 4.28 -0.17 4.45 0.00 4.38 -0.07
BE_01500 4.45 4.28 -0.17 4.45 0.00 4.38 -0.07
BE_01000 4.44 4.28 -0.16 4.44 0.00 4.38 -0.06
BE_00790 4.44 4.28 -0.16 4.44 0.00 4.38 -0.06
BE_00500 4.44 4.28 -0.16 4.44 0.00 4.38 -0.06
Short Ferry Bridge BE_00430! 4.44 4.28 -0.16 4.44 0.00 4.38 -0.06
BE_00430 4.43 4.28 -0.16 4.43 0.00 4.38 -0.05
BE_00400 4.43 4.28 -0.16 4.43 0.00 4.38 -0.05
BE_00100 4.43 4.28 -0.15 4.43 0.00 4.38 -0.05
BE_00100! 4.43 4.28 -0.15 4.43 0.00 4.38 -0.05
Table A4: Barlings Eau PPFS Modelling Results – 1 in 10 year Existing and Options 1 & 2

AECOM Witham Catchment Flood Map Improvements – Phase 2 88
1 in 5 year Water Levels (m AOD)
Location Model Node Existing
Existing (spills
along
embankment)
Change
vs
Existing
Langworth
Option 3
(embankment
removed)
Existing (with
emb) vs
Option 3
(emb
removed)
Welton Beck confluence BE_11714!!_ESL 7.40 7.48 0.09 7.47 -0.01
BE_11224_ESL 7.26 7.36 0.10 7.35 -0.01
BE_10272_ESL 7.05 7.13 0.09 7.14 0.01
BE_10215_ESL 6.89 6.98 0.08 6.96 -0.02
BE_09702_ESL 6.79 6.87 0.08 6.83 -0.04
Stainton Lane bridge u/s BE_09588_ESL! 6.77 6.86 0.09 6.80 -0.05
Stainton Lane bridge d/s BE_09588_ESL 6.75 6.84 0.08 6.78 -0.06
BE_09206_ESL 6.70 6.78 0.09 6.70 -0.08
Railway Embankment u/s BE_08820_ESL 6.61 6.71 0.10 6.58 -0.13
Railway Embankment d/s BE_08775 6.59 6.69 0.10 6.55 -0.14
Stainton Beck confluence BE_08600 6.57 6.67 0.10 6.53 -0.15
BE_08300 6.55 6.65 0.10 6.49 -0.16
BE_08200 6.53 6.64 0.11 6.47 -0.16
BE_08100 6.52 6.63 0.11 6.46 -0.17
BE_08000 6.52 6.62 0.11 6.45 -0.17
Bullington Beck confluence BE_07900 6.51 6.62 0.11 6.44 -0.18
Langworth Bridge u/s BE_07792 6.40 6.49 0.09 6.30 -0.19
Langworth Bridge d/s BE_07767 6.36 6.43 0.08 6.26 -0.18
BE_07700 6.33 6.41 0.09 6.22 -0.20
Langworth gauging station BE_07700! 6.32 6.41 0.09 6.21 -0.20
BE_07682d 6.29 6.37 0.09 6.16 -0.22
BE_07600 6.28 6.36 0.08 6.13 -0.23
BE_07500 6.25 6.33 0.08 6.09 -0.24
BE_07000 6.00 6.02 0.02 5.63 -0.39
BE_06500 5.77 5.87 0.09 5.58 -0.29
Newball Wood House BE_06000 5.51 5.61 0.09 5.55 -0.06
BE_05500 5.12 5.18 0.06 5.15 -0.04
BE_05200 4.91 4.94 0.03 4.92 -0.02
BE_05000 4.88 4.91 0.04 4.89 -0.02
BE_04500 4.84 4.89 0.05 4.86 -0.03
BE_04102 4.57 4.63 0.06 4.59 -0.04
Gate Cliffe Farm bridge BE_04102! 4.57 4.63 0.06 4.59 -0.04
BE_04000 4.54 4.60 0.05 4.56 -0.03
BE_03900 4.48 4.52 0.04 4.50 -0.02
BE_03600 4.35 4.46 0.11 4.37 -0.09
BE_03500 4.34 4.46 0.12 4.37 -0.10
BE_03000 4.34 4.46 0.12 4.36 -0.10
BE_02900 4.34 4.46 0.12 4.36 -0.10
Barlings Abbey BE_02800 4.34 4.46 0.12 4.36 -0.10
BE_02688 4.33 4.45 0.12 4.34 -0.11
BE_02677 4.33 4.45 0.12 4.35 -0.10
BE_02500 4.33 4.45 0.11 4.34 -0.10
BE_02300 4.33 4.45 0.11 4.34 -0.11
BE_02100 4.33 4.45 0.11 4.34 -0.11
BE_02000 4.33 4.45 0.12 4.34 -0.11
BE_01800 4.33 4.45 0.12 4.34 -0.11
Stainfield Beck confluence BE_01700 4.33 4.45 0.11 4.34 -0.11
BE_01700! 4.33 4.45 0.11 4.34 -0.11
BE_01590 4.33 4.44 0.11 4.34 -0.11
BE_01500 4.33 4.44 0.11 4.34 -0.11
BE_01000 4.33 4.44 0.11 4.33 -0.11
BE_00790 4.33 4.44 0.11 4.33 -0.11
BE_00500 4.33 4.43 0.11 4.33 -0.11
Short Ferry Bridge BE_00430! 4.33 4.43 0.11 4.32 -0.11
BE_00430 4.33 4.43 0.10 4.32 -0.11
BE_00400 4.33 4.43 0.10 4.32 -0.11
BE_00100 4.33 4.43 0.10 4.32 -0.11
BE_00100! 4.33 4.43 0.10 4.32 -0.11
Table A5: Barlings Eau PPFS Modelling Results – 1 in 5 year Existing and Option 3
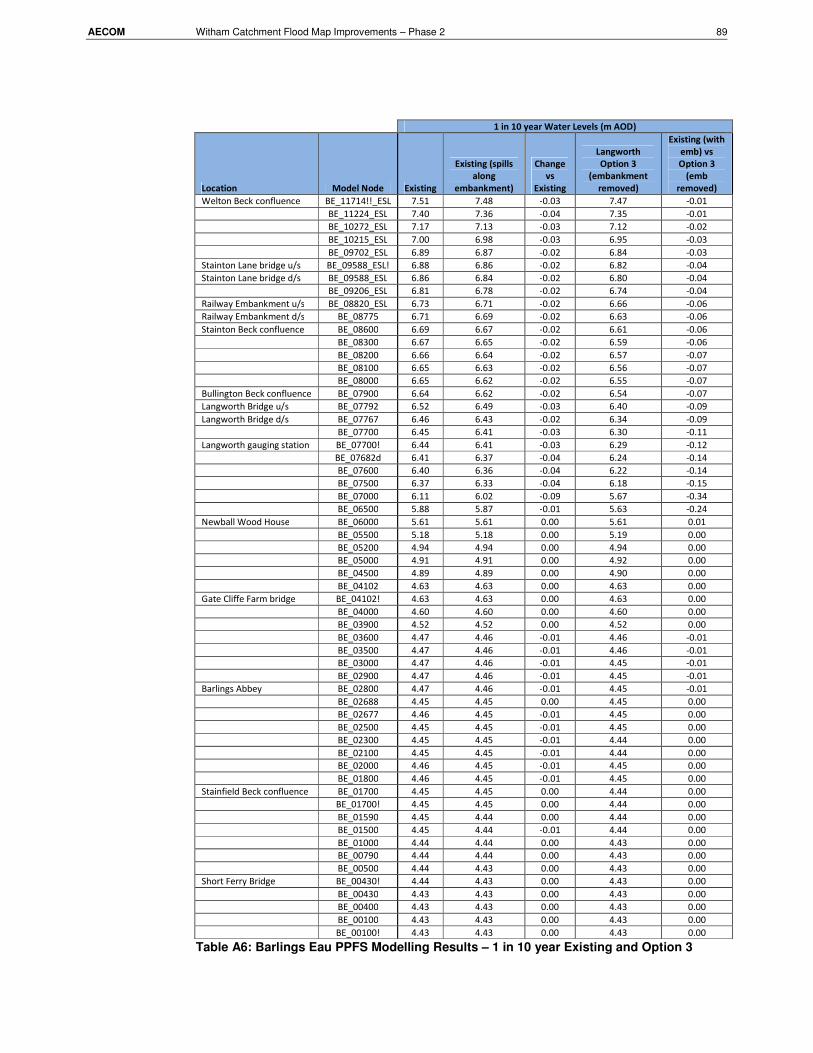
AECOM Witham Catchment Flood Map Improvements – Phase 2 89
1 in 10 year Water Levels (m AOD)
Location Model Node Existing
Existing (spills
along
embankment)
Change
vs
Existing
Langworth
Option 3
(embankment
removed)
Existing (with
emb) vs
Option 3
(emb
removed)
Welton Beck confluence BE_11714!!_ESL 7.51 7.48 -0.03 7.47 -0.01
BE_11224_ESL 7.40 7.36 -0.04 7.35 -0.01
BE_10272_ESL 7.17 7.13 -0.03 7.12 -0.02
BE_10215_ESL 7.00 6.98 -0.03 6.95 -0.03
BE_09702_ESL 6.89 6.87 -0.02 6.84 -0.03
Stainton Lane bridge u/s BE_09588_ESL! 6.88 6.86 -0.02 6.82 -0.04
Stainton Lane bridge d/s BE_09588_ESL 6.86 6.84 -0.02 6.80 -0.04
BE_09206_ESL 6.81 6.78 -0.02 6.74 -0.04
Railway Embankment u/s BE_08820_ESL 6.73 6.71 -0.02 6.66 -0.06
Railway Embankment d/s BE_08775 6.71 6.69 -0.02 6.63 -0.06
Stainton Beck confluence BE_08600 6.69 6.67 -0.02 6.61 -0.06
BE_08300 6.67 6.65 -0.02 6.59 -0.06
BE_08200 6.66 6.64 -0.02 6.57 -0.07
BE_08100 6.65 6.63 -0.02 6.56 -0.07
BE_08000 6.65 6.62 -0.02 6.55 -0.07
Bullington Beck confluence BE_07900 6.64 6.62 -0.02 6.54 -0.07
Langworth Bridge u/s BE_07792 6.52 6.49 -0.03 6.40 -0.09
Langworth Bridge d/s BE_07767 6.46 6.43 -0.02 6.34 -0.09
BE_07700 6.45 6.41 -0.03 6.30 -0.11
Langworth gauging station BE_07700! 6.44 6.41 -0.03 6.29 -0.12
BE_07682d 6.41 6.37 -0.04 6.24 -0.14
BE_07600 6.40 6.36 -0.04 6.22 -0.14
BE_07500 6.37 6.33 -0.04 6.18 -0.15
BE_07000 6.11 6.02 -0.09 5.67 -0.34
BE_06500 5.88 5.87 -0.01 5.63 -0.24
Newball Wood House BE_06000 5.61 5.61 0.00 5.61 0.01
BE_05500 5.18 5.18 0.00 5.19 0.00
BE_05200 4.94 4.94 0.00 4.94 0.00
BE_05000 4.91 4.91 0.00 4.92 0.00
BE_04500 4.89 4.89 0.00 4.90 0.00
BE_04102 4.63 4.63 0.00 4.63 0.00
Gate Cliffe Farm bridge BE_04102! 4.63 4.63 0.00 4.63 0.00
BE_04000 4.60 4.60 0.00 4.60 0.00
BE_03900 4.52 4.52 0.00 4.52 0.00
BE_03600 4.47 4.46 -0.01 4.46 -0.01
BE_03500 4.47 4.46 -0.01 4.46 -0.01
BE_03000 4.47 4.46 -0.01 4.45 -0.01
BE_02900 4.47 4.46 -0.01 4.45 -0.01
Barlings Abbey BE_02800 4.47 4.46 -0.01 4.45 -0.01
BE_02688 4.45 4.45 0.00 4.45 0.00
BE_02677 4.46 4.45 -0.01 4.45 0.00
BE_02500 4.45 4.45 -0.01 4.45 0.00
BE_02300 4.45 4.45 -0.01 4.44 0.00
BE_02100 4.45 4.45 -0.01 4.44 0.00
BE_02000 4.46 4.45 -0.01 4.45 0.00
BE_01800 4.46 4.45 -0.01 4.45 0.00
Stainfield Beck confluence BE_01700 4.45 4.45 0.00 4.44 0.00
BE_01700! 4.45 4.45 0.00 4.44 0.00
BE_01590 4.45 4.44 0.00 4.44 0.00
BE_01500 4.45 4.44 -0.01 4.44 0.00
BE_01000 4.44 4.44 0.00 4.43 0.00
BE_00790 4.44 4.44 0.00 4.43 0.00
BE_00500 4.44 4.43 0.00 4.43 0.00
Short Ferry Bridge BE_00430! 4.44 4.43 0.00 4.43 0.00
BE_00430 4.43 4.43 0.00 4.43 0.00
BE_00400 4.43 4.43 0.00 4.43 0.00
BE_00100 4.43 4.43 0.00 4.43 0.00
BE_00100! 4.43 4.43 0.00 4.43 0.00
Table A6: Barlings Eau PPFS Modelling Results – 1 in 10 year Existing and Option 3

Appendix B - Lower Witham Peak Flows
- Defended

AECOM Witham Catchment Flood Map Improvements – Phase 2 91
This page is left blank intentionally

Appendix C - Lower Witham Peak
Water Levels - Defended

AECOM Witham Catchment Flood Map Improvements – Phase 2 93
This page is left blank intentionally

Appendix D - Lower Witham Long
Sections - Defended

AECOM Witham Catchment Flood Map Improvements – Phase 2 95
This page is left blank intentionally

Witham Catchment Flood Map Improvements - Phase 2
Lower Witham: Volume 1 - Modelling and Flood Mapping Report
Lower Witham Catchment Long Sections
AECOM
1.3
1.8
2.3
2.8
3.3
3.8
4.3
Maxim
um
Sta
ge (
m A
OD
)
Figure D1:- Anwick Fen Drain- Max Stage
Appendix D
0.8
1.3
05001000150020002500
Chainage (m)
2 Year 5 Year 10 Year 20 Year 25 Year
50 Year 75 Year 100 Year 200 Year 1000 Year
100 Year+CC 1000 Year+CC Bed Level LB Level RB Level
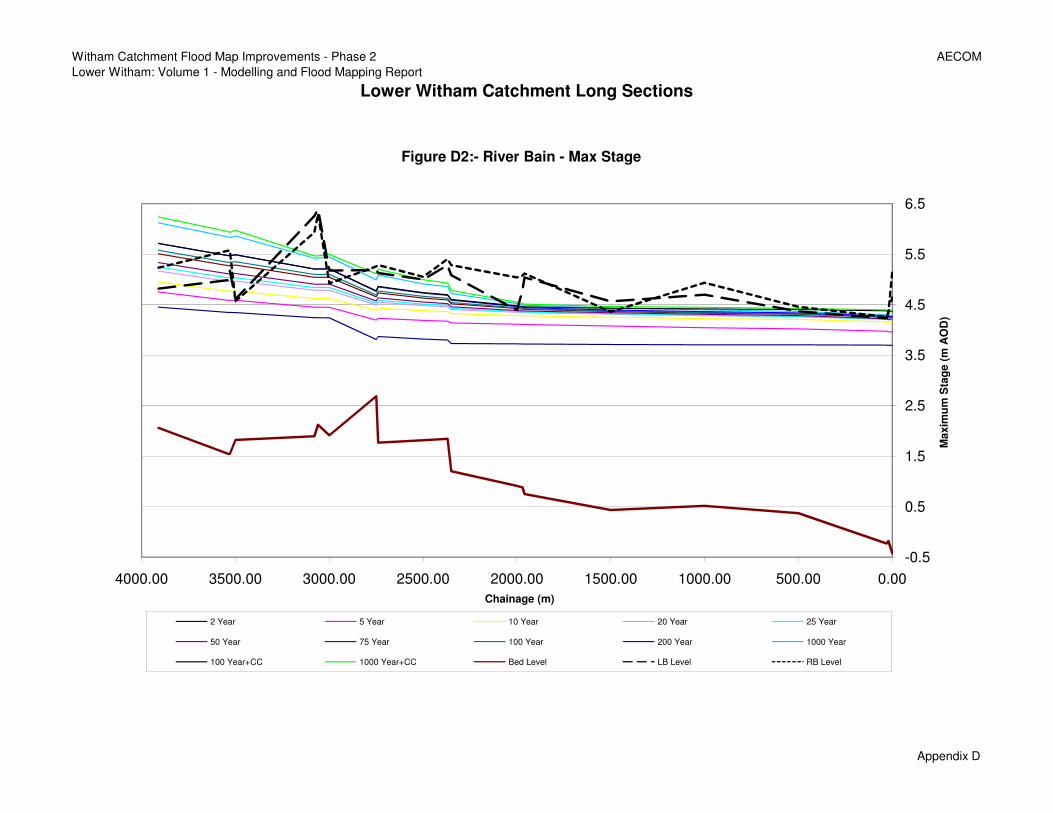
Witham Catchment Flood Map Improvements - Phase 2
Lower Witham: Volume 1 - Modelling and Flood Mapping Report
Lower Witham Catchment Long Sections
AECOM
0.5
1.5
2.5
3.5
4.5
5.5
6.5
Maxim
um
Sta
ge (
m A
OD
)
Figure D2:- River Bain - Max Stage
Appendix D
-0.5
0.5
0.00500.001000.001500.002000.002500.003000.003500.004000.00
Chainage (m)
2 Year 5 Year 10 Year 20 Year 25 Year
50 Year 75 Year 100 Year 200 Year 1000 Year
100 Year+CC 1000 Year+CC Bed Level LB Level RB Level

Witham Catchment Flood Map Improvements - Phase 2
Lower Witham: Volume 1 - Modelling and Flood Mapping Report
Lower Witham Catchment Long Sections
AECOM
0.5
1.5
2.5
3.5
4.5
5.5
Maxim
um
Sta
ge (
m A
OD
)
Figure D3:- Branston Delph - Max Stage
Appendix D
-0.5
0000000500010000150002000025000300003500
Chainage (m)
2 Year 5 Year 10 Year 20 Year 25 Year
50 Year 75 Year 100 Year 200 Year 1000 Year
100 Year+CC 1000 Year+CC Bed Level LB Level RB Level
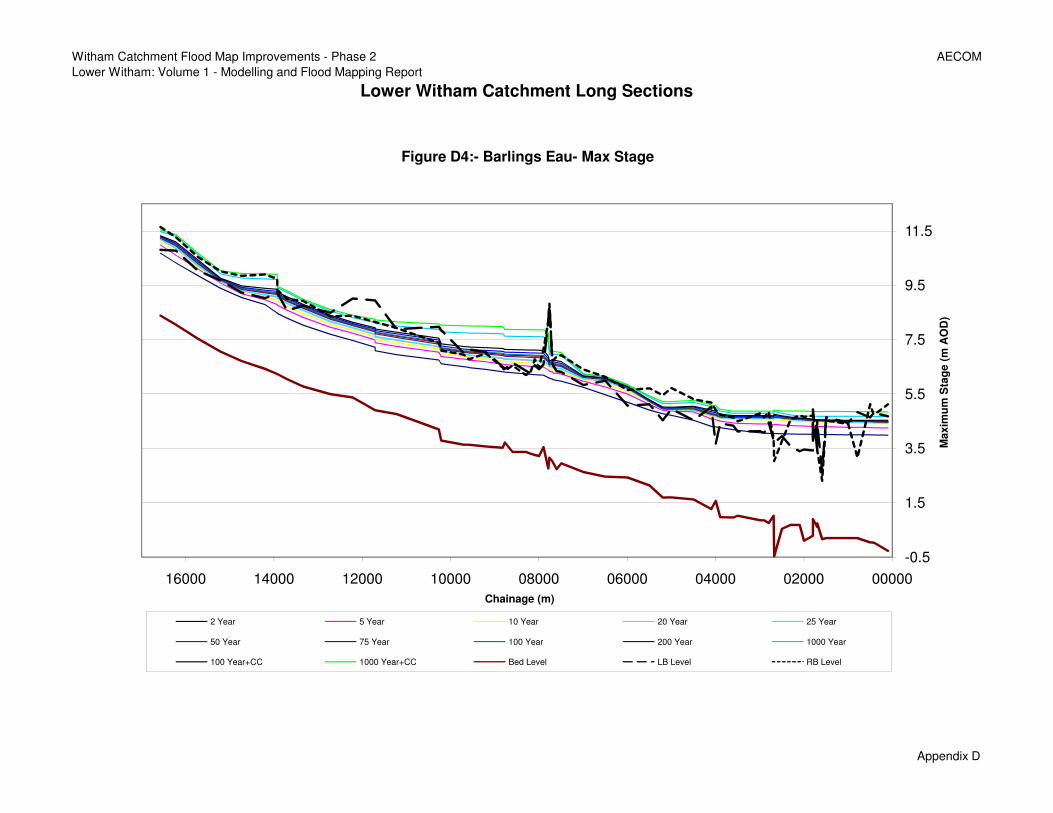
Witham Catchment Flood Map Improvements - Phase 2
Lower Witham: Volume 1 - Modelling and Flood Mapping Report
Lower Witham Catchment Long Sections
AECOM
1.5
3.5
5.5
7.5
9.5
11.5
Maxim
um
Sta
ge (
m A
OD
)
Figure D4:- Barlings Eau- Max Stage
Appendix D
-0.5
1.5
000000200004000060000800010000120001400016000
Chainage (m)
2 Year 5 Year 10 Year 20 Year 25 Year
50 Year 75 Year 100 Year 200 Year 1000 Year
100 Year+CC 1000 Year+CC Bed Level LB Level RB Level

Witham Catchment Flood Map Improvements - Phase 2
Lower Witham: Volume 1 - Modelling and Flood Mapping Report
Lower Witham Catchment Long Sections
AECOM
0.0
1.0
2.0
3.0
4.0
5.0
Maxim
um
Sta
ge (
m A
OD
)
Figure D5:- Billinghay Skirth- Max Stage
Appendix D
-1.00000001000020000300004000050000600007000
Chainage (m)
2 Year 5 Year 10 Year 20 Year 25 Year
50 Year 75 Year 100 Year 200 Year 1000 Year
100 Year+CC 1000 Year+CC Bed Level LB Level RB Level

Witham Catchment Flood Map Improvements - Phase 2
Lower Witham: Volume 1 - Modelling and Flood Mapping Report
Lower Witham Catchment Long Sections
AECOM
2.0
3.0
4.0
5.0
6.0
7.0
8.0
9.0
Maxim
um
Sta
ge (
m A
OD
)
Figure D6:- Car Dyke - Max Stage
Appendix D
0.0
1.0
0000005000100001500020000
Chainage (m)
2 Year 5 Year 10 Year 20 Year 25 Year
50 Year 75 Year 100 Year 200 Year 1000 Year
100 Year+CC 1000 Year+CC Bed Level LB Level RB Level
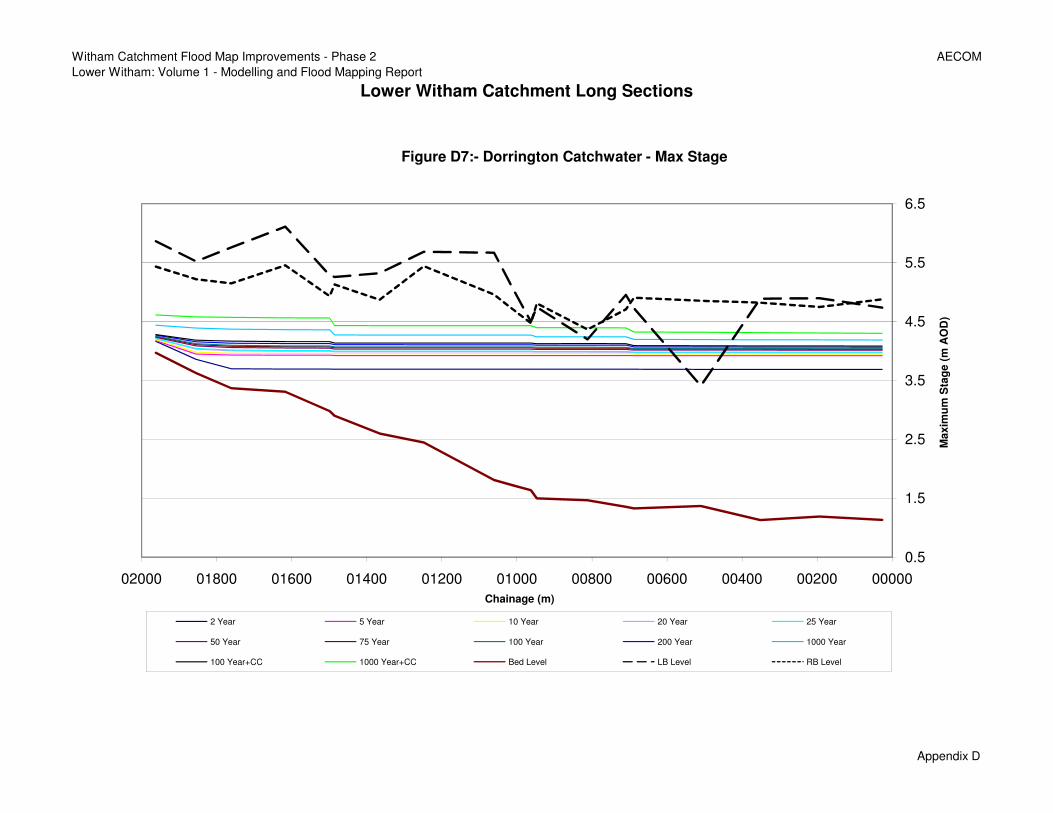
Witham Catchment Flood Map Improvements - Phase 2
Lower Witham: Volume 1 - Modelling and Flood Mapping Report
Lower Witham Catchment Long Sections
AECOM
1.5
2.5
3.5
4.5
5.5
6.5
Maxim
um
Sta
ge (
m A
OD
)
Figure D7:- Dorrington Catchwater - Max Stage
Appendix D
0.5
0000000200004000060000800010000120001400016000180002000
Chainage (m)
2 Year 5 Year 10 Year 20 Year 25 Year
50 Year 75 Year 100 Year 200 Year 1000 Year
100 Year+CC 1000 Year+CC Bed Level LB Level RB Level

Witham Catchment Flood Map Improvements - Phase 2
Lower Witham: Volume 1 - Modelling and Flood Mapping Report
Lower Witham Catchment Long Sections
AECOM
2.0
3.0
4.0
5.0
6.0
7.0
8.0
9.0
10.0
Maxim
um
Sta
ge (
m A
OD
)
Figure D8:- Duckpool Drain - Max Stage
Appendix D
0.0
1.0
000000100002000030000400005000060000700008000
Chainage (m)
2 Year 5 Year 10 Year 20 Year 25 Year
50 Year 75 Year 100 Year 200 Year 1000 Year
100 Year+CC 1000 Year+CC Bed Level LB Level RB Level

Witham Catchment Flood Map Improvements - Phase 2
Lower Witham: Volume 1 - Modelling and Flood Mapping Report
Lower Witham Catchment Long Sections
AECOM
1.5
2.5
3.5
4.5
5.5
6.5
Maxim
um
Sta
ge (
m A
OD
)
Figure D9:- Dorrington Dyke - Max Stage
Appendix D
0.5
0000000500010000150002000025000300003500040000450005000
Chainage (m)
2 Year 5 Year 10 Year 20 Year 25 Year
50 Year 75 Year 100 Year 200 Year 1000 Year
100 Year+CC 1000 Year+CC Bed Level LB Level RB Level

Witham Catchment Flood Map Improvements - Phase 2
Lower Witham: Volume 1 - Modelling and Flood Mapping Report
Lower Witham Catchment Long Sections
AECOM
3.0
5.0
7.0
9.0
11.0
13.0
15.0
17.0
Maxim
um
Sta
ge (
m A
OD
)
Figure D10:- Digby Beck - Max Stage
Appendix D
1.0
3.0
00000010000200003000040000500006000
Chainage (m)
2 Year 5 Year 10 Year 20 Year 25 Year
50 Year 75 Year 100 Year 200 Year 1000 Year
100 Year+CC 1000 Year+CC Bed Level LB Level RB Level

Witham Catchment Flood Map Improvements - Phase 2
Lower Witham: Volume 1 - Modelling and Flood Mapping Report
Lower Witham Catchment Long Sections
AECOM
0.5
1.0
1.5
2.0
2.5
3.0
3.5
4.0
4.5
Maxim
um
Sta
ge (
m A
OD
)
Figure D11:- Farroway Drain - Max Stage
Appendix D
-0.5
0.0
065000700007500080000850009000095001000010500
Chainage (m)
2 Year 5 Year 10 Year 20 Year 25 Year
50 Year 75 Year 100 Year 200 Year 1000 Year
100 Year+CC 1000 Year+CC Bed Level LB Level RB Level

Witham Catchment Flood Map Improvements - Phase 2
Lower Witham: Volume 1 - Modelling and Flood Mapping Report
Lower Witham Catchment Long Sections
AECOM
3.5
4.0
4.5
5.0
5.5
6.0
Maxim
um
Sta
ge (
m A
OD
)
Figure D12:- Heighington Catchwater - Max Stage
Appendix D
3.0
00000001000020000300004000050000600007000080000900
Chainage (m)
2 Year 5 Year 10 Year 20 Year 25 Year
50 Year 75 Year 100 Year 200 Year 1000 Year
100 Year+CC 1000 Year+CC Bed Level LB Level RB Level

Witham Catchment Flood Map Improvements - Phase 2
Lower Witham: Volume 1 - Modelling and Flood Mapping Report
Lower Witham Catchment Long Sections
AECOM
4.0
5.0
6.0
7.0
8.0
9.0
10.0
11.0
Maxim
um
Sta
ge (
m A
OD
)
Figure D13:- Heighington Beck - Max Stage
Appendix D
3.0
4.0
0000000500010000150002000
Chainage (m)
2 Year 5 Year 10 Year 20 Year 25 Year
50 Year 75 Year 100 Year 200 Year 1000 Year
100 Year+CC 1000 Year+CC Bed Level LB Level RB Level

Witham Catchment Flood Map Improvements - Phase 2
Lower Witham: Volume 1 - Modelling and Flood Mapping Report
Lower Witham Catchment Long Sections
AECOM
0.5
1.5
2.5
3.5
4.5
5.5
Maxim
um
Sta
ge (
m A
OD
)
Figure D14:- Kyme Eau - Max Stage
Appendix D
-0.5
00000002000040000600008000100001200
Chainage (m)
2 Year 5 Year 10 Year 20 Year 25 Year
50 Year 75 Year 100 Year 200 Year 1000 Year
100 Year+CC 1000 Year+CC Bed Level LB Level RB Level

Witham Catchment Flood Map Improvements - Phase 2
Lower Witham: Volume 1 - Modelling and Flood Mapping Report
Lower Witham Catchment Long Sections
AECOM
7.5
9.5
11.5
13.5
15.5
17.5
19.5
21.5
Maxim
um
Sta
ge (
m A
OD
)
Figure D15:- Leasingham Drain - Max Stage
Appendix D
3.5
5.5
000000100002000030000400005000
Chainage (m)
2 Year 5 Year 10 Year 20 Year 25 Year
50 Year 75 Year 100 Year 200 Year 1000 Year
100 Year+CC 1000 Year+CC Bed Level LB Level RB Level

Witham Catchment Flood Map Improvements - Phase 2
Lower Witham: Volume 1 - Modelling and Flood Mapping Report
Lower Witham Catchment Long Sections
AECOM
-1.5
0.5
2.5
4.5
6.5
Maxim
um
Sta
ge (
m A
OD
)
Figure D16:- Lower River Witham - Max Stage
Appendix D
-3.5
0000005000100001500020000250003000035000400004500050000
Chainage (m)
2 Year 5 Year 10 Year 20 Year 25 Year
50 Year 75 Year 100 Year 200 Year 1000 Year
100 Year+CC 1000 Year+CC Bed Level LB Level RB Level

Witham Catchment Flood Map Improvements - Phase 2
Lower Witham: Volume 1 - Modelling and Flood Mapping Report
Lower Witham Catchment Long Sections
AECOM
1.5
2.0
2.5
3.0
3.5
4.0
4.5
5.0
5.5
Maxim
um
Sta
ge (
m A
OD
)
Figure D17:- Marsh Drain - Max Stage
Appendix D
0.5
1.0
00000002000040000600008000100001200
Chainage (m)
2 Year 5 Year 10 Year 20 Year 25 Year
50 Year 75 Year 100 Year 200 Year 1000 Year
100 Year+CC 1000 Year+CC Bed Level LB Level RB Level

Witham Catchment Flood Map Improvements - Phase 2
Lower Witham: Volume 1 - Modelling and Flood Mapping Report
Lower Witham Catchment Long Sections
AECOM
0.0
1.0
2.0
3.0
4.0
5.0
Maxim
um
Sta
ge (
m A
OD
)
Figure D18:- Metheringham Delph - Max Stage
Appendix D
-1.0
00000010000200003000040000500006000
Chainage (m)
2 Year 5 Year 10 Year 20 Year 25 Year
50 Year 75 Year 100 Year 200 Year 1000 Year
100 Year+CC 1000 Year+CC Bed Level LB Level RB Level

Witham Catchment Flood Map Improvements - Phase 2
Lower Witham: Volume 1 - Modelling and Flood Mapping Report
Lower Witham Catchment Long Sections
AECOM
2.0
3.0
4.0
5.0
6.0
Maxim
um
Sta
ge (
m A
OD
)
Figure D19:- New Cut - Max Stage
Appendix D
1.0
0000001000020000300004000050000600007000
Chainage (m)
2 Year 5 Year 10 Year 20 Year 25 Year
50 Year 75 Year 100 Year 200 Year 1000 Year
100 Year+CC 1000 Year+CC Bed Level LB Level RB Level

Witham Catchment Flood Map Improvements - Phase 2
Lower Witham: Volume 1 - Modelling and Flood Mapping Report
Lower Witham Catchment Long Sections
AECOM
3.0
5.0
7.0
9.0
11.0
13.0
15.0
17.0
Maxim
um
Sta
ge (
m A
OD
)
Figure D20:- Nine Foot River - Max Stage
Appendix D
1.0
3.0
000000020000400006000080001000012000140001600
Chainage (m)
2 Year 5 Year 10 Year 20 Year 25 Year
50 Year 75 Year 100 Year 200 Year 1000 Year
100 Year+CC 1000 Year+CC Bed Level LB Level RB Level

Witham Catchment Flood Map Improvements - Phase 2
Lower Witham: Volume 1 - Modelling and Flood Mapping Report
Lower Witham Catchment Long Sections
AECOM
1.0
2.0
3.0
4.0
5.0
6.0
Maxim
um
Sta
ge (
m A
OD
)
Figure D21:- Nocton Delph - Max Stage
Appendix D
0.0
0000000500010000150002000025000300003500040000450005000
Chainage (m)
2 Year 5 Year 10 Year 20 Year 25 Year
50 Year 75 Year 100 Year 200 Year 1000 Year
100 Year+CC 1000 Year+CC Bed Level LB Level RB Level

Witham Catchment Flood Map Improvements - Phase 2
Lower Witham: Volume 1 - Modelling and Flood Mapping Report
Lower Witham Catchment Long Sections
AECOM
1.5
2.0
2.5
3.0
3.5
4.0
4.5
5.0
Maxim
um
Sta
ge (
m A
OD
)
Figure D22:- North Hills Drain - Max Stage
Appendix D
1.0
1.5
00000002000040000600008000100001200
Chainage (m)
2 Year 5 Year 10 Year 20 Year 25 Year
50 Year 75 Year 100 Year 200 Year 1000 Year
100 Year+CC 1000 Year+CC Bed Level LB Level RB Level

Witham Catchment Flood Map Improvements - Phase 2
Lower Witham: Volume 1 - Modelling and Flood Mapping Report
Lower Witham Catchment Long Sections
AECOM
3.5
5.5
7.5
9.5
11.5
13.5
Maxim
um
Sta
ge (
m A
OD
)
Figure D23:- Old Slea - Max Stage
Appendix D
1.5
0000001000020000300004000050000600007000
Chainage (m)
2 Year 5 Year 10 Year 20 Year 25 Year
50 Year 75 Year 100 Year 200 Year 1000 Year
100 Year+CC 1000 Year+CC Bed Level LB Level RB Level

Witham Catchment Flood Map Improvements - Phase 2
Lower Witham: Volume 1 - Modelling and Flood Mapping Report
Lower Witham Catchment Long Sections
AECOM
-0.5
0.5
1.5
2.5
3.5
4.5
5.5
Maxim
um
Sta
ge (
m A
OD
)
Figure D24:- Old Witham - Max Stage
Appendix D
-1.5
-0.5
00000005000100001500020000250003000
Chainage (m)
2 Year 5 Year 10 Year 20 Year 25 Year
50 Year 75 Year 100 Year 200 Year 1000 Year
100 Year+CC 1000 Year+CC Bed Level LB Level RB Level

Witham Catchment Flood Map Improvements - Phase 2
Lower Witham: Volume 1 - Modelling and Flood Mapping Report
Lower Witham Catchment Long Sections
AECOM
2.0
2.5
3.0
3.5
4.0
4.5
5.0
5.5
6.0
Maxim
um
Sta
ge (
m A
OD
)
Figure D25:- Queen Dyke - Max Stage
Appendix D
1.0
1.5
0000000500010000150002000025000300003500
Chainage (m)
2 Year 5 Year 10 Year 20 Year 25 Year
50 Year 75 Year 100 Year 200 Year 1000 Year
100 Year+CC 1000 Year+CC Bed Level LB Level RB Level

Witham Catchment Flood Map Improvements - Phase 2
Lower Witham: Volume 1 - Modelling and Flood Mapping Report
Lower Witham Catchment Long Sections
AECOM
2.0
2.5
3.0
3.5
4.0
4.5
5.0
5.5
6.0
Maxim
um
Sta
ge (
m A
OD
)
Figure D26:- Ruskington Catchwater - Max Stage
Appendix D
1.0
1.5
00200004000060000800010000120001400
Chainage (m)
2 Year 5 Year 10 Year 20 Year 25 Year
50 Year 75 Year 100 Year 200 Year 1000 Year
100 Year+CC 1000 Year+CC Bed Level LB Level RB Level

Witham Catchment Flood Map Improvements - Phase 2
Lower Witham: Volume 1 - Modelling and Flood Mapping Report
Lower Witham Catchment Long Sections
AECOM
5.5
7.5
9.5
11.5
13.5
15.5
17.5
19.5
21.5
Maxim
um
Sta
ge (
m A
OD
)
Figure D27:- River Slea - Max Stage
Appendix D
1.5
3.5
0000002000040000600008000100001200014000
Chainage (m)
2 Year 5 Year 10 Year 20 Year 25 Year
50 Year 75 Year 100 Year 200 Year 1000 Year
100 Year+CC 1000 Year+CC Bed Level LB Level RB Level

Witham Catchment Flood Map Improvements - Phase 2
Lower Witham: Volume 1 - Modelling and Flood Mapping Report
Lower Witham Catchment Long Sections
AECOM
5.0
7.0
9.0
11.0
13.0
15.0
Maxim
um
Sta
ge (
m A
OD
)
Figure D28:- Ruskington Beck - Max Stage
Appendix D
3.0
5.0
0000000500010000150002000025000300003500040000450005000
Chainage (m)
2 Year 5 Year 10 Year 20 Year 25 Year
50 Year 75 Year 100 Year 200 Year 1000 Year
100 Year+CC 1000 Year+CC Bed Level LB Level RB Level

Witham Catchment Flood Map Improvements - Phase 2
Lower Witham: Volume 1 - Modelling and Flood Mapping Report
Lower Witham Catchment Long Sections
AECOM
1.5
2.0
2.5
3.0
3.5
4.0
4.5
5.0
5.5
Maxim
um
Sta
ge (
m A
OD
)
Figure D29:- Sandhill Beck - Max Stage
Appendix D
0.5
1.0
0000000100002000030000400005000060000700008000090001000
Chainage (m)
2 Year 5 Year 10 Year 20 Year 25 Year
50 Year 75 Year 100 Year 200 Year 1000 Year
100 Year+CC 1000 Year+CC Bed Level LB Level RB Level

Witham Catchment Flood Map Improvements - Phase 2
Lower Witham: Volume 1 - Modelling and Flood Mapping Report
Lower Witham Catchment Long Sections
AECOM
5.0
10.0
15.0
20.0
25.0
Maxim
um
Sta
ge (
m A
OD
)
Figure D30:- Stainfield Beck - Max Stage
Appendix D
0.0
0000001000020000300004000050000600007000080000900010000
Chainage (m)
2 Year 5 Year 10 Year 20 Year 25 Year
50 Year 75 Year 100 Year 200 Year 1000 Year
100 Year+CC 1000 Year+CC Bed Level LB Level RB Level

Witham Catchment Flood Map Improvements - Phase 2
Lower Witham: Volume 1 - Modelling and Flood Mapping Report
Lower Witham Catchment Long Sections
AECOM
1.0
2.0
3.0
4.0
5.0
6.0
7.0
8.0
Maxim
um
Sta
ge (
m A
OD
)
Figure D31:- Snakeholme Drain - Max Stage
Appendix D
0.0
1.0
000000050001000015000200002500030000350004000
Chainage (m)
2 Year 5 Year 10 Year 20 Year 25 Year
50 Year 75 Year 100 Year 200 Year 1000 Year
100 Year+CC 1000 Year+CC Bed Level LB Level RB Level

Witham Catchment Flood Map Improvements - Phase 2
Lower Witham: Volume 1 - Modelling and Flood Mapping Report
Lower Witham Catchment Long Sections
AECOM
0.5
1.5
2.5
3.5
4.5
5.5
6.5
Maxim
um
Sta
ge (
m A
OD
)
Figure D32:- South Delph - Max Stage
Appendix D
-0.5
0.5
37000390004100043000450004700049000
Chainage (m)
2 Year 5 Year 10 Year 20 Year 25 Year
50 Year 75 Year 100 Year 200 Year 1000 Year
100 Year+CC 1000 Year+CC Bed Level LB Level RB Level

Witham Catchment Flood Map Improvements - Phase 2
Lower Witham: Volume 1 - Modelling and Flood Mapping Report
Lower Witham Catchment Long Sections
AECOM
0.0
1.0
2.0
3.0
4.0
5.0
6.0
Maxim
um
Sta
ge (
m A
OD
)
Figure D33:- Timberland Delph - Max Stage
Appendix D
-1.0
0.0
000000100002000030000400005000
Chainage (m)
2 Year 5 Year 10 Year 20 Year 25 Year
50 Year 75 Year 100 Year 200 Year 1000 Year
100 Year+CC 1000 Year+CC Bed Level LB Level RB Level

Witham Catchment Flood Map Improvements - Phase 2
Lower Witham: Volume 1 - Modelling and Flood Mapping Report
Lower Witham Catchment Long Sections
AECOM
10.0
15.0
20.0
25.0
Maxim
um
Sta
ge (
m A
OD
)
Figure D34:- Welton Beck - Max Stage
Appendix D
5.0
00000010000200003000040000500006000
Chainage (m)
2 Year 5 Year 10 Year 20 Year 25 Year
50 Year 75 Year 100 Year 200 Year 1000 Year
100 Year+CC 1000 Year+CC Bed Level LB Level RB Level

Appendix E - Lower Witham
Sensitivity Analysis – Defended

AECOM Witham Catchment Flood Map Improvements – Phase 2 97
This page is left blank intentionally

This page is left blank intentionally

Appendix F - Lower Witham Freeboard
AEP & SoP Analysis – Defended

AECOM Witham Catchment Flood Map Improvements – Phase 2 99
This page is left blank intentionally

Section 4.3
Fetch length (m) 42 Step 1
Allowance from Figure 4.2 (m) 0.119 Step 2 Figure 2
Modification factor 0.9 Step 3 Table 4.3
Modified Wave Overtopping Allowance 0.107 Step 3 Table 4.3
Actual allowance provided (m) 0.1 A Step 4 Table 4.4
A
Section 4.4
Existing defences are generally assumed to have fully settled
Embankment Advice notes suggest against accounting for settlement (section 4.4 pp24)
Height (m)
Slopes (1:X)
Crest width (m)
Foundation soil type
Coefficient µg Step 1 Table 4.5
Influence factor IP Step 2 Table 4.4
Step 3 Test results or Table 4.6
Applied load p (kN) Step 4
Foundation width B (m) Step 4
Settlement allowance (m) 0 B Step 5
Wall Advice notes suggest against accounting for settlement (section 4.4 pp24)
Foundation base width (m)
Foundation length (m)
Foundation soil type
Coefficient µg Step 1 Table 4.5
Influence factor IP Step 2
Step 3 Test results or Table 4.6
Applied load p (kN) Step 4
Foundation width B (m) Step 4
Settlement allowance (m) 0 B Step 5
Low velocities (and watercourse is relatively straight along defence lengths)
Subsequently, it is assumed that superelevation is not significant anywhere
River width B (m) Section 4.7
Radius of bend r (m)
Flow velocity (m/s)
Superelevation significant ? Y/N Figure 4.5
Superelevation allowance (m) 0 C
Advice notes with respect to other physical processes (see sections 4.5, 4.6, 4.8 and 4.9) state no freeboard
allowance should be made for these processes
0 D
0.1 E A+B+C+D
Freeboard Determination Proforma (EXAMPLE)
Table 4.4 advises us to Flood and Reservoir Safety
Coefficient of volume compressibility mv
Defence Type
Location
Reference
Wave Overtopping Allowance
or:
Raised Defence Type
Left Bank - Cross-Section BD_01500
NFCDD Asset ID 892
Note that comments/values in red are applicable to all defences in the Lower Witham catchment. All other values are specific
to this defence asset only
Physical Process
Superelevation
Other physical processes
TOTAL ALLOWANCE FOR PHYSICAL PROCESSES
Allowance from Floods and Reservoir Safety (m)
Coefficient of volume compressibility mv
Settlement allowance ( Cohesive Soils)

Section 5.3
Step 1
2
Step 1
3
Step 1
2
Step 1
2
Step 1
1
Step 1
4
14 Step 2
1.57
2.70 HIGH indicative SoP
0.26 F Step 3
OK
0.36 E+F
REALITY CHECK (OK ?)
TOTAL FREEBOARD ALLOWANCE
Description of information available:
Uncertainties in physical processes are negligible.
Hydrological Analysis
Recent survey data of well defined channel sections; data of good
quality; floodplain flow limited; roughness not significantly variable.
Hydraulic Analysis
Description of information available
Well defined boundary data; well defined flood routing; transient model.
Score from Table 5.4
Hydraulic Data
Description of information available
Description of information available
Moderate to long duration storms give greatest discharges; length of
flow records between 10 and 30 years
Score from Table 5.2
TOTAL UNCERTAINTY ALLOWANCE
Score from Table 5.3
Score from Table 5.5
Consequeance of failure
Uncertainty Allowance - Quick Method
Good range of flow and level gauges; data of good quality; suitable
geograpical spread; no flow recorders on main River Witham
Significance of physical process
Score from Table 5.1
Hydrological Data
Description of information available
Mean annual maximum water level (m)
Derived flood level (m)
Description of information available:
Catchment includes a good proportion of high grade agricultural land;
some properties at risk of flooding.
Score from Table 5.6
Total score