Hal Varian Intermediate Microeconomics Chapter Thirteen Risky Assets.

WISE M NEYA Weekly Update from SMC
(For private circulation only)
PEACE, LOVE & HAPPINESS
LET THE COLORS SPEAK THIS TIME
HAPPY HOLI
2017: Issue 570, Week: 13th - 16th March
Bra
nd
sm
c 3
94

Joins hands with
INCENTIVES
Heralding an era of new possibilitiesfor young aspirants of Sharda University
01
02
03INTERNSHIP
LETTER
04
05

From The Desk Of Editor
(Saurabh Jain)
SMC Global Securities Ltd. (hereinafter referred to as “SMC”) is a registered Member of National Stock Exchange of India Limited, Bombay Stock Exchange Limited and its associate is member of MCX stock Exchange Limited. It is also registered as a Depository Participant with CDSL and NSDL. Its associates merchant banker and Portfolio Manager are registered with SEBI and NBFC registered with RBI. It also has registration with AMFI as a Mutual Fund Distributor.
SMC has applied with SEBI for registering as a Research Entity in terms of SEBI (Research Analyst) Regulations, 2014. SMC or its associates has not been debarred/ suspended by SEBI or any other regulatory authority for accessing /dealing in securities Market.
SMC or its associates including its relatives/analyst do not hold any financial interest/beneficial ownership of more than 1% in the company covered by Analyst. SMC or its associates and relatives does not have any material conflict of interest. SMC or its associates/analyst has not received any compensation from the company covered by Analyst during the past twelve months. The subject company has not been a client of SMC during the past twelve months. SMC or its associates has not received any compensation or other benefits from the company covered by analyst or third party in connection with the research report. The Analyst has not served as an officer, director or employee of company covered by Analyst and SMC has not been engaged in market making activity of the company covered by Analyst.
The views expressed are based solely on information available publicly available/internal data/ other reliable sources believed to be true.
SMC does not represent/ provide any warranty express or implied to the accuracy, contents or views expressed herein and investors are advised to independently evaluate the market conditions/risks involved before making any investment decision.
lobal stock markets came off from the highs during the week on expectations of a
rate hike by the U.S. Federal Reserve in the meeting scheduled on 14th – 15th GMarch. There is an expectation that Bank of Japan will leave policy unchanged
next week as inflation in the economy rose for the first time in the month of January
towards central bank's target. European Central Bank Chief Mario Draghi said that risks to
the Euro area are starting to recede and balance of risks to growth has improved. ECB while
keeping its quantitative easing program unchanged in the monetary policy review meeting
indicated that monetary stimulus must continue. The fall in crude price to below $50 barrel
has raised the concerns that energy inflation that is inching up in world economy may wane.
Back at home, domestic markets continued to witness the volatile trade throughout the
week ahead of the outcome of the state election. On the political front, results of various
exit polls released on 9th March 2017 showed that ruling party at the Centre, BJP, doing well
in Uttar Pradesh, Uttarakhand, Goa and even Manipur, with the Congress and the Aam
Aadmi Party locked in a tough contest in Punjab. If U.S. Fed chose to hike interest rate, then
there are chances that money may move back to U.S. assets from risky assets to less risky
assets. However, it could be seen that now foreign market participants are showing interest
in the Indian markets. Going next week, outcome of the state elections, the outcome of
Fed's policy and price movement of Indian rupee against US dollar would determine the
movement of the domestic market going forward. Nifty is expected to trade between 8700-
9100 levels.
On the commodity market front, commodities prices were on weaker side. Strong
Greenback, poor economic releases amid technical sell off dragged down the commodities
prices. Crude oil prices may remain on a weaker side due to increased inventories and
surged in production from shale gas producers. Crude oil is expected to trade in the range of
3150-3480 levels in MCX. Natural gas may witness further bounce back as colder weather
forecast to support its prices. Agri commodities may low volume trade in both physical as
well as futures market on the occasion of Holi. FOMC meet may give further direction to the
bullion counter. Gold can face resistance of $1250 in COMEX and 29200 in MCX while it has
support near $1160 in COMEX and $28000 in MCX. German ZEW Survey, CPI, Advance Retail
Sales, FOMC rate decision and U. of Michigan Confidence of US, GDP of Newzealand, BOJ 10-
Yr Yield Target, BOJ Policy Balance Rate, Unemployment Rate of Australia, BoE rate
decision, and many more important data and event scheduled this week, and the outcome
may give significant impact on commodities prices.
Contents
Equity 4-7
Derivatives 8-9
Commodity 10-13
Currency 14
FD Monitor 16
Mutual Fund 17-18
IPO 15
SMC GLOBAL SECURITIES LTD.
REGISTERED OFFICES:
11 / 6B, Shanti Chamber, Pusa Road, New Delhi 110005.
Tel: 91-11-30111000, Fax: 91-11-25754365
MUMBAI OFFICE:
Lotus Corporate Park, A Wing 401 / 402 , 4th Floor ,
Graham Firth Steel Compound, Off Western Express Highway,
Jay Coach Signal, Goreagon (East) Mumbai - 400063
Tel: 91-22-67341600, Fax: 91-22-67341697
KOLKATA OFFICE:
18,Rabindra Sarani, Poddar Court, Gate No-4,5th Floor, Kolkata-700001
Tel : 91-33-39847000 Fax No : 91-33-39847004
AHMEDABAD OFFICE :
10/A, 4th Floor, Kalapurnam Building, Near Municipal Market,
C G Road, Ahmedabad-380009, Gujarat
Tel : 91-79-26424801 - 05, 40049801 - 03
CHENNAI OFFICE:
Salzburg Square, Flat No.1, III rd Floor, Door No.107, Harrington Road,
Chetpet, Chennai - 600031.
Tel: 044-39109100, Fax -044- 39109111
SECUNDERABAD OFFICE:
206, 3rd Floor, above CMR Exclusive, Bhuvana Towers, S.D.Road,
Secunderabad - 500003
Tel: 91-40-30780298/99, 39109536
DUBAI OFFICE:
2404, 1 Lake Plaza Tower, Cluster T, Jumeriah Lake Towers,
PO Box 117210, Dubai, UAE
Tel: 97145139780 Fax : 97145139781
Email ID : [email protected]
NEW YORK OFFICE:
Alliance Bernstein Building
1345 Avenue of the Americas
Second Floor
New York, NY 10105
Phone: (212) 878-3684
Toll-Free: (855) 589-1915
Fax: (866) 852-4236
Printed and Published on behalf of
Mr. Saurabh Jain @ Publication Address
11/6B, Shanti Chamber, Pusa Road, New Delhi-110005
Website: www.smcindiaonline.com
Investor Grievance : [email protected]
Printed at: S&S MARKETING102, Mahavirji Complex LSC-3, Rishabh Vihar, New Delhi - 110092 (India)
Ph.: +91-11- 43035012, 43035014, Email: [email protected]

NEWS
DOMESTIC NEWSPower• Tata Power Delhi Distribution has reported it is planning to install 1,000 electric
vehicle charging stations in next four to five years in Delhi. The company plans to set up these charging stations at various locations in North and North-West Delhi and is already in discussions with MCD and DMRC for space.
• NTPC announced that 45 MW of Bhadla Solar Power Project of NTPC has been commissioned. With this, the installed capacity of Bhadla Solar Power project has become 160 MW and that of NTPC's solar power projects has become 520 MW.
Pharmaceutical• Lupin has launched generic paxil drug used for treatment of major
depressive order in the US market. The drug is used for treatment of major depressive, panic, social anxiety and premenstrual dysphoric disorder. The company received an approval from the United States Food and Drug Administration (FDA) earlier.
• Dr Reddy's Laboratories has received 13 observations from the US health regulator for its formulation manufacturing facility at Duwada, Visakhapatnam.
Telecom• Bharti Airtel and Millicom International Cellular have entered into an
agreement to merge their respective units in Ghana to create the second-largest mobile carrier in the African country. Airtel and Millicom will have equal ownership and governance rights in the combined entity.
• The proposal to merge state-run telecom firms BSNL and MTNL is back on the discussion table, a top-level meeting recently discussed possibility of merging both the entities that are facing financial stress due to increasing competition in the sector.
• The telecom industry's pricing war is spreading to advertising, as top carriers Bharti Airtel, Vodafone India and Idea Cellular jacked up spending on promoting their latest price points and services to ring-fence users from jumping ship to Reliance Jio Infocomm.
Metal & Mining• Hindustan Zinc, a producer of zinc-lead-silver, will commission its first Zinc
fumer plant at the cost of ̀ 570 crore to extract metals from the waste. It will improve recovery of zinc from 96.8 % to 97.5% and would add about 3000 tonnes of zinc from just one smelter per annum. It will also increase Lead production by about 4700 tonnes and Silver by 33 tonnes per annum.
Banking & Finance• IndusInd Bank has reported it is in talks with multiple entities for business
expansion, including the widely speculated merger of Bharat Financial Inclusion (BFI).
Information Technology• Wipro has completed the $70 million sale of its EcoEnergy division. The
impact of sale of EcoEnergy division is expected to reflect in the financials of Wipro for the quarter and year ending March 31.
• Tech Mahindra Ltd will buy US-based healthcare provider CJS Solutions Group for an enterprise value of $110 million. The deal includes an upfront cash payment of $89.5 million to buy an 84.7 per cent stake in CJS with the remaining 15.3 per cent to be acquired over three years.
Retail• V2 Retail has opened an operational retail store in Lanka Varanasi, Uttar
Pradesh. With this, there are currently 37 retail stores in operations.Logistics• Snowman Logistics has completed the construction of the temperature
controlled & dry warehouse located at Aroor Village, Cherthala, Alapuzha and the facility is now ready for operations with a total capacity of 4500 pallets, thereby taking the total capacity of the company to 1,03,000 pallets.
Cement• Jaiprakash Associates has got the approval of National Company Law Tribunal
(NCLT) for transfer of its cement plants to the Aditya Birla group firm, UltraTech Cement.
INTERNATIONAL NEWS• US initial jobless claims climbed to 243,000, an increase of 20,000 from the
previous week's unrevised level of 223,000. Economists had expected jobless claims to rise to 235,000.
1 Japan's gross domestic product gained 0.3 percent on quarter in the fourth quarter of 2016, that missed forecasts 0.4 percent and was up from last month's preliminary reading of 0.2 percent. GDP gained 0.3 percent in Q3.
• The ECB left interest rates and its quantitative easing programme unchanged. The Governing Council left the main refinancing rate at 0%, while the rate on deposits parked overnight at the bank remains at minus 0.4%. The rate on the bank's marginal lending facility remains at 0.25%.
1 Europe's economy expanded 1.7 percent year-on-year in the fourth quarter of 2016, easing from a 1.8 percent growth in the previous period and below a preliminary reading of 1.8 percent, the second estimate showed.
Ex-Date Company Purpose
14-Mar-17 DIC India Dividend Rs 4/- Per Share14-Mar-17 Coal India Interim Dividend - Rs 18.75/- Per
Share 14-Mar-17 Emami Interim Dividend Rs 1.75 Per Share 14-Mar-17 TVS Motor Company Interim Dividend Rs 1.25 Per Share 14-Mar-17 Geometric Amalgamation/ Spin Off15-Mar-17 V-Guard Industries Bonus 2:516-Mar-17 Bharat Electronics Face Value Split From Rs 10/- Per
Share To Re 1/- Per Share16-Mar-17 Cadila Healthcare Interim Dividend Rs 3.20 Per Share 16-Mar-17 ACC Dividend Rs 6/- Per Share16-Mar-17 NMDC Interim Dividend Rs 4.15 Per Share16-Mar-17 Kushal Treadelink Bonus issue 1:116-Mar-17 State Bank of Mysore Amalgamation16-Mar-17 State Bank of Bikaner
& Jaipur Amalgamation16-Mar-17 State Bank of Travancore Amalgamation16-Mar-17 Hero MotoCorp Interim Dividend Rs 55/- Per Share16-Mar-17 Ambuja Cements Dividend - Rs 1.20 Per Share
Meeting Date Company Purpose
15-Mar-17 Shree Ganesh Forgings Board Meeting Adjourned15-Mar-17 Sundaram Clayton Dividend15-Mar-17 Empee Distill. Other Purpose, Issue of Warrants16-Mar-17 Engineers India Dividend16-Mar-17 McNally Bharat Other Purpose, Preferential Issue17-Mar-17 ABM International Bonus17-Mar-17 Manappuram Finance Others17-Mar-17 Surana Telecom and Power Issue of Securities20-Mar-17 MIC Electronics Increase in Authorised Capital,
Conversion
FORTHCOMING EVENTS
NOTES:1) These levels should not be confused with the daily trend sheet, which is sent every morning by e-mail in the name
of "Morning Mantra ".2) Sometimes you will find the stop loss to be too far but if we change the stop loss once, we will find more strength
coming into the stock. At the moment, the stop loss will be far as we are seeing the graphs on weekly basis and taking a long-term view and not a short-term view.
TREND SHEET
Stocks *Closing Trend Date Rate SUPPORT RESISTANCE Closing
Price Trend Trend
Changed Changed
S&P BSE SENSEX 28946 UP 18.11.16 25627 27800 27150
NIFTY50 8935 UP 27.01.17 8641 8650 8400
NIFTY IT 10750 UP 30.12.16 10399 10000 9800
NIFTY BANK 20728 UP 27.01.17 19708 19500 19200
ACC 1400 UP 27.01.17 1431 1400 1370
BHARTIAIRTEL 365 UP 03.02.17 354 345 335
BHEL 158 UP 27.01.17 140 145 138
CIPLA 589 UP 03.02.17 608 570 560
SBIN 272 UP 02.12.16 254 260 250
HINDALCO 188 UP 27.01.17 191 175 165
ICICI BANK 271 UP 21.10.16 277 260 255
INFOSYS 1022 UP 10.03.17 1022 970 960
ITC 263 UP 13.01.17 250 255 250
L&T 1492 UP 13.01.17 1439 1420 1380
MARUTI 5956 UP 06.01.17 5616 5700 5600
NTPC 157 DOWN 03.03.17 156 175 180
ONGC 192 UP 19.08.16 242 194 188
RELIANCE 1282 UP 30.12.16 1082 1120 1090
TATASTEEL 468 UP 04.03.16 289 440 420
S/l
4
Closing as on 10-03-2017
BSE SENSEX GAINERS & LOSERS TOP (% Change) NSE NIFTY GAINERS TOP & LOSERS (% Change)
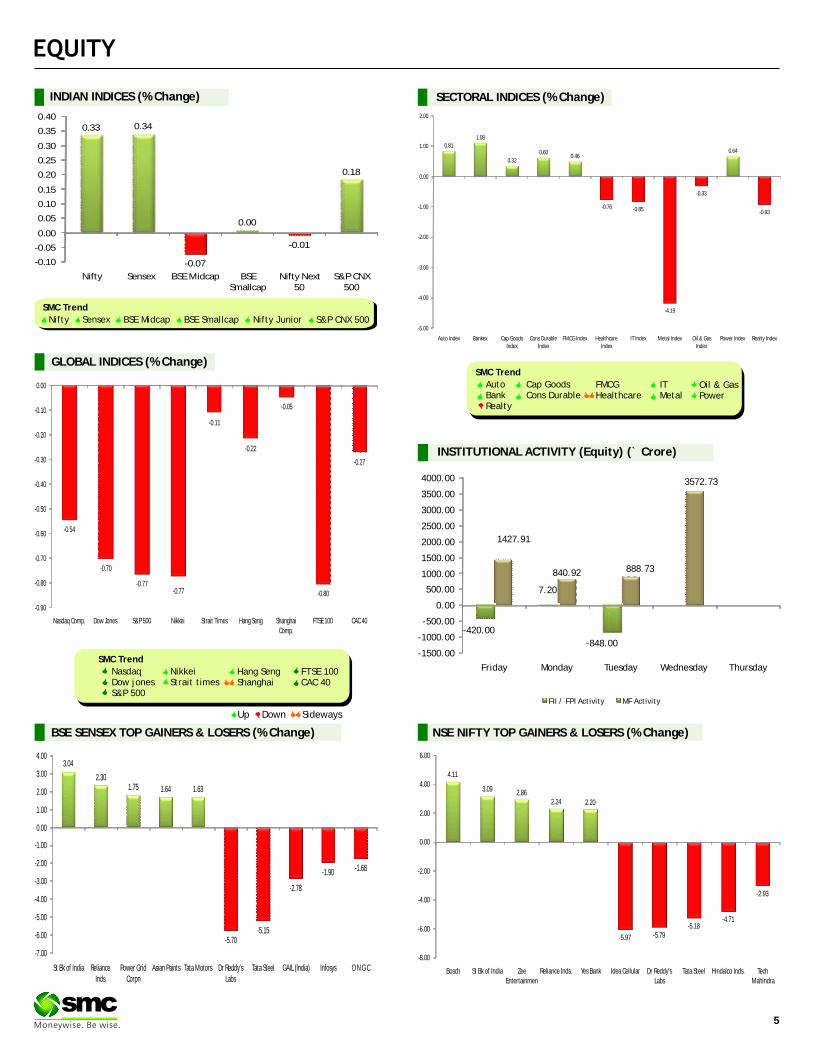
SECTORAL INDICES (% Change)
SMC Trend
FMCGHealthcare
Auto BankRealty
Cap GoodsCons Durable
Oil & GasPower
ITMetal
Down SidewaysUp
GLOBAL INDICES (% Change)
INDIAN INDICES (% Change)
5
SMC Trend
Nifty Sensex BSE Midcap BSE Smallcap Nifty Junior S&P CNX 500
SMC Trend
FTSE 100CAC 40
NasdaqDow jonesS&P 500
NikkeiStrait times
Hang SengShanghai
-420.00
7.20
-848.00
1427.91
840.92 888.73
3572.73
-1500.00
-1000.00
-500.00
0.00
500.00
1000.00
1500.00
2000.00
2500.00
3000.00
3500.00
4000.00
Friday Monday Tuesday Wednesday Thursday
FII / FPI Activity MF Activity
3.04
2.301.75 1.64 1.63
-5.70-5.15
-2.78
-1.90 -1.68
-7.00
-6.00
-5.00
-4.00
-3.00
-2.00
-1.00
0.00
1.00
2.00
3.00
4.00
St Bk of India Reliance Inds.
Power Grid Corpn
Asian Paints Tata Motors Dr Reddy's Labs
Tata Steel GAIL (India) Infosys O N G C
4.11
3.09 2.862.24 2.20
-5.97 -5.79-5.18
-4.71
-2.93
-8.00
-6.00
-4.00
-2.00
0.00
2.00
4.00
6.00
Bosch St Bk of India Zee Entertainmen
Reliance Inds. Yes Bank Idea Cellular Dr Reddy's Labs
Tata Steel Hindalco Inds. Tech Mahindra
-0.07
-0.01
0.33 0.34
0.00
0.18
-0.10
-0.05
0.00
0.05
0.10
0.15
0.20
0.25
0.30
0.35
0.40
Nifty Sensex BSE Midcap BSE Smallcap
Nifty Next 50
S&P CNX 500
0.81
1.08
0.32
0.600.46
0.64
-0.76 -0.85
-4.19
-0.33
-0.93
-5.00
-4.00
-3.00
-2.00
-1.00
0.00
1.00
2.00
Auto Index Bankex Cap Goods Index
Cons Durable Index
FMCG Index Healthcare Index
IT Index Metal Index Oil & Gas Index
Power Index Realty Index
-0.54
-0.70
-0.77-0.77
-0.11
-0.22
-0.05
-0.80
-0.27
-0.90
-0.80
-0.70
-0.60
-0.50
-0.40
-0.30
-0.20
-0.10
0.00
Nasdaq Comp. Dow Jones S&P 500 Nikkei Strait Times Hang Seng Shanghai Comp.
FTSE 100 CAC 40
INSTITUTIONAL ACTIVITY (Equity) (` Crore)

Beat the street - Fundamental Analysis
Above calls are recommended with a time horizon of 8 to 10 months. Source: Company Website Reuters Capitaline
6
Investment Rationale percent. Better operating performance and lower •Ahluwalia Contracts (India) Limited is an interest expense (down 10 percent) led to net
integrated construction company. Its project profit growth of 23 percent to 24 crore. portfolio includes residential and commercial Valuationcomplexes, hotels, institutional buildings, The government's focus on social and urban hospitals and corporate offices, information infrastructure would result healthy order pipeline technology ( IT) parks and industr ia l and other key positive for the company is the complexesand educational institutions, such as additional revenue from lease rentals from the Kota Indian Institute of Corporate Affairs, Indraprastha Project. Moreover, in the coming few years, it is Institute of Information Technology and IIT looking at reducing its debt and even the company is Campus Mandi. expecting to make debt-free company in the long
•It's about 67% of current order book is from public run. This improving balance sheet position is sector and balance 33% is private sector. Order expected to increase profitability levels, going pipeline is robust at about `1500 crore with forward. Further, margins are also expected to tenders largely coming in areas such as improve driven by a higher proportion of government healthcare, education and bank buildings. orders, better operating efficiencies along with
•The company is on track for its FY17 revenue better utilizations of capital equipment. Thus, it is growth target of 15% and EBITDA margin of about expected that the stock will see a price target of 348 13-13.5%. The company expects its FY18 revenue in 8 to 10 months time frame on an expected P/E of to grow by about 20% with about 0.5% increase in 18.30x and FY18 (E) earnings of 19.margin. Order inflow target for this fiscal is 1600 -2000 crore for FY18 and margins of 13.5-14 percent for FY18.
•The company's order book provides robust revenue visibility over the next few years. Also till December quarter, it has been awarded various prestigious projects. Further, with infrastructure development in the fast lane would strengthen the growth prospects of the company.
•The company has reported decent numbers for Q3FY17 due to better execution during the quarter, revenue grew by 12 percent YoY to 358 crore. EBITDA margin expanded by 82 bps to 13.2
`
`
``
`
P/E Chart
AHLUWALIA CONTRACTS (INDIA) LIMITED CMP: 311.10 Upside: 12%Target Price: 348.00
Face Value (`) 2.00
52 Week High/Low 336.20/236.10
M.Cap ( Cr.) 2083.98
EPS ( ) 12.60
P/E Ratio (times) 24.68
P/B Ratio (times) 4.95
Dividend Yield (%) 0.00
Stock Exchange BSE
`
`
` in cr
% OF SHARE HOLDING
VALUE PARAMETERS
Actual Estimate
FY Mar-16 FY Mar-17 FY Mar-18
Revenue 1,246.90 1,381.90 1,602.00EBITDA 160.80 186.00 218.30EBIT 140.80 166.90 197.80Pre-Tax Profit 119.10 148.90 184.60Net Income 84.40 99.09 122.60EPS 12.60 14.79 18.30BVPS 62.98 77.49 94.95ROE 22.20 21.00 21.10
FINOLEX INDUSTRIES LIMITED CMP: 536.45 Upside: 20%Target Price: 646.00
Investment Rationale ?Company's net profit for December quarter grew 69.5 per cent to `71.94 crore, even as volumes ?Finolex Industries Limited is the market leader in declined due to the cash ban. The company had the supply of PVC pipes & fittings for the posted a net profit of 42.43 crore for the same agriculture and non-agricultural sector that quarter of last financial year. Management of the includes housing, industry and construction. It is company expect pipes & fittings volumes to pick India's largest backward integrated PVC pipes and up in the coming months.fittings' manufacturer with a production capacity
of 2,80,000 MT per annum. Valuation
?Recently, the Lubrizol Corporation, inventors and With the strong growth in piping business on the back the largest manufacturers of CPVC compound of strong demand from agriculture/governmental worldwide and Finolex Industries, announced the initiatives in rural and housing. PVC margin is signing of FlowGuard (R) Processor agreement for expected to sustain, as raw material prices (EDC and the manufacturing and sale of Finolex FlowGuard Ethylene) have been stable and PVC price trending (R) Plus pipes and fittings in India. The product up. It is believed that the company has ample growth will be launched in the market by Finolex opportunities by leveraging its strong brand equity, Industries Limited on last week of March and will expansive reach and robust balance sheet. Thus, it is cater to the building and construction industry. expected that the stock will see a price target of 646
in 8 to 10 months time frame on a one year average ?The company is very hopeful that coming years P/E of 23.81x and FY18 (E) earnings of 27.14.could see volume growth which is the kind of long
term average for PVC growth in the PVC piping business. Most importantly, the kind of initiatives the government has announced in the budget especially for affordable housing, for irrigation and provision for safe drinking water in villages opens a big opportunity for the company.
?The company is on track with the capacity expansion plans. It is also looking at exploiting the brand equity and strong dealer network that the company has, by introducing new products in the area of water management. Company is in talks with many companies around the world for various products.
`
`
`
Face Value (`) 10.00
52 Week High/Low 556.50/348.40
M.Cap ( Cr.) 6657.34
EPS ( ) 24.16
P/E Ratio (times) 22.20
P/B Ratio (times) 3.32
Dividend Yield (%) 1.86
Stock Exchange BSE
`
`
% OF SHARE HOLDING
P/E Chart
` in cr
Actual EstimateFY Mar-16 FY Mar-17 FY Mar-18
Revenue 2,430.30 2,570.70 2,938.60EBITDA 375.10 549.80 531.90EBIT 324.50 501.10 481.30Pre-Tax Profit 318.10 498.40 480.50Net Income 214.50 335.20 343.60EPS 17.28 26.18 27.14BVPS 80.12 91.33 105.84ROE 24.10 31.70 27.70
VALUE PARAMETERS
4.89
8.8 4.97
52.47
28.87
Foreign
Institutions
Non Promoter Corporate Holding
Promoters
Public & Others
15.94
14.84
0
62.43
3.96 Foreign
Institutions
Non Promoter Corporate Holding
Promoters
Public & Others

Charts by Spider Software India Ltd
7
EQUITY
Above calls are recommended with a time horizon of 1-2 months
Disclaimer : The analyst and its affiliates companies make no representation or warranty in relation to the accuracy, completeness or reliability of the information contained in its research. The analysis contained in the analyst research is based on numerous assumptions. Different assumptions could result in materially different results.The analyst, not any of its affiliated companies, not any of their members, directors, employees or agents accepts any liability for any loss or damage arising out of the use of all or any part of the analysis research.
SOURCE: CAPITAL LINE
The stock closed at ̀ 1476.15 on 10th March 2017. It made a 52-week low at 894
on 11th March 2016 and a 52-week high of 1575 on 10th August 2016. The 200
days Exponential Moving Average (EMA) of the stock on the daily chart is
currently at 1305.20.
After a drastic fall from 1680 levels, it finally took a rebound near 900 levels and
recovered its lost value with the increase in price and volumes. Moreover, it has
gained momentum last week, which shows its potential to remain upwards in the
near term. Therefore, one can buy in the range of 1455-1465 levels for the
upside target of 1545-1555 levels with SL below 1410.
`
`
`
Credit Analysis and Research Limited
The stock closed at 230.40 on 10th March 2017. It made a 52-week low at
127.95 on 24th June 2016 and a 52-week high of 268.80 on 30th September
2016. The 200 days Exponential Moving Average (EMA) of the stock on the daily
chart is currently at 207.50.
After a steep rise, the stock went into consolidation in last few weeks, which
indicates that it may further move in a northward direction. Looking at the
momentum, it is advisable to buy on dips to attain good returns in the near term.
Therefore, one can buy in the range of 215-220 levels for the upside target of
230-235 levels with SL below 208.
`
` `
`
Dishman Pharmaceuticals and Chemicals Limited

DERIVATIVES
CHANGE IN NIFTY OPTION OI (IN QTY)
WEEKLY VIEW OF THE MARKET
NIFTY OPTION OI CONCENTRATION (IN QTY)
CHANGE IN BANKNIFTY OPTION OI (IN QTY)BANKNIFTY OPTION OI CONCENTRATION (IN QTY)
Strong buying momentum paused in later part of the week and market witnessed profit booking. Stock specific moves remained market flavor on the back of sector rotation. Market volatility started surging during the weekend. Nifty moved either side without any clear direction in weekly range of 8900-9000 levels. As Nifty has support around 8850-8800 levels, hence expectation of intermediate bounce is there but closing below 8700 can change the short term trend towards bears. Sector specific moves are likely to continue. Sectors like metals, pharma witnessed profit booking whereas IT and Auto supported the index. The Implied Volatility (IV) of calls moved up and closed at 14.23% while volatility for put options closed at 14.10%. The Nifty VIX for the week closed at 14.39% and hereon it is likely to surge further. Overall market's cost-of-carry decreased on the back of long unwinding in market. Among Nifty Call options, the 9000-strike call has the highest open interest of 71 lakh shares. On put side, 8800-strike put has the highest open interest of over 45 lakh shares in open interest respectively. The PCR OI for the week closed at 0.85 from 0.91, which indicates call writing in OTM calls. Range bound trading is expected next week with weekly range of 8800 to 9100 levels.
In lakhs
In 10000 In 10000
BATAINDIA (MAR FUTURE)
Buy: Above `515
Target: `534
Stop loss: `505
VEDL
BUY MAR 240. PUT 4.85SELL MAR 230. PUT 2.35
Lot size: 3500BEP: 237.50
Max. Profit: 26250.00 (7.50*3500)Max. Loss: 8750.00 (2.50*3500)
OPTIONSTRATEGY
FUTURE
HEROMOTOCO
BUY MAR 3350. CALL 28.00SELL MAR 3400. CALL 18.00
Lot size: 200BEP: 3360.00
Max. Profit: 8000.00 (40.00*200)Max. Loss: 2000.00 (10.00*200)
DERIVATIVE STRATEGIES
GLENMARK (MAR FUTURE )
Sell: Below `880
Target: `851
Stop loss: `895
BULLISH STRATEGY
TCS
BUY MAR 2550. CALL 37.00SELL MAR 2600. CALL 18.00
Lot size: 250BEP: 2569.00
Max. Profit: 7750 (31.00*250)Max. Loss: 4750(19.00*250)
AMARAJABAT (MAR FUTURE)
Sell: Below `825
Target: `796
Stop loss: `840
BEARISH STRATEGY
Call Put
6.9
9 13
.43
8.7
2
11
.39
13
.52
29
.36
64
.83
46
.72 52
.15
35
.19
45
.53
31
.17
34
.04
32
.49
46
.06
41
.96
42
.79
27
.45
6.8
6
5.8
1
1.9
1 5.0
8
0.00
10.00
20.00
30.00
40.00
50.00
60.00
70.00
8400 8500 8600 8700 8800 8900 9000 9100 9200 9300 9500
Call Put
-0.9
4
-2.7
8
-1.1
2
-1.3
7
-1.6
7
-2.1
5
11
.50
8.7
1
24
.09
10
.04
6.2
7
-0.8
3
-0.4
1
1.2
2
8.8
9
2.0
5
8.7
0
5.3
3
0.5
4
-1.0
3
0.2
0
-0.0
6
-5.00
0.00
5.00
10.00
15.00
20.00
25.00
30.00
8400 8500 8600 8700 8800 8900 9000 9100 9200 9300 9500
Call Put
7.6
6
16
.49
10
.15
16
.31
44
.07
6.7
0
5.4
7
55
.88
79
.32
39
.17
11
.68
14
.32
32
.19
36
.44
63
.56
43
.70
5.5
9
3.9
0
20
.72
3.0
2
5.6
7
0.6
4
0.00
10.00
20.00
30.00
40.00
50.00
60.00
70.00
80.00
90.00
18500 19000 19500 20000 20500 20600 20700 21000 21500 22000 22500
Call Put
-0.0
3
-2.0
4
-1.3
4
-7.2
7
-19
.55
-15
.65
-25
.05
-59
.33
-15
.65
-3.2
0
1.9
9
-4.1
9
-5.9
7
-8.7
2
-37
.29 -2
7.0
3
-4.6
2
-3.5
2
-1.3
0
0.1
6
0.4
8
-0.1
3
-70.00
-60.00
-50.00
-40.00
-30.00
-20.00
-10.00
0.00
10.00
18500 19000 19500 20000 20500 20600 20700 21000 21500 22000 22500
8
In lakhs

9
DERIVATIVES
FII’s ACTIVITY IN DERIVATIVE SEGMENT
SENTIMENT INDICATOR (NIFTY)
09-Mar 08-Mar 07-Mar 06-Mar 03-Mar
Discount/Premium 27.50 27.80 27.20 15.70 25.25
PCR(OI) 0.85 0.91 0.93 0.94 0.92
PCR(VOL) 0.74 0.84 0.96 0.81 0.86
A/D RATIO(Nifty 50) 1.00 0.23 0.48 3.75 1.00
A/D RATIO(All FO Stock)* 0.76 0.31 0.66 2.84 2.28
Implied Volatality 14.23 13.80 13.30 12.61 12.27
VIX 14.39 14.08 13.88 13.64 13.64
HISTORY. VOL 10.25 10.57 10.83 11.14 10.92
*All Future Stock
SENTIMENT INDICATOR (BANKNIFTY)
09-Mar 08-Mar 07-Mar 06-Mar 03-Mar
Discount/Premium 71.90 80.05 90.55 70.50 84.30
PCR(OI) 0.85 0.85 0.83 0.85 0.93
PCR(VOL) 0.68 0.77 0.57 0.77 0.83
A/D RATIO(Nifty 50) 1.50 0.50 0.22 All Up 0.71
#A/D RATIO 0.82 0.22 0.24 10.00 0.62
Implied Volatality 17.71 17.67 16.94 16.94 16.02
VIX 14.39 14.08 13.88 13.64 13.64
FII’S ACTIVITY IN NIFTY FUTURE
**The highest call open interest acts as resistance and highest put open interest acts as support.# Price rise with rise in open interest suggests long buildup | Price fall with rise in open interest suggests short buildup # Price fall with fall in open interest suggests long unwinding | Price rise with fall in open interest suggests short covering
# All BANKING Future Stock
Top 10 short build upTop long build up
LTP % Price Change Open interest %OI Chng
BHARATFIN 843.9 3.87% 15546000 24.15%
KSCL 510.25 2.95% 4003500 21.54%
JUSTDIAL 577.85 7.30% 2874000 19.99%
L&TFH 119.55 3.02% 21618000 19.68%
VOLTAS 385.3 3.71% 5300000 18.41%
EICHERMOT 23498.9 1.35% 229100 13.99%
WOCKPHARMA 733.65 1.26% 3284400 7.14%
RELIANCE 1291.6 2.19% 19367000 6.61%
OFSS 3942.85 4.91% 269400 4.12%
ADANIPOWER 38 1.88% 132460000 3.66%
LTP % Price Change Open interest %OI Chng
HINDZINC 291.65 -5.93% 9590400 37.79%
DRREDDY 2718.8 -5.73% 3436000 20.01%
OIL 325.7 -2.72% 2406492 19.46%
INFY 1011.95 -1.98% 26123500 17.60%
AMARAJABAT 827.45 -3.10% 1845600 17.27%
PFC 129.85 -3.06% 31974000 16.18%
GODREJIND 481.05 -2.13% 1342500 15.78%
IBREALEST 79 -2.05% 37140000 15.70%
TORNTPOWER 196.15 -3.02% 4908000 15.21%
VEDL 253.8 -5.58% 43064000 13.30%
In Cr. In Cr.
- 272 - 1
57 - 62
169
874
- 133
8
- 327
66
292
- 617
-1500
-1000
- 500
0
500
1000
23-Feb 27-Feb 28-Feb 1-Mar 2-Mar 3-Mar 6-Mar 7-Mar 8-Mar 9-Mar
47
12
45
8
14
88
- 96
- 57
0
- 86
4
- 11
53
- 19
58
- 52
3
- 23
87
-3000
-2000
-1000
0
1000
2000
3000
4000
5000
6000
23-Feb 27-Feb 28-Feb 1-Mar 2-Mar 3-Mar 6-Mar 7-Mar 8-Mar 9-Mar
10
SPICES
Soybean futures (Apr) on the national bourse are falling nine pins & is making fresh yearly lows every week. This trend will possibly persist as the counter can test 2800 levels in days to come due to lack of demand & bearish sentiments prevailing on the international market. On CBOT, U.S soybean futures (Mar) have slid to a two-month low, falling to their lowest close since Jan. 6, pressured by forecasts of a record Brazilian crop. The soybean market is facing headwinds as the U.S. Department of Agriculture increased its forecast of Brazil's 2016/17 soybean harvest to an all-time high 108 million tonnes, from 104 million in February. The agency also cut its estimate of U.S. 2016/17 soybean exports, citing competition from the big Brazilian crop, and consequently raised its forecast of U.S. soy ending stocks to 435 million bushels. The upside moves of mustard futures (Apr) may get restricted & may face resistance near 3950 levels owing to prospects of higher output this season. India's mustard output is estimated to rise to 6.9 million tons in 2016-17 (Jul-Jun), from 5.8 million tons a year ago, due to better yield and favourable weather. Taking into account production and carryover stocks of the oilseed, total availability of mustard was estimated at 7.1 million tons in 2016-17. Moreover, harvesting is going on in full swing, around 25-30 percent of the mustard crop has already harvested and supply is expected to further pick up after March 15, which may weigh on mustard seed prices. Ref. soy oil futures (Apr) is looking bearish as it can slip further towards 630 levels, while CPO futures (Mar) will possibly decline towards 520-515 levels. There is anticipation that the supply of edible oil in local market may rise due to robust oilseed crop in the country. The buyers on the spot markets are also not in hurry and doing need-based buying.
OIL AND OILSEEDS
OTHER COMMODITIES
Sugar futures (Mar) may turn more sour, as it can fall towards 3600 levels. Though the Indian Sugar Mills Association has revised its forecast for sugar production in the ongoing sugar season 2016-17 (October-September) by 4.69% down at 203 lakh tons, but has continued to reiterate its point that there is sufficient sugar in the country to meet domestic consumption demand. Considering the opening balance of 77.5 lakh tons, (which has been reported by all sugar mills to the Government) and considering an estimated sugar production of 203 lakh tons in the current season and consumption of 238-240 lakh tons, the closing balance in the current season would be 40 to 42 lakh tons. The uptrend of Kapas futures (Apr) is likely to get stalled & some correction can be seen in days to come, as it may face resistance near 1180 levels. The sentiments have turned bearish in the international market as China has started to offload its cotton reserve through auctions. This process is likely to continue with an offering around 30,000 tons a day until the end of August 2017. Guar complex are likely to witness correction on the national bourse as the demand is getting slowed down at higher levels. Secondly, the miller are not buying aggressively as still there are more than 2 crore bags of Guar seed left in the country from production of 1 crore bags this season and 1.5 crore bags of opening stocks, which is more than sufficient to cater current export demand of guar gum. Thirdly, the plunging international crude oil prices are giving a jolt to guar, which is widely used in fracking of oil and natural gas.
Bullion counter may remain on a volatile path as this week outcome of FOMC meeting and movement of greenback will give further direction to the prices. Movement of local currency rupee can also affect the prices, which can move in the range of 66-67.50. Gold can face resistance of $1250 in COMEX and 29200 in MCX while it has support near $1160 in COMEX and $28000 in MCX. Silver has key support near 39500 in MCX and $16.70 in COMEX. And it has resistance near 43000 in MCX and $18.20 in COMEX. US ADP National Employment Report showed its biggest increase in over a year in February, suggesting the economy remains on solid ground. Recently Fed Chair Janet Yellen stated that the central bank was poised to lift rates provided jobs and inflation data held up. Higher interest rates typically pressure gold prices because they raise the opportunity cost of holding non-yielding bullion while boosting the dollar, in which it is priced. The precious metal has been hit by Federal Reserve officials including Chair Janet Yellen talking up the prospect of higher rates. The European Central Bank pledged to keep its aggressive stimulus policy in place at least until the end of the year, but signaled a diminishing urgency for more policy action, enough to send the euro and bond yields higher. According to the World Gold Council (WGC) “Gold demand in India is expected to revive in 2017 after touching to seven year lows in 2016, according to a global industry body”.
BULLIONS
Crude oil prices may remain on a weaker side as increased inventories and surge in production from shale gas producers can give further pressurize to the prices. Crude oil can trade in the range of 3150-3480 in MCX. Crude prices dropped to their lowest in more than three months last week pressured by concerns that a global supply glut is proving stubbornly persistent. Market confidence has taken a hit after a period of higher prices enticed more U.S. shale oil companies to drill more wells and as stockpiles have remained high. Data showed crude stocks in the United States, the world's top oil consumer, swelled by 8.2 million barrels in penultimate week to a record 528.4 million barrels. U.S. drilling has also picked up, with producers planning to expand crude production in North Dakota, Oklahoma and other shale regions, while the Permian, America's largest oilfield, has seen output jump. Natural gas may witness further bounce back as colder weather forecast to support its prices. Overall, it can move in the range of 185-215 in MCX. The U.S. Energy Information Administration stated that natural gas storage in the U.S. fell by 68 billion cubic feet in the week ended March 3. Weather forecasts for the next 8-to-15 days showed that rain, snow, and cool temperatures will track across the northern and eastern U.S., boosting demand expectations for the heating fuel. Based on data from the National Oceanographic and Atmospheric Administration, this year's extremely warm winter has pushed heating demand for natural gas to nearly 20% below average.
ENERGY COMPLEX
In base metal counter, China slowdown concerns, LME inventory positions, and outcome of fed meeting this week to give further direction to the prices. Recently China cut its economic growth target to “around 6.5%” for 2017 from “6.5%-7%” last year, in line with expectations. Copper may move in the range of 368-396 in MCX. Recently copper slumped lower as surge in London Metal Exchange (LME) copper stocks and news from Chile that BHP Billiton was mulling bringing in temporary workers to ease the effects of a strike at its Escondida copper mine also pressured prices. Copper hit highs in February after news of strike action at Escondida and an export stoppage at Freeport-McMoRan's Grasberg facility in Indonesia. Lead can trade in the range of 148-156 levels. Nickel can move in the range of 660-720. Nickel prices tumbled lower after the news that the Philippines government may have another look at its mining sector environmental review that led to the closure of over half the country's production capacity. Meanwhile Hong Kong-listed China Hanking Holdings stated that it will restart a low-grade nickel mine it closed in 2014 to supply domestic smelters. Aluminum prices may trade in the range of 121-128 in MCX. Aluminium Association stated that it filed the case last week with U.S. regulators accusing Chinese producers of receiving improper subsidies and selling at unfairly low prices that hurt foreign competitors. Zinc can move in the range of 171-185. The ILZSG estimates that the refined zinc market was in a deficit of 286,000 tonnes in the whole of 2016 compared with a surplus of 189,000 tonnes in 2015.
Turmeric futures (Apr) is expected to breach the support near 6550 levels & may fall further towards 6300 levels. The sentiments are bearish as the supply is sufficient to cater demand and also new crop supply is expected to pick up pace by month-end. Jeera futures (Apr) is likely to take support near 16400 levels & trade with an upside bias. In Unjha and Rajkot, the demand has turned better from local and upcountry buyers followed by good inquiries from overseas. This year carry over stock is likely to be lower in recent years due to poor crop a year ago, which is supportive factor for cumin seed. Coriander futures (Apr) is expected to trade in the range of 6400-6850 levels & some recovery can be seen in the counter. In the spot markets of Rajasthan and Madhya Pradesh, coriander has started witnessing recover due to fresh inquiry at the lower levels. On the demand side, in a recent concluded conference organized by Federation of Indian Spices Stakeholders (FISS) estimated coriander crop at 90 lakh bags (45kg each) against 100 lakh bags last year. Production in Madhya Pradesh was estimated at 37 lakh bags, 16-17 lakh bags in Rajasthan and 35 lakh bags in Gujarat. Cardamom futures (Apr) may witness a sharp decline towards 1350-1320 levels. The small cardamom prices are declining on slack domestic demand at auctions held in Kerala and Tamil Nadu. The North Indian dealers have slowed down buying following forecasts of good summer rains. Besides they are anticipating that the growers who are holding stocks would release in the coming days. Availability of imported cheap Guatemala cardamom in the north Indian markets is also said to have weakened the domestic demand.
BASE METALS
11
TECHNICAL RECOMMENDATIONS
COMMODITY
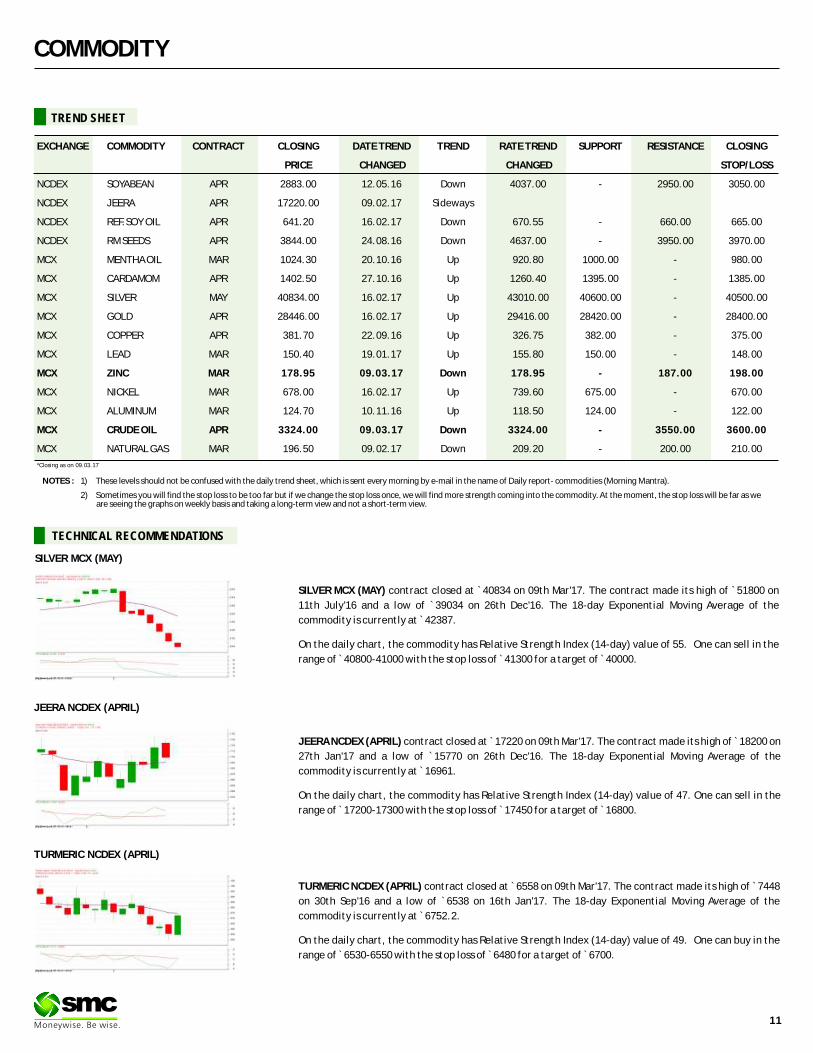
SILVER MCX (MAY) contract closed at `40834 on 09th Mar'17. The contract made its high of 51800 on
11th July'16 and a low of 39034 on 26th Dec'16. The 18-day Exponential Moving Average of the
commodity is currently at 42387.
On the daily chart, the commodity has Relative Strength Index (14-day) value of 55. One can sell in the
range of 40800-41000 with the stop loss of 41300 for a target of 40000.
`
`
`
` ` `
JEERA NCDEX (APRIL) contract closed at 17220 on 09th Mar'17. The contract made its high of 18200 on
27th Jan'17 and a low of 15770 on 26th Dec'16. The 18-day Exponential Moving Average of the
commodity is currently at 16961.
On the daily chart, the commodity has Relative Strength Index (14-day) value of 47. One can sell in the
range of 17200-17300 with the stop loss of 17450 for a target of 16800.
` `
`
`
` ` `
TURMERIC NCDEX (APRIL) contract closed at 6558 on 09th Mar'17. The contract made its high of 7448
on 30th Sep'16 and a low of 6538 on 16th Jan'17. The 18-day Exponential Moving Average of the
commodity is currently at 6752.2.
On the daily chart, the commodity has Relative Strength Index (14-day) value of 49. One can buy in the
range of 6530-6550 with the stop loss of 6480 for a target of 6700.
` `
`
`
` ` `
SILVER MCX (MAY)
JEERA NCDEX (APRIL)
TURMERIC NCDEX (APRIL)
NOTES : 1) These levels should not be confused with the daily trend sheet, which is sent every morning by e-mail in the name of Daily report- commodities (Morning Mantra).
2) Sometimes you will find the stop loss to be too far but if we change the stop loss once, we will find more strength coming into the commodity. At the moment, the stop loss will be far as we are seeing the graphs on weekly basis and taking a long-term view and not a short-term view.
EXCHANGE COMMODITY CONTRACT CLOSING DATE TREND TREND RATE TREND SUPPORT RESISTANCE CLOSING
PRICE CHANGED CHANGED STOP/LOSS
NCDEX SOYABEAN APR 2883.00 12.05.16 Down 4037.00 - 2950.00 3050.00
NCDEX JEERA APR 17220.00 09.02.17 Sideways
NCDEX REF.SOY OIL APR 641.20 16.02.17 Down 670.55 - 660.00 665.00
NCDEX RM SEEDS APR 3844.00 24.08.16 Down 4637.00 - 3950.00 3970.00
MCX MENTHA OIL MAR 1024.30 20.10.16 Up 920.80 1000.00 - 980.00
MCX CARDAMOM APR 1402.50 27.10.16 Up 1260.40 1395.00 - 1385.00
MCX SILVER MAY 40834.00 16.02.17 Up 43010.00 40600.00 - 40500.00
MCX GOLD APR 28446.00 16.02.17 Up 29416.00 28420.00 - 28400.00
MCX COPPER APR 381.70 22.09.16 Up 326.75 382.00 - 375.00
MCX LEAD MAR 150.40 19.01.17 Up 155.80 150.00 - 148.00
MCX ZINC MAR 178.95 09.03.17 Down 178.95 - 187.00 198.00
MCX NICKEL MAR 678.00 16.02.17 Up 739.60 675.00 - 670.00
MCX ALUMINUM MAR 124.70 10.11.16 Up 118.50 124.00 - 122.00
MCX CRUDE OIL APR 3324.00 09.03.17 Down 3324.00 - 3550.00 3600.00
MCX NATURAL GAS MAR 196.50 09.02.17 Down 209.20 - 200.00 210.00
TREND SHEET
*Closing as on 09.03.17
COMMODITY
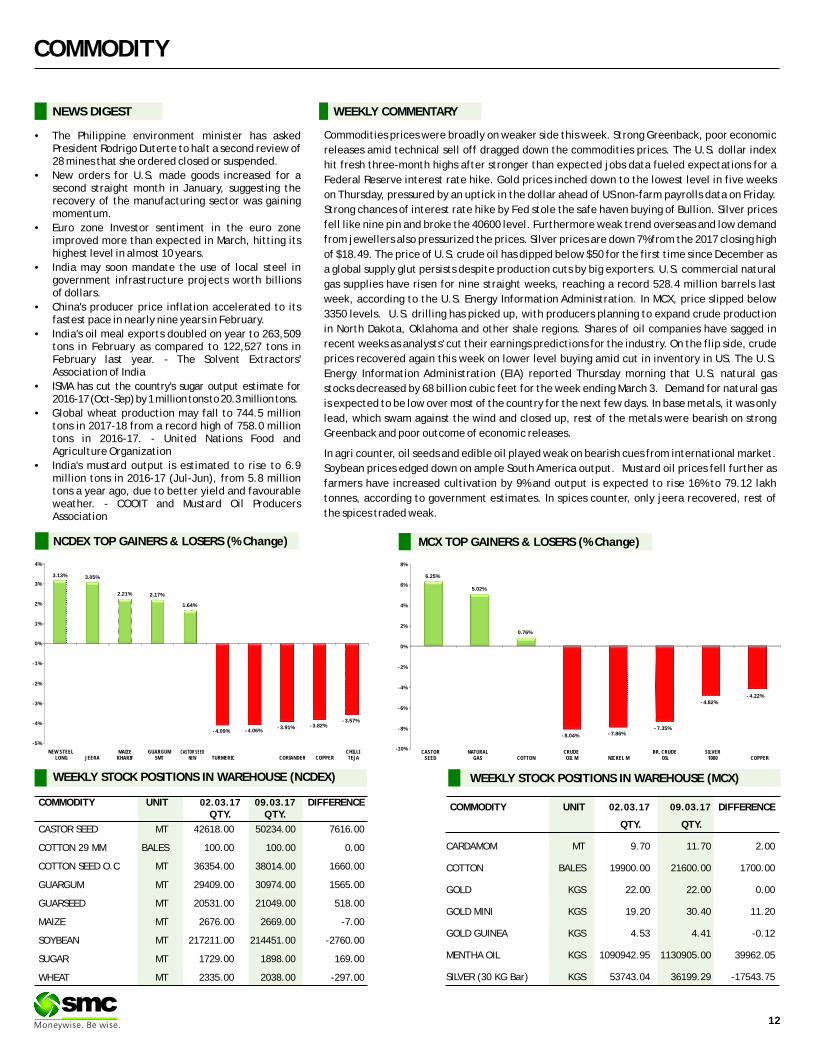
NEWS DIGEST
Commodities prices were broadly on weaker side this week. Strong Greenback, poor economic
releases amid technical sell off dragged down the commodities prices. The U.S. dollar index
hit fresh three-month highs after stronger than expected jobs data fueled expectations for a
Federal Reserve interest rate hike. Gold prices inched down to the lowest level in five weeks
on Thursday, pressured by an uptick in the dollar ahead of US non-farm payrolls data on Friday.
Strong chances of interest rate hike by Fed stole the safe haven buying of Bullion. Silver prices
fell like nine pin and broke the 40600 level. Furthermore weak trend overseas and low demand
from jewellers also pressurized the prices. Silver prices are down 7% from the 2017 closing high
of $18.49. The price of U.S. crude oil has dipped below $50 for the first time since December as
a global supply glut persists despite production cuts by big exporters. U.S. commercial natural
gas supplies have risen for nine straight weeks, reaching a record 528.4 million barrels last
week, according to the U.S. Energy Information Administration. In MCX, price slipped below
3350 levels. U.S. drilling has picked up, with producers planning to expand crude production
in North Dakota, Oklahoma and other shale regions. Shares of oil companies have sagged in
recent weeks as analysts' cut their earnings predictions for the industry. On the flip side, crude
prices recovered again this week on lower level buying amid cut in inventory in US. The U.S.
Energy Information Administration (EIA) reported Thursday morning that U.S. natural gas
stocks decreased by 68 billion cubic feet for the week ending March 3. Demand for natural gas
is expected to be low over most of the country for the next few days. In base metals, it was only
lead, which swam against the wind and closed up, rest of the metals were bearish on strong
Greenback and poor outcome of economic releases.
In agri counter, oil seeds and edible oil played weak on bearish cues from international market.
Soybean prices edged down on ample South America output. Mustard oil prices fell further as
farmers have increased cultivation by 9% and output is expected to rise 16% to 79.12 lakh
tonnes, according to government estimates. In spices counter, only jeera recovered, rest of
the spices traded weak.
WEEKLY COMMENTARY
COMMODITY UNIT 09.03.17 DIFFERENCEQTY. QTY.
CASTOR SEED MT 42618.00 50234.00 7616.00
COTTON 29 MM BALES 100.00 100.00 0.00
COTTON SEED O.C MT 36354.00 38014.00 1660.00
GUARGUM MT 29409.00 30974.00 1565.00
GUARSEED MT 20531.00 21049.00 518.00
MAIZE MT 2676.00 2669.00 -7.00
SOYBEAN MT 217211.00 214451.00 -2760.00
SUGAR MT 1729.00 1898.00 169.00
WHEAT MT 2335.00 2038.00 -297.00
02.03.17 COMMODITY UNIT 09.03.17 DIFFERENCE
QTY. QTY.
CARDAMOM MT 9.70 11.70 2.00
COTTON BALES 19900.00 21600.00 1700.00
GOLD KGS 22.00 22.00 0.00
GOLD MINI KGS 19.20 30.40 11.20
GOLD GUINEA KGS 4.53 4.41 -0.12
MENTHA OIL KGS 1090942.95 1130905.00 39962.05
SILVER (30 KG Bar) KGS 53743.04 36199.29 -17543.75
02.03.17
•The Philippine environment minister has asked President Rodrigo Duterte to halt a second review of 28 mines that she ordered closed or suspended.
•New orders for U.S. made goods increased for a second straight month in January, suggesting the recovery of the manufacturing sector was gaining momentum.
•Euro zone Investor sentiment in the euro zone improved more than expected in March, hitting its highest level in almost 10 years.
•India may soon mandate the use of local steel in government infrastructure projects worth billions of dollars.
•China's producer price inflation accelerated to its fastest pace in nearly nine years in February.
•India's oil meal exports doubled on year to 263,509 tons in February as compared to 122,527 tons in February last year. - The Solvent Extractors' Association of India
•ISMA has cut the country's sugar output estimate for 2016-17 (Oct-Sep) by 1 million tons to 20.3 million tons.
•Global wheat production may fall to 744.5 million tons in 2017-18 from a record high of 758.0 million tons in 2016-17. - United Nations Food and Agriculture Organization
•India's mustard output is estimated to rise to 6.9 million tons in 2016-17 (Jul-Jun), from 5.8 million tons a year ago, due to better yield and favourable weather. - COOIT and Mustard Oil Producers Association
WEEKLY STOCK POSITIONS IN WAREHOUSE (MCX)
12
WEEKLY STOCK POSITIONS IN WAREHOUSE (NCDEX)
NCDEX TOP GAINERS & LOSERS (% Change) MCX TOP GAINERS & LOSERS (% Change)
3.13% 3.05%
2.21% 2.17%
1.64%
- 4.09% - 4.06%- 3.91% - 3.82%
- 3.57%
-5%
-4%
-3%
-2%
-1%
0%
1%
2%
3%
4%
NEW STEEL LONG JEERA
MAIZE KHARIF
GUARGUM 5MT
CASTOR SEED NEW TURMERIC CORIANDER COPPER
CHILLI TEJA
6.25%
5.02%
0.76%
- 8.04% - 7.86%- 7.35%
- 4.82%- 4.22%
-10%
-8%
-6%
-4%
-2%
0%
2%
4%
6%
8%
CASTOR SEED
NATURAL GAS COTTON
CRUDE OIL M NICKEL M
BR. CRUDE OIL
SILVER 1000 COPPER

COMMODITY
COMMODITY EXCHANGE CONTRACT 03 09.03.17 CHANGE%
ALUMINIUM LME 3 MONTHS 1892.00 1868.00 -1.27
COPPER LME 3 MONTHS 5917.00 5690.00 -3.84
LEAD LME 3 MONTHS 2249.00 2250.50 0.07
NICKEL LME 3 MONTHS 10990.00 10150.00 -7.64
ZINC LME 3 MONTHS 2775.00 2681.50 -3.37
GOLD COMEX APR 1226.50 1203.20 -1.90
SILVER COMEX MAR 17.74 17.04 -3.97
LIGHT CRUDE OIL NYMEX MAR 53.33 49.28 -7.59
NATURAL GAS NYMEX MAR 2.83 2.97 5.20
.03.17
PRICES OF METALS IN LME/ COMEX/ NYMEX (in US $)
WEEKLY STOCK POSITIONS IN LME (IN TONNES)
COMMODITY STOCK POSITION STOCK POSITION DIFFERENCE
02.02.17 09.03.17
ALUMINIUM 2188400 2101550 -86850
COPPER 200725 288525 87800
NICKEL 377778 386118 8340
LEAD 189600 189725 125
ZINC 384100 383850 -250
INTERNATIONAL COMMODITY PRICES
COMMODITY EXCHANGE CONTRACT UNIT 03.03.17 09.03.17 CHANGE(%)
Soybean CBOT MAR Cent per Bushel 1027.00 1000.25 -2.60
Soy oil CBOT MAR Cent per Pound 34.38 33.11 -3.69
CPO BMD MAY MYR per MT 2863.00 2839.00 -0.84
Sugar LIFFE MAY 10 cents per MT 541.90 509.90 -5.91
13
SPOT PRICES (% change) Indian gold market in 2017
According to the World Gold Council (WGC), in 2017, the demand for gold in India will recover from its 2016 lows. A barrage of policy initiatives aimed to abolish the India's black money, instilling greater transparency and most dramatic radical decision to demonetize over 15 trillion rupees has rocked India's economy last year, including its gold market. Other policies – such as the re-introduction of excise duty – affected the gold market. The gold demand in India stood at 675.5 tones in calendar 2016 compared to 857.2 tones in 2015-a decline of 21.19%, according to data released by World Gold Council. This is also the lowest demand since 2009.
India's gold industry suffered heavily last year. In first half of 2016, the 1% excise duty on jewellery manufacturing prompted a 42-day strike by jewelers. The income disclosure scheme disrupted the black market–some consumers postponed buying gold. And in Q4 2016, the demonetization shock caused a liquidity squeeze that affected the entire economy. Moreover fragile rural sentiment and a soaring gold price pushed gold demand to its lowest level since 2009.
Challenges of Indian gold market in 2017
According to the World Gold Council , after a challenging 2016 the gold demand faces headwinds in 2017 as the ban on cash transactions over Rs 3 lakh could hurt rural Indian demand while GST could adversely affect the industry in the short-term. Cash transaction limit will have the greatest impact in rural India, where people do not necessarily have access to cheques and electronic payments. It could curb gold purchases, it could just encourage gold shoppers to buy smaller amounts of gold spread over more transactions, or it could push a large part of demand underground and encourage growth in the black market. On GST, there is still no clarity over what rate will be implemented and whether customs duty will change to compensate for any potential increase in GST.
But after falling so sharply last year, demand is unlikely to fall further in 2017. A banking system flushes with liquidity, the bumper crop after a good monsoon, and central government employees' and pensioners' inflation-busting wage hike will all support economic growth. After clarity about tax structure of GST it will boost the economy, promises to make gold's value chain more transparent.
It is likely that the demonetisation will have a behavioural impact too. The shock initiative has reinforced the people faith in gold. gold makes them feel secure for the long-term. The demonetisation programme will underpin these beliefs. Demonetisation is also boosting large jewellery retailers, and they will continue to grab a larger share of the market. Over time, consumers will move away from cash towards digital payments, and organised players should benefit from this trend.
According to the World Gold Council gold demand in 2017 is likely between 650t and 750t. Over time, the economic growth and greater transparency within India's gold market will push demand higher. By 2020, WGC see Indian consumers will buy between 850t and 950t.
-6.24
-2.71
-2.68
-1.81
-1.35
-0.96
-0.91
0.00
0.05
0.06
0.25
0.32
0.81
3.51
5.46
6.28
-8.00 -6.00 -4.00 -2.00 0.00 2.00 4.00 6.00 8.00
TURMERIC (NIZAMABAD)
BARLEY (JAIPUR)
CORIANDER (KOTA)
COTTON SEED OIL CAKE (AKOLA)
SOYABEAN (INDORE)
MUSTARD (JAIPUR)
RAW JUTE (KOLKATA)
CRUDE PALM OIL (KANDLA)
JEERA (UNJHA)
SUGAR (KOLKATA)
GUR (MUZAFFARNGR.)
PEPPER MALABAR GAR (KOCHI)
COTTON (KADI)
GUAR SEED (JODHPUR)
GUAR GUM (JODHPUR)
WHEAT (DELHI)
India,s gold demand in ton

CURRENCY
Currency Table
Currency Pair Open High Low Close
USD/INR 67.07 67.26 66.93 67.11
EUR/INR 71.10 71.27 70.58 70.69
GBP/INR 82.29 82.33 81.33 81.37
JPY/INR 58.87 58.93 58.30 58.39
News Flows of last week
07th Mar Japan GDP revised up to 0.3% on quarter in q4
08th Mar China consumer prices rise 0.8% in February
09th Mar ECB Leaves rates unchanged, repeats accommodative stance
09th Mar U.S. Weekly Jobless claims rebound from four-decade low
09th Mar U.S. Import prices rise 0.2% in February, slightly more than
expected
09th Mar Japan manufacturing index falls in q1
EUR/INR (MAR) contract closed at 70.69 on 09thMarch'17. The contract made its high of 71.27 on 06th March'17 and a low of 70.58 on 09thMarch'17 (Weekly Basis). The 14-day Exponential Moving Average of the EUR/INR is currently at 70.95.
On the daily chart, EUR/INR has Relative Strength Index (14-day) value of 40.40. One can buy above 71.10 for a target of 72.00 with the stop loss of 70.60.
(Source: Spider Software, Open: Monday 9.00 AM IST, Close: Thursday (5.00 PM IST)
Market Stance
Indian rupee ended the week with marginal gains on the back of fresh selling
of American currency by banks and corporate. Moreover, robust capital
inflows into equities and debt predominantly supported the domestic
currency. Furthermore, healthy GDP number declared last week despite
demonetization also added bullish sentiment in the local unit. However, the
sharp gains were seen capped as traders avoided taking any positions ahead of
assembly poll results outcome and concerns over an impending Fed rate hike.
Though, the exit polls show that the Bharatiya Janata Party (BJP) is likely to
emerge as a major victor from the latest state assembly elections except in
Punjab. While some polls shows that the BJP is likely to get full majority in
Uttar Pradesh. So, far this year Indian rupee has gained more than 1.5%.
EUR/INR
USD/INR (MAR) contract closed at 66.86 on 09thMarch'17. The contract made its high of 66.99 on 09thMarch'17 and a low of 66.75 on 07thMarch'17 (Weekly Basis). The 14-day Exponential Moving Average of the USD/INR is currently at 66.98.
On the daily chart, the USD/INR has Relative Strength Index (14-day) value of 37.62. One can sell below 66.50 for the target of 65.50 with the stop loss of 67.00.
GBP/INR (MAR) contract closed at 81.37 on 09thMarch'17. The contract made its high of 82.33 on 06th March'17 and a low of 81.33 on 09thMarch'17 (Weekly Basis). The 14-day Exponential Moving Average of the GBP/INR is currently at 82.48.
On the daily chart, GBP/INR has Relative Strength Index (14-day) value of 30.44. One can buy above 81.75 for a target of 82.75 with the stop loss of 81.25
JPY/INR (MAR) contract closed at 58.39 on 09thMarch'17. The contract made its high of 58.93 on 06th March'17 and a low of 58.30 on 09thMarch'17 (Weekly Basis). The 14-day Exponential Moving Average of the JPY/INR is currently at 58.94.
On the daily chart, JPY/INR has Relative Strength Index (14-day) value of 40.05. One can sell around 58.10 for a target of 57.10 with the stop loss of 58.60.
USD/INRTechnical Recommendation
Economic gauge for the next week
Date Currency Event Previous
13th Mar EUR ECB President Draghi's Speech
15th Mar USD Retail Sales (MoM) 0.4
15th Mar USD Consumer Price Index (YoY) 2.5
15th Mar USD Consumer Price Index Ex Food & Energy (YoY) 2.3
15th Mar USD FOMC Economic Projections
15th Mar USD Fed's Monetary Policy Statement
15th Mar USD Fed Interest Rate Decision 0.75
15th Mar USD FOMC Press conference
16th Mar GBP BoE Interest Rate Decision 0.25
16th Mar GBP Monetary Policy Summary
16th Mar GBP Bank of England Minutes
16th Mar GBP BOE MPC Vote Unchanged 9
GBP/INR JPY/INR
14

15
IPO
IPO NEWS
S Chand gets Sebi go-ahead to launch IPO
Leading text book publisher S Chand and Company has received markets regulator Sebi's approval to float an initial public offering (IPO). This includes fresh
issue of shares worth Rs 300 crore. Besides, the company's existing shareholders, including private equity fund Everstone and International Finance Corporation
(IFC), would be offloading 6,023,236 shares through the Offer for Sale (OFS) route. The company had filed draft red herring prospectus (DRHP) with Sebi in
December last year to float an initial public offer. It received Sebi's 'observation' on March 3, 2017, which is necessary for any firm to launch its public offer, as per
the latest update. Proceeds from the issue would be utilised for repayment and prepayment of loans as well as for general corporate purposes. The loan amount
includes those taken by its subsidiary for funding the acquisition of Chhaya Prakashani. The company offers 53 consumer brands across knowledge products and
services including S Chand, Vikas, Madhubun, Saraswati, Destination Success and Ignitor.
Centre to dial Sebi for faster PSU listing
The central government is planning to write to the Securities and Exchange Board of India (Sebi) for faster approvals of offer documents to meet its objective of
time-bound listing of public sector undertakings (PSUs). On an average, Sebi takes a little over two months to clear initial public offer (IPO) documents. The
centre wants PSU IPOs to be cleared within a month. The move comes in the wake of the budget announcement on fast tracking the PSU listing process.
Interestingly, the Department of Public Asset Management (Dipam) in a document outlining the new timeline for PSU listings has assigned just 30 days for Sebi
approval. The Dipam expects the entire process to be completed within 165 days. For the first time in many years, the pipeline of PSU IPOs looks strong as nearly
dozen public owned entities are planning their public issues. Cochin Shipyard and Housing and Urban Development Corporation (Hudco) have already filed their
draft prospectus with Sebi. Apart from these, there are three general insurance companies (GIC) including New India Assurance which are expected to come up
with their public offering in the next few months. Centre is also planning to list three companies Indian Railway Catering and Tourism Corporation (IRCTC), IRCON
and Indian Railway Finance Corporation (IRFC).
Kolkata-based Bharat Road Network Plan Rs 1,200 crore IPO
Kolkata-based, Bharat Road Network Ltd. (BRNL), a Srei initiative, has filed a draft red herring prospectus with Sebi seeking permission for its initial public
offering, with an issue consisting of up to 29,300,000 equity shares having a face value of Rs 10 each. The issue size is estimated to be around Rs 1,200 crore. BRNL
is a road BOT (build–operate–transfer) company, focused on development, implementation, operation and maintenance of roads and highways projects. The net
proceeds from the issue will be utilised towards advancing of subordinate debt in the form of an interest-free unsecured loan to its subsidiary, STPL — a SPV
(special purpose vehicle), promoted by SREI Infrastructure Finance to implement a lane expansion project under a 25-year concession from the National
Highways Authority of India. At present, all the projects are implemented through special purpose vehicles, either through its subsidiaries or in partnership with
other infrastructure players.
Infra firm Montecarlo plans to go public
Infrastructure company, Montecarlo, is planning to restructure its business to get listed on BSE next year, reports Mint . Its restructuring will involve a plan to
create a separate entity for its real estate business while merging all its engineering, procurement and construction (EPC) operations into the parent company to
simplify the company's structure. This is going to bring together all the infrastructure companies including Montecarlo Energy, Montecarlo Projects, Montecarlo
Engineering and Montecarlo Infrastructure under Montecarlo Limited, which is the parent company. Its businesses which are catering to real estate, Montecarlo
Realty and Montecarlo Construction, will be demerged from the company. This will simplify the structure while an IPO of the parent company will help fund both
the separate entities. This restructuring is expected to be completed by March. Many infrastructure companies have gone public in the recent past. For instance,
construction company, Dilip Buildcon , which was listed last year, raised Rs 664 crore and was subscribed 21 times.
Company Sector M.Cap(In RsCr.) Issue Size (in RsCr.) List Date Issue Price List Price Last Price %Gain/Loss(from Issue price)
BSE Ltd Finance 5072.32 1234.40 3-Feb-17 806.00 1085.00 944.95 17.24
Laurus Lab Pharma 5454.38 300.00 19-Dec-16 428.00 490.00 515.75 20.50
Sheela Foam Ltd Textiles 5347.33 510.00 9-Dec-16 730.00 1008.00 1096.15 50.16
Varun Beverages FMCG 6526.70 1100.00 8-Nov-16 445.00 430.00 357.80 -19.60
PNB Housing Housing Finance 16300.03 3000.00 7-Nov-16 775.00 863.00 984.05 26.97
Endurance Tech Auto Ancillary 9847.81 1162.00 19-Oct-16 472.00 570.00 700.10 48.33
HPL Electric Capital Goods 690.59 361.00 4-Oct-16 202.00 190.05 107.40 -46.83
ICICI Pru Life Insurance 53293.58 6057.00 29-Sep-16 334.00 329.00 371.30 11.17
GNA Axles Financial services 411.38 130.00 26-Sep-16 207.00 248.50 191.65 -7.42
L&T Technology IT 7780.84 894.00 23-Sep-16 860.00 900.00 765.15 -11.03
*
IPO TRACKER
*Closing price as on 09-03-2017

FIXED DEPOSIT MONITOR
• Interest structure may be revised by company from time to time. Pls confirm Interest rates before submitting the application.
* For Application Greater Than Rs. Fifty Lakhs Or equal to Fifty Lakhs, Please Contact to Head Office.
* Email us at [email protected]
FIXED DEPOSIT COMPANIES
PERIOD MIN.ADDITIONAL RATE OF INTEREST (%)
S.NO (NBFC COMPANY -NAME)12M 18M 24M 36M 45M 48M 60M 84M INVESTMENT
-1 BAJAJ FINANCE LTD.(UPTO RS. 5 CR.) 7.80 7.80 8.00 8.05 - 8.05 8.05 0.25% FOR SR. CITIZEN, 0.10% FOR DELHI NCR &
EXISTING LOAN CUSTOMER AND ON RENEWAL MUMBAI-75000,
UPTO RS. 1CRORE OTHER-50000/--
2 DEWAN HOUSING FINANCE CORPORATION LTD 13M=7.80% 14M=7.80% 18M=7.85% 13M=50000; 40M=7.90%0.25% EXTRA FOR SR. CITIZEN,WIDOW,
14M=10000; ARMED, PERSONNEL, EXISTING DHFL HOME
BORROWERS, 0.25% EXTRA FOR DEPOSIT
50 LAC AND ABOVE
3 DEWAN HOUSING FINANCE CORPORATION LTD (AASHRAY) 7.75 - 7.80 7.85 - 8.00 - 8.00 10,000/-
4 GRUH FINANCE LTD. 7.25 13M=7.25 7.50 7.50 - 7.50 7.50 7.50 96-120M=8.00%; 0.25% FOR FEMALE, 1000/-
SR. CITIZEN & TRUST
5 HDFC PREMIUM DEPOSIT FOR INDIVIUAL (UPTO RS. 2 CR.) 15M=7.50 22M=7.55 30M=7.50 44M=7.55 0.25% FOR SR. CITIZEN UPTO RS. 1 CR.
20000/-, 40000/-
- -6 20M=7.40 40M=7.40 - - - IN MONTHLY
7 HDFC LTD FOR INDIVIDUAL & TRUST (UPTO RS.5 CR.) 7.40 - 7.40 7.40 - 7.40 7.40 - 0.25% FOR SR. CITIZEN UPTO RS. 1 CR.
8 HUDCO LTD.(IND & HUF) 7.00 - 7.00 7.00 - 6.75 6.75 6.75 0.25% FOR SR. CITIZEN 10000/-
9 HUDCO LTD.(TRUST/CO/INSTITUTION) 6.75 - 6.75 6.75 - 6.50 6.50 6.50 - 10000/-
10 J K Lakshmi Cement Ltd. 8.50 8.75 9.00 25000/-
11 J K Tyre & Industies Ltd. 8.50 8.75 9.00 25000/-
12 KTDFC (Kerela Transport) 8.50 - 8.50 8.50 - 8.25 8.25 - 0.25% extra for Sr. Citizen, 10000/-
13 LIC HOUSING FINANCE LTD.(UPTO RS. 5 CR.) till 24 Jan'17 7.30 7.35 7.50 7.50 - - 7.50 - 10000/-
15 M&M FINANCIAL SERVICES LTD (FOR BELOW RS. 1 CRORE) 7.50 7.50 7.50 7.55 - 7.55 7.55 - 0.25% FOR SR. CITIZEN 10000/-
16 Omaxe Ltd. 11.50 - 12.00 12.50 - - - - - 50000/-
17 PNB HOUSING FINANCE LTD.(UPTO RS. 5 CR.) 7.25 - 7.25 7.25 - 7.25 7.25 7.25 0.25% EXTRA FOR SR. CITIZEN UPTO RS.1 CRORE20000/-
18 PNB HOUSING FINANCE LTD.(UPTO RS. 5 CR.) 15M=7.35 22M=7.40 44M=7.40 0.25% FOR SR. CITIZEN30M=7.35
19 SHRIRAM TRANSPORT FINANCE-UNNATI SCHEME 7.75 - 7.85 8.00 - 8.15 8.25 - 0.25% FOR SR. CITIZEN 5000/-
20 SHRIRAM CITY UNION SCHEME 7.75 - 7.85 8.00 - 8.15 8.25 - 0.25% FOR SR. CITIZEN 5000/
(FOR TRUST ONLY) (FOR WOMEN ONLY)
0.50% add. interest to sr. citizen ,
employees,shareholders and person
investing Rs. 5 lacs and above - max. 0.50%
0.25% FOR SR.CITIZEN IF APP ABOVE
RS. 50,000/- APP UPTO RS. 50,000/- &
0.10% IF APP upto Rs. 50,000/-
HDFC PREMIUM DEPOSIT FOR TRUST & INSTITUTION
(UPTO RS. 10 CR.)
16
MUTUAL FUND
INDUSTRY & FUND UPDATE
ICICI Pru Mutual Fund introduces Fixed Maturity Plan-Series 80-1150 Days Plan N
ICICI Prudential Mutual Fund has launched the ICICI Prudential Fixed Maturity Plan-Series 80-1150 Days Plan N, a close ended income scheme. The NFO opens for
subscription on March 02, 2017 and closes on March 13, 2017. The investment objective of the scheme is to generate income by investing in a portfolio of fixed
income securities/ debt instruments maturing on or before the maturity of the Scheme.
SBI Mutual Fund introduces Debt Fund Series B-48 (91 Days)
SBI Mutual Fund has launched the SBI Debt Fund Series B-48 (91 Days), a close ended income scheme. The NFO opens for subscription on February 27, 2017 and
closes on March 13, 2017. The investment objective of the scheme is to provide regular income and capital growth with limited interest rate risk to the investors
through investments in a portfolio comprising of debt instruments such as Government Securities, PSU & Corporate Bonds and Money Market Instruments
maturing on or before the maturity of the scheme.
UTI Mutual Fund files offers document for Nifty Next 50 Exchange Traded Fund
UTI Mutual Fund has filed offer document with SEBI to launch an open ended Exchange Traded Fund scheme as “UTI-Nifty Next 50 Exchange Traded Fund (UTI-
Nifty Next 50 ETF)”. The New Fund Offer price is Rs 10 per unit. The investment objective of the scheme is to provide returns that, before expenses, closely
correspond to the total returns of the securities as represented by the underlying index, subject to tracking error.
DHFL Pramerica Mutual Fund introduces Dual Advantage Fund-Series 1
DHFL Pramerica Mutual Fund has launched the DHFL Pramerica Dual Advantage Fund-Series 1, a close ended income scheme. The NFO opens for subscription on
March 06, 2017 and closes on March 16, 2017. The investment objective of the scheme is to generate income by investing in fixed income securities maturing on
or before the date of the maturity of the Scheme and to generate capital appreciation by investing in equity and equity related instruments.
Mirae Asset Mutual Fund introduces Dynamic Bond Fund
Mirae Asset Mutual Fund has launched the Mirae Asset Dynamic Bond Fund, an open ended income scheme. The NFO opens for subscription on March 03, 2017 and
closes on March 17, 2017. The investment objective of the scheme is to generate optimal returns through active management of a portfolio of debt and money
market instruments.
Mirae Asset launches Mirae Asset Dynamic Bond Fund
Mirae Asset has announced the launch of its Mirae Asset Dynamic Bond Fund (MADBF), an open-ended income scheme to expand its product offerings in debt
category. Dynamic bonds funds, as the name suggest, dynamically alter allocations between long-term and short-term bonds to take advantage of the direction
of interest rates. These funds are available at attractive valuation. However, investors should not put lumpsum in such funds; instead, they should invest through
SIPs just as they do in equity funds. This will help investors safeguard their investments from interest rates volatility. Also, this strategy will help earn stable
returns along with benefits of rupee cost averaging. The returns in such funds are influenced by the interest rate movement and maturity period of debt
instruments. This is the third fixed income fund from the fund house. Mirae Asset has Assets under Management (AUM) of Rs 6343 as on December 2016 of which Rs
480 crore is in debt funds.
NEW FUND OFFER
Scheme Name Sundaram Long Term Micro Cap Tax Advantage Fund - Sr. - IV - Reg. (G
Fund Type Close-Ended
Fund Class Growth
Opens on 27-Sep-2016
Closes on 20-Mar-2017
Investment Objective To generate capital appreciation over a period of ten years by predominantly investing in equity and equity-related instruments
of companies that can be termed as micro-cap and from income tax benefit available.
Min. Investment Rs.5000/-
Fund Manager S Krishnakumar / Dwijendra Srivastava
17

Note: Indicative corpus are including Growth & Dividend option. The above mentioned data is on the basis of 09/03/2017Beta, Sharpe and Standard Deviation are calculated on the basis of period: 1 year, frequency: Weekly Friday, RF: 7%
MUTUAL FUND Performance Charts
Returns (%) Risk Market Cap (%)
Scheme Name NAV Launch QAAUM 3M 6M 1Y 3Y Since Std.Dev Beta Jenson LARGE MID SMALL DEBT &
(`) Date (` Cr.) Launch CAP CAP CAP OTHER
Mirae Asset Tax Saver Fund - Reg - G 12.92 28-Dec-2015 140.36 9.94 6.80 37.04 N.A 23.88 2.18 0.93 0.21 66.28 25.33 2.12 6.27
Motilal Oswal MOSt Focused Long Term F - Reg - G 13.95 21-Jan-2015 207.49 8.68 7.56 34.70 N.A 16.91 2.16 0.84 0.22 63.95 32.53 N.A 3.52
HDFC Taxsaver - Growth 447.21 13-Jun-1996 5266.20 7.39 5.23 33.16 19.22 27.17 2.44 1.03 0.08 71.34 21.19 2.18 5.29
DSP BlackRock Tax Saver Fund - Growth 39.27 18-Jan-2007 1461.32 7.05 1.50 31.33 23.74 14.43 2.13 0.90 0.16 71.77 20.45 2.73 5.05
HDFC Long Term Advantage Fund - G 283.10 02-Jan-2001 1234.78 7.97 4.51 30.99 18.27 22.93 2.09 0.91 0.12 58.85 22.43 8.25 10.46
Principal Tax Savings Fund 166.79 31-Mar-1996 277.86 9.03 1.71 30.93 21.23 16.64 2.44 1.05 0.14 54.21 35.41 4.72 5.67
Sundaram Taxsaver - (Open Ended F) - Reg - G 86.94 22-Nov-1999 1331.58 9.31 2.05 30.67 20.56 17.92 2.31 0.98 0.14 48.00 43.87 1.87 6.26
TAX (Diversified) Due to their inherent long term nature, the following 3 categories have been sorted on the basis of 1 year returns
Returns (%) Risk Market Cap (%)
Scheme Name NAV Launch QAAUM 3M 6M 1Y 3Y Since Std.Dev Beta Jenson LARGE MID SMALL DEBT &
(`) Date (` Cr.) Launch CAP CAP CAP OTHER
SBI Magnum COMMA Fund - Growth 33.45 08-Aug-2005 238.47 7.79 13.50 51.87 22.39 10.98 2.46 0.92 0.29 63.21 23.60 9.35 3.84
L&T Emerging Businesses Fund - Reg - G 19.87 12-May-2014 366.27 12.19 10.61 47.14 -- 27.48 2.39 0.86 0.27 N.A 64.68 25.96 9.36
Tata Equity P/E Fund - Reg - Growth 111.82 29-Jun-2004 673.56 9.08 7.97 42.73 28.23 20.93 2.26 0.92 0.18 49.59 40.44 3.43 6.55
Sundaram Rural India Fund - Reg - G 35.34 12-May-2006 533.08 8.75 3.46 40.75 27.05 12.36 2.20 0.89 0.29 36.77 39.71 9.55 13.97
DSP BlackRock Micro Cap Fund - Reg - G 54.49 14-Jun-2007 4115.12 8.53 6.90 40.08 41.56 19.01 2.48 0.91 0.32 0.57 61.69 28.95 8.78
SBI PSU Fund - Growth 11.29 07-Jul-2010 178.54 4.32 11.18 39.89 16.31 1.83 2.64 1.00 0.14 70.90 27.21 N.A 1.89
DSP BlackRock Small and Midcap F - Reg - G 46.45 14-Nov-2006 2458.09 9.26 4.60 39.27 31.03 16.04 2.39 0.91 0.21 14.05 70.19 8.41 7.35
EQUITY (Diversified) Due to their inherent long term nature, the following 3 categories have been sorted on the basis of 1 year returns
Annualised
Returns (%) RiskAverage Yield till
Scheme Name NAV Launch QAAUM Since Std. SharpeMaturity (Years) Maturity
1W 2W 1M 6M 1Y 3Y(`) Date (`Cr.) Launch Dev.
ICICI Prudential LTP - Growth 19.96 20-Jan-2010 1716.18 -8.55 -5.97 -4.69 6.11 14.69 12.69 10.17 32.52 0.07 3080.61 7.32
Canara Robeco Dynamic Bond Fund - Reg - G 18.64 29-May-2009 239.14 -4.00 -0.38 -0.68 7.52 14.23 11.06 8.33 29.63 0.05 1518.80 6.59
SBI Dynamic Bond Fund - Growth 20.35 09-Feb-2004 2981.07 -11.58 -3.17 2.35 8.87 14.15 10.79 5.58 27.39 0.07 3149.95 6.39
UTI Dynamic Bond Fund - Reg - Growth 18.89 23-Jun-2010 1198.74 -1.99 2.21 2.66 9.84 14.14 11.46 9.94 28.63 0.08 2168.11 6.66
ICICI Prudential Income Fund -Growth 51.15 09-Jul-1998 2794.50 -10.37 -7.03 -6.18 4.03 13.63 11.44 9.13 33.41 0.04 4095.30 7.56
UTI Bond Fund - Growth 49.15 04-May-1998 2289.32 -4.91 1.02 2.63 8.19 13.01 11.32 8.81 28.77 0.05 2474.70 6.89
ICICI Prudential Dynamic Bond F - Prem Plus - G 19.10 14-Jan-2010 1473.12 -9.64 -8.30 -4.82 5.34 12.77 12.13 9.47 24.09 0.12 2569.61 7.53
INCOME FUND
Returns (%) Risk Average Yield tillScheme Name NAV Launch QAAUM Since Std. Sharpe Maturity (Years) Maturity
1W 2W 1M 6M 1Y 3Y(`) Date (`Cr.) Launch Dev.
Franklin India STIP - Growth 3362.21 31-Jan-2002 7963.59 -4.01 2.55 8.08 9.39 10.77 9.70 8.35 13.24 0.09 631.45 10.22
L&T Short Term Income Fund - Reg - G 17.28 04-Dec-2010 477.15 -2.05 3.35 7.45 9.19 10.30 9.73 9.12 6.96 0.31 598.60 8.69
Baroda Pioneer Short Term Bond Fund - G 17.15 30-Jun-2010 420.66 3.53 5.21 10.33 8.88 10.12 9.45 8.39 5.17 0.34 416.90 7.98
BOI AXA Short Term Income Fund - Reg - G 17.79 10-Dec-08 230.91 3.34 5.79 7.44 8.40 9.85 9.36 7.25 8.16 0.22 1058.50 8.34
HDFC Short Term Plan - Growth 32.22 28-Feb-2002 3777.47 -2.30 1.76 6.08 8.23 9.94 10.08 8.09 6.93 0.31 657.00 8.39
DHFL Pramerica Short Maturity Fund - G 29.55 21-Jan-2003 1594.76 -4.64 -0.61 4.75 7.57 9.78 9.48 7.96 8.55 0.18 890.60 8.06
Kotak Income Opportunities Fund - Reg - G 17.78 11-May-2010 2905.60 -6.33 -0.21 4.06 7.47 10.14 9.98 8.79 9.37 0.23 1040.25 8.45
SHORT TERM FUND Due to their inherent short term nature, Short term funds have been sorted on the basis of 6month returns
Annualised
Returns (%) Risk Market Cap (%)
Scheme Name NAV Launch QAAUM 3M 6M 1Y 3Y Since Std.Dev Jenson LARGE MID SMALL DEBT &
(`) Date (` Cr.) Launch CAP CAP CAP OTHER
HDFC Prudence Fund - Growth 439.65 01-Feb-1994 14228.00 4.10 3.95 29.10 20.04 19.13 2.06 0.11 47.02 15.75 9.62 27.61
ICICI Prudential Balanced - Growth 111.88 03-Nov-1999 4394.87 5.67 5.64 28.10 20.53 14.93 1.64 0.12 51.76 12.85 1.25 34.14
Kotak Balance - Growth 21.73 05-Nov-2014 531.57 5.68 3.15 24.40 N.A 9.14 1.61 0.11 35.69 26.31 4.15 33.84
UTI Balanced Fund - Growth 148.05 20-Jan-1995 1694.80 5.85 3.15 24.22 15.78 15.99 1.60 0.08 45.67 23.77 2.63 27.94
HDFC Balanced Fund - Growth 126.69 11-Sep-2000 7930.16 4.71 2.92 23.92 20.53 16.63 1.59 0.09 43.62 22.43 1.02 32.93
DSP BlackRock Balanced Fund - Growth 126.99 27-May-1999 2298.09 4.80 0.62 23.49 20.29 15.35 1.77 0.11 49.97 20.83 2.38 26.82
Mirae Asset Prudence Fund - Reg - G 11.65 29-Jul-2015 327.97 6.81 3.42 22.84 N.A 9.93 1.63 0.09 67.83 4.48 N.A 27.69
BALANCED
18
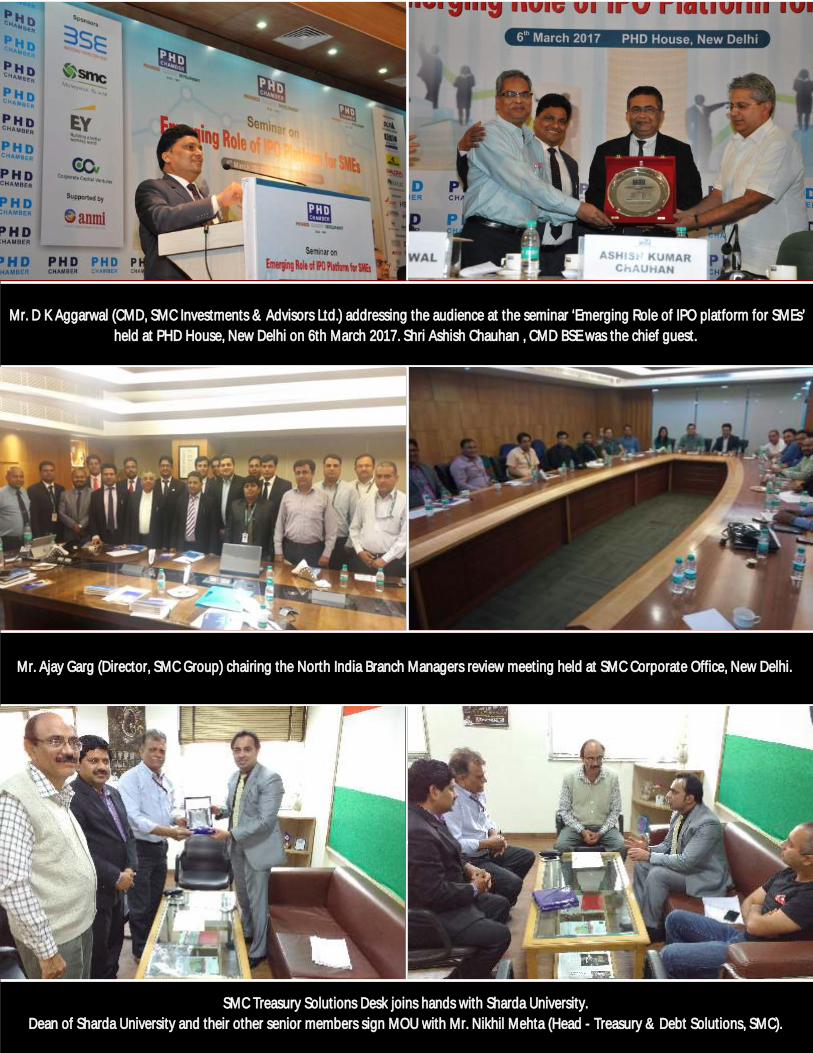
Mr. Ajay Garg (Director, SMC Group) chairing the North India Branch Managers review meeting held at SMC Corporate Office, New Delhi.
Mr. D K Aggarwal (CMD, SMC Investments & Advisors Ltd.) addressing the audience at the seminar ‘Emerging Role of IPO platform for SMEs’
held at PHD House, New Delhi on 6th March 2017. Shri Ashish Chauhan , CMD BSE was the chief guest.
SMC Treasury Solutions Desk joins hands with Sharda University.
Dean of Sharda University and their other senior members sign MOU with Mr. Nikhil Mehta (Head - Treasury & Debt Solutions, SMC).