
WISCONSIN TORNADO OUTBREAK OF 18 AUGUST … · WISCONSIN TORNADO OUTBREAK OF 18 AUGUST 2005: AN...
15
WISCONSIN TORNADO OUTBREAK OF 18 AUGUST 2005: AN EXAMINATION OF THE VIOLA, WISCONSIN TORNADO Charles D. Koch University of Wisconsin – Madison AOS 453: Mesoscale Meteorology Professor Greg Tripoli 13 May 2007 ABSTRACT On the afternoon of 18 August 2005, the largest single day tornado outbreak in Wisconsin history unfolded to the surprise of many people. This tornado outbreak spawned 27 total tornadoes, including an F2 that struck the village of Viola, Wisconsin and an F3 that hit the city of Stoughton, Wisconsin. This case focuses on the former of the above mentioned tornadoes. The tornado that struck Viola, Wisconsin touched the lives of many and miraculously nobody was injured or killed despite the millions of dollars of damage done.
Transcript of WISCONSIN TORNADO OUTBREAK OF 18 AUGUST … · WISCONSIN TORNADO OUTBREAK OF 18 AUGUST 2005: AN...
WISCONSIN TORNADO OUTBREAK OF 18 AUGUST 2005: AN EXAMINATION OF
THE VIOLA, WISCONSIN TORNADO
Charles D. Koch
University of Wisconsin – Madison
AOS 453: Mesoscale Meteorology
Professor Greg Tripoli
13 May 2007
ABSTRACT
On the afternoon of 18 August 2005, the largest single day tornado
outbreak in Wisconsin history unfolded to the surprise of many people.
This tornado outbreak spawned 27 total tornadoes, including an F2 that
struck the village of Viola, Wisconsin and an F3 that hit the city of
Stoughton, Wisconsin. This case focuses on the former of the above
mentioned tornadoes. The tornado that struck Viola, Wisconsin touched
the lives of many and miraculously nobody was injured or killed despite
the millions of dollars of damage done.

I. INTRODUCTION
At around 2030Z on 18 August
2005, a squall line associated with a low
pressure system and cold front produced an
isolated supercell that would later move into
the village of Viola, Wisconsin less than 45
minutes later. This tornado, officially rated
an F2 by the National Weather Service,
created 3.6 million dollars in total damage
and permanently scarred the rural
community by destroying thousands of trees
and damaging hundreds of homes and
structures. Although there was no advanced
warning, no injuries or loss of life were
reported. This tornado was the first
significant tornado that was produced that
day by this system. In all, 27 tornadoes were
reported, including an F3 tornado in Dane
County that took one life. This case looks to
examine the mechanisms that were in place
that created the first tornadoes in Vernon
and Richland Counties in southwest
Wisconsin.
II. DATA AND METHODS
Various software suites and
programs were used to analyze various data
for this case. GEMPAK was utilized to
analyze upper air data from the RUC and
ETA models. GARP was also used to
analyze upper air data in addition to surface
observations, level II and III radar data and
satellite data from the NOAA GOES East
imager. The visible, water vapor and 10.7
infrared channel were selected for use from
the GOES East imager for their significance
in this case. The software program IDV
(Integrated Data Viewer) was also used to
examine level II NEXRAD reflectivity and
velocity data from the NWS WSR-88D
radar in La Crosse, Wisconsin (KARX) and
Davenport, Iowa (KDVN) as well as
satellite imagery from GOES East. In
addition to analysis from software programs,
the National Weather Service, National
Climatic Data Center and Storm Prediction
Center archives were all accessed for surface
analysis, storm reports and watch and
warning products.
III. SYNOPTIC OVERVIEW
Surface analysis at 0900Z, 18 August
2005 indicated a developing surface low
pressure center over eastern South Dakota
with an associated trough extending through
the Panhandle region of Texas and
Oklahoma. At 12Z, the low pressure center
had moved into northwestern Iowa and a
surface warm front was established,
stretching from the low pressure center of
1003 millibars, across the state and
extending into portions of north central
Illinois. The low pressure center continued
to move northeastward into southern
Minnesota at 15Z and a cold front was
beginning to develop over western Iowa and
eastern Nebraska. By 18Z, the low pressure
center had moved into southeastern
Minnesota and the frontal structure became
more defined. The warm sector of the storm,
located in east central Iowa, was defined by
temperatures in the mid 80’s with dewpoints
in the low to mid 70’s. The low continued to
move to the east northeast and deepened to
1002 millibars by 21Z [Figure 1]. The low
was centered near La Crosse, Wisconsin and
the warm front had moved through
southwest and south central Wisconsin,

Figure 1: North Central surface analysis from the National Weather Service for 18 August 2005. Times shown; 12Z
(upper left), 15Z (upper right), 18Z (lower left) and 21Z (lower right). Analysis shows developing frontal low
pressure system and evolution.
bringing warm temperatures in the mid 80’s
and dewpoints in the mid 70’s. The cold
front at this time extended from the low
pressure center through central Iowa where
it became a stationary front extending
through central Kansas. South to southwest
winds were observed ahead of the storm in
the warm sector, while northwesterly winds
were observed behind the cold front. The
southerly winds ahead of the system
provided for surface moisture transport in to
southwest Wisconsin, as some dewpoint
observations over eastern Iowa were in the
upper 70’s after the passing of the surface
warm front [Figure 2]. The wind shift
appeared to be the greatest change
associated with the cold front, as
temperatures ranged in the low 80’s over
Iowa with a slight dewpoint drop as well.
The 850 millibar analysis showed an
area of strong temperature advection over
Iowa stretching into southwest Wisconsin at
12Z. This advection was at the base of a
geopotential minimum extending from the
prairie provinces of Canada southeastward
into northern Iowa. By 18Z the geopotential
field had a local minimum associated with
the surface low pressure over southern
Minnesota. Winds at this level were also out
of the southwest and much stronger than at
the surface, indicating the presence of
vertical speed shear and weak directional
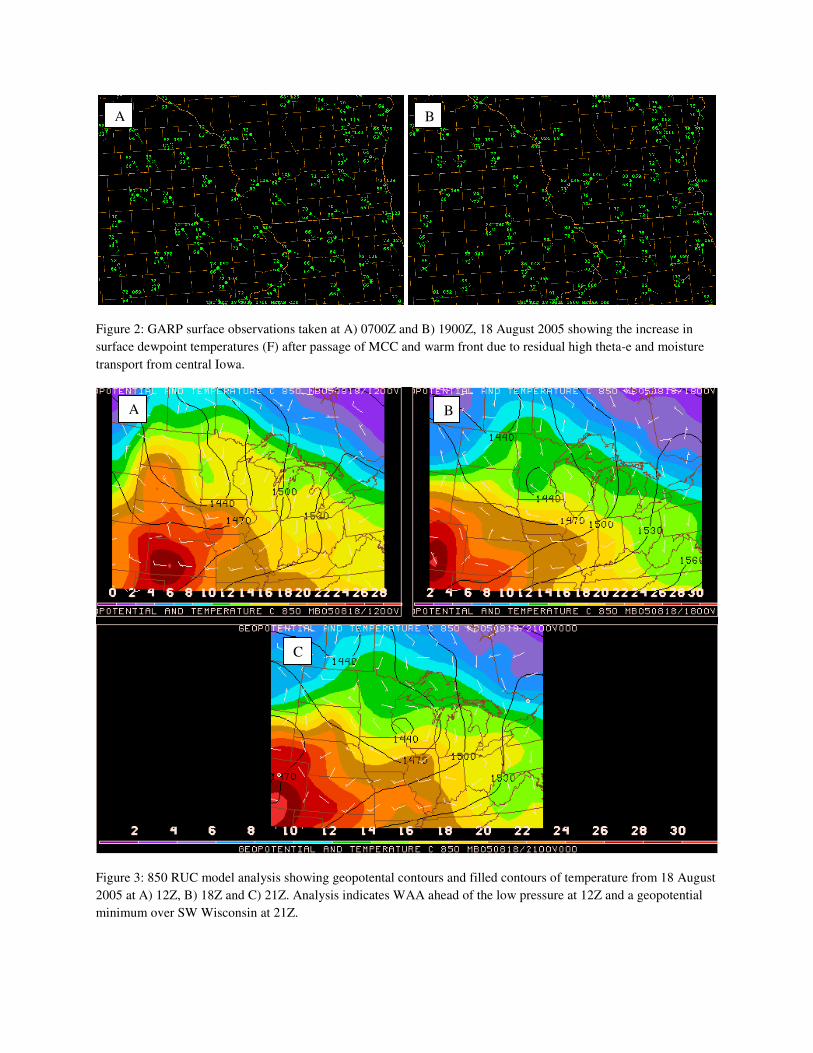
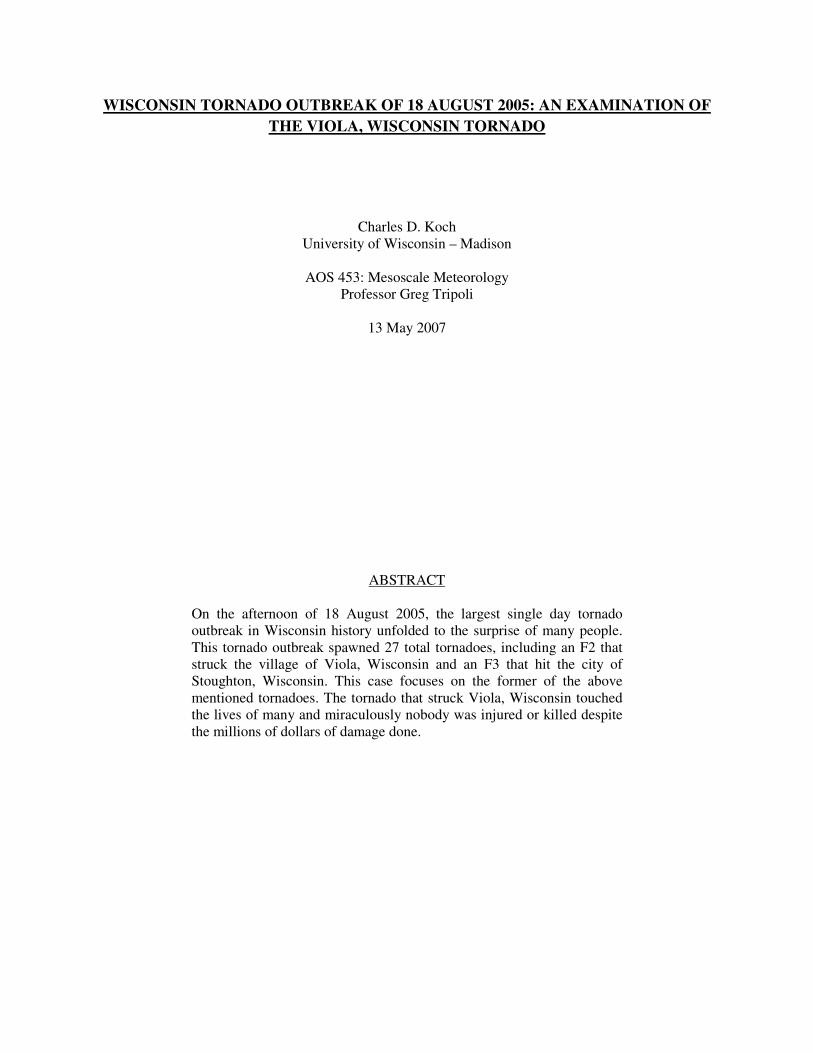
Figure 2: GARP surface observations taken at A) 0700Z and B) 1900Z, 18 August 2005 showing the increase in
surface dewpoint temperatures (F) after passage of MCC and warm front due to residual high theta-e and moisture
transport from central Iowa.
Figure 3: 850 RUC model analysis showing geopotental contours and filled contours of temperature from 18 August
2005 at A) 12Z, B) 18Z and C) 21Z. Analysis indicates WAA ahead of the low pressure at 12Z and a geopotential
minimum over SW Wisconsin at 21Z.
A B
A B
C

shear over portions of south central
Wisconsin, where surface winds were out of
the south to southeast. At 21Z the
geopotential minimum had pressed into far
western Wisconsin with the associated warm
air advection occurring farther to the east,
over southeast Wisconsin as well as over
Lake Michigan [Figure 3].
A shortwave trough was identified at 700
millibars and was echoed in the 500 millibar
analysis. The shortwave was positioned over
eastern South Dakota at 09Z and was
associated with a strong vorticity maximum.
The vorticity maximum and shortwave
progressed to the east without losing
intensity and was positioned over central
Minnesota at 15Z. The shortwave and
vorticity maximum were positioned slightly
to the west of the surface low indicating a
slight westward tilt with height of the
system, indicating that the system was not
weakening and possibly was strengthening.
By18Z, about the time thunderstorm
initiation that produced the first tornadoes,
the vorticity maximum had weakened
slightly and elongated over eastern
Minnesota and western Wisconsin. The
main axis of curvature, however, was
located along a line from Minneapolis,
Minnesota southeastward to Peoria, Illinois.
At 21Z, the vorticity maximum had re-
strengthened and the base of the shortwave
had moved into extreme western Wisconsin.
This ball of vorticity and associated
curvature was located over the line of
convection that spawned the tornadoes in
Vernon County around 21Z [Figure 4].
The 250 millibar level showed a southwest
to northeast oriented subtropical jet
stretching from the Rockies to central Iowa
at 12Z. The left exit region provided upper
level divergence over northern Iowa which
aided in the development of showers and
thunderstorms that moved into southwest
Wisconsin. The jet exit region pushed east
of the area of focus by 18Z, but by 21Z, the
exit region was positioned over southwest
Wisconsin where thunderstorms were
developing [Figure 5]. This provided
necessary mass divergence at upper levels to
allow for rapid and intense thunderstorm
growth below.
Along with mass column divergence
associated with the left exit region of the sub
tropical jet, the surface low and associated
fronts provided the required lift at the
surface to initiate thunderstorm development
over the area. This development was further
aided by a vorticity maximum associated
with a shortwave trough at 500 millibars and
wind shear between the surface, out of the
southwest, and at 500 millibars, out of the
west. The combination of ample moisture, a
strong lifting mechanism and positive
vorticity advection by the thermal wind at
mid levels created a synoptic situation that
was favorable for the development of
showers and thunderstorm. Why the storms
spawned so many tornadoes is a question
that cannot be answered by synoptics alone.
In order to provide insight to this question,
subtle mesoscale processes needed to be
examined.

Figure 4: 500mb geopotential and filled contours of absolute vorticity from 18 August 2005 at A) 09Z, B) 15Z, C)
18Z and D) 21Z. The reader will note positive vorticity advection over southern Wisconsin during thunderstorm
development at 18Z and 21Z.
A B
C D
IV. MESOSCALE ANALYSIS
The precursor to the severe weather
event was an MCC that developed over the
western border between Minnesota and
Iowa, and moved into the tri-state area
(southeast Minnesota, northeast Iowa and
southwest Wisconsin) by 08Z. This complex
strengthened and organized into a bow echo
that produced severe thunderstorm winds in
Lafayette County in southwest Wisconsin
around 1230Z [Figure 6].
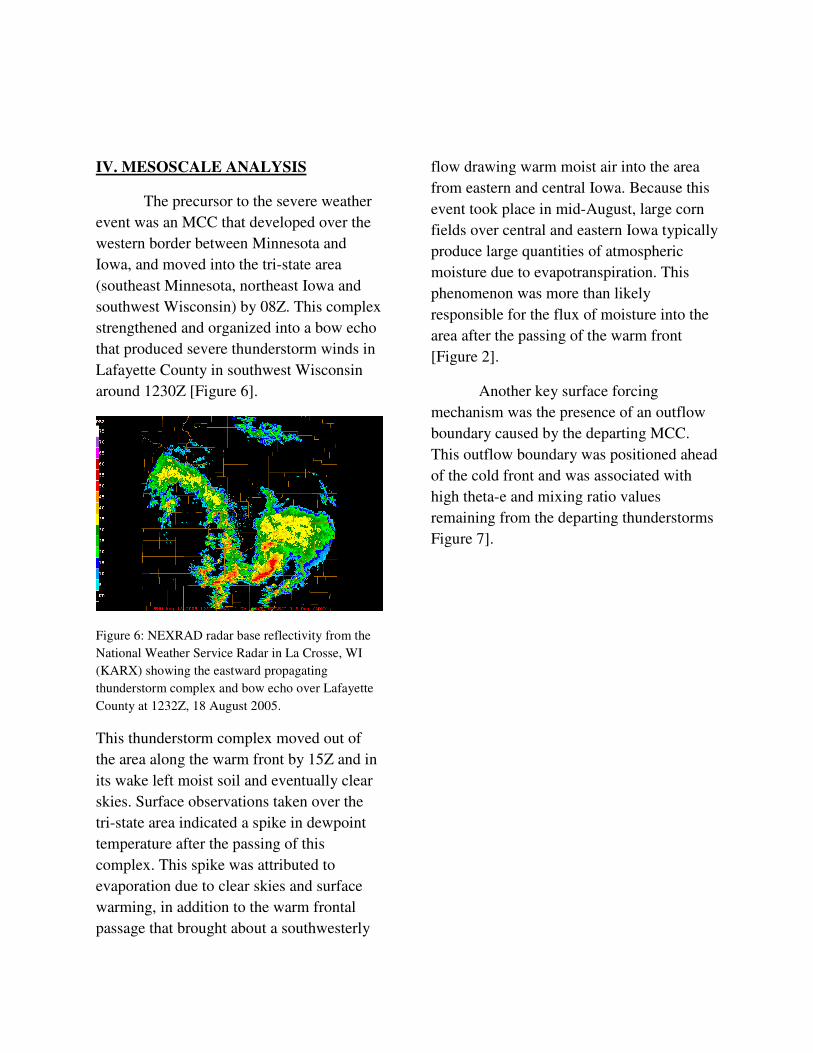
Figure 6: NEXRAD radar base reflectivity from the
National Weather Service Radar in La Crosse, WI
(KARX) showing the eastward propagating
thunderstorm complex and bow echo over Lafayette
County at 1232Z, 18 August 2005.
This thunderstorm complex moved out of
the area along the warm front by 15Z and in
its wake left moist soil and eventually clear
skies. Surface observations taken over the
tri-state area indicated a spike in dewpoint
temperature after the passing of this
complex. This spike was attributed to
evaporation due to clear skies and surface
warming, in addition to the warm frontal
passage that brought about a southwesterly
flow drawing warm moist air into the area
from eastern and central Iowa. Because this
event took place in mid-August, large corn
fields over central and eastern Iowa typically
produce large quantities of atmospheric
moisture due to evapotranspiration. This
phenomenon was more than likely
responsible for the flux of moisture into the
area after the passing of the warm front
[Figure 2].
Another key surface forcing
mechanism was the presence of an outflow
boundary caused by the departing MCC.
This outflow boundary was positioned ahead
of the cold front and was associated with
high theta-e and mixing ratio values
remaining from the departing thunderstorms
Figure 7].

Figure 7: Hand drawn cross section from Mason City, Iowa to Prairie Du Chien, Wisconsin to Madison, Wisconsin
to Milwaukee, Wisconsin at 2100Z, 18 August 2005 showing mixing ratio in the area of thunderstorm development.
Portions of this area of high theta-e and high
mixing ratio air were positioned over
Vernon and Richland Counties, precisely
where the storms became tornadic [Figure
8]. As the cold front approached, winds
from the southwest pushed the outflow
boundary and associated theta-e maximum
to the east and aligned with the cold front.
This outflow boundary also helped to
accentuate the surface convergence present
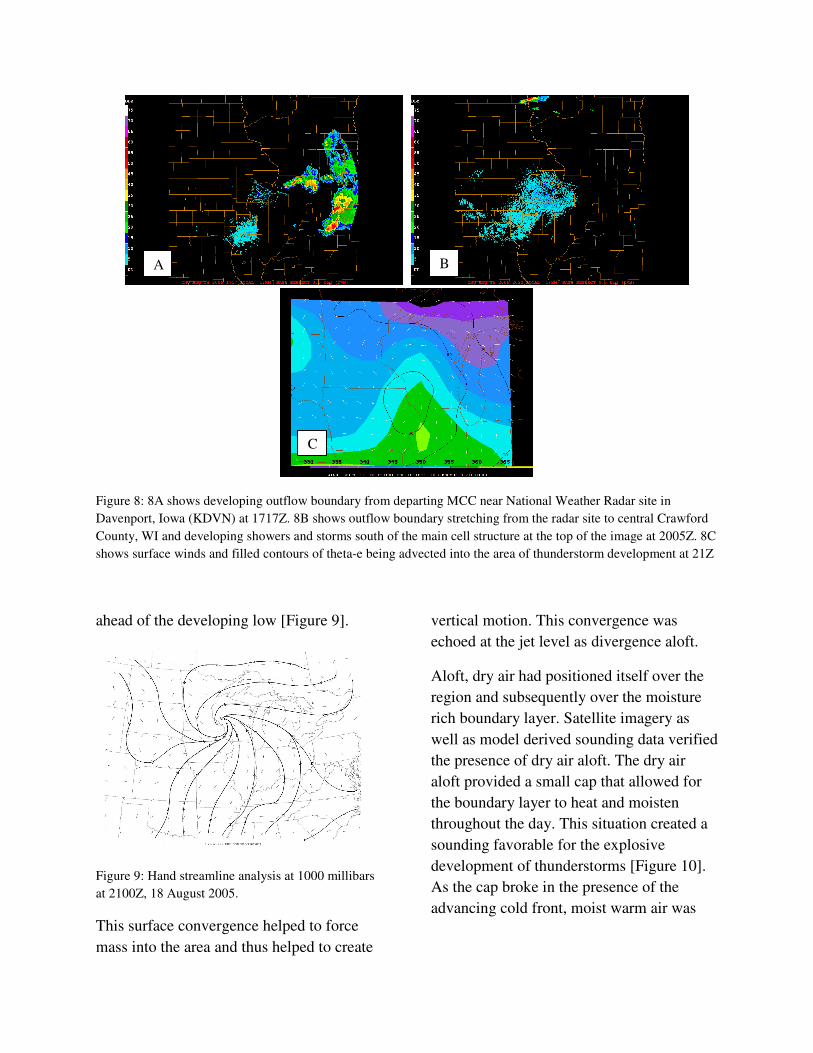
Figure 8: 8A shows developing outflow boundary from departing MCC near National Weather Radar site in
Davenport, Iowa (KDVN) at 1717Z. 8B shows outflow boundary stretching from the radar site to central Crawford
County, WI and developing showers and storms south of the main cell structure at the top of the image at 2005Z. 8C
shows surface winds and filled contours of theta-e being advected into the area of thunderstorm development at 21Z
ahead of the developing low [Figure 9].
Figure 9: Hand streamline analysis at 1000 millibars
at 2100Z, 18 August 2005.
This surface convergence helped to force
mass into the area and thus helped to create
vertical motion. This convergence was
echoed at the jet level as divergence aloft.
Aloft, dry air had positioned itself over the
region and subsequently over the moisture
rich boundary layer. Satellite imagery as
well as model derived sounding data verified
the presence of dry air aloft. The dry air
aloft provided a small cap that allowed for
the boundary layer to heat and moisten
throughout the day. This situation created a
sounding favorable for the explosive
development of thunderstorms [Figure 10].
As the cap broke in the presence of the
advancing cold front, moist warm air was
A B
C

able to convect upward explosively, creating
rapidly developing,
Figure 10: 10A) GOES East mid-level water vapor channel at 4km resolution depicting dry air at mid levels at
1845Z, 18 August 2005. RUC model derived soundings depicted at 18Z and 21Z for figures B and C respectively
showing weak cap and dry air aloft.
and rotating, thunderstorm in the presence of
directional shear at mid to low levels.
In order to produce strong, long lasting
thunderstorms, shear needed to be present at
low and mid levels. Strong speed shear was
observed over the region between surface
winds and winds at 850 millibars. Surface
winds were observed around 5 knots while
winds at 850 millibars were around 15
knots. This speed shear is critical in the
production of thunderstorms and allows for
the production of slantwise convection
necessary for maintaining an updraft and a
downdraft in a thunderstorm. This speed
shear helped form the initial pre-frontal
squall line over far southeast Minnesota that
pushed into areas of western Vernon County
Figure 11].
A B
C

Figure 11: Hand drawn conceptual model of a mid latitude squall line present in this case. The reader will note the
slantwise convection and vortex sheet.

This speed shear was also complimented by
directional shear between 850 and 500
millibars. Winds out of the west at 500
millibars and winds out of the south-
southwest at 850 provided sufficient shear
to produce rotation, in the form of a
mesocyclone, within the thunderstorms. The
mesoscale formation was critical in
preventing dynamic entrainment into the
storm which would have weakened and
killed the storm. Because there was
directional shear at mid levels, dynamic
entrainment was prevented and the
supercells that had formed were allowed to
last for a long duration.
As the thunderstorms moved into western
Wisconsin, the bow echo squall line began
to form into a singular supercell on the south
side of the line at the time a weak tornado
was reported at Esofea, Wisconsin at 2046Z.
This supercell formation was likely caused
by the vortex sheet associated with the
squall line balling up at the south end,
creating a mesocyclone. This small supercell
spawned a larger supercell to its southeast
and this cell became a right moving
supercell. This right movement was favored
by the marginal helicity values identified by
the NWS sounding from Davenport, IA at
12Z.
As the new supercell moved away from the
line, the southern end of the squall line
dissipated and the supercell became more
intense. Radar imagery began to show signs
of a hook echo or embryo curtain [Figure
12]. This indicated that the mesocyclone
associated with the thunderstorm was
drawing precipitation around the south side
of the storm. A velocity scan verified a
mesocyclone in the same vicinity as the
hook and using basic trigonometric methods,
the mesocyclone was calculated to reach
over 8800 meters up from the surface.
Located within the embryo curtain were
high values of radar reflectivity indicating
that large hail also accompanied this storm
and was indicative of a very strong updraft,
manifest in the tornado and mesocyclone.
The strength of the mesocyclone was
indicated by the long life of this supercell.
Because of the strong rotation of the
mesocyclone, an inertial wall was created
that prevented dynamic entrainment of dry
air into the storm. As the storm moved out
of the Richland County area, it weakened
leaving millions of dollars worth of damage
in its wake.

Figure 12: Figures 10 A and B show KARX base reflectivity and base velocity respectively. Blue boxed region
indicates bow echo and arrow indicates an area of strong downdraft as indicated by radar at 2006Z. Figures 10 C and
D show the same line of thunderstorms begin to spawn a right moving thunderstorm at eh south side of the line
caused by the balling of line vortex near Esofea, Wisconsin. Base reflectivity and velocity are shown respectively.
Figures 10 E and F show mature hook echo with hail core positioned over La Farge, Wisconsin indicating
reflectivity upwards of 60dBz and a strong mesocyclone with velocity scale folding near Viola, Wisconsin
respectively.
A B
C D
E F

V. CONCLUSION
The system responsible for the
tornado that struck Viola, Wisconsin on 18
August 2005 was a developing low pressure
system associated with a mid level
shortwave and vorticity maximum. This
system created a MCC that moved over the
area during the early morning hours of 18
August. This complex provided an outflow
boundary for lift and high moisture content
at the surface. Dry air aloft provided a weak
cap that allowed the surface to heat due to
daytime heating, and to moisten due to
southwesterly winds transporting moisture
into the area. Once primed, the combination
of the cold front and outflow boundary
provided the necessary force to break the
weak cap and produce strong rapidly
developing thunderstorms.
As the cold front advanced to the east, a
squall line developed ahead of the front. As
the squall line moved to the east, it
encountered an area of enhanced theta-e at
the surface as well as mid level directional
shear. This allowed for the vorticity sheet
associated with the squall line to ball up at
the southern end of the line creating a
supercell thunderstorm that ravaged the
village of Viola.
Severe weather indices taken from
Davenport, Iowa, just ahead of the cold front
at 00Z, 19 August indicated surface based
CAPE values near 3000 with CIN values of
-13. In addition to the favorable
thermodynamic values, helicity at 18Z was
at 206, indicating strong shear in the
environment. Because the ingredients for
tornadic thunderstorms were marginal, few
people saw the outbreak that materialized
coming. In fact, the supercell that created
the tornado in Viola was not issued a
warning for until after the tornado had
struck the village by the National Weather
Service in La Crosse, Wisconsin.
Overall, the tornado that struck Viola,
Wisconsin came as a surprise to forecasters
and citizens alike. Although the tornado
caused significant damage, it was the first of
many and led forecasters downstream of this
tornado to provide warnings well in advance
of the other tornadoes that would develop
that day.

VI. ACKNOWLEDGEMENTS
My biggest thanks goes to Professor
Steve Ackerman, Mark Kulie and Pete
Pokrandt for providing me with the
necessary satellite, radar, and upper air data
necessary for this case. Another special
thank you goes to President Michael Geary
of the Village of Viola for providing me
with photos and eye witness accounts of the
tornado and damage accounts. Without these
people, this case study would have not been
possible. Thank you.
VII. REFERENCES
Cooperative Institute for Meteorological
Satellite Studies, University of Wisconsin –
Madison. Southern Wisconsin Tornado
Outbreak: 18 August 2005.
<http://cimss.ssec.wisc.edu/casestudies/2005
-08-18_dane/> 7 May 2007
Martin, Jonathan E., 2006: AOS 452: The
Frontal Cyclone, classroom lecture material.
University of Wisconsin – Madison.
Miller, Robert C., 1972: Notes on analysis
and severe-storm forecasting procedures of
the air force global weather central.
Technical Report 200 (REV), Air Weather
Service, United States Air force, 3-1 – 3-19.
Mesoscale Meteorology and Forecasting,
1986: American Meteorological Society,
Boston, MA.
National Weather Service. Tornado
Outbreak of August 18, 2005.
<http://www.crh.noaa.gov/arx/events/aug18
2005_tors.php> 6 May 2007.
Raddatz, R.L., 2005: Evidence for the
Influence of Agriculture on Weather and
Climate Through the Transformation and
Management of Vegetation.
Hydrometeorology & Arctic Laboratory;
Meteorological Service of Canada,
Environment Canada.
Storm Prediction Center. Severe
Thunderstorm Event Index.
<http://www.spc.noaa.gov/exper/archive/eve
nts/050818/index.html> 8 May 2007
Tripoli, Greg, 2007: AOS 453: Mesoscale
Meteorology, classroom lecture material.
University of Wisconsin – Madison.
University of Wyoming Department of
Atmospheric Sciences. Atmospheric
Soundings 10 April 2007.
<http://weather.uwyo.edu/upperair/sounding
.html>. 8 May 2007


