Wisconsin RN Survey · As mandated under Chapter 106.30 of the Wisconsin State Statutes since 2010,...
57
Wisconsin RN Survey 2014 Report www.wicenterfornursing.org © July 2015 Authors: Rachel Schiffman, PhD, RN, FAAN, College of Nursing University of Wisconsin-Milwaukee Susan J. Zahner, DrPH, RN, FAAN, School of Nursing University of Wisconsin-Madison Judith Westphal, PhD, RN, College of Nursing University of Wisconsin-Oshkosh Susan Breakwell, DNP, RN, APHN-BC, College of Nursing Marquette University Jeffery B. Henriques, PhD, Department of Psychology University of Wisconsin-Madison Wisconsin Center for Nursing
Transcript of Wisconsin RN Survey · As mandated under Chapter 106.30 of the Wisconsin State Statutes since 2010,...
Wisconsin RN Survey 2014 Report
www.wicenterfornursing.org© July 2015
Authors:Rachel Schiffman, PhD, RN, FAAN, College of Nursing University of Wisconsin-Milwaukee
Susan J. Zahner, DrPH, RN, FAAN, School of Nursing University of Wisconsin-Madison
Judith Westphal, PhD, RN, College of Nursing University of Wisconsin-Oshkosh
Susan Breakwell, DNP, RN, APHN-BC, College of Nursing Marquette University
Jeffery B. Henriques, PhD, Department of Psychology University of Wisconsin-Madison
Wisconsin Center for Nursing

Acknowledgements
The Wisconsin 2014 Registered Nursing Survey Report is the result of the dedicated work and
critical support of key individuals and partners who are concerned with nursing workforce
development for Wisconsin.
The Board of Directors for the Wisconsin Center for Nursing is deeply indebted to the volunteer
nurse researchers and the contributions of their respective institutions: Rachel Schiffman, PhD,
RN, FAAN, College of Nursing, University of Wisconsin-Milwaukee; Susan J. Zahner, DrPH,
RN, FAAN, School of Nursing, University of Wisconsin-Madison; Judith Westphal, PhD, RN,
College of Nursing, University of Wisconsin-Oshkosh, and Susan Breakwell, DNP, RN, APHN,
BC, College of Nursing, Marquette University. We also wish to thank Jeffery Henriques, PhD,
Department of Psychology, University of Wisconsin-Madison, who was the statistician for this
significant work. We also appreciate the formatting and editing efforts of Gina Lukaszewicz,
BS, Administrative Program Specialist and Sam Nelson, undergraduate student in Marketing, at
the College of Nursing, University of Wisconsin-Milwaukee.
We are also grateful to the Wisconsin Department of Workforce Development, without whose
assistance, our work would not be possible. This important survey yields critical information on
the status of the workforce in Wisconsin and serves as a foundation to address predicted future
nursing shortages which can impact the healthcare in our state. We are also grateful to the
Wisconsin Department of Safety and Professional Services for making the survey accessible to
the thousands of nurses in our state, and the nurses of Wisconsin for their cooperation in
responding to the survey.
Multiple partner organizations provide services to design, develop and refine the survey. In
particular, the assistance of the members of the Wisconsin Healthcare Workforce Collaborative
was critical to the initial creation of the survey design.
Finally, we would like to acknowledge and express our gratitude to the many schools and
organizations that will utilize this information to advance nursing education and practice to
assure a sufficient, competent and diverse nursing workforce for the people of Wisconsin.
The Wisconsin Center for Nursing looks forward to continued collaborative relationships to
insure a bright future for nursing in our state.
Thank you,
Carolyn Krause, PhD, RN
WCN Board President

Table of Contents
Executive Summary i. I. Introduction
A. Data Management 1 B. Organization of Report 2
II. Overview of the State of Wisconsin Registered Nurse Workforce
A. Demographics of the RN Workforce 4 B. Employment Patterns of RNs in Wisconsin 6 C. Educational Patterns of RNs in Wisconsin 10 D. Ethnic and Racial Diversity of RNs in Wisconsin 12 E. Recommendations 15
III. Registered Nurse Workforce Analyzed by Wisconsin Department of Health
Services (DHS) Regions
A. Demographics of RN Workforce 17 B. Employment status of RNs in Wisconsin DHS Regions 18 C. Patterns of Employment in Nursing 19 D. Patterns of Employment 21 E. Specialized Clinical Knowledge (2 or more years) 21 F. Educational Preparation for Nursing Practice 27 G. Future Employment Plans 28 H. Future Educational Plans 28 I. Emergency Response 30 J. Recommendations 31
IV. Advanced Practice Nurses
A. Demographics of the APN Workforce 34 B. Characteristics of APNs 35 C. APNs by Wisconsin DHS Regions 37 D. Recommendations 40
V. Leadership
A. Nurses in Leadership Roles 42 B. Nurses in Leadership Role(s) at Work 44 C. Barriers to Leadership Roles 45 D. Comparisons 46 E. Recommendations 46
Appendix A: Wisconsin Department of Health Services Regions (DHS) 49

i
Executive Summary As mandated under Chapter 106.30 of the Wisconsin State Statutes since 2010, 83,918 registered nurses (RNs) completed a survey in order to renew their RN licenses. The 2014 Wisconsin Registered Nurse Survey was the third instance of the administration of this process. The data obtained from the 2014 Wisconsin Registered Nurse Survey were analyzed by a team of nurse researchers assisted by a statistician under the auspices of the Wisconsin Center for Nursing (WCN). The results of these analyses are presented in this full report of the 2014 Wisconsin Registered Nurse Survey. Although some analyses in this full report are the same as those in the At a Glance summary, many are not since they may be based on a different sub-sample of respondents. As part of the report, 2012 Wisconsin RN data are descriptively compared with 2014 Wisconsin RN data where the comparisons are noteworthy. Findings are discussed and recommendations are identified in the context of the relevant literature and of major initiatives from professional organizations related to the future of the nursing labor force in Wisconsin.a Section I: Introduction The report is based on the 73,136 valid responses of RNs living or working in Wisconsin after exclusion criteria were applied. The five Wisconsin Department of Health Services (DHS) Regions form the basis for the regional analyses. Section II: Key Findings and Recommendations of Overall State Data
• The number of RNs who completed the survey either online or paper in 2014 is 3.3% higher than in 2012.
• Most of the RNs in Wisconsin live in the state (96.9%), are female (93.1%), and white (95.1%). • There were small gains in numbers in racial and ethnic categories; however, the percent of the
total workforce shows little change between 2012 and 2014. • Nurses in the diverse category were on average younger (42.8 years) than nurses in the non-
diverse category (47.2 years). • A higher percentage in the diverse category (9.7%) were men compared to the non-diverse
category (6.7%). • A large majority of respondents were employed (88.7%) and most of those (84.2%) were
employed in RN positions. • The least diverse work settings were ambulatory care (4.6%) and hospitals (5.6%) while the more
diverse work settings were home health (8.4%) and long term care (8.2%). • The percent of RNs who are retired was 6.3% - an increase from 5.5% in 2012. • The majority of RNs (52.8%) reported hospitals as their primary place of work. • Overall, 75.7% of RNs reported working in direct patient care. • The most frequently required clinical specialty knowledge was medical-surgical (34%) followed
by intensive care (25%) and geriatrics (20.6%). • The most frequent primary position other than in a hospital, ambulatory care or direct patient care
setting was nurse educator (23.9%), which included university, technical college or K-12 settings. • The baccalaureate degree was the highest degree in nursing reported for 44.1% of RNs.
a Workforce is defined as all those employed in a certain industry.

ii
• There are positive trends for increased education with 4.3% of respondents reporting enrollment in a baccalaureate program and another 23.5% indicating plans to pursue further education in the near future.
• The most frequent barriers to continued education were related to cost (tuition and fees – 32%; lost work time and benefits – 23.2%).
• Nurses whose first degree is the baccalaureate were younger at graduation (25 years) as compared to those with associate degrees (36 years).
• The age of obtaining a doctoral degree ranges from 40 to 50 years. Recommendations: 1. The Wisconsin Registered Nurse Survey will become an increasingly rich source of nursing
workforce information with more years of data available for identifying trends. Further analysis of the data related to demographic, workforce, and academic characteristics of the respondents is needed to extend the utility and reach of the findings. Making the data and funding available for researchers would substantively enable projection of RN workforce needs.
2. Although the trends are positive toward higher educational attainment of registered nurses, a serious gap remains between national recommendations and the current status. More funding for nursing education programs could allow higher numbers of admissions, and more funding or loan forgiveness for students could allow more willing nurses to become educated at a higher level.
3. Of particular concern is the steady state enrollment in PhD programs, as well as the still limited numbers of DNPs. The number of graduates of doctoral programs prepared to be productive faculty is too low to adequately meet the nursing education needs at the baccalaureate level given that faculty are older and many are nearing retirement. More innovative and better funded approaches to graduate nursing education are needed to assure a sufficient nursing faculty workforce.
4. A substantial gap continues between the diversity of the nursing workforce and the diversity of the state’s population. Much more effort is needed to support students of diverse backgrounds to enter nursing.
Section III: Key Findings and Recommendations of the Department of Health Services (DHS) Regional Data
• The Western region has the lowest RN to 1,000 population ratio (7.0); the Northern region has the highest (15.3).
• A lack of diversity exists across all regions. • The vast majority (> 83%) of RNs in the five regions are employed as nurses. • A small percent (approximately 2%) across the regions are unemployed but seeking work in
nursing. Other RNs work in other fields, are unemployed, or retired. • The RN workforce averages 15 years of experience and is similar across regions. • The majority of nurses (>62%) work as direct care providers in all regions. • Nurse educators (university, technical, K-12) represent between 3.8% and 4.8% of other
employment in the regions.

iii
• The most common reason for a change in employment in 2014 was promotion or career advancement, different from 2012 when the most common reason was a change in the number of hours worked.
• Fewer than 10% of nurses across the regions have secondary employment. These positions mostly require licensure as RN and average about 8 hours per week.
• About 6-7% of RNs across all regions are undecided in their intentions about working in nursing. • The top three factors across all regions for influencing a return to nursing include more or flexible
hours, welcoming work environment, and work location. These are the same as those reported in 2012.
• The percentage of nurses with a baccalaureate degree ranges from 33.7% in the Western region to 49.7% in the Southeastern region.
• The majority (>62%) of RNs across all regions do not plan to continue their education. • The enrollment of RNs in baccalaureate programs is 4 – 6% across the regions, a slight increase
(about 2%) over that reported in 2012. • Over 29,000 nurses across all regions have participated in emergency preparedness exercises. • More than half of all RNs in the regions have received training in emergency preparedness and
response.
Recommendations: 1. Since nurses holding baccalaureate degrees in nursing range from 33% to 49%, depending on the
region, a major effort will be needed to achieve the Institute of Medicine (2011) recommendation that 80% of nurses be prepared at the baccalaureate level by 2020. Increased capacity to support continued education may be necessary at the regional level. It is also important to assure flexibility in educational programs, such as online options and in scheduling from employers, to support RNs achieving additional education. Approaches by region may vary.
2. Respondents reported the cost of tuition and fees as the top barrier to education across all regions. Regional efforts to support nurses pursing additional education should include a variety of collaborative and financing options. Some employers offer tuition reimbursement for employees pursing advanced education in exchange for a commitment to work for a defined period of time in the organization. There may be regional scholarships available via professional organizations and local foundations. Loans are also available at the federal level to students through the Health Resources and Services Administration (HRSA). Creative ways to finance the cost of education for nurses may be critical to reaching the goal of 80% baccalaureate level workforce by 2020.
3. In the next 2 years over 3,000 RNs across all regions will leave positions where they provide
direct patient care. Utilize the RN workforce across all regions has, on average, 15 years of experience to provide the mentoring required by new graduates at entry to practice.
4. In 2014, a higher proportion of nurses were pursuing a DNP degree rather than a PhD degree
across all regions. This will have an impact education and practice. Defining the role of the DNP in the practice setting and in education will be necessary to support ongoing professional development. Intra-regional or cross-regional efforts may be necessary.

iv
Section IV: Key Findings and Recommendations Regarding Advanced Practice Nurses (APNs) • There were 4,417 RNs working as APNs. This is 6% of the total 2014 RN sample and is lower
than the national average of 7%. • The number of APNs increased by 258 in 2014 as compared to 2012. • The primary position for APNs was either the hospital (41.8%) or ambulatory care (38.8%). • The most frequently population of focus was family/individual across the lifespan (37.7%) or
adult/gerontology (31.2%). • Almost all APNs (n = 4,119, 93.2%) have a Master’s degree or higher. • The majority of APNs at all levels of educational preparation (62.6%) are certified as nurse
practitioners. • Almost half (47.2%) of nurse practitioners are credentialed as family nurse practitioners. • Approximately 42% of all APNs provide primary care or outpatient mental health services for an
average of 29 hours per week in primary care and 5 hours per week in direct mental health services.
• The percent of APNs with DNPs in across the DHS regions rose from 1.3-2.4% in 2012 to 2.5 -5.4% in 2014.
• The distribution of APNs across the regions is similar.
Recommendations:
1. Increase number of APNs across the state who are providing primary care by strategizing with appropriate groups/agencies/systems to create primary care NP positions.
2. Consult with the Wisconsin Association of Clinical Nurse Specialists for development of items for future surveys that better describe the CNS workforce in Wisconsin.
3. Focus efforts on regions with low proportions of APNs in all areas to meet the needs of all
Wisconsin citizens.
Section V: Key Findings and Recommendations of Regarding Nurses in Leadership Roles
• About half (50.6%) of RNs with valid responses (n = 58,072) indicated they were engaged in a leadership role.
• The most frequent category of role reported (> 43%) across the state and the DHS regions was in the work area (charge nurse, team leader, unit manager).
• Few RNs reported engagement on governance boards or in public office. • Male nurses reported a higher frequency of leadership roles on governance boards and in public
office than female nurses. • Nurses in leadership roles were most frequently in a staff nurse position. • Of those who reported no leadership role, the most frequent barrier (> 49%) in the state and across
all regions was a lack of interest; however, about 14% indicated a lack of opportunity. • Nurses in leadership roles reported working about four more hours per week than those with no
leadership role.

v
Recommendations:
1. Increase efforts to understand and ameliorate the limited diversity of nurses in leadership roles in Wisconsin in order to broaden the range of voices and ideas that contribute to meaningful and sustainable healthcare reform and better health outcomes for individuals and families.
2. Foster and track incorporation of leadership, collaboration, and “thoughtful strategist” competencies such as identified in The future of nursing: Leading change, advancing health report (IOM, 2011) among both new and experienced nurses across patient care, unit, organization, community, board, and health policy settings to ensure all nurses are practicing to the full extent of their education and training, and are fully active, contributing partners in health care delivery, policy, and system change.
3. Refine future surveys in order to better understand nurses’ perceived barriers to serving in one or
more leadership roles.
4. Identify opportunities for those nurses interested in leadership roles but who perceive limited opportunities or who may be willing to assume leadership roles when their personal circumstances change.
5. Provide meaningful data from this and future surveys to guide academic programs (such as DNP
programs), action coalitions (such as the Wisconsin Center for Nursing’s Implementation of the IOM Future of Nursing Report, the American Academy of Nursing’s Nurses on Boards Coalition, and the Robert Wood Johnson Foundation/AARP Future of Nursing Campaign for Action [Wisconsin Coalition for Action]), and health care organization-based initiatives (such as residency programs for newly licensed nurses) in their efforts to engage more, diverse, accountable, skilled nurses at healthcare leadership tables by 2020.
Following the release of this report, WCN will use this and other data to make overall recommendations to the state legislature and other stakeholders regarding the future need for registered nurses in Wisconsin.

1
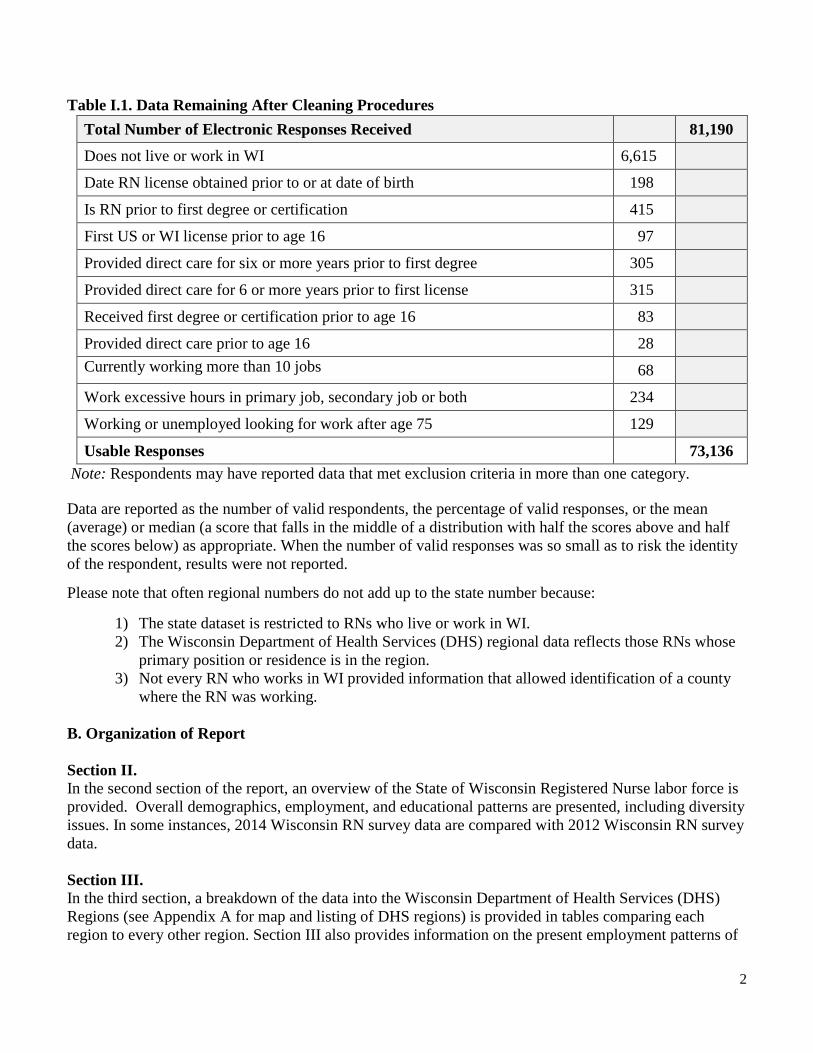
I. Introduction This report presents the findings from the 2014 Survey of Registered Nurses (RNs) in the state of Wisconsin. Mandatory biennial surveys of all RNs renewing their licenses to practice in Wisconsin were required by state statute (106.30) beginning in 2010. In 2014, a total of 83,918 RNs completed the survey either online or in paper format by February 28, 2014 with their license renewals. This report presents findings from the 73,136 RN respondents who completed the survey on-line after exclusion criteria were applied. Those completing paper surveys (n = 2,728) were not included in this report. This survey analysis is sponsored by the Wisconsin Center for Nursing in partnership with the State of Wisconsin Department of Workforce Development (DWD). Four nurse researchers (representing baccalaureate and higher degree nursing education programs in the state) and a statistician comprised the analysis team. Each signed an agreement with the Wisconsin Center for Nursing, Inc. to perform the services and maintain confidentiality of the data. The research team was given electronic access to the complete data set from DWD. If appropriate the project was reviewed by the Institutional Review Boards of the researcher’s home institution. Because this is a report that focuses on the Wisconsin RN Workforce, the analyses in this report include those registered nurses living and/or working in Wisconsin. It is recognized that many nurses maintain licensure in Wisconsin and work in Wisconsin, though they are living outside of the state. There are also a number of nurses who are living in Wisconsin and not working. Both of these groups are included in the analyses. When possible, relevant descriptive comparisons to the 2012 survey analyses are provided. Although some analyses in this full report are the same as those in the At a Glance summary, many are not since they may be based on a different sub-sample of respondents. A. Data Management Data were reviewed to identify those nurses who do not live or work in Wisconsin and questionable responses for exclusion such as dates of licensure or degree or certification receipt that are unlikely given the date of birth or working an excessive number of hours or jobs. The data that were excluded to form the final data set used for the analyses in this report are summarized in Table I.1.
2
Table I.1. Data Remaining After Cleaning Procedures Total Number of Electronic Responses Received 81,190
Does not live or work in WI 6,615
Date RN license obtained prior to or at date of birth 198
Is RN prior to first degree or certification 415
First US or WI license prior to age 16 97
Provided direct care for six or more years prior to first degree 305
Provided direct care for 6 or more years prior to first license 315
Received first degree or certification prior to age 16 83
Provided direct care prior to age 16 28 Currently working more than 10 jobs
68
Work excessive hours in primary job, secondary job or both 234
Working or unemployed looking for work after age 75 129
Usable Responses 73,136 Note: Respondents may have reported data that met exclusion criteria in more than one category. Data are reported as the number of valid respondents, the percentage of valid responses, or the mean (average) or median (a score that falls in the middle of a distribution with half the scores above and half the scores below) as appropriate. When the number of valid responses was so small as to risk the identity of the respondent, results were not reported.
Please note that often regional numbers do not add up to the state number because:
1) The state dataset is restricted to RNs who live or work in WI. 2) The Wisconsin Department of Health Services (DHS) regional data reflects those RNs whose
primary position or residence is in the region. 3) Not every RN who works in WI provided information that allowed identification of a county
where the RN was working. B. Organization of Report Section II. In the second section of the report, an overview of the State of Wisconsin Registered Nurse labor force is provided. Overall demographics, employment, and educational patterns are presented, including diversity issues. In some instances, 2014 Wisconsin RN survey data are compared with 2012 Wisconsin RN survey data. Section III. In the third section, a breakdown of the data into the Wisconsin Department of Health Services (DHS) Regions (see Appendix A for map and listing of DHS regions) is provided in tables comparing each region to every other region. Section III also provides information on the present employment patterns of

3
nurses in both primary and secondary positions, with special consideration to data about direct care providers currently in practice as well as probable future employment plans. Section III includes data about the present educational preparation of the RN workforce and the future educational plans of respondents. Section IV. The fourth section provides information on the advanced practice nurse (APN) workforce in Wisconsin. The questions in the 2014 survey were designed to be consistent with the definition of the Advanced Practice Nurse in the Wisconsin Administrative Code Chapter N8.04. Findings are presented for both the state and regional levels. Section V. In section five, the two questions that were added to the 2014 survey about the engagement in and barriers to leadership roles are analyzed. Findings are presented for the state and regional levels. Findings in relation to diversity, education, and work environments for those engaged in leadership roles are presented.

4
II. Overview of the State of Wisconsin Registered Nurse Workforce
In this section an overview of the RN workforce in Wisconsin is presented. First the demographic characteristics are described. This is followed by employment patterns, educational patterns, and diversity of the RN workforce. Recommendations for filling the gaps in educational attainment and diversity as well as for further analyses of the survey are provided. A. Demographics of the RN Workforce Demographic information about Wisconsin’s Registered Nurse (RN) workforce is displayed in Table II.1. These data reflect valid responses (n = 73,136) collected from Registered Nurses (RNs) who completed the 2014 survey (online version) at the time of Wisconsin license renewal. As can be determined from this table, the great majority of nurses with Wisconsin RN licenses also live in the state (96.9%). Most are female (93.1%), white (95.1%), and speak only English (89.6%). Table II.1: Demographics of RN Workforce in Wisconsin (n = 73,136) n %
Residence
Reside in Wisconsin 70,835 96.9
Reside outside Wisconsin 2,301 3.1
Gender Female 68,117 93.1
Male 5,019 6.9
Age
Median 48 years
Range 21 to 88 years
Age Distribution
Less than 25 years 1,090 1.5
25-34 years 15,569 21.3
35-44 years 15,291 20.9
45-54 years 16,695 22.8
55-64 years 18,626 25.5
65 and older 5,865 8.0
5
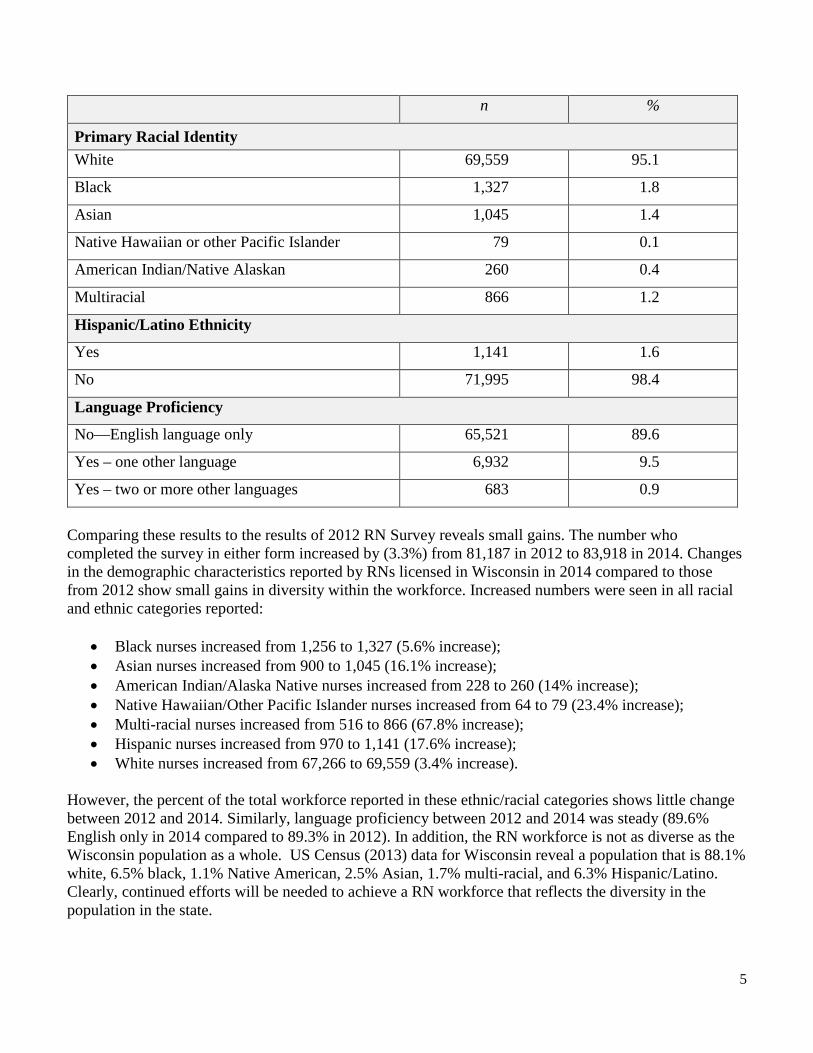
n %
Primary Racial Identity White 69,559 95.1
Black 1,327 1.8
Asian 1,045 1.4
Native Hawaiian or other Pacific Islander 79 0.1
American Indian/Native Alaskan 260 0.4
Multiracial 866 1.2
Hispanic/Latino Ethnicity
Yes 1,141 1.6
No 71,995 98.4
Language Proficiency
No—English language only 65,521 89.6
Yes – one other language 6,932 9.5
Yes – two or more other languages 683 0.9
Comparing these results to the results of 2012 RN Survey reveals small gains. The number who completed the survey in either form increased by (3.3%) from 81,187 in 2012 to 83,918 in 2014. Changes in the demographic characteristics reported by RNs licensed in Wisconsin in 2014 compared to those from 2012 show small gains in diversity within the workforce. Increased numbers were seen in all racial and ethnic categories reported:
• Black nurses increased from 1,256 to 1,327 (5.6% increase); • Asian nurses increased from 900 to 1,045 (16.1% increase); • American Indian/Alaska Native nurses increased from 228 to 260 (14% increase); • Native Hawaiian/Other Pacific Islander nurses increased from 64 to 79 (23.4% increase); • Multi-racial nurses increased from 516 to 866 (67.8% increase); • Hispanic nurses increased from 970 to 1,141 (17.6% increase); • White nurses increased from 67,266 to 69,559 (3.4% increase).
However, the percent of the total workforce reported in these ethnic/racial categories shows little change between 2012 and 2014. Similarly, language proficiency between 2012 and 2014 was steady (89.6% English only in 2014 compared to 89.3% in 2012). In addition, the RN workforce is not as diverse as the Wisconsin population as a whole. US Census (2013) data for Wisconsin reveal a population that is 88.1% white, 6.5% black, 1.1% Native American, 2.5% Asian, 1.7% multi-racial, and 6.3% Hispanic/Latino. Clearly, continued efforts will be needed to achieve a RN workforce that reflects the diversity in the population in the state.

6
B. Employment Patterns of RNs in Wisconsin Employment status
Information about the employment status of Wisconsin RNs in 2014 is displayed in Table II.2. These figures reveal that a large majority of the respondents were employed (88.7%) and were employed in RN positions (84.2%). A substantial number of retired nurses continue to hold valid RN licenses (n = 4,608). The percent of RNs who are unemployed and seeking RN work is under 2%. Table II.2. Employment Status of RNs in Wisconsin (n = 73,136) n %
Employed 64,863 88.7
Employed as an RN 61,610 84.2
Employed in health field, not nursing 2,109 2.9
Employed in another field 1,144 1.6
Not Employed 8,273 11.3
Retired 4,608 6.3
Unemployed, seeking work in nursing 1,388 1.9
Unemployed, seeking work in another field 158 0.2
Unemployed, not seeking employment 2,119 2.9
The percent of RNs employed in nursing showed little change from 2012 (84.6%) (Murray, Westphal, Acord, Schiffman, & Henriques, 2013); however the overall number of employed RNs identified through the survey rose. The percent of RNs who are retired also increased from 5.5% in 2012 to 6.3% in 2014. This increase in percentage of retired nurses has been predicted by a number of sources (Groves, 2011; Bleich, Cleary, Davis, Hatcher, Hewlett, & Hill, 2009).
Primary position characteristics Survey results by primary place of work, type of position, and type of compensation are displayed for respondents with valid responses who are employed (n = 62,405) in Table II.3. Hospitals are the largest employers of RNs with 52.5% of all RNs reporting hospitals as their primary place of work. Ambulatory care settings (17.2%) and nursing homes (10.5%) also employ large percentages of RNs. Over half (63.3%) of RNs reported working in staff nurse positions. Only 1% of RNs are employed by temporary or travel staffing agencies. Overall, 75.7% of employed RNs reported working in direct patient care. Of all RNs (n = 73,136), 26.1 % do not work in direct patient care, and 31% plan to work in direct patient care for fewer than 10 years revealing the ongoing importance of replacing nurses who move out of direct patient care positions.

7
Table II.3 Characteristics of Primary Position (n = 62,405) n %
Primary Place of Work
Hospital 32,929 52.8 Ambulatory care 10,764 17.2 Nursing home/extended care 6,578 10.5 Home health 3,663 5.9 Public health or community health 2,375 3.8 Education 1,324 2.1 Other 4,772 7.6 Primary Position Description
Staff Nurse 39,530 63.3 Nurse Manager 4,663 7.5 Case Manager 4,273 6.8 Advanced Practice Nurse 3,847 6.2 Administrator 984 1.6 Consultant/Contract 715 1.1 Nurse Executive 721 1.2 Nurse Faculty 1,245 2.0 Nurse Researcher 287 0.5 Staff, other non-medical 209 0.3 Manager, other non-medical 120 0.2 Other 5,811 9.3 Primary Position is Temporary External Pool/Travel/Staffing Placement
Yes 658 1.1
Compensation in Primary Position
Paid hourly 42,990 68.9
Paid salary 16,490 26.4

8
n %
Direct Patient Care Provider in Primary Position
Currently works providing direct patient care 47,216 75.7
Plans to work providing direct patient care a
Less than 2 years 3,518 4.8 2-4 years 7,402 10.1 5-9 years 11,711 16.0 10-19 years 14,560 19.9 20-29 years 8,840 12.1 30 or more years 7,559 10.3 Not applicable 19,546 26.7
a Calculated on total sample of n = 73,136
Specialized clinical knowledge required in primary position
The following table (Table II.4) displays the survey results of the clinical specialty knowledge areas reported by respondents as being required in their primary positions. Respondents could select more than one type of specialty knowledge required in their primary position. Overall, the most frequently reported required knowledge specialties are medical-surgical (34%), intensive care (25%), and geriatrics (20.6%).
Table II.4. Clinical Knowledge Specialty Required in Primary Position (n = 73,136) n %
Current Practice in Primary Position
Acute Care/Critical Care/Intensive Care 18,289 25.0 Adult Health 13,959 19.1 Anesthesia 1,661 2.3 Addiction/AODA/Substance Abuse 2,889 4.0 Cardiac Care 12,903 17.6 Community Health 5,537 7.6 Correctional Health 1,470 2.0 Dialysis 3,061 4.2 Emergency Care 10,156 13.9 Family Health 5,510 7.5 Geriatrics/Gerontology 15,049 20.6 Home Health 9,101 12.4

9
n %
Hospice Care/Palliative Care 8,934 12.2 Labor and Delivery 5,835 8.0 Maternal-Child Health 5,657 7.7 Medical-Surgical 24,842 34.0 Neonatal Care 4,401 6.0 Obstetrics/Gynecology 6,184 8.5 Occupational Health/Employee Health 2,326 3.2 Oncology 5,946 8.1 Pediatrics 8,378 11.5 Psychiatric/Mental Health 6,139 8.4 Public Health 3,430 4.7 Rehabilitation 5,494 7.5 Respiratory Care 3,041 4.2 School Health 2,237 3.1 Surgery/Pre-op/Post-op/PACU 11,438 15.6 Women’s Health 4,893 6.7 Other 11,386 15.6 None of the above 3,996 5.5
Note: Percents do not total 100 since respondents could select more than one category. Employment of RNs in non-clinical types of positions Table II.5 displays additional types of primary positions reported. The largest percentage of this group report being employed in education including university, technical college, and K-12 settings (23.9%). Table II.5. Employment of RNs in Other Areas (n = 6,096) n %
Nurse educator (university, technical, K-12 combined)
1,324 21.7
Call center/tele-nursing 548 9.0
Durable medical equipment/pharmaceutical sales 129 2.1
Government (other than public health or corrections)
553 9.1
Insurance company claims/benefits 695 11.4

10
n %
Non-governmental health policy, planning or professional organization
256 4.2
Self-employed/consultant 315 5.2
Other 2,276 37.3
C. Educational Patterns of RNs in Wisconsin Academic preparation Nurses are academically prepared in a variety of types of programs and at basic and advanced levels. Table II.6 displays the responses by location and type of academic degrees held by the RN respondents, plans for additional education, and barriers to obtaining additional education. Over 75% of RNs in Wisconsin earned their most recent nursing degrees in the state. The largest percent reported a baccalaureate in nursing (44.1%) as their highest degree in nursing. Adding this percent to the master’s and higher degrees reveals that 55.8% of respondents hold at least a baccalaureate degree. In addition, 3,110 (4.3%) of the respondents indicated that they were enrolled in baccalaureate programs at the time of the survey and 23.5% plan to pursue further education in the near future. These trends are positive; however, Wisconsin still has considerable progress to make if we are to realize the IOM recommendation that in 5 years (by 2020), 80% of RNs hold a baccalaureate degree in nursing (IOM, 2011). The most frequently reported barriers to pursuing additional education were cost related to tuition and fees (32%) and costs related to lost work time and benefits (23.2%). The growth in academic options for the Doctor of Nursing Practice degree can be seen when comparing the 2012 and 2014 survey results. In 2012, enrollment in the DNP was 323 (0.5%) (Murray et al., 2013). In 2014, this increased to 521 (0.7%). However, similar increases in PhD enrollment are not seen; 2012 enrollment in PhD programs was 136 (0.2%) and in 2014 enrollment was 135 (0.2%).

11
Table II.6. Educational Preparation for Nursing Practice (n = 73,136) n %
Location of Educational Preparation
Wisconsin 54,994 75.2
Not Wisconsin 18,142 24.8
Earned degree in WI and working in WI 46,481 76.8
Highest Nursing Degree
Diploma 5,723 7.8
Associate Degree 26,444 36.2
Baccalaureate Degree 32,263 44.1
Master’s Degree 8,092 11.1
Doctor of Nursing Practice (or Nursing Doctorate) 264 0.3
PhD (or Doctor of Nursing Science or other doctoral)
276 0.3
Plans for Further Education in Nursing
No plans 48,902 66.9
Currently enrolled in BSN 3,110 4.3
Currently enrolled in MS 2,053 2.8
Currently enrolled in DNP 521 0.7
Currently enrolled in PhD in Nursing 135 0.2
Currently enrolled in specialty certificate 851 1.2
Plan to pursue further education within next 2 years 17,200 23.5
Barriers to Pursuing Additional Educationa n = 51,340 Commuting distance to education program 2,563 3.5 Cost of loss of work time and benefits 16,960 23.2 Cost of tuition and fees 23,421 32.0 Family/personal reasons 7,357 10.1 Lack of flexibility in work schedule 754 1.0 Limited access to online learning or other resources 102 0.1 Schedule of educational programs offered 170 0.2 Other 2,497 3.4
a Note: respondents could check multiple barriers
12
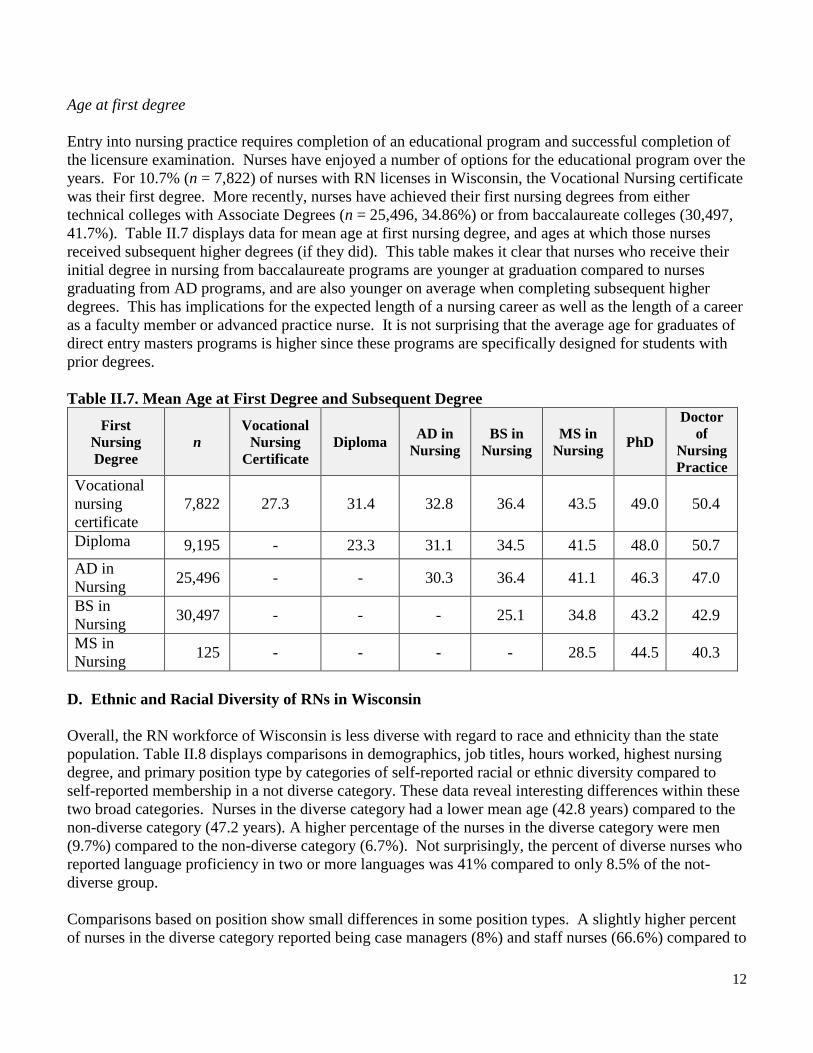
Age at first degree Entry into nursing practice requires completion of an educational program and successful completion of the licensure examination. Nurses have enjoyed a number of options for the educational program over the years. For 10.7% (n = 7,822) of nurses with RN licenses in Wisconsin, the Vocational Nursing certificate was their first degree. More recently, nurses have achieved their first nursing degrees from either technical colleges with Associate Degrees (n = 25,496, 34.86%) or from baccalaureate colleges (30,497, 41.7%). Table II.7 displays data for mean age at first nursing degree, and ages at which those nurses received subsequent higher degrees (if they did). This table makes it clear that nurses who receive their initial degree in nursing from baccalaureate programs are younger at graduation compared to nurses graduating from AD programs, and are also younger on average when completing subsequent higher degrees. This has implications for the expected length of a nursing career as well as the length of a career as a faculty member or advanced practice nurse. It is not surprising that the average age for graduates of direct entry masters programs is higher since these programs are specifically designed for students with prior degrees. Table II.7. Mean Age at First Degree and Subsequent Degree
First Nursing Degree
n Vocational
Nursing Certificate
Diploma AD in Nursing
BS in Nursing
MS in Nursing PhD
Doctor of
Nursing Practice
Vocational nursing certificate
7,822 27.3 31.4 32.8 36.4 43.5 49.0 50.4
Diploma 9,195 - 23.3 31.1 34.5 41.5 48.0 50.7 AD in Nursing 25,496 - - 30.3 36.4 41.1 46.3 47.0
BS in Nursing 30,497 - - - 25.1 34.8 43.2 42.9
MS in Nursing 125 - - - - 28.5 44.5 40.3
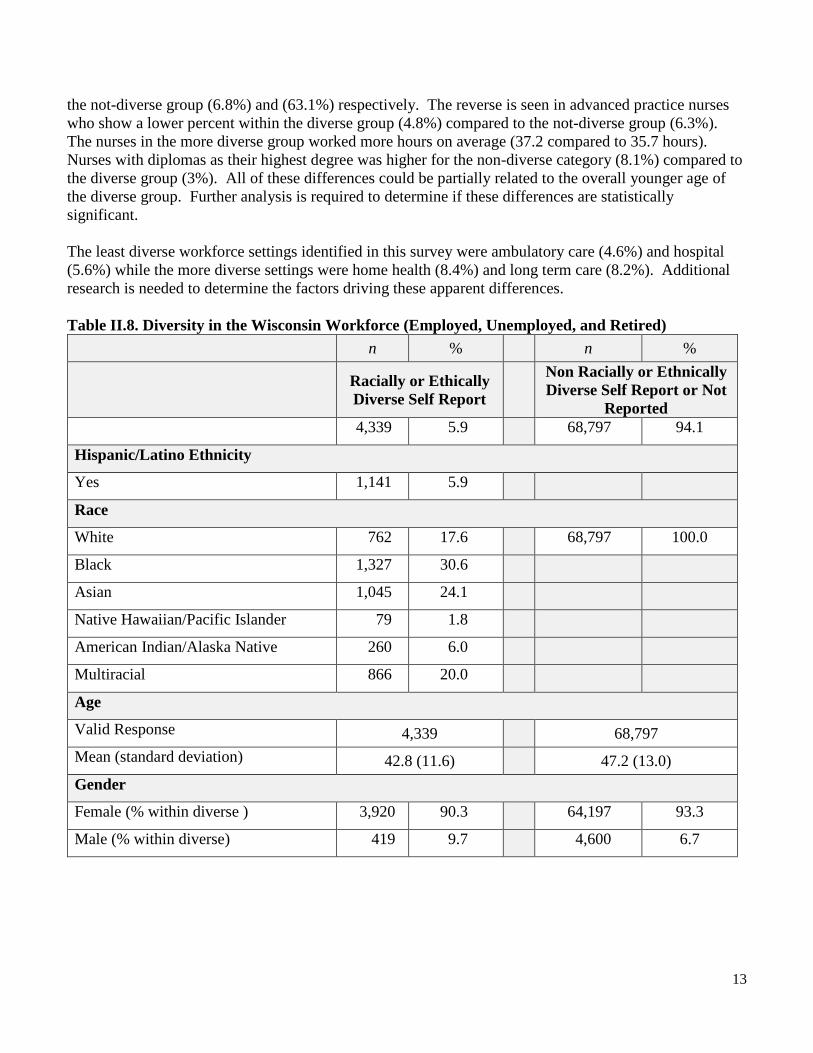
D. Ethnic and Racial Diversity of RNs in Wisconsin Overall, the RN workforce of Wisconsin is less diverse with regard to race and ethnicity than the state population. Table II.8 displays comparisons in demographics, job titles, hours worked, highest nursing degree, and primary position type by categories of self-reported racial or ethnic diversity compared to self-reported membership in a not diverse category. These data reveal interesting differences within these two broad categories. Nurses in the diverse category had a lower mean age (42.8 years) compared to the non-diverse category (47.2 years). A higher percentage of the nurses in the diverse category were men (9.7%) compared to the non-diverse category (6.7%). Not surprisingly, the percent of diverse nurses who reported language proficiency in two or more languages was 41% compared to only 8.5% of the not-diverse group. Comparisons based on position show small differences in some position types. A slightly higher percent of nurses in the diverse category reported being case managers (8%) and staff nurses (66.6%) compared to
13
the not-diverse group (6.8%) and (63.1%) respectively. The reverse is seen in advanced practice nurses who show a lower percent within the diverse group (4.8%) compared to the not-diverse group (6.3%). The nurses in the more diverse group worked more hours on average (37.2 compared to 35.7 hours). Nurses with diplomas as their highest degree was higher for the non-diverse category (8.1%) compared to the diverse group (3%). All of these differences could be partially related to the overall younger age of the diverse group. Further analysis is required to determine if these differences are statistically significant. The least diverse workforce settings identified in this survey were ambulatory care (4.6%) and hospital (5.6%) while the more diverse settings were home health (8.4%) and long term care (8.2%). Additional research is needed to determine the factors driving these apparent differences. Table II.8. Diversity in the Wisconsin Workforce (Employed, Unemployed, and Retired) n % n % Racially or Ethically
Diverse Self Report Non Racially or Ethnically Diverse Self Report or Not
Reported 4,339 5.9 68,797 94.1
Hispanic/Latino Ethnicity
Yes 1,141 5.9
Race
White 762 17.6 68,797 100.0
Black 1,327 30.6
Asian 1,045 24.1
Native Hawaiian/Pacific Islander 79 1.8
American Indian/Alaska Native 260 6.0
Multiracial 866 20.0
Age
Valid Response 4,339 68,797 Mean (standard deviation) 42.8 (11.6) 47.2 (13.0) Gender
Female (% within diverse ) 3,920 90.3 64,197 93.3
Male (% within diverse) 419 9.7 4,600 6.7

14
n % n % Racially or Ethically
Diverse Self Report Non Racially or Ethnically Diverse Self Report or Not
Reported Proficient in Another Language
No (% within diverse) 2,559 59.0 62,962 91.5
Yes – one (% within diverse) 1,585 36.5 5,347 7.8
Yes – proficient in 2 or more (% within diverse)
195 4.5 488 0.7
Job Title of Primary Position (% within diverse)
Valid Responses 3,721 58,684
Administrator 53 1.4 931 1.6
Advanced Practice Nurse 177 4.8 3,670 6.3
Case Manager 199 8.0 3,974 6.8
Consultant/Contract 41 1.1 674 1.1
Manager, other non-medical industry 8 0.2 112 0.2
Nurse Executive 39 1.0 682 1.2
Nurse Faculty 89 2.4 1,156 2.0
Nurse Manager 242 6.5 4,421 7.5
Nurse Researcher 20 0.5 267 0.5
Staff Nurse 2,477 66.6 37,053 63.1
Staff, other non-medical industry 7 0.2 202 0.3
Other 269 7.2 5,542 9.4
Total Mean Hours/Week Primary/Secondary Position
Valid Responses 3,721 58,684
Mean (standard deviation) 37.2 (13.7) 35.7 (12.0)
Highest Nursing Degree (% within diverse)
Valid Responses 4,339 68,797
Diploma 129 3.0 5,594 8.1
Associate Degree 1,638 37.8 24,806 36.1
BSN 2,095 48.3 30,168 43.9
MSN 435 10.0 7,657 11.1
Doctorate 39 0.9 247 0.6

15
n % n % Racially or Ethically
Diverse Self Report Non Racially or Ethnically Diverse Self Report or Not
Reported Primary Position (% within position)
Valid Responses 3,721 58,684
Ambulatory Care 491 4.6 10,273 95.4
Nursing Home/Extended Care 540 8.2 6,038 91.8
Academic Education 91 6.9 1,233 93.1
Public/Community Health 180 7.6 2,195 92.4
Home Health 307 8.4 3,356 91.6
Hospital 1,856 5.6 31,073 94.4
Other 256 5.4 4,516 94.6
E. Recommendations 1. The Wisconsin Registered Nurse Survey will become an increasingly rich source of nursing
workforce information with more years of data available for identifying trends. Further analysis of the data related to demographic, workforce, and academic characteristics of the respondents is needed to extend the utility and reach of the findings. Making the data and funding available for researchers would substantively enable projection of RN workforce needs.
2. Although the trends are positive toward higher educational attainment of registered nurses, a serious gap remains between national recommendations and the current status. More funding for nursing education programs could allow higher numbers of admissions, and more funding or loan forgiveness for students could allow more willing nurses to become educated at a higher level.
3. Of particular concern is the steady state enrollment in PhD programs, as well as the still limited numbers of DNPs. The number of graduates of doctoral programs prepared to be productive faculty is too low to adequately meet the nursing education needs at the baccalaureate level given that faculty are older and many are nearing retirement. More innovative and better funded approaches to graduate nursing education are needed to assure a sufficient nursing faculty workforce.
4. A substantial gap continues between the diversity of the nursing workforce and the diversity of the state’s population. Much more effort is needed to support students of diverse backgrounds to enter nursing.

16
References: Bleich, M. R., Cleary, B. L., Davis, K., Hatcher, B. J., Hewlett, P. O., & Hill, K. S. (2009). Mitigating
knowledge loss. Journal of Nursing Administration, 39(4), 160-164. Groves, P. S. (2011). Nursing work: Understanding a scarce resource. Western Journal of Nursing
Research, 33(1), 5-6. doi:10.1177/0193945910380847. Institute of Medicine. Committee on the Robert Wood Johnson Foundation Initiative on the Future of
Nursing. (2011). The future of nursing: Leading change, advancing health. Washington, DC: National Academies Press. Retrieved from
http://books.nap.edu/openbook.php?record_id=12956&page=R1 Murray, M. E., Westphal, J., Acord, L., Schiffman, R., & Henriques, J. B. (2013). Wisconsin Registered
Nurse Survey 2012 Report. Milwaukee: Wisconsin Center for Nursing. Retrieved from http://wisconsincenterfornursing.org/documents/2012%20RN%20Survey%20Main%20Workforce%20Report%20Rev%20FINAL.pdf
U.S. Census Bureau, (2014). State and County QuickFacts. Retrieved from http://quickfacts.census.gov/qfd/states/55000.html

17
III. Registered Nurse Workforce Analyzed by Wisconsin Department of Health Services (DHS) Regions
In this section, data are presented to describe the nursing workforce in each of the five DHS regions of the state (see Appendix A for map and listing of DHS regions). Key findings from the data and implications for employers, educators, and policy makers are presented in the accompanying narrative. Regional data numbers reflect some incomplete elements of surveys where the data to place respondents into regions were missing or numbers were too small to report. A. Demographics of RN Workforce Table III.1 indicates that a lack of diversity in the nursing workforce exists across all regions. For most nurses, proficiency in a language other than English which is essential to meeting the needs of an increasingly diverse population, is also absent. The Western region has the lowest RN ratio to the population and the Northern the highest. Table III.1 Demographic Information for RNs Residing in Each Department of Health Services (DHS) Region Southern Southeastern Northeastern Western Northern
n = 14,247 n = 27,124 n =14,152 n = 6,576 n = 8,736
n % n % n % n % n %
Working as RN 12,063 84.7 22,670 83.6 11,744 83.0 5,457 83.0 7,458 85.4 Working RNs/1,000 population
10.8 10.7 9.5 7.0 15.3
Descriptive Data
Median Age 48 48 47 49 48
Gender
Female 13,247 93.0 25,426 93.7 13,253 93.6 6,041 91.9 8,095 92.7
Male 1,000 7.0 1,701 6.3 899 6.4 535 8.1 641 7.3
Diversity
White 13,696 96.1 24,930 91.9 13,779 97.4 6,425 97.7 8,549 97.9 Black or African American 133 0.9 1,097 4.0 37 0.3 8 0.1 13 0.1
American Indian/ Alaska Native 26 0.2 82 0.3 84 0.6 34 0.5 31 0.4
Asian 239 1.7 495 1.8 146 1.0 60 0.9 60 0.7 Native Hawaiian/Other Pacific Islander
9 0.1 39 0.1 9 0.1 10 0.2 7 0.1

18
Southern Southeastern Northeastern Western Northern
n = 14,247 n = 27,124 n =14,152 n = 6,576 n = 8,736
n % n % n % n % n %
Multiracial 144 1.0 481 1.8 97 0.7 39 0.6 76 0.9
Hispanic origin 161 1.1 715 2.6 121 0.9 44 0.7 64 0.7
Proficient in Another Language
No 12,636 88.7 23,681 87.3 12,964 91.6 6,076 92.4 8,131 93.1 Yes–one other Language 1,451 10.2 3,144 11.6 1,082 7.7 451 6.9 562 6.4
Yes–two or more other Languages 160 1.1 299 1.1 106 0.7 49 0.7 43 0.5
B. Employment Status of RNs Residing in Wisconsin DHS Regions
As described in Table III.2, the vast majority of RNs in all five DHS regions are employed. There are also RNs who are unemployed and seeking employment; however, it is fewer than 2% of nurses responding to the survey. It is interesting to note that retired nurses continue to renew their licenses an increasing numbers over that reported in the 2012 survey (Murray, Westphal, Acord, Schiffman, & Henriques, 2013). The proportion is equal across the regions. Table III.2 Employment Status of RNs Residing in Wisconsin DHS Regions Southern Southeastern Northeastern Western Northern
n = 14,247 n = 27,124 n = 14,152 n = 6,576 n = 8,736
n % n % n % n % n % Working as an RN 12,063 84.7 22,670 83.6 11,744 83.0 5,457 83.0 7,458 85.4
Working in health care, not nursing
347 2.4 859 3.2 454 3.2 189 2.9 212 2.4
Working in another field 233 1.6 433 1.6 221 1.6 130 2.0 120 1.4
Unemployed, seeking work in nursing
264 1.9 578 2.1 265 1.9 140 2.1 133 1.5
Unemployed, seeking work in another field
31 0.2 74 0.3 30 0.2 17 0.3 6 0.1

19
Southern Southeastern Northeastern Western Northern
n = 14,247 n = 27,124 n = 14,152 n = 6,576 n = 8,736
n % n % n % n % n % Unemployed, not seeking work
352 2.5 893 3.3 443 3.1 187 2.8 238 2.7
Retired 957 6.7 1,617 6.0 995 7.0 456 6.9 569 6.5 Note: Percents are based on the valid responses in the category and may vary between categories. C. Patterns of Employment in Nursing Table III.3 indicates the RN workforce across all regions has, on average, 15 years of experience providing direct patient care. The majority of nurses identified staff nurse as their primary position. Most nurses are paid on an hourly basis and fewer than 3% are paid per diem. The proportions are similar across regions. Table III.3 Patterns of Employment in Nursing Southern Southeastern Northeastern Western Northern
Valid Responses n = 12,136 n = 22,926 n = 11,930 n = 5,554 n = 7,558
n % n % n % n % n % Currently work as RN providing direct patient care
9,409 66.0 17,278 63.7 8,902 62.9 4,152 63.1 5,714 65.4
Mean years (standard deviation) providing DPC as an RN
15.7 (11.9) 15.4 (11.8) 15.4 (11.7) 15.5 (11.6) 15.5 (11.9)
Primary Place of Employment Ambulatory Care (Office, Clinic, Urgent Care, Surgery Center, School Health, etc)
2,275 16.0 3,389 12.5 2,281 16.1 1,115 17.0 1,305 14.9
Extended Care (Nursing Home, Assisted Living, Hospice Facility, etc)
1,167 8.2 2,012 7.4 1,491 10.5 674 10.2 1,039 11.9
Academia 247 1.7 518 1.9 253 1.8 99 1.5 157 1.8 Public health/Community health
446 3.1 850 3.1 472 3.3 254 3.9 284 3.3
Home Health 651 4.6 1,346 5.0 821 5.8 280 4.3 360 4.1
Hospital 6,533 45.9 13,099 48.3 5,617 39.7 2,626 39.9 3,821 43.7

20
Southern Southeastern Northeastern Western Northern
Valid Responses n = 12,136 n = 22,926 n = 11,930 n = 5,554 n = 7,558
n % n % n % n % n %
Other 817 5.7 1,712 6.3 995 7.0 506 7.7 592 6.8
Job Title of Primary Position (n = 58,546)
Administrator 168 1.2 365 1.3 204 1.4 97 1.5 113 1.3 Advanced Practice Nurse 723 5.1 1,284 4.7 783 5.5 350 5.3 484 5.5
Case Manager 724 5.1 1,646 6.1 803 5.7 437 6.6 507 5.8
Consultant/Contract 160 1.1 268 1.0 129 0.9 42 0.6 86 1.0
Nurse Executive 146 1.0 243 0.9 118 0.8 81 1.2 90 1.0
Nurse Faculty 219 1.5 477 1.8 236 1.7 111 1.7 157 1.8
Nurse Manager 885 6.2 1,504 5.5 970 6.9 425 6.5 697 8.0
Nurse Researcher 72 0.5 134 0.5 35 0.2 16 0.2 22 0.3
Staff Nurse 8,045 56.5 14,682 54.1 7,364 52.0 3,394 51.6 4,687 53.7 Staff Other non-Medical Industry 35 0.2 62 0.2 55 0.4 26 0.4 24 0.3
Manager Other non-Medical Industry 18 0.1 40 0.1 33 0.2 12 0.2 14 0.2
Other 941 6.6 2,221 8.2 1,200 8.5 563 8.6 677 7.7
Payment Basis of Position
Paid hourly 8,767 61.5 15,404 56.8 8,301 58.7 3,688 56.1 5,336 61.1
Paid salary 2,878 20.2 6,477 23.9 3,057 21.6 1,565 23.8 1,862 21.3
Per diem 357 2.5 747 2.8 425 3.0 224 3.4 230 2.6 Total mean hours worked per week primary/secondary jobs WI
35.7 (11.5) 36.0 (12.4) 35.3 (12.0) 36.0 (12.2) 35.4 (11.7)
Primary employment through temporary employment agency or travel agency
102 0.7 259 1.0 131 0.9 59 0.9 58 0.6

21
D. Patterns of Employment Table III.4 indicates that the majority of nurses (85%) are employed in nursing. Nurse educators comprise the next largest group at 4-5% of the nurses surveyed. The proportions are similar across all regions. Table III.4 Employment of RNs in Nursing and Other Areas Across DHS Regions Where Employed Southern Southeastern Northeastern Western Northern
Valid Responses n = 12,214 n = 23,057 n = 11,664 n = 5,693 n = 7,887
n % n % n % n % n %
Nursing 10,725 87.8 19,821 86 9,890 84.8 4,827 84.8 6,853 86.9 Nurse Educator (university, technical, K-12 combined)
463 3.8 1,079 4.7 564 4.8 259 4.5 321 4.1
Retail sales and services * 19 0.1 10 0.1 * 8 0.1
Health-related services outside of nursing
297 2.4 635 2.8 369 3.2 194 3.4 190 2.4
Financial, accounting, and insurance processing
* 174 0.8 122 1.0 76 1.3 *
Consulting 127 1.0 222 1.0 105 0.9 * *
Other 517 4.2 1,107 4.8 604 5.2 291 5.1 392 5.0 *cells too small to report E. Specialized Clinical Knowledge Table III.5 Specialized knowledge and experience of nurses is detailed in Table III.5. Respondents were asked to take into account all nursing work experience including unpaid volunteer nursing work when responding to the question. Respondents could select more than one type of specialty knowledge required in their primary position. Table III.5 reveals the highest number in medical-surgical and lowest number of nurses across all regions are engaged in correctional health clinical practice similar to the findings in 2012 (Murray et al., 2013).

22
Table III.5 Clinical Knowledge Specialty Southern Southeastern Northeastern Western Northern
n = 14,247 n = 27,124 n = 14,152 n = 6,576 n = 8,736
n % n % n % n % n % Acute Care/Critical Care/Intensive Care 3,685 8.5 7,214 8.8 3,068 7.7 1,682 8.1 2,032 7.4
Addiction/AODA/Substance Abuse 528 1.2 1,099 1.3 496 1.1 313 1.5 362 1.3
Adult Health 2,848 6.5 5,157 6.3 2,667 6.1 1,215 5.9 1,590 5.8
Anesthesia 352 0.8 456 0.6 313 0.7 207 1.0 227 0.8
Cardiac Care 2,291 5.3 5,214 6.4 2,414 5.6 1,104 5.3 1,417 5.2
Community Health 1,014 2.3 2,140 2.6 978 2.3 520 2.5 703 2.6
Correctional Health 357 0.8 439 0.5 385 0.9 102 0.5 156 0.6
Dialysis/Renal 521 1.2 1,211 1.5 642 1.5 266 1.3 291 1.1
Emergency/Trauma 2,085 4.8 3,213 3.9 1,892 4.4 1,082 5.2 1,492 5.4
Family Health 1,103 2.5 1,767 2.2 1,142 2.6 571 2.8 751 2.7
Geriatrics/Gerontology 2,867 6.6 4,787 5.9 3,232 7.5 1,579 7.6 2,110 7.7
Home Health 1,693 3.9 3,357 4.1 1,780 4.1 821 4.0 1,126 4.1 Hospice Care/Palliative Care 1,601 3.7 3,251 4.0 1,887 4.4 763 3.7 1,115 4.1
Labor and Delivery 1,145 2.6 1,747 2.1 1,253 2.9 589 2.9 917 3.3 Maternal-Child Health 1,140 2.6 1,970 2.4 1,138 2.6 478 2.3 748 2.7
Medical-Surgical 4,955 11.4 9,061 11.1 4,725 10.9 2,264 11.0 3,055 11.1
Neonatal Care 788 1.8 1,733 2.1 841 1.9 366 1.8 540 2.0
Obstetrics/Gynecology 1,285 3.0 2,032 2.5 1,286 3.0 568 2.7 811 3.0 Occupational Health/Employee Health
427 1.0 704 0.9 582 1.3 286 1.4 229 0.8
Oncology 1,048 2.4 2,493 3.0 1,159 2.7 489 2.4 557 2.0
Pediatrics 1,740 4.0 3,337 4.1 1,424 3.3 740 3.6 850 3.1 Psychiatric/Mental Health 1,163 2.7 2,227 2.7 1,200 2.8 488 2.4 852 3.1
Public Health 672 1.5 1,199 1.5 590 1.4 337 1.6 511 1.9
Rehabilitation 842 1.9 2,242 2.7 1,157 2.7 460 2.2 627 2.3
23
Southern Southeastern Northeastern Western Northern
n = 14,247 n = 27,124 n = 14,152 n = 6,576 n = 8,736
n % n % n % n % n %
Respiratory Care 670 1.5 1,167 1.4 490 1.1 253 1.2 374 1.4 School Health (K-12 or Post-Secondary) 487 1.1 818 1.0 358 0.8 212 1.0 285 1.0
Surgery/Pre-op/Post-op/PACU 2,225 5.1 4,085 5.0 2,315 5.3 1,142 5.5 1,346 4.9
Women’s Health 934 2.1 1,849 2.3 1,010 2.3 381 1.8 577 2.1
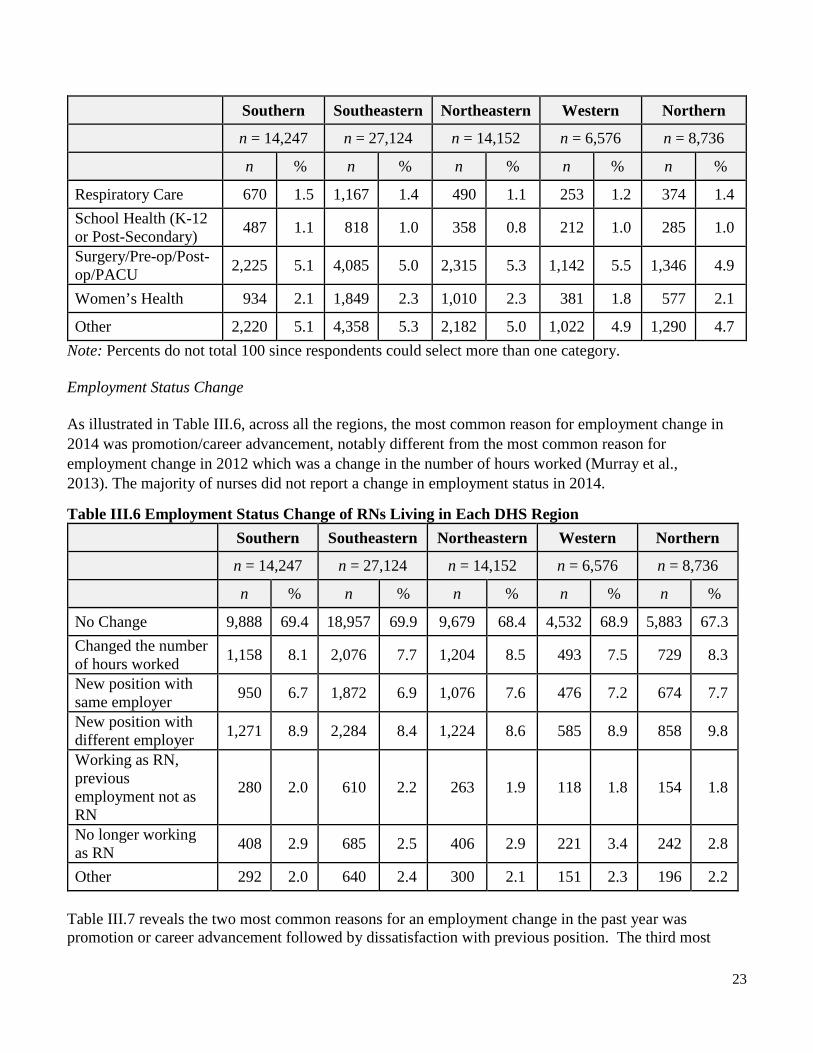
Other 2,220 5.1 4,358 5.3 2,182 5.0 1,022 4.9 1,290 4.7 Note: Percents do not total 100 since respondents could select more than one category. Employment Status Change As illustrated in Table III.6, across all the regions, the most common reason for employment change in 2014 was promotion/career advancement, notably different from the most common reason for employment change in 2012 which was a change in the number of hours worked (Murray et al., 2013). The majority of nurses did not report a change in employment status in 2014.
Table III.6 Employment Status Change of RNs Living in Each DHS Region Southern Southeastern Northeastern Western Northern
n = 14,247 n = 27,124 n = 14,152 n = 6,576 n = 8,736
n % n % n % n % n %
No Change 9,888 69.4 18,957 69.9 9,679 68.4 4,532 68.9 5,883 67.3 Changed the number of hours worked 1,158 8.1 2,076 7.7 1,204 8.5 493 7.5 729 8.3
New position with same employer 950 6.7 1,872 6.9 1,076 7.6 476 7.2 674 7.7
New position with different employer 1,271 8.9 2,284 8.4 1,224 8.6 585 8.9 858 9.8
Working as RN, previous employment not as RN
280 2.0 610 2.2 263 1.9 118 1.8 154 1.8
No longer working as RN 408 2.9 685 2.5 406 2.9 221 3.4 242 2.8
Other 292 2.0 640 2.4 300 2.1 151 2.3 196 2.2 Table III.7 reveals the two most common reasons for an employment change in the past year was promotion or career advancement followed by dissatisfaction with previous position. The third most

24
common reason for employment change was seeking more convenient hours. These are similar across regions. Table III.7 Important Factors in Employment Change in the Past Year Across DHS Regions Where Employed Southern Southeastern Northeastern Western Northern
Valid Responses n = 12,214 n = 23,057 n = 11,664 n = 5,693 n = 7,887
n % n % n % n % n %
Retirement 68 0.6 148 0.6 78 0.7 48 0.8 51 0.6 Childcare responsibilities 244 2.0 492 2.1 218 1.9 82 1.4 122 1.5
Other family responsibilities 169 1.4 333 1.4 152 1.3 72 1.3 92 1.2
Salary/medical or retirement benefits 370 3.0 664 2.9 368 3.2 154 2.7 310 3.9
Laid off 81 0.7 166 0.7 98 0.8 57 1.0 59 0.7 Change in spouse/partner work situation
87 0.7 190 0.8 95 0.8 47 0.8 68 0.9
Change in financial situation 127 1.0 249 1.1 121 1.0 61 1.1 87 1.1
Relocation/moved to a different area 276 2.3 333 1.4 214 1.8 134 2.4 153 1.9
Promotion/career advancement 676 5.5 1,317 5.7 731 6.3 335 5.9 449 5.7
Change in health status of RN 89 0.7 196 0.9 96 0.8 46 0.8 69 0.9
Seeking more convenient hours 544 4.5 863 3.7 511 4.4 222 3.9 329 4.2
Dissatisfaction with previous position 525 4.3 1,080 4.7 476 4.1 231 4.1 320 4.1
Other 536 4.4 1,037 4.5 602 5.2 259 4.5 402 5.1 Table III.8 reveals fewer than 10% of nurses have secondary employment and most of those positions require licensure as an RN. On average the secondary employment is about 8 hours per week. There is little variation across regions.

25
Table III.8 Patterns of Secondary Employment Southern Southeastern Northeastern Western Northern
n = 14,247 n = 27,124 n = 14,152 n = 6,576 n = 8,736
n % n % n % n % n % Secondary job requires licensure as an RN
1,239 8.7 2,547 9.4 1,328 9.4 579 8.8 852 9.8
Nursing 1,050 7.4 2,141 7.9 1,089 7.7 498 7.6 734 8.4
Nurse educator 139 1.0 278 1.0 182 1.3 64 1.0 84 1.0 Retail sales and services 28 0.2 32 0.1 27 0.2 * *
Health-related services outside of nursing
93 0.7 169 0.6 108 0.8 64 1.0 68 0.8
Financial, accounting, and insurance processing staff
6 0.0 12 0.0 10 0.1 * *
Consulting 34 0.2 66 0.2 30 0.2 * *
Other 165 1.2 319 1.2 191 1.3 76 1.2 94 1.1 Mean number of hours per week worked
8.1 (8.4) 8.9 (8.8) 8.2 (8.4) 7.7 (8.7) 8.4 (9.1)
*cells too small to report Table III.9 reveals that fewer than 2% of RNs across all regions responding to survey intend to return to nursing in the future and about 2% of RNs across all regions are seeking employment in nursing. Of note is the undecided group at 6-7%. In the event of a nursing shortage enticing these individuals into practice would quickly fill vacant positions.

26
Table III.9 Current Intentions Regarding Work in Nursing Southern Southeastern Northeastern Western Northern
n = 14,247 n = 27,124 n = 14,152 n = 6,576 n = 8,736
n % n % n % n % n % Currently seeking employment in nursing
304 2.1 595 2.2 285 2.0 143 2.2 142 1.6
Plan to return to nursing in future 233 1.6 489 1.8 224 1.6 112 1.7 149 1.7
I am retired /unable to return to nursing 525 3.7 881 3.2 569 4.0 241 3.7 289 3.3
Definitely will not return to nursing but not retired
125 0.9 278 1.0 117 0.8 56 0.9 69 0.8
Undecided at this time 924 6.5 1,955 7.2 1,027 7.3 470 7.1 529 6.1
Of the RNs not currently working in nursing Table III.10 displays the top three factors across all regions for influencing a return to nursing include more or flexible hours, welcoming work environment and worksite location. These are the same top three factors as identified by nurses in 2012 (Murray et al., 2013). Table III.10 Factors Influencing a Return to Nursing Southern Southeastern Northeastern Western Northern
Valid Responses n = 3,927 n = 8,329 n = 4,087 n = 1,949 n = 2,128
n % n % n % n % n % Would not consider returning to nursing 413 10.5 787 9.4 465 11.4 197 10.1 222 10.4
Modified physical requirements of job 249 6.6 558 6.7 243 5.9 121 6.2 136 6.4
Affordable childcare at or near work
66 1.7 123 1.5 50 1.2 18 0.9 22 1.0
Improvement in health status 220 5.6 425 5.1 218 5.3 1,101 5.2 109 5.1
Improved health benefits 133 3.4 314 3.8 148 3.6 75 3.8 88 4.1
Retirement benefits 143 3.6 334 4.0 153 3.7 75 3.8 93 4.4 More or flexible hours 524 13.3 1,089 13.1 492 12.0 258 13.2 272 12.8

27
Southern Southeastern Northeastern Western Northern
Valid Responses n = 3,927 n = 8,329 n = 4,087 n = 1,949 n = 2,128
n % n % n % n % n % Opportunity for career advancement
142 3.6 330 4.0 165 4.0 68 3.5 79 3.7
Improved pay 289 7.4 749 9.0 327 8.0 155 8.0 169 7.9
Shift 303 7.7 649 7.8 329 8.0 140 7.2 162 7.6
Work environment 474 12.1 999 12.0 484 11.8 251 12.9 240 11.3
Worksite location 380 9.7 778 9.3 376 9.2 194 10.0 180 8.5
Other 591 15.0 1,194 14.3 637 15.6 296 15.2 356 16.7 F. Educational Preparation for Nursing Practice Rapid growth of DNP programs and graduates can be seen in the numbers of nurses with doctoral degrees (Table III.11). The percentage of nurses holding a baccalaureate degree ranges from 33.7% in the Western region) to 49.7% in the Southeastern Region. Table III.11 Educational Preparation for Nursing Practice (Highest Nursing Degree) Southern Southeastern Northeastern Western Northern
Valid Responses n = 12,214 n = 23,057 n = 11,664 n = 5,693 n = 7,887
n % n % n % n % n %
Diploma in Nursing 727 6.0 1,511 6.6 704 6.0 381 6.7 376 4.8 Associate Degree in Nursing 4,387 35.9 7,316 31.7 4,394 37.7 2,731 48.0 3,607 45.7
Baccalaureate Degree in Nursing 5,515 45.2 11,449 49.7 5,183 44.4 1,917 33.7 2,956 37.5
Masters' Degree in Nursing or related health field
1,489 12.2 2,551 11.1 1,304 11.2 626 11.0 876 11.1
Doctor of Nursing Practice (or Nursing Doctorate)
38 0.3 101 0.4 37 0.3 * *
PhD in Nursing 43 0.4 109 0.5 23 0.2 * * *cells too small to report

28
G. Future Employment Plans Table III.12 indicates that between 2014 and 2016 it can be anticipated that about 5% of nurses in every region will leave positions where they provide direct patient care. More concerning is that within 9 years, about 29% of the RN workforce in each region holding a DPC position reports an intention to leave direct patient care. Table III.12 Future Work Plan for Providing Direct Patient Care Southern Southeastern Northeastern Western Northern
n = 12,214 n = 23,057 n = 11,664 n = 5,693 n = 7,887
n % n % n % n % n % Less than 2 years 653 5.3 1,230 5.3 597 5.1 319 5.6 413 5.2
2-4 years 1,419 11.6 2,774 12.0 1,189 10.2 630 11.1 870 11.0
5-9 years 2,206 18.1 4,425 19.2 1,941 16.6 968 17.0 1,420 18.0
10-19 years 2,849 23.3 5,202 22.6 2,635 22.6 1,275 22.4 1,729 21.9
20-29 years 1,783 14.6 2,940 12.8 1,622 13.9 796 14.0 1,167 14.8
30+ years 1,429 11.7 2,387 10.4 1,593 13.7 685 12.0 994 12.6 H. Future Educational Plans Table III.13 shows that the majority of RNs across all regions do not plan to continue their education in nursing. This is important in anticipating the need for primary care providers and future faculty. Approximately 25% across all regions do plan to pursue further nursing education in the next two years. This is down slightly from nurses who planned to pursue education in 2012 (Murray et al., 2013). Of interest is the 4-6% of RNs enrolled in BSN programs, a slight increase of about 2% compared to 2012 (Murray et al., 2013). Table III.13 Plans for Further Education in Nursing of RNs Working in Each DHS Region Southern Southeastern Northeastern Western Northern
Valid Responses n = 12,214 n = 23,057 n = 11,664 n = 5,693 n = 7,887
n % n % n % n % n % No plans for additional nursing studies
7,712 63.1 14,377 62.4 7,887 67.6 3,823 67.2 4,967 63.0
Enrolled in BSN program 632 5.2 992 4.3 473 4.1 267 4.7 475 6.0

29
Southern Southeastern Northeastern Western Northern
Valid Responses n = 12,214 n = 23,057 n = 11,664 n = 5,693 n = 7,887
n % n % n % n % n % Enrolled in Master's degree program in Nursing
317 2.6 933 4.0 308 2.6 107 1.9 187 2.4
Enrolled in a Master's degree program in a related health field
58 0.5 130 0.6 67 0.6 * *
Enrolled in a Doctor of Nursing Practice program
127 1.0 169 0.7 72 0.6 32 0.6 73 0.9
Enrolled in a Nursing PhD program
23 0.2 70 0.3 16 0.1 * *
Enrolled in a non-degree specialty certification program
136 1.1 313 1.4 157 1.3 69 1.2 83 1.1
Plan to pursue further nursing education in next two years
3,209 26.3 6,073 26.3 2,684 23.0 1,369 24.0 2,050 26.0
*cells too small to report
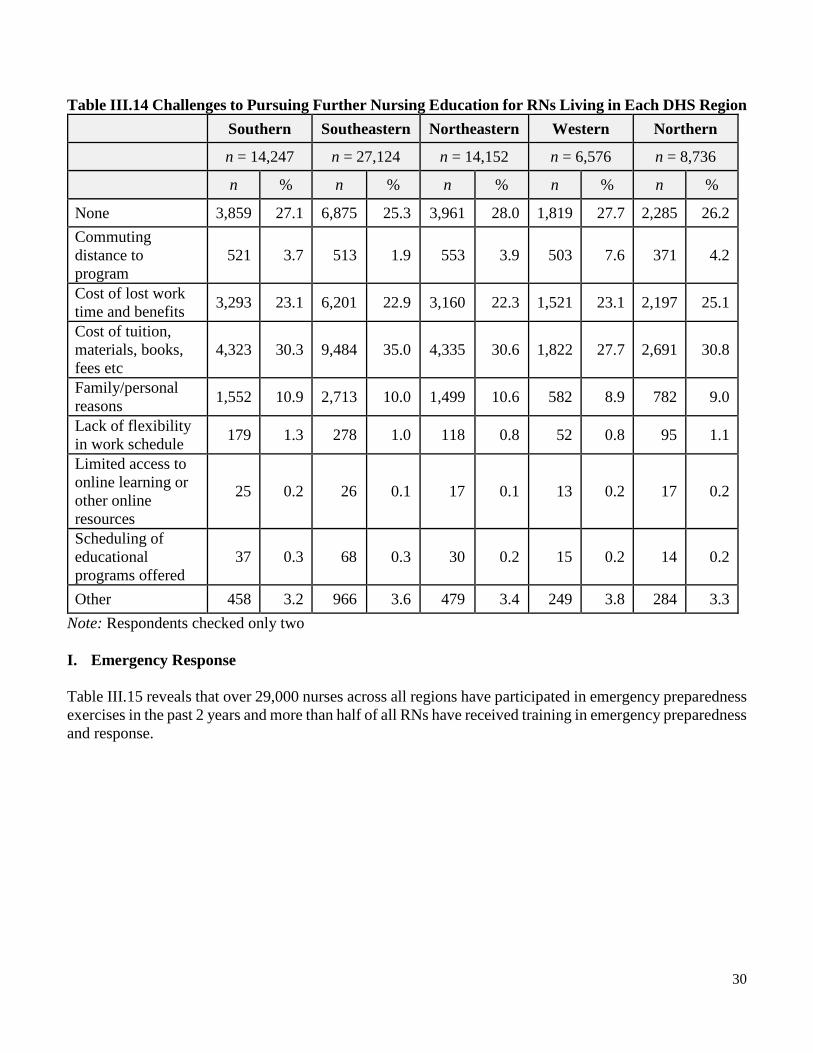
Table III.14 shows that the cost of tuition and fees is the most frequently cited barrier to pursuing additional education followed by cost of lost work time and benefits. These findings are similar across regions and to those reported by nurses in 2012 (Murray et al., 2013).
30
Table III.14 Challenges to Pursuing Further Nursing Education for RNs Living in Each DHS Region Southern Southeastern Northeastern Western Northern
n = 14,247 n = 27,124 n = 14,152 n = 6,576 n = 8,736
n % n % n % n % n %
None 3,859 27.1 6,875 25.3 3,961 28.0 1,819 27.7 2,285 26.2 Commuting distance to program
521 3.7 513 1.9 553 3.9 503 7.6 371 4.2
Cost of lost work time and benefits 3,293 23.1 6,201 22.9 3,160 22.3 1,521 23.1 2,197 25.1
Cost of tuition, materials, books, fees etc
4,323 30.3 9,484 35.0 4,335 30.6 1,822 27.7 2,691 30.8
Family/personal reasons 1,552 10.9 2,713 10.0 1,499 10.6 582 8.9 782 9.0
Lack of flexibility in work schedule 179 1.3 278 1.0 118 0.8 52 0.8 95 1.1
Limited access to online learning or other online resources
25 0.2 26 0.1 17 0.1 13 0.2 17 0.2
Scheduling of educational programs offered
37 0.3 68 0.3 30 0.2 15 0.2 14 0.2
Other 458 3.2 966 3.6 479 3.4 249 3.8 284 3.3 Note: Respondents checked only two I. Emergency Response
Table III.15 reveals that over 29,000 nurses across all regions have participated in emergency preparedness exercises in the past 2 years and more than half of all RNs have received training in emergency preparedness and response.

31
Table III.15 Nurse Participation in Emergency Response Southern Southeastern Northeastern Western Northern
n = 14,247 n = 27,124 n = 14,152 n = 6,576 n = 8,736 Received Training in Emergency Preparedness and Response
9,443 18,034 9,537 4,581 6,141
Participation in an Emergency Preparedness Exercise in Past 2 Years
4,479 8,645 4,433 2,173 3,203
Responded to actual emergency, incident or disaster in past 2 years
528 1,145 443 262 334
Member of Wisconsin Emergency Assistance Volunteer registry (WEAVR)
232 298 211 114 200
Member of Medical Reserve Corps (MrC) unit 28 48 10 6 34
Table III.16 reveals that nurses across all regions routinely receive formal education in emergency preparation. Table III.16 Formal Education in Emergency Preparation Southern Southeastern Northeastern Western Northern
n = 14,247 n = 27,124 n = 14,152 n = 6,576 n = 8,736
Total 9,443 18,034 9,537 4,581 6,414
Provided by Employer 8,598 16,550 8,776 4,126 5,876 Provided by Voluntary Organization 445 693 400 231 272
Other 654 1,160 603 350 437

32
J. Recommendations
1. Since nurses holding baccalaureate degrees or higher in nursing range from 34% to 49%, depending on the region, a major effort will be needed to achieve Institute of Medicine (2011) recommendation that 80% of nurses be prepared at the baccalaureate level by 2020. Increased capacity to support continued education may be necessary at the regional level. It is also important to assure flexibility in educational programs, such as online options and in scheduling from employers, to support RNs achieving additional education. Approaches by region may vary.
2. Respondents reported the cost of tuition and fees as the top barrier to education across all regions.
Regional efforts to support nurses pursing additional education should include a variety of collaborative and financing options. Some employers offer tuition reimbursement for employees pursing advanced education in exchange for a commitment to work for a defined period of time in the organization. There may be regional scholarships are available via professional organizations and local foundations. Loans are also available at the federal level to students through the Health Resources and Services Administration (HRSA). Creative ways to finance the cost of education for nurses may be critical to reaching the goal of 80% baccalaureate level workforce by 2020.
3. In the next 2 years over 3,000 RNs across all regions will leave positions where they provide direct patient care. Utilize the RN workforce across all regions has, on average, 15 years of experience to provide the mentoring required by new graduates at entry to practice.
4. In 2014, a higher proportion of nurses were pursuing a DNP degree rather than a PhD degree across all regions. This will have an impact education and practice. Defining the role of the DNP in the practice setting and in education will be necessary to support ongoing professional development. Intra-regional or cross-regional efforts may be necessary.

33
References:
Institute of Medicine. Committee on the Robert Wood Johnson Foundation Initiative on the Future of Nursing. (2011). The future of nursing: Leading change, advancing health. Washington, DC: National Academies Press. Retrieved from
http://books.nap.edu/openbook.php?record_id=12956&page=R1 Murray, M. E., Westphal, J., Acord, L., Schiffman, R., & Henriques, J. B. (2013). Wisconsin Registered
Nurse Survey 2012 Report. Milwaukee: Wisconsin Center for Nursing. Retrieved from http://wisconsincenterfornursing.org/documents/2012%20RN%20Survey%20Main%20Workforce%20Report%20Rev%20FINAL.pdf
34
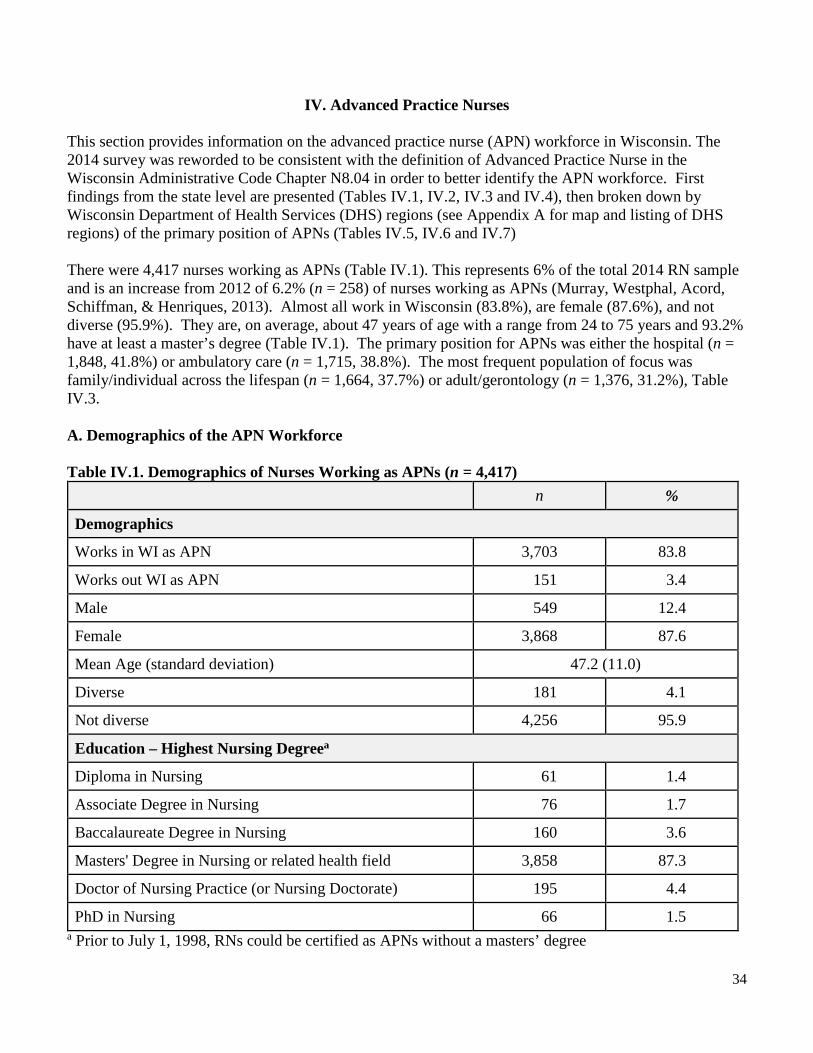
IV. Advanced Practice Nurses This section provides information on the advanced practice nurse (APN) workforce in Wisconsin. The 2014 survey was reworded to be consistent with the definition of Advanced Practice Nurse in the Wisconsin Administrative Code Chapter N8.04 in order to better identify the APN workforce. First findings from the state level are presented (Tables IV.1, IV.2, IV.3 and IV.4), then broken down by Wisconsin Department of Health Services (DHS) regions (see Appendix A for map and listing of DHS regions) of the primary position of APNs (Tables IV.5, IV.6 and IV.7) There were 4,417 nurses working as APNs (Table IV.1). This represents 6% of the total 2014 RN sample and is an increase from 2012 of 6.2% (n = 258) of nurses working as APNs (Murray, Westphal, Acord, Schiffman, & Henriques, 2013). Almost all work in Wisconsin (83.8%), are female (87.6%), and not diverse (95.9%). They are, on average, about 47 years of age with a range from 24 to 75 years and 93.2% have at least a master’s degree (Table IV.1). The primary position for APNs was either the hospital (n = 1,848, 41.8%) or ambulatory care (n = 1,715, 38.8%). The most frequent population of focus was family/individual across the lifespan (n = 1,664, 37.7%) or adult/gerontology (n = 1,376, 31.2%), Table IV.3. A. Demographics of the APN Workforce Table IV.1. Demographics of Nurses Working as APNs (n = 4,417)
n %
Demographics
Works in WI as APN 3,703 83.8
Works out WI as APN 151 3.4
Male 549 12.4
Female 3,868 87.6
Mean Age (standard deviation) 47.2 (11.0)
Diverse 181 4.1
Not diverse 4,256 95.9
Education – Highest Nursing Degreea
Diploma in Nursing 61 1.4
Associate Degree in Nursing 76 1.7
Baccalaureate Degree in Nursing 160 3.6
Masters' Degree in Nursing or related health field 3,858 87.3
Doctor of Nursing Practice (or Nursing Doctorate) 195 4.4
PhD in Nursing 66 1.5 a Prior to July 1, 1998, RNs could be certified as APNs without a masters’ degree
35
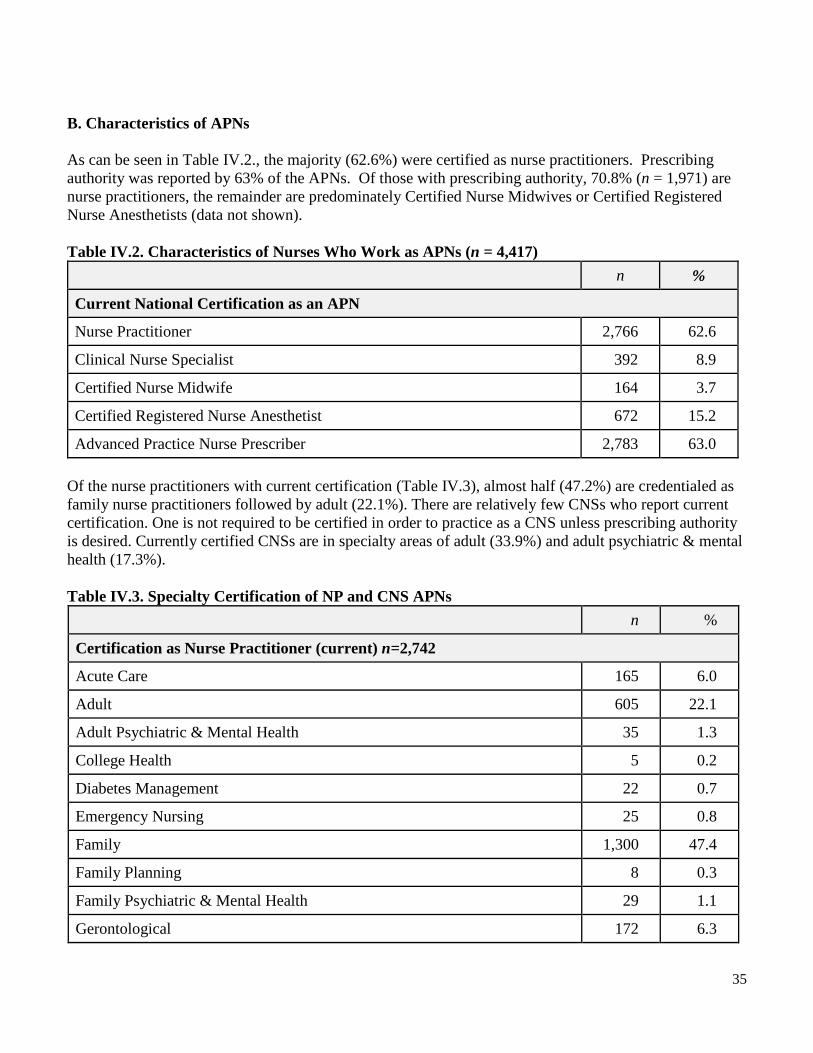
B. Characteristics of APNs As can be seen in Table IV.2., the majority (62.6%) were certified as nurse practitioners. Prescribing authority was reported by 63% of the APNs. Of those with prescribing authority, 70.8% (n = 1,971) are nurse practitioners, the remainder are predominately Certified Nurse Midwives or Certified Registered Nurse Anesthetists (data not shown). Table IV.2. Characteristics of Nurses Who Work as APNs (n = 4,417) n %
Current National Certification as an APN
Nurse Practitioner 2,766 62.6
Clinical Nurse Specialist 392 8.9
Certified Nurse Midwife 164 3.7
Certified Registered Nurse Anesthetist 672 15.2
Advanced Practice Nurse Prescriber 2,783 63.0 Of the nurse practitioners with current certification (Table IV.3), almost half (47.2%) are credentialed as family nurse practitioners followed by adult (22.1%). There are relatively few CNSs who report current certification. One is not required to be certified in order to practice as a CNS unless prescribing authority is desired. Currently certified CNSs are in specialty areas of adult (33.9%) and adult psychiatric & mental health (17.3%). Table IV.3. Specialty Certification of NP and CNS APNs
n %
Certification as Nurse Practitioner (current) n=2,742
Acute Care 165 6.0
Adult 605 22.1
Adult Psychiatric & Mental Health 35 1.3
College Health 5 0.2
Diabetes Management 22 0.7
Emergency Nursing 25 0.8
Family 1,300 47.4
Family Planning 8 0.3
Family Psychiatric & Mental Health 29 1.1
Gerontological 172 6.3
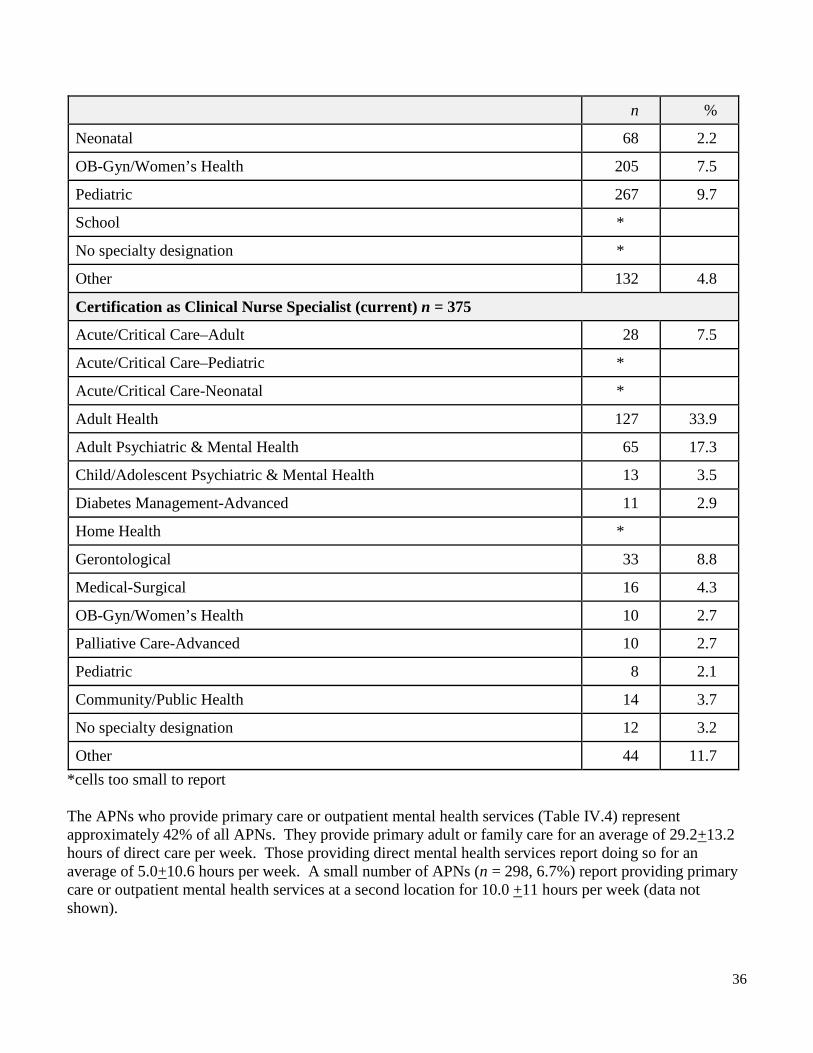
36
n %
Neonatal 68 2.2
OB-Gyn/Women’s Health 205 7.5
Pediatric 267 9.7
School *
No specialty designation *
Other 132 4.8
Certification as Clinical Nurse Specialist (current) n = 375
Acute/Critical Care–Adult 28 7.5
Acute/Critical Care–Pediatric *
Acute/Critical Care-Neonatal *
Adult Health 127 33.9
Adult Psychiatric & Mental Health 65 17.3
Child/Adolescent Psychiatric & Mental Health 13 3.5
Diabetes Management-Advanced 11 2.9
Home Health *
Gerontological 33 8.8
Medical-Surgical 16 4.3
OB-Gyn/Women’s Health 10 2.7
Palliative Care-Advanced 10 2.7
Pediatric 8 2.1
Community/Public Health 14 3.7
No specialty designation 12 3.2
Other 44 11.7 *cells too small to report The APNs who provide primary care or outpatient mental health services (Table IV.4) represent approximately 42% of all APNs. They provide primary adult or family care for an average of 29.2+13.2 hours of direct care per week. Those providing direct mental health services report doing so for an average of 5.0+10.6 hours per week. A small number of APNs (n = 298, 6.7%) report providing primary care or outpatient mental health services at a second location for 10.0 +11 hours per week (data not shown).

37
Table IV.4 APNs Providing Primary Care or Outpatient Mental Health Services (n = 1,859) n %
Family 766 41.2
Women's Health 543 29.2
Certified Nurse Midwife Services 95 5.1
Pediatric 378 8.6
Adult 850 45.7
Geriatric 508 27.3
Mental health services 337 18.1
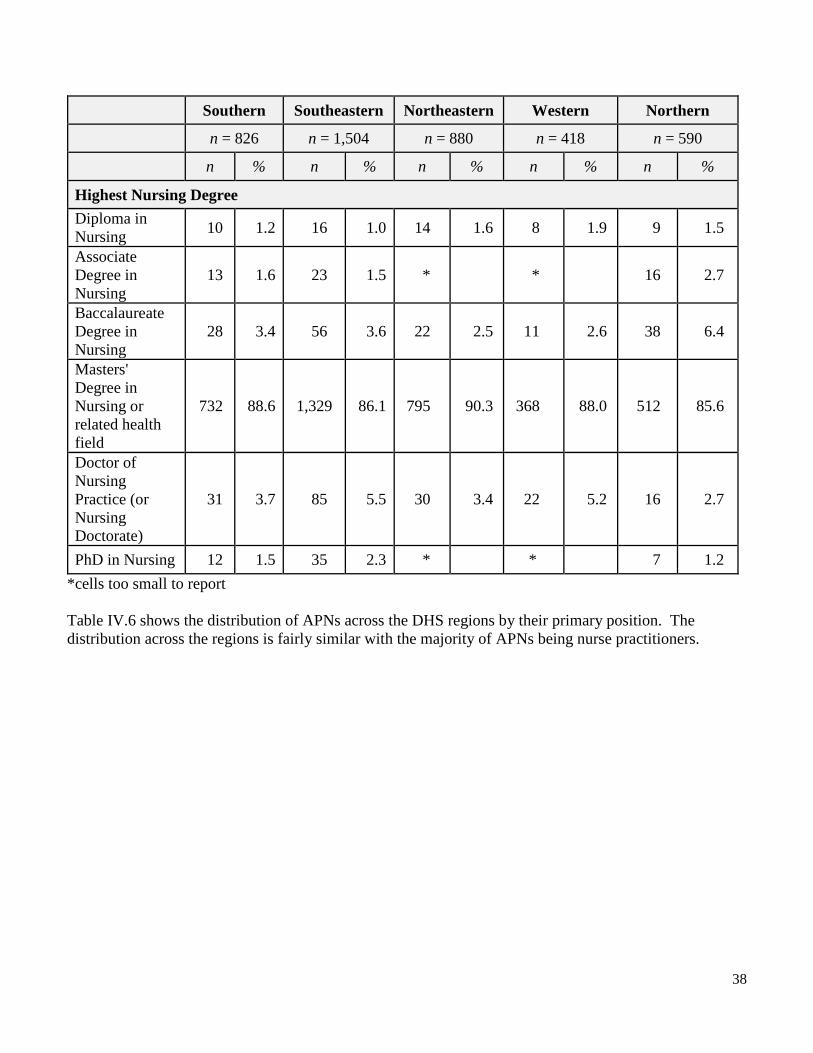
Other 147 3.3 C. APNs by Wisconsin DHS Regions The DHS region of the primary position could be identified for 4,218 of APNs (96% of the APN sample) as can be seen in Table IV.5. The primary reason for no identification of a DHS region was not working in Wisconsin. The Southeastern region has the highest proportion of APNs (35%); the Western region has the lowest (10%). APNs across the region are generally not diverse. There was a slight rise in the percent of APNs with DNPs across all regions from 1.3 to 2.4% in 2012 (Murray et al., 2013) to 2.5 to 5.4% in 2014. This change reflects the shift to DNP. The demographic pattern of APNs who work across the DHS regions parallels that of the state as a whole. Table IV.5 Demographics of APN Workforce with Primary Position in DHS Regions (n = 4,218) Southern Southeastern Northeastern Western Northern
n = 826 n = 1,504 n = 880 n = 418 n = 590
n % n % n % n % n %
Demographics Works in region as APN 694 84.0 1,340 86.8 796 90.5 365 87.3 508 84.9
Not working as APN 132 16.0 204 13.2 84 9.5 53 12.7 90 15.1
Male 95 19.5 121 7.8 131 14.9 83 19.1 101 16.9
Female 731 88.5 1,423 92.2 749 85.1 418 80.1 497 83.1
Diverse 21 2.5 103 6.7 25 2.8 14 3.3 9 1.5
Not diverse 805 97.5 1,441 93.3 855 97.2 404 96.7 589 98.5 Mean Age (standard deviation)
47.4 (11.2) 46.5 (11.3) 47.1 (10.5) 47.1 (10.2) 48.3 (10.9)
38
Southern Southeastern Northeastern Western Northern
n = 826 n = 1,504 n = 880 n = 418 n = 590
n % n % n % n % n %
Highest Nursing Degree Diploma in Nursing 10 1.2 16 1.0 14 1.6 8 1.9 9 1.5
Associate Degree in Nursing
13 1.6 23 1.5 * * 16 2.7
Baccalaureate Degree in Nursing
28 3.4 56 3.6 22 2.5 11 2.6 38 6.4
Masters' Degree in Nursing or related health field
732 88.6 1,329 86.1 795 90.3 368 88.0 512 85.6
Doctor of Nursing Practice (or Nursing Doctorate)
31 3.7 85 5.5 30 3.4 22 5.2 16 2.7
PhD in Nursing 12 1.5 35 2.3 * * 7 1.2 *cells too small to report Table IV.6 shows the distribution of APNs across the DHS regions by their primary position. The distribution across the regions is fairly similar with the majority of APNs being nurse practitioners.
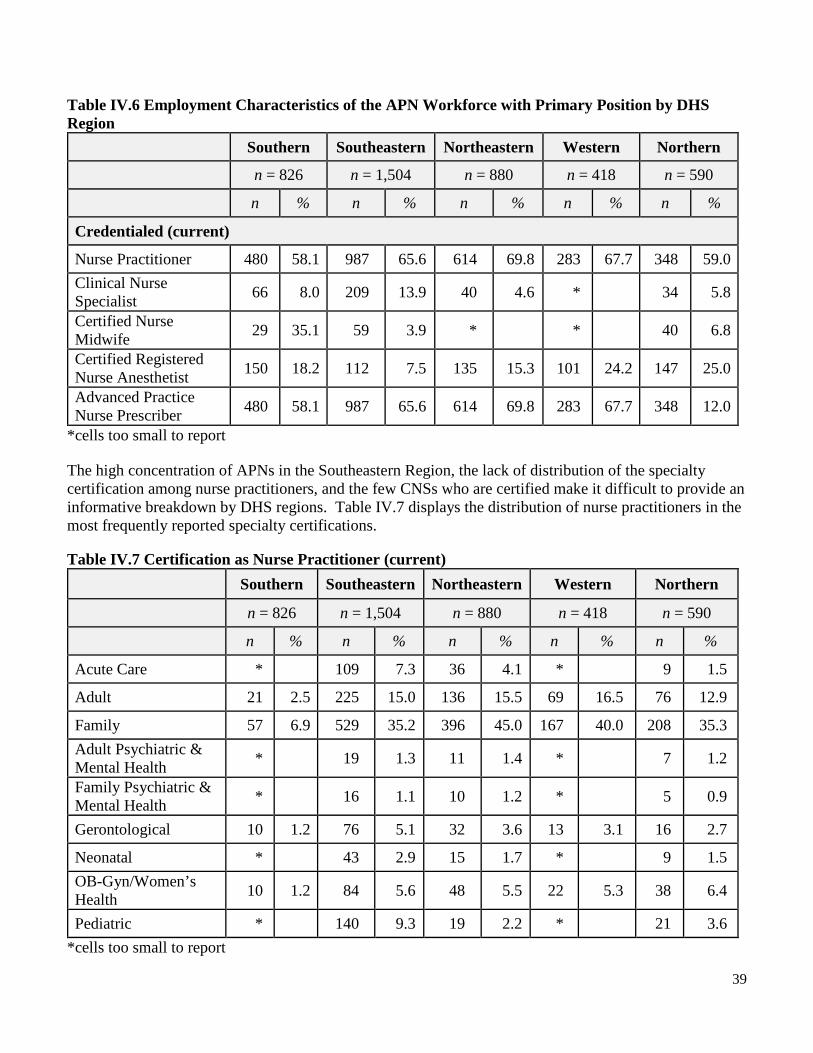
39
Table IV.6 Employment Characteristics of the APN Workforce with Primary Position by DHS Region
Southern Southeastern Northeastern Western Northern
n = 826 n = 1,504 n = 880 n = 418 n = 590
n % n % n % n % n %
Credentialed (current)
Nurse Practitioner 480 58.1 987 65.6 614 69.8 283 67.7 348 59.0 Clinical Nurse Specialist 66 8.0 209 13.9 40 4.6 * 34 5.8
Certified Nurse Midwife 29 35.1 59 3.9 * * 40 6.8
Certified Registered Nurse Anesthetist 150 18.2 112 7.5 135 15.3 101 24.2 147 25.0
Advanced Practice Nurse Prescriber 480 58.1 987 65.6 614 69.8 283 67.7 348 12.0
*cells too small to report The high concentration of APNs in the Southeastern Region, the lack of distribution of the specialty certification among nurse practitioners, and the few CNSs who are certified make it difficult to provide an informative breakdown by DHS regions. Table IV.7 displays the distribution of nurse practitioners in the most frequently reported specialty certifications. Table IV.7 Certification as Nurse Practitioner (current) Southern Southeastern Northeastern Western Northern
n = 826 n = 1,504 n = 880 n = 418 n = 590
n % n % n % n % n %
Acute Care * 109 7.3 36 4.1 * 9 1.5
Adult 21 2.5 225 15.0 136 15.5 69 16.5 76 12.9
Family 57 6.9 529 35.2 396 45.0 167 40.0 208 35.3 Adult Psychiatric & Mental Health * 19 1.3 11 1.4 * 7 1.2
Family Psychiatric & Mental Health * 16 1.1 10 1.2 * 5 0.9
Gerontological 10 1.2 76 5.1 32 3.6 13 3.1 16 2.7
Neonatal * 43 2.9 15 1.7 * 9 1.5 OB-Gyn/Women’s Health 10 1.2 84 5.6 48 5.5 22 5.3 38 6.4
Pediatric * 140 9.3 19 2.2 * 21 3.6 *cells too small to report

40
Summary
The percent of RNs in the sample for the 2014 report who work as APNs in Wisconsin is 6.0%. Although this is a slight increase over the 2012 survey (Murray et al., 2013), it is lower than the national average of 7% (Budden, Zhong, Moulton, & Cimiotti, 2013). The majority of APNs are nurse practitioners and there are similarities in the type and distribution of APNs across the DHS regions although the Southeastern Region has the highest overall proportion of APNs. Fewer than 50% of the APNs provide primary care or outpatient mental health care. The shifts in health care as a result of the Affordable Care Act will require more APNs particularly nurse practitioners in primary care (IOM, 2011) to meet the health care needs of the citizens of Wisconsin. D. Recommendations
1. Increase number of APNs across the state who are providing primary care by strategizing with appropriate groups/agencies/systems to create primary care NP positions.
2. Consult with the Wisconsin Association of Clinical Nurse Specialists for development of items for future surveys that better describe the CNS workforce in Wisconsin.
3. Focus efforts on regions with low proportions of APNs in all areas to meet the needs of all Wisconsin citizens.

41
References: Budden, J. S., Zhong, E. H, Moulton, P., & Cimiotti, J. P. (2013). The National Council of State Boards
of Nursing and The Forum of State Nursing Workforce Centers 2013 National Workforce Survey of Registered Nurses. Journal of Nursing Regulation, 4(2) (Suppl), S1-72.
Institute of Medicine. Committee on the Robert Wood Johnson Foundation Initiative on the Future of
Nursing. (2011). The future of nursing: Leading change, advancing health. Washington, DC: National Academies Press. Retrieved from
http://books.nap.edu/openbook.php?record_id=12956&page=R1 Murray, M.E., Westphal, J., Acord, L., Schiffman, R., & Henriques, J .B. (2013). Wisconsin Registered
Nurse Survey 2012 Report. Wisconsin Center for Nursing. Retrieved from http://wisconsincenterfornursing.org/documents/2012%20RN%20Survey%20Main%20Workforce%20Report%20Rev%20FINAL.pdf
U.S. Department of Health and Human Services, Health Resources and Services Administration. (2010).
The Registered Nurse Population. Findings from the 2008 National Sample Survey of Registered Nurses. Washington, DC. Retrieved from http://bhpr.hrsa.gov/healthworkforce/rnsurveys/rnsurveyfinal.pdf
U.S. Department of Health and Human Services, Health Resources and Services Administration, National
Center for Health Workforce Analysis. (2014). Highlights from the 2012 National Sample Survey of Nurse Practitioners. Rockville, MD. Retrieved from http://bhpr.hrsa.gov/healthworkforce/supplydemand/nursing/nursepractitionersurvey/npsurveyhighlights.pdf

42
V. Leadership
New to the 2014 survey were two items about engagement in and barriers to leadership role(s) in nursing. Although the number of nurses is far greater than other disciplines in the healthcare workforce, their leadership presence is disproportionately less – particularly on healthcare services boards. Due to factors identified in key reports including the Institute of Medicine report on the future of nursing (IOM, 2011), and the Gallop National Survey of Opinion Leaders (Khoury, Blizzard, Wright Moore & Hassmiller, 2011), fostering the development of diverse nurses’ leadership competencies is critically needed to influence the changes needed in our healthcare systems. In this section, the valid responses (n = 58,072) of RNs working in the state to the two new items are summarized by state and DHS regions (see Appendix A for map and listing of DHS regions). A. Nurses in Leadership Roles Of the nurses who responded, about half indicate that they were engaged in a leadership role (Table V.1). Respondents could select more than one leadership role; however, the most frequent type of leadership role reported was in the work area. There were relatively few nurses in leadership positions at the organizational level or external to the organization. The pattern across regions was similar to that of the state. V.1 Nurses in Leadership Roles
State Southern Southeastern Northeastern Western Northern
n = 58,072 n = 11,771 n = 22,124 n = 11,152 n = 5,454 n = 7,578
n % n % n % n % n % n % Engaged in Leadership Role
29,383 50.6 5,780 49.1 11,460 51.8 5,286 47.4 2,727 50.0 4,130 54.5
Type of Role Work Area (e.g. Charge Nurse, Team Leader, Unit Manager)
27,052 46.6 5,306 45.1 10,603 47.9 4,857 43.5 2,505 45.9 3,781 49.9
Organization Level (e.g. Dean, CNO, Director)
23,186 5.5 634 5.4 1,132 5.1 594 5.3 326 6.0 500 6.6
Governance Board (e.g. Board of Trustees)
742 1.3 142 1.2 342 1.5 115 1.0 63 1.2 80 1.1

43
State Southern Southeastern Northeastern Western Northern
n = 58,072 n = 11,771 n = 22,124 n = 11,152 n = 5,454 n = 7,578
n % n % n % n % n % n % Public Official (e.g. County Board of Supervisors, state legislator)
226 0.4 46 0.4 54 0.2 50 0.4 38 0.7 38 0.5
Note: Respondents could select more than one leadership role. As noted in Table VI.2, nurses in leadership roles were on average 45 years of age but with a wide age range across all roles. Nurses of diverse racial and ethnic backgrounds are underrepresented among nurses with one or more leadership positions. The representation of women who are nurses with leadership roles is fairly consistent across roles – work area/unit, organization/dean/CNO/director, and governance board; however, they are less frequently leading in the area of public official/county board. On the other hand, men with leadership roles are least represented in roles at the work/unit area level and are more represented on governance boards (9.4%) and public health/county boards (15.3%). The proportion of nurses with a BSN or Masters’ degree was higher for leadership roles other than the work area. V.2 Age, Diversity, Gender, and Education Among Nurses with Leadership Role(s)
Leadership Roles
Work Area (e.g. Charge Nurse, Team Leader, Unit
Manager)
Organization Level (e.g.
Dean, CNO, Director)
Governance Board (e.g. Board of Trustees)
Public Official (e.g. County
Board of Supervisors,
state legislator) n = 29,383 n = 27,052 n = 3,186 n = 742 n = 226
n % n % n % n % n %
Age
Range (in years) Mean Range Mean Range Mean Range Mean Range Mean
22 - 75 45.0 22 - 75 44.6 23 - 75 47.7 23 - 75 44.9 24 - 73 45.2 Racially or Ethnically Diverse
1,867 6.4 1,751 6.5 165 5.2 45 6.1 13 5.8
Gender (n = 29,383)
Female 27,225 92.7 25,058 92.6 2,954 92.7 672 90.6 207 85.0
Male 2,158 7.3 1,994 7.4 232 7.3 70 9.4 34 15.0

44
Leadership Roles
Work Area (e.g. Charge Nurse, Team Leader, Unit
Manager)
Organization Level (e.g.
Dean, CNO, Director)
Governance Board (e.g. Board of Trustees)
Public Official (e.g. County
Board of Supervisors,
state legislator) n = 29,383 n = 27,052 n = 3,186 n = 742 n = 226
n % n % n % n % n %
Education (n = 29,383) 4 Diploma in Nursing 1,524 5.2 1,438 5.3 117 3.7 18 2.9 8 3.5
Associate Degree in Nursing
11,694 39.8 11,139 41.2 889 27.9 178 24.0 65 28.8
Baccalaureate Degree in Nursing
12,945 44.1 12,122 44.8 1,207 37.9 300 40.4 110 48.7
Masters' Degree in Nursing or related health field
2,934 10.0 2,201 8.1 838 26.3 197 26.5 38 16.8
Doctor of Nursing Practice (or Nursing Doctorate)
129 0.4 75 0.3 61 1.9 15 2.0 *
PhD in Nursing 126 0.4 46 0.2 72 2.3 34 4.6 * *
* cells too small to report Note: Respondents could select more than one role. B. Nurses in Leadership Role(s) at Work As can be seen in Tables V.3 and V.4, nurses in leadership roles are most frequently in staff nurse positions in hospitals. This is consistent with the high proportion of work area leadership roles presented previously. Table V.3: Primary Work Setting Roles of Nurses with Leadership Roles (n = 29,383) Work Setting Role n % Staff nurse 18,021 61.3
Nurse manager 4,336 14.8
Case manager 1,543 5.3
APN 1,249 4.3
Administrator 674 3.0

45
Work Setting Role n % Nurse Executive 628 2.1
Nurse Faculty 456 1.6
Consultant/Contractor 186 0.6
Nurse Researcher 99 0.3
Staff, other non-medical industry 60 0.2
Manager, other non-medical industry 47 0.2
Note: Percents do not total to 100% since ‘Other’ responses (n = 2,084) excluded. Of noteworthy consideration in planning initiatives to engage more nurses in leadership roles is that, of the 3,847 APN survey respondents, 65% (n = 2497) did not identify themselves as having any leadership role(s). Table V.4: Primary Work Settings of Nurses with Leadership Role(s) (n = 29,383) Primary Work Setting n % Hospital 17,084 56.4
Extended care 5,061 16.2
Ambulatory care 4,298 13.7
Other a 1,756 5.6
Home health b 1,552 5.0
Public health c 971 3.1
Nurse/Educator 559 1.8
Note: Listed in order; a includes telehealth, call center, insurance; balso includes hospice; c also includes community, occupational and school health services. C. Barriers to Leadership Roles As seen in Table VI.4, almost half of those with valid responses (49.4%) indicated that they had no leadership role. The proportions in the DHS regions were similar to the state as a whole. The most frequent barrier was a lack of interest identified by almost half of the respondents in the state and across the regions. A number of respondents (about 15%) who were not engaged in a leadership role identified either lack of opportunity or other personal priorities as a barrier.

46
V.5 Barriers to Leadership Roles State Southern Southeastern Northeastern Western Northern
n = 58,072 n = 11,771 n = 22,124 n = 11,152 n = 5,454 n = 7,578
n % n % n % n % n % n % Not Engaged in Leadership Role
28,689 49.4 5,998 50.9 10,654 48.2 5,867 52.6 2,725 50.0 3,445 45.5
Barriers to Engagement Lack of leadership development/preparation
917 3.2 213 3.6 344 3.2 153 2.6 92 3.4 115 3.3
Lack of opportunity 3,964 13.8 930 15.5 1,341 12.6 809 13.8 392 14.4 492 14.3
Other personal priorities
3,935 13.7 896 14.9 1,570 14.7 745 12.7 309 11.3 415 12.0
Not interested 14,553 50.7 2,972 49.5 5,284 49.6 3,099 52.8 1,410 51.7 1,788 51.9
Does not apply 5,320 18.5 987 16.5 2,115 19.9 1,061 18.1 522 19.2 635 18.4
D. Comparisons Although nurses in leadership roles were 6.4% more likely to have plans to further their education within 2 years (27%) than those with no leadership roles (20.6%), they were 10.4% less likely to have plans for furthering their education in nursing in that timeframe (61.2%) than nurse respondents with no leadership roles (71.6%). Of nurses with leadership roles, 78.9% planned to continue to provide patient care for at least 2 years as compared to those with no leadership roles (81.0%). Nurses in leadership roles reported spending more years in their primary job (8.8 years) than those with no leadership roles (7.8 years.). Total hours worked for nurses in leadership roles were almost 4 hours per week more than hours worked among those with no leadership role when looking at their primary job (36.7 hrs. vs. 33.0 hrs.) and their primary and secondary jobs combined (37.9 hrs. vs. 34.1 hrs.). [Data not shown.] E. Recommendations
1. Increase efforts to understand and ameliorate the limited diversity of nurses in leadership roles in Wisconsin in order to broaden the range of voices and ideas that contribute to meaningful and sustainable healthcare reform and better health outcomes for individuals and families.
2. Foster and track incorporation of leadership, collaboration, and “thoughtful strategist” competencies such as identified in The future of nursing: Leading change, advancing health report (IOM, 2011) among both new and experienced nurses across patient care, unit, organization, community, board, and health policy settings to ensure all nurses are practicing to the full extent

47
of their education and training, and are fully active, contributing partners in health care delivery, policy, and system change.
3. Refine future surveys in order to better understand nurses’ perceived barriers to serving in one or more leadership roles.
4. Identify opportunities for those nurses interested in leadership roles but who perceive limited opportunities or who may be willing to assume leadership roles when their personal circumstances change.
5. Provide meaningful data from this and future surveys to guide academic programs (such as DNP programs), action coalitions (such as the Wisconsin Center for Nursing’s Implementation of the IOM Future of Nursing Report, the American Academy of Nursing’s Nurses on Boards Coalition, and the Robert Wood Johnson Foundation/AARP Future of Nursing Campaign for Action [Wisconsin Coalition for Action]), and health care organization-based initiatives (such as residency programs for newly licensed nurses) in their efforts to engage more, diverse, accountable, skilled nurses at healthcare leadership tables by 2020.
48
References: American Academy of Nursing (2014, November 17). National Nurses on Boards Coalition [Press
Release]. Retrieved at: http://www.aannet.org/index.php?option=com_content&view=article&id=742:nurses-on-boards-coalition&catid=23:news&Itemid=133
Eide, Y., Hansen, J., Keller, P., MacWilliams, B., Pinekenstein, B., & Veal, J. (2014). Implementation of
the IOM future of nursing report: A Wisconsin profile. Wisconsin Center for Nursing. Retrieved at: http://www.wisconsincenterfornursing.org/documents/index_docs/2014_WI%20Inventory%20IOM%20Profile%20Report%20FINAL%20Nov%202014.pdf
Institute of Medicine, Committee on the Robert Wood Johnson Foundation Initiative on the Future of
Nursing. (2011). The future of nursing: Leading change, advancing health. Washington, DC: National Academies of Science.
Khoury, C. M., Blizzard, R., Wright Moore, L., & Hassmiller, S. (2011). Nursing leadership from bedside
to boardroom. Journal of Nursing Administration 41 (7/8). 299-305. Robert Wood Johnson Foundation & AARP. (n.d.). Future of Nursing Campaign for Action. Retrieved at:
http://campaignforaction.org/about-us

49
Appendix A: Wisconsin Department of Health Services Regions (DHS)
Southern Adams Columbia Crawford Dane Dodge Grant Green Iowa Juneau Lafayette Richland Rock Sauk Vernon
Southeastern Jefferson Kenosha Milwaukee Ozaukee Racine Walworth Washington Waukesha
Northeastern Brown Calumet Door Fond du Lac Green Lake Kewaunee Manitowoc Marinette Marquette Menominee Oconto Outagamie Shawano Sheboygan Waupaca Waushara Winnebago
Western Barron Buffalo Burnett Chippewa Clark Douglas Dunn Eau Claire Jackson La Crosse Monroe Pepin Pierce Polk Rusk St. Croix Trempealeau Washburn
Northern Ashland Bayfield Florence Forest Iron Langlade Lincoln Marathon Oneida Portage Price Sawyer Taylor Vilas Wood
http://www.dhs.wisconsin.gov/aboutdhs/regions.htm retrieved 2/23/12
P-01688 (11/2016)