WISCONSIN APPROPRIATIONS CJ.anitcd - SEC.gov · seeks to expose extreme pay gaps within...
18
TAMMY BALDWIN WISCONSIN CJ.anitcd The Honorable Michael Piwowar Acting Chair WASHINGTON, DC 20510 March 21, 2017 United States Securities and Exchange Commission 100 F Street, NE Washington, DC 20549 Dear Acting Chair Piwowar: COMMITIEES: APPROPRIATIONS COMMERCE HEALTH, EDUCATION, LABOR, AND PENSIONS I write to you today in response to your February 6 1 h.request for comment on the implementation of the pay ratio disclosure rule. As you know, this mandatory rule implements Section 953(b) of the Dodd-Frank Wall Street Refmm and Consumer Protection Act. I am concerned by your decision to further delay implementation of this rule, especially because you seem to be seeking one-sided comments from issuers more than the 18 months since this rule was adopted. While I support a swift implementation of this necessary rule, I will take this opportunity to pass along a comment on the calculation of "estimated fair value" of stock-based executive pay used by the Securities and Exchange Commission. Given the "unanticipated compliance difficulties" encountered by issuers, I have enclosed a recommendation for a simpler executive pay calculation proposed by William Lazonick and Matt Hopkins of the Academic-Industry Research Network. Instead of estimating fair value, these gentlemen suggest that the SEC use the easier and more accurate calculation of "actual realized gains" from stock-based executive pay. In a December 22, 2016 Harvard Business Review aiticle titled, "If the SEC Measured CEO Pay Packages Properly, They Would Look Even More Outrageous," Messr s. Lazonick and Hopkins lay out their case connecting stock-based executive pay to the erosion of the middle class. I ha ve enclosed a copy of that article as well for your review. I look forward to working with you to implement a strong and fair pay ratio disclosure rnle as intended by Congress. 7= yBaldwin United States Senator
Transcript of WISCONSIN APPROPRIATIONS CJ.anitcd - SEC.gov · seeks to expose extreme pay gaps within...

TAMMY BALDWIN WISCONSIN
CJ.anitcd ~tatcs ~cnetc
The Honorable Michael Piwowar Acting Chair
WASHINGTON, DC 20510
March 21, 2017
United States Securities and Exchange Commission 100 F Street, NE Washington, DC 20549
Dear Acting Chair Piwowar:
COMMITIEES:
APPROPRIATIONS
COMMERCE
HEAL TH, EDUCATION, LABOR, AND PENSIONS
I write to you today in response to your February 61h.request for comment on the implementation of the pay ratio disclosure rule. As you know, this mandatory rule implements Section 953(b) of the Dodd-Frank Wall Street Refmm and Consumer Protection Act.
I am concerned by your decision to further delay implementation of this rule, especially because you seem to be seeking one-sided comments from issuers more than the 18 months since this rule was adopted.
While I support a swift implementation of this necessary rule, I will take this opportunity to pass along a comment on the calculation of "estimated fair value" of stock-based executive pay used by the Securities and Exchange Commission. Given the "unanticipated compliance difficulties" encountered by issuers, I have enclosed a recommendation for a simpler executive pay calculation proposed by William Lazonick and Matt Hopkins of the Academic-Industry Research Network. Instead of estimating fair value, these gentlemen suggest that the SEC use the easier and more accurate calculation of "actual realized gains" from stock-based executive pay.
In a December 22, 2016 Harvard Business Review aiticle titled, "If the SEC Measured CEO Pay Packages Properly, They Would Look Even More Outrageous," Messrs. Lazonick and Hopkins lay out their case connecting stock-based executive pay to the erosion of the middle class. I have enclosed a copy of that article as well for your review.
I look forward to working with you to implement a strong and fair pay ratio disclosure rnle as intended by Congress.
~Sincer~J.l ~ 7=yBaldwin
United States Senator

March 20, 2017
William Lazonick and Matt Hopkins The Academic-Industry Research Network (www.theAIRnet .org) Contact William Lazonick: [email protected]
Comment on the SEC Pay Ratio Disclosure Rule
Why we want a CEO-to-worker pay ratio
In August 2015 the Securities and Exchange Commission (SEC) determined that
beginning in January 2017 under the Pay Ratio Disclosure Rule (PRDR} each U.S. public
corporation must publish annually the ratio of the pay of its CEO to that of its median worker.1
The new SEC disclosure requirement implements a section of the Dodd-Frank Act of 2010 that
seeks to expose extreme pay gaps within corporations, track them over time, and permit cross-
company comparisons of CEO-worker inequality.2
A civilized society seeks to attain the socioeconomic goals. of stable and equitable
economic growth, or what can be called "sustainable prosperity." Through economic growth
based on rising levels of productivity, a society generates the possibility of higher living
standards for its people. But we also want economic growth to be stable over time, avoiding
severe downturns that cause hard-working people to lose their jobs and bubble-like booms that
cause overly-optimistic people to take on unsustainable debt. And we want economic growth
to be equitable so that those workers, taxpayers, and financiers who contribute to the process
of growth receive their fair shares of the returns.
Much if not most of the processes of generating economic growth, managing its
1 "SEC Adopts Rule for Pay Ratio Disclosure," Securities and Exchange Commission press release, August 5, 2015, at https://www.sec.gov/news/pressrelease/2015-160.html.
2 U.S. Congress, Dodd-Frank Wall Street Reform and Consumer Protection Act, January 5, 2010, H.R. 4173-529, referring to section 229.402(c)(2)(x) of title 17, Code of Federal Regulations, at https://www.law.cornell.edu/cfr/text/17/229.402.

Lazonick and Hopkins: Comment on the SEC Pay Ratio Disclosure Rule 2
stability, and sharing its gains occur within business corporations that develop and utilize the
society's productive resources. In the economy of the United States, productivity, employment,
and earnings depend heavily on the resource-allocation decisions made by the CEOs and their
senior-management teams at a relatively small number of very large companies.3 In 2012, 1,909
companies that had 5,000 or more employees in the United States, with an average workforce
of 20,366, were only 0.033 percent of all U.S. businesses. But, with the business sector
representing 81 percent of the total employed civilian labor force, these 1,909 companies had
11 percent of all establishments, 34 percent of employees, 38 percent of payrolls, and 44
percent of revenues.4 In addition, the prosperity of hundreds of thousands of smaller firms
rel ies on the continued success of these large firms.
In the United States, income inequality is inordinately high, with an increasing
concentration of income among the richest 0.1 percent of households.s The remuneration of
the senior corporate executives of the largest companies makes them well-represented among
the top 0.1%.G More generally, academic research shows that the source of much of that
inequality can be found in the ways in which the nation's largest business corporations govern
the allocation of resources and employ their labor forces. In principle, therefore, it can be
3 William Lazonick, "Labor in the Twenty-First Century: The Top 0.1% and the Disappearing Middle Class," In Christian E. Weller, ed., Inequality, Uncertainty, and Opportunity: The Varied and Growing Role of Finance in Labor Relations, Cornell University Press, 2015: 143-192.
4 For 964 companies with 10,000 or more employees In 2012, these shares were nine percent of establ ishments, 28 percent of employees, 31 percent of payrolls, and 36 percent of revenues. United States Census Bureau, "Statistics of U.S. Businesses (SUSB)," Data on "2012 SUSB Annual Data Tables by Establishment Industry" at https://www.census.gov/data/tables/2012/econ/susb/2012-susb-annual.html. The most recent data for 2014 (which do not include revenues) show that 1,986 firms w it h 5,000 or more employees and 994 firms with 10,000 or more employees had slightly larger shares of establishments, employees, and payrolls than the largest firms in 2012: https://www.census.gov/data/tables/2014/econ/susb/2014-susb-annual.html.
s "The World Wealth and Income Database: http://topincomes.parisschoolofeconomics.eu/ltDatabase: United States, Top 0.1%
income composition. 6 William Lazonick, "The Value-Extracting CEO: How Executive Stock-Based Pay Undermines Investment in Productive
Capabilities," Inst itute for New Economic Thinking Working Paper No. 54, December 4, 2016, at https://www.ineteconomics.org/research/research-papers/the-value-extracting-ceo-how-executive-stock-based-payundermines-investment-in-productive-capabilities.

Lazonick and Hopkins: Comment on t he SEC Pay Ratio Disclosure Rule
useful to the quest fo r sustainable prosperity to have an indicator of the extent of inequality
within companies such as the CEO-to-median-worker (CMW) ratio mandated by the Dodd
Frank Act and implemented by the SEC's PRDR. A high and rising CMW ratio could focus policy
makers in business and government on ways in which to decrease it, whi le a falling CMW ratio
could be a barometer of progress in the quest for stable and equitable economic growth.
What is true in principle is not necessarily the case in practice if the CMW ratio that is
adopted is a faulty measure of income inequality. The SEC's PRDR as currently constituted has
three major problems that, in our view, make it a severely fl awed indicator for assessing the
extent of firm-level inequality:
1) The measure of CEO pay that the PRDR requires is an estimated number that often bears
little relation to the actual remuneration that the CEO takes home and reports as taxable
income to the Internal Revenue Service.
2) The PRDR leaves the determination of who represents its "median worker" up to the
discretion of each company, thus negating the use of the CMW ratio as a well-defined
standard and creating problems for cross-company comparability.
3) The ext reme increase in inequality between the pay of senior corporate executives and that
of rank-and-file workers that has occurred since the 1970s means that, implemented at this
late date, the PRDR risks normalizing a CMW ratio that is far too high by historical and
international standards.
3
In this comment, we explain our objections to the SEC's current formulation of the PRDR
on each of these three grounds. Then we present the latest data on the remuneration of the
500 highest-paid CEOs in the United States, demonstrating the way in which the SEC's measure
of CEO pay that enters into the CMW ratio tends to systematically underestimate executive
Lazonick and Hopkins: Comment on the SEC Pay Ratio Disclosure Rule 4
pay. The crucial point is that the SEC uses an "estimated fair value" (EFV) measure of stock-
based executive pay, which is a fiction, while ignoring the actual realized gains (ARG) from
stock-based executive pay. ARG is a measure that both is known and is a fact. Realized gains
from stock-based pay, not estimates, are dollars that executives (and other employees)
actually take home and on which they pay taxes in their income-tax filings.7
We argue that, as a first step in remedying these problems, the SEC should reject the
fictitious EFV accounting measures of stock-based remuneration in favor of ARG measures that
represent the amounts of money that an employee, including the CEO and other senior
executives, takes home from his or her stock-based pay. Knowledge of ARG permits an analysis
of why senior-executive pay has exploded over the past four decades, exposing the
"financialization" of the corporation as the overriding culprit and the phenomenon of stock
buybacks as a potent, but illegitimate, means for increasing executive pay.
More than that, a focus on stock buybacks is integral to an explanation of why the real
incomes of rank-and-file workers have stagnated since the late 1970s. Stock buybacks that
boost executives' stock-based compensation often come at the expense of the employment
security, career advancement, and earnings increases of the company's labor force. The
propensity of corporate executives to allocate corporate cash to stock buybacks is integral to
understanding how concentration of income among the top 0.1% and stagnant earnings of
1 Matt Hopkins and William Lazonick, "The Mismeasure of Mammon: The Uses and Abuses of Executive Pay Data," Institute fo r New Economic Thinking Working Paper No. 49, at https://www.ineteconomics.org/research/research-papers/themismeasure-of-mammon-uses-and-abuses-of-executive-pay-data; William Lazonick and Matt Hopkins, "Corporate executives are making way more money than anyone reports," The Atlantic, September 15, 2016, at http://www. theatla ntic.com/busi ness/a rch ive/2016/09/executives-ma king-way-more-than-reported/ 499850/; W illiam Lazonick and Matt Hopkins,_"lf the SEC measured CEO pay packages properly, they would look even more outrageous," Harvard Business Review Blog, December 22, 2016, at https://hbr.org/2016/12/if-the-sec-measured-ceo-pay-packagesproperly-they-wou Id-look-even-more-outrageous.

Lazonick and Hopkins: Comment on t he SEC Pay Ratio Disclosure Rule S
most workers have been two sides of the resource-allocation coin. As a result, the .rise in he
CMW ratio may be driven by both manipulative boosts to the numerator and financialized
suppression of the denominator.
Three fundamental problems with the SEC's Pay Ratio Disclosure Rule
1) The CEO pay numbers that the SEC mandates for use in the CMW ratio are "estimated fair
value,, (EFV) measures: They represent a hypothetical "before the fact,, calculation of what
the CEO might eventually gain upon cashing in the stock options and stock awards that, for
the highest paid, make up the overwhelming majority of his or her remuneration. Yet we
know the actual realized gains (ARG) from stock-based pay that the company's CEO takes
home, puts in the bank, and on which he or she is obligated to pay income taxes. Each
publicly listed company reports both ARG and EFV measures of the stock-based pay of its
CEO in the proxy statement that it files with the SEC in advance of its annual meeting of
shareholders. And, for reasons explained below, ARG tends to be significantly higher than
EFV, especially when the stock market is booming. Whether ARG or EFV measures are used,
'the stock-based components of executive pay tend to make up the lion's share of the total
remuneration of the highest-paid senior executives. Yet the EFV measures obscure the
effect that actual stock-price performance has on the amount of remuneration that an
executive actually receives.
2) If the measure of CEO pay is highly problematic in the SEC' PRDR calculation, so too is the
median-worker earnings measure. Most companies currently provide little public
information about the pay of their workers; even total payroll numbers are usually buried in
the "general a·nd administrative" and "research and development" expense items in the 10-
K income statement. The PRDR accords substantial flexibility to each company in how it

Lazonick and Hopkins: Com ment on the SEC Pay Ratio Disclosure Rule 6
calculates median employee pay, using "any consistently-applied compensation measure
from compensation amounts reported in its payroll or tax records."s That means that the
pay ratios will not be inherently comparable across companies. And in technology
companies that have broad-based stock-option plans even the number that is used for the
pay of the median worker is likely to be based on the fictitious EFV measures. Or it may be
that, in accordance with the current PRDR guidelines, a company with a rising stock price
may choose to report a lower CMW rat io by using EFV measures for the CEO but ARG
measures for the stock-based pay of its employees.
3) A third big problem-which would exist even if the EFV calculation were an accurate
measure of CEO pay, which it is not-is that the SEC's PRDR would normalize CEO-to-worker
pay ratios that are already much too high. Last December the city of Portland, Oregon,
passed a law that will impose a surcharge on the local business taxes paid by corporations
that operate in the city when (using the CMW ratio published under the PRDR) the CE O's
compensation is 100 times or more the median earnings ofthe company's employees.9 But
a CMW ratio of 100:1 accepts as reasonable a pay gap that is far too w ide. In the early
1990s, when concern about excessive executive pay became a hot politica l issue in t he
United States, a ratio of 100:1 compared unfavorably with the ratios in the vicinity of 20:1
that were said to prevai l in Japan, Germany, and France.10 Indeed, in the 1980s Peter
Drucker, the management expert who correctly understood that the purpose of the
business corporation is to produce an innovative product rather than profits for
a "SEC Adopts Ru le for Pay Ratio Disclosure" 9 Gretchen Morgenson, "Portland adopts surcharge on CEO pay in move versus income inequality," New York Times,
December 7, 2016, at https://www.nytimes.com/2016/12/07 /business/ economy/portla nd-oregon-tax-executive-pay .htm I. 10 Graef S. Crystal, In Search of Excess: The Overcompensation of the American Executive, Norton, 1991. See also Roberto S.
Ferdman, "The pay gap between CEOs and workers is much worse than you realize," Washington Post, September 25, 2014.

Lazonick and Hopkins: Comment on the SEC Pay Ratio Disclosure Rule
shareholders, put forward 20:1 as a sufficiently high ratio for any company in any country,
including the United States.11 The implementation of the PRDR should explicitly
acknowledge that this indicator is required because income inequality within business
corporations has long since gotten out of control.
Measure fact, not fiction
The EFV measures of CEO stock-based pay that are to be used in complying with the
PRDR are flawed to the point of being fictitious because the formulae by which they are
estimated fail to capture sign ificant changes that can, and often do, take place in a company's
stock price over time. Yet it is significant changes in the company's stock price that are the
prime determinants of a CEO's ARG compensation from exercising stock options and the
vesting of stock awards. In the case of stock options, the EFV formula is typically a Black
Scholes-Merton option-pricing model that, rooted in the "efficient-markets hypothesis,"
assumes that changes in a company's stock-price exhibit a log-normal distribution and thus
predicts that most stock-price changes will be very small.
7
As such, an EFV measure of the remuneration from a stock option will be exceeded in the
future by ARG as a result of significant stock-price increases. And given that stock options often
expire ten years from the grant date, the executive who holds the option has a very long
"window" during which he or she can wait for the company's stock price to rise. Moreover,
once a stock option vests (usually one to four years after the grant date), the executive will
have years during which he or she can choose the precise day to exercise the option with a view
to realizing gains from stock-price increases, even if those increases are only temporary. That
bump to their ARG is the main reason why senior executives who make stock-buyback decisions
11 Drucker Inst itute, "Turning up the heat on executive pay," press release, February 17, 2011.
Lazonick and Hopkins: Comment on the SEC Pay Ratio Disclosure Rule 8
are highly appreciative of the manipulative boosts to stock prices that buybacks achieve.
In the case of stock awards, the executive's ARG is the actual number of shares received
when an award vests multiplied by the vesting-date stock price. A Black-Scholes-Merton-type
option-pricing model is not used to calcu late EFV of stock awards. Rather EFV for stock awards
is derived by multiplying the number of shares in the award by the grant-date stock price,
recorded as the executive's EFV award income on the vesting date. Hence EFV for stock awards
automatical ly excludes from the calculation extra stock-based gains that accrue when the
actual vesting-date stock price is higher than the grant-date stock price. In addition, many
companies reward executives with extra shares when they hit prescribed financial metrics
related to the company's stock price, thus increasing potential ARG when stock prices are rising.
Therefore, as with the EFV of stock options, the EFV of stock awards systematically
excludes the impacts of significant stock-price increases on the CEO's take-home pay. Yet the
whole point of stock-based pay is to incentivize and reward the CEO and other senior
executives for making resource-allocation decisions that boost the company's stock price. And,
increasingly, to boost stock prices, senior executives allocate corporate resources to buybacks
so that they can realize more gains from their stock-based pay.
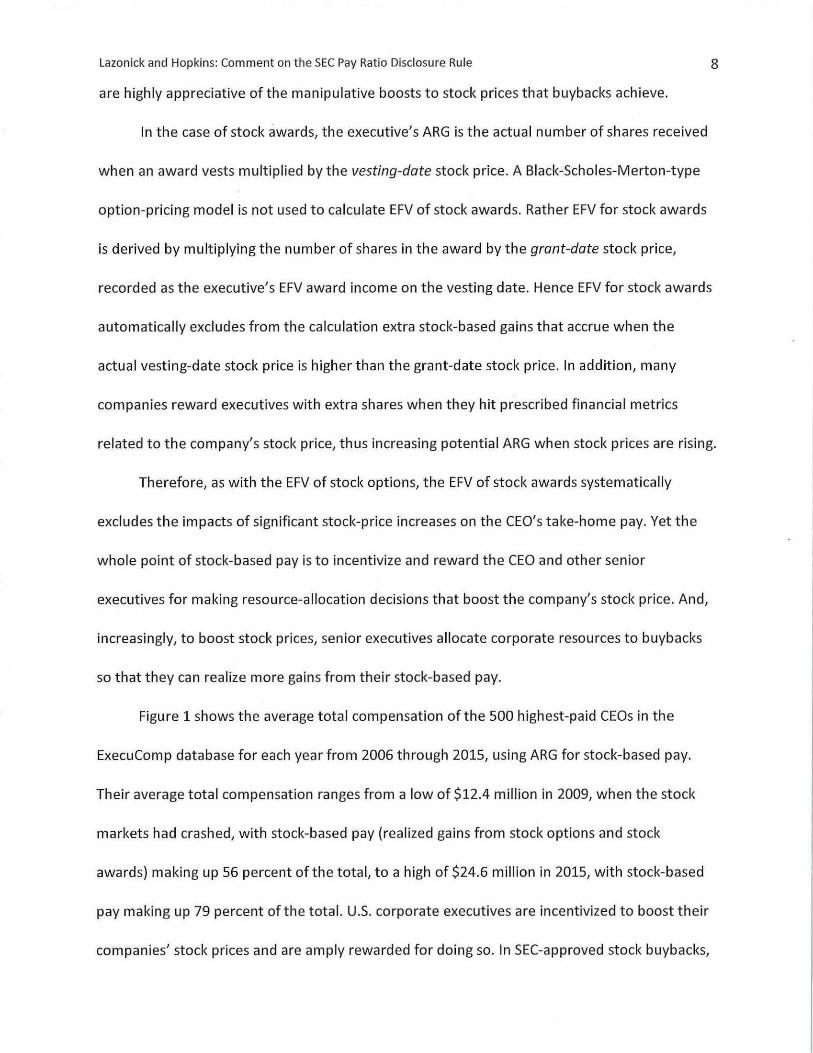
Figure 1 shows the average total compensation of the 500 highest-paid CE Os in the
ExecuComp database for each year from 2006 through 2015, using ARG for stock-based pay.
Their average total compensation ranges from a low of $12.4 million in 2009, when the stock
markets had crashed, with stock-based pay (realized gains from stock options and stock
awards) making up 56 percent of the total, to a high of $24.6 million in 2015, with stock-based
pay making up 79 percent of the total. U.S. corporate executives are incentivized to boost their
companies' stock prices and are amply rewarded for doing so. In SEC-approved stock buybacks,

Lazonick and Hopkins: Comment on the SEC Pay Ratio Disclosure Rule
they have at their disposal an instrument to enrich themselves.12
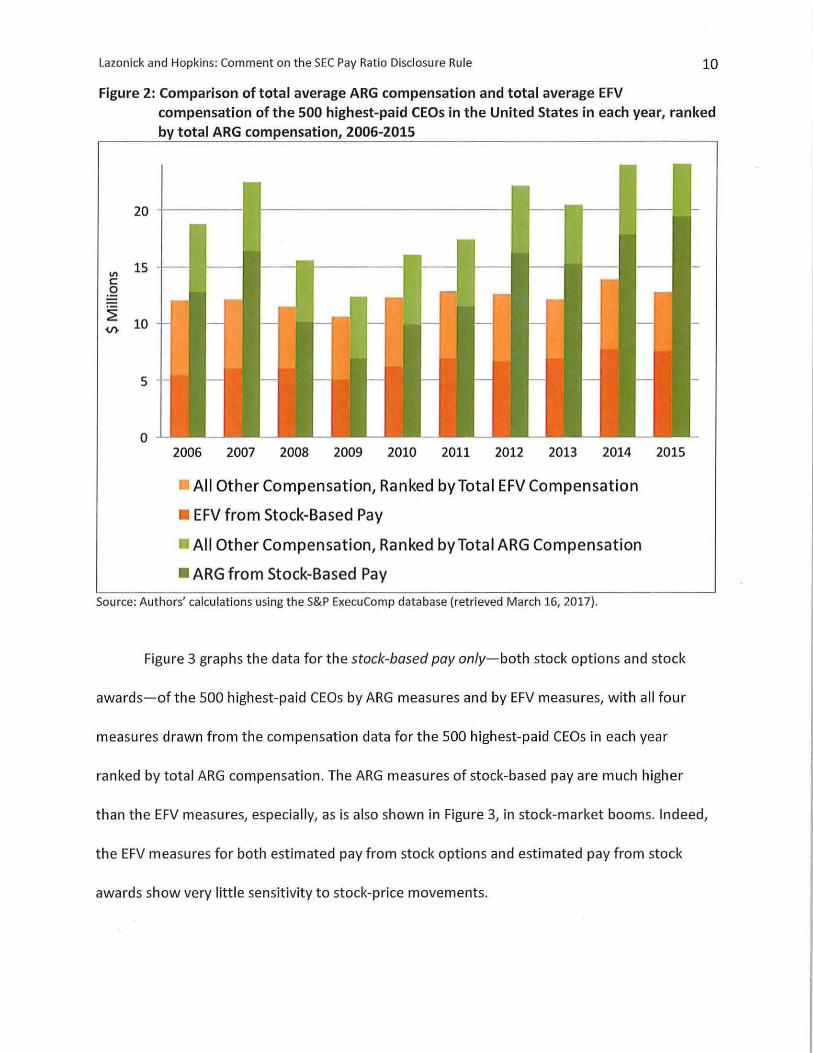
Especially when the stock market is on the rise, total ARG compensation tends to be
much higher than total EFV compensation. As shown in Figure 2, for each of the years 2006
through 2015 the average total compensation of the 500 highest-paid U.S. CE Os using ARG
numbers was greater than the average total compensation of the 500 highest-paid CE Os using
EFV measures, and markedly so in the periods 2006-2007 and 2012-2015, when the stock
markets were booming.
Figure 1: Average total compensation and cumulative percentage shares of pay components, 500 highest-paid CEOs in the United States in each year, ranked by total ARG
compensation, 2006-2015
100%
(.!) a:: 90% -<t ro ..... t2 80%
'O 70% ..... c Q) u 60% -.... Q) a.. VI 50% ro > &. 40% ...... 0 VI ..... 30% c Q) c 20% 0 a. E 10% 0 u
0%
2006 2007 2008 2009 2010 2011 2012 2013 2014
Dlncrease in Pension Value or Deferred Benefits • Other
- salary
50
45
40
35 VI .... ro
30 0 0
- 25 'O VI c
20 .Q
15~
10
5
0 2015
- Bonus
DNonequity
D Realized Gains from Stock Options Exercised
DRealized Gains from Stock Awards that Vested
-Avg Total ARG Pay
Source: Authors' calculations using the S&P ExecuComp database (retrieved March 16, 2017).
9
12 William Lazonick, "Profits Without Prosperity: Stock Buybacks Manipulate the Market and Leave Most Americans Worse Off," Harvard Business Review, September 2014, 46-55, at https://hbr.org/2014/09/ profits-without-prosperity
Lazonick and Hopkins: Comment on the SEC Pay Ratio Disclosure Rule 10
Figure 2: Comparison of total average ARG compensation and total average EFV compensation of the 500 highest-paid CEOs in the United States in each year, ranked by total ARG compensation, 2006-2015
20
Ill 15 c 0
·-~
10 V).
5
0 2006 2007 2008 2009 2010 2011 2012 2013 2014 2015
All Other Compensation, Ranked by Total EFV Compensation
• EFV from Stock-Based Pay
• All Other Compensation, Ranked by Total ARG Compensation
• ARG from Stock-Based Pay
Source: Authors' calculations using the S&P ExecuComp database (retrieved March 16, 2017}.
Figure 3 graphs the data for the stock-based pay only-both stock options and stock
awards-of the 500 highest-paid CE Os by ARG measures and by EFV measures, with all four
measures drawn from the compensation data for the 500 highest-paid CEOs in each year
ranked by total ARG compensation. The ARG measures of stock-based pay are much higher
than the EFV measures, especially, as is also shown in Figure 3, in stock-market booms. Indeed,
the EFV measures for both estimated pay from stock options and estimated pay from stock
awards show very little sensitivity to stock-price movements.

Lazonick and Hopkins: Comment on the SEC Pay Ratio Disclosure Rule 11
Figure 3: ARG from stock options and stock awards compared with EFV of stock options and stock awards, 500 highest-paid CEOs in the United States in each year, ranked by total ARG compensation, 2006-2015
18
16
14
12 V'I c 10 .Q
~ 8 V).
6 ·------... .... _____ ... -----------4
2 ------·-------------... -------------·------·------..------... -----0
2006 2007 2008 2009 2010 2011 2012 2013 2014 2015
2500 x Q) -0 c
2000 0 0 l/)
1500
1000
500
0
0... <XS Vl -0
Q) ....., V'I :J .__,
-0 <(
ro :J c c <( Q) b.O ro .... Q)
~
S&P 500 Index -+-ARG from Stock Awards that Vested
- ... ·EFV of Vested Stock Awards --r-ARG from Stock Options Exercised
-..- ·EFV of Vested Stock Options
Source: Authors' calculations using the S&P ExecuComp database (retrieved March 16, 2017).
Here is an example, albeit an extreme one, of the difference that the use of the correct
ARG measure can make. If the PRDR had been in force in 2014 and 2015, Gilead Sciences, a
pharmaceutical company that has been under Congressional investigation for price gouging,13
would have recorded CEO total EFV compensation of about $19 million each year in calculating
the CMW ratio. The actual money-in-the-bank total ARG compensation of its CEO John C.
13 United States Senate Committee on Finance, "Wyden-Grassley Sovaldi Investigation Finds Revenue-Driven Pricing Strategy Behind $84,000 Hepatitis Drug," press release, December 1, 2015, at https://www.finance.senate.gov/ranking-membersnews/wyden-grassley-sovaldi-investigation-finds-revenue-driven-pricing-strategy-behind-84-000-hepatitis-drug.

Lazonick and Hopkins: Comment on the SEC Pay Ratio Disclosure Rule 12
Martin was, however, $193 million in 2014 and $232 million in 2015. The $38 million in pay
attributed to Martin over the two years would have been fiction; the $425 million in pay that he
took home is fact-and Gi lead's actual CMW ratio would have been ten to twelve times the
ratio that the SEC PRDR would have required Gilead to report.14
So we know what CEOs actually make from stock-based pay. Yet virtually everyone,
including not only the SEC in its PRDR but also labor unions11s progressive think tanks,16 and the
media,11 uses EFV measures. Why? As we explain in our report "The Mismeasure of Mammon:
Uses and Abuses of Executive Pay Data," since 2006 the SEC has privileged the EFV numbers in
the Summary Compensation Table of proxy statements, requiring that the EFV measure be used
to calculate total annual compensation of the named executives. Hence these EFV measures
are the government-approved numbers used by almost anyone interested in current levels of
executive compensation. The ARG numbers are reported in a subsidiary table in the proxy
statement, where they typically go unnoticed. The SEC could easily fix the problem by placing
the ARG facts, instead of the EFV fictions, in the Summary Compensation Table. Or, using
Standard & Poor's ExecuComp database as we have done, analysts who are aware of what is
fact and what is fiction cou ld calculate total executive compensation using the valid ARG
variables for stock options and stock awards.1s
14 More generally, for executive pay in the U.S. pharmaceutical industry, see William Lazonick, Matt Hopkins, Ken Jacobson, Mustafa Erdem Sa kin~, and Oner Tulum, "U.S. Pharma's Business Model: Why It Is Broken, and How It Can Be Fixed," in David Tyfield, Rebecca Lave, Samuel Randalls, and Charles Thorpe, eds., The Routledge Handbook of the Political Economy of Science, Routledge,2017.
1s AFL-C/O Executive Paywatch, at http://www.aflcio .org/Corporate-Watch/Paywatch-2016. 16 Sarah Anderson, "Historic CEO pay tax proposa l passes in Portland," Inst itute for Policy Studies, December 15, 2016, at
http://www.ips-dc.org/historic-ceo-pay-tax-proposal-passes-portland/. 11 David Gelles, "Top CEO pay fell -yes, fell-in 2015," New York Times, May 27, 2016, at
https://www. nyti mes .co m/2016/05/ 29/busi ness/to p-ceo-pay-fe 11-yes-fel 1-i n-2015. html? r=O. rn Hopkins and Lazonick, "The Mismeasure of Mammon."

Lazonick and Hopkins: Comment on the SEC Pay Ratio Disclosure Ru le 13
ARG pay and the legalized looting of the U.S. business corporation
As a growing body of research demonstrates,19 the possibility of increasing their ARG on
stock options and stock awards can incentivize executives to do stock buybacks, price gouge,
send production and research offshore, lay off workers, make M&A deals for purposes of value
extraction rather than value creation, dodge taxes, engage in false financial reporting, etc., al l
for the sake of boosting the company's stock price.20 Stock buybacks are a particularly effective
way in which a CEO can use corporate cash to give manipulative boosts to stock prices that
redound to the benefit of his or her take-home pay. If we are concerned with not only how
much CE Os get paid but also how the ways in which they get paid influence how they allocate
corporate resources, then ARG compensation is the only measure of CEO pay that anyone
should use.21
As our research has shown, business corporations in which senior executives make
resource-allocation decisions incentivized by stock-based pay are at the core of the integrally
related problems of concentration of income among the richest households and the decades-
long erosion of middle-class jobs in the United States.22 That is where the income-inequality
action is, with the modes of compensating senior executives serving as the fulcrum. Any
government agency, civil-society organization, or news publication interested in knowing how
much a CEO actually gets paid, either absolutely or relative to the company's rank-and-file
employees, should start using the ARG measure of executive compensation.
That includes the SEC itself, which, in this regard, has been since 2006 the purveyor of
19 Lazonick, "Labor in the Twenty-First Century." 20 Lazonick, "Profits Without Prosperity"; Lazonick, "The Value-Extracting CEO." 21 Lazonick, "Profits Without Prosperity"; William Lazonick, "Stock Buybacks: From Retain-and-Reinvest to Downsize-and
Distribute," Center for Effective Public Management, Brookings Institution, April 2015, pp. 10-11, at http://www. broo kings .edu/resea rch/pa pe rs/2015/04/17-stock-buybacks-lazo nick.
22 Lazonick, " Labor in the Twenty-First Century."

Lazonick and Hopkins: Comment on the SEC Pay Ratio Disclosure Ru le 14
EFV measures that we should start labelling "fake news." The PRDR is a good idea. But it must
be based on the actual, not fictitious pay of CEOs as well as a standard for determining median
worker pay that is consistent across companies. And it should be recognized that it is the kind
of information that the public should have been getting from companies some four decades
ago, before extreme income inequality had became an economic plague.

Harva d Business Review
EXECUTIVE COMPENSATION
l'f:thedS'!e·Me~sarett"eEO Pay Packages Properly, They Would Look Even More Outrageous by William Lazonick and Matt Hopkins
DECEMBER 22, 2016
On December 7, Portland, Oregon, passed a law that will impose a surcharge on the local business
taxes paid by corporations that operate in the city when the CEO's compensation is 100 times or
more the median earnings of the company's employees. To monitor this ratio, the Portland law will

exhibit a log-normal distribution and thus predicts that most stock-price changes will be very small.
Inherent in this model is the prediction that an executive will have little opportunity to reap
significant ARG in exercising options in the future.
JA~~~W~Wifrwqlq:~\fPiiy%dJ1~~&~jf.W~~d§t~~t9'€=~ fJl~m.ber of shares received when an
2Wat~~§ts multiplied by the vesting-date stock price. But EFV for stock awards multiplies the
number of shares granted by the grant-date stock price, automatically excluding from the calculation
extra stock-based gains that could accrue because of a higher stock price when the award vests in
the future. In addition, many companies reward executives with extra shares when they hit
prescribed financial metrics, augmenting potential ARG not captured in EFV.
Especially when the stock market is on the rise, total ARG compensation tends to be much higher
than total EFV compensation. As shown in the exhibit below, for each of the years 2006 through
2015 the average total compensation of the 500 highest-paid U.S. executives using ARG numbers
was greater than the average total compensation of the 500 highest paid using EFV measures, and
markedly so in 2006-2007 and 2012-2015, when the stock markets were booming.
When ranked by the highest ARG compensation, in 2015 average total ARG compensation of the 500
highest paid was $32.6 million with 82% from stock-based pay, while these 500 executives
registered total EFV compensation that averaged just $13.2 million (57% from stock-based pay).
When ranked by the highest EFV compensation, in 2015 the average total EFV compensation of the
500 highest paid was $17 .1 million (62% from stock-based pay), while total ARG compensation for
these executives actually averaged $23.5 million (70% from stock-based pay).
In the presence of stock-market volatility, EFV measures of stock-based pay misrepresent the
amount of money that executives actually make. As one extreme but important example, ifthe Pay
Ratio Disclosure Rule had been in force in 2014 and 2015, Gilead Sciences, a pharmaceutical
company that has been under Congressional investigation for price gouging, would have recorded
CEO total EFV compensation of about $19 million each year in calculating the ratio. The actual
money-in-the-bank total ARG compensation of its CEO John C. Martin was, however, $193 million in
2014 and $232 million in 2015. The $38 million in pay attributed to Martin over the two years would

The SEC could easily fix the problem by placing the ARG facts, instead of the EFV fictions, in the
Summary Compensation Table. Or, using Standard & Poor's ExecuComp database as we have done,
analysts who are aware of what is fact and what is fiction could calculate total executive
compensation using the valid ARG variables for stock options and stock awards.
If the SEC Measured CEO Pay Packages Properly, They Would Look Even More
~igtaa§~ng body of research demonstrates, ARG on stock options and stock awards can incentivize
executives to do buybacks, price gouge, offshore, lay off workers, do financially driven M&A deals,
dodge taxes, engage in false financial reporting, and so on, all for the sake of boosting the company's
stock price. Stock buybacks are a particularly effective way in which a CEO can use corporate cash to
give manipulative boosts to stock prices that redound to the benefit of his or her take-home pay. If
we are concerned with not only how much CEOs get paid but also how the ways in which they get
paid influence how they allocate corporate resources, then ARG compensation is the only measure
of CEO pay that anyone should use.
As our research has shown, business corporations in which senior executives make resource
allocation decisions incentivized by stock-based pay are at the core of the integrally related
problems of concentration of income among the richest households and the decades-long erosion of
middle-class jobs in the United States. That is where the income-inequality action is, with the
modes of compensating senior executives serving as the fulcrum. Any government agency, civil
society organization, or news publication interested in knowing how much a CEO actually gets paid,
either absolutely or relative to the company's rank-and-file employees, should start using the ARG
measures of executive compensation. That includes the SEC itself, which, in this regard, has been
since 2006 the purveyor of EFV measures that we should start labelling "fake news!'
William Lazon ick is a professor of economics at the University of Massachusetts Lowell, the
codirector of its Center for Industrial Competitiveness, and the president of the Academic- Industry
Research Network. His book Sustainable Prosperity in the New Economy? Business Organization and
High-Tech Employment in the United States won the 2010 Schumpeter Prize.