Wireless Communications and Cellular Network …dtipper/2700/2700_Slides4K.pdf · Telcom 2700...
19
Wireless Communications and Wireless Communications and Cellular Network Cellular Network Fundamentals Fundamentals David Tipper Associate Professor Associate Professor Graduate Telecommunications and Networking Program University of Pittsburgh Telcom 2700 Slides 4 Telcom 2700 Slides 4 Cellular Concept Proposed by Bell Labs 1971 Geographic Service divided into smaller “cells” smaller “cells” Neighboring cells do not use same set of frequencies to prevent interference Often approximate coverage Telcom 2700 2 Often approximate coverage area of a cell by a idealized hexagon Increase system capacity by frequency reuse.
Transcript of Wireless Communications and Cellular Network …dtipper/2700/2700_Slides4K.pdf · Telcom 2700...

Wireless Communications and Wireless Communications and Cellular Network Cellular Network
FundamentalsFundamentals
David TipperAssociate ProfessorAssociate Professor
Graduate Telecommunications and Networking ProgramUniversity of PittsburghTelcom 2700 Slides 4Telcom 2700 Slides 4
Cellular Concept
Proposed by Bell Labs 1971 Geographic Service divided into smaller “cells”smaller “cells”
Neighboring cells do not use same set of frequencies to prevent interference
Often approximate coverage
Telcom 2700 2
Often approximate coveragearea of a cell by a idealizedhexagon
Increase system capacityby frequency reuse.

Cellular Networks
• Propagation models represent cell as a circular area
• Approximate cell coverage with a hexagon - allows easier analysis
• Frequency assignment of F MHz for the system
• The multiple access techniques translates F to T traffic channels
• Cluster of cells K = group of adjacent cells which use all of the systems frequency assignment
Telcom 2700 3
Cellular Concept
• Why not a large radio tower and large service area?– Number of simultaneous users would be very limited
(to total number of traffic channels T)( )– Mobile handset would have greater power requirement
• Cellular concept - small cells with frequency reuse– Advantages
• lower power handsets• Increases system capacity with frequency reuse
– Drawbacks:
Telcom 2700 4
• Cost of cells• Handoffs between cells must be supported• Need to track user to route incoming call/message

Cellular Concept (cont)• Let T = total number of duplex channels
K cells = size of cell cluster (typically 1, 4, 7,12, 21)
N = T/K = number of channels per cellN = T/K = number of channels per cell
• For a specific geographic area, if clusters are replicated M times, then total number of channels – system capacity = M x T
Choice of K determines distance between cells
Telcom 2700 5
– Choice of K determines distance between cells using the same frequencies – termed co-channel cells
– K depends on how much interference can be tolerated by mobile stations and path loss
Cell Design - Reuse Pattern
• Example: cell cluster size K = 7, frequency reuse factor = 1/7, assume T = 490 total ,channels, N = T/K = 70 channels per cell
BCG B
B
A
E
C
D
G
F
Assume T = 490 total channels,K = 7, N = 70 channels/cell
Clusters are replicated M=3 times
Telcom 2700 6
A
E
C
D
G
F
B
A
E
C
D
G
FSystem capacity = 3x490 = 1470 total channels

Cluster Size
1
11
From geometry of grid of hexagons only certain values of K are possible if replicating cluster with out gaps
31
42
6 75
1
1
1
1
K = 7 (i =2, j =1)2
98
71
3
1011
12
65
8
7
124
5
3
1011
12
g pK = i2 + ij + j2 where i and j are non-negative integers
Telcom 2700 7
132
43 1
42
12
34
1K = 4 (i =2, j=0)
61 12
45
69
8
124
910
11 K = 12 (i=2, j=2)
Cellular Concepts
• To find co-channel neighbors of a cell, move i cells along any chain of hexagons, turn 60 degrees counterclockwise, and move j cells (example: i=2, j=2, K=12)
Telcom 2700 8
K = i2 + ij + j2
r = cell radiusArea of hexagon = 2.61 r2
d = distance to co-channel cell

Cellular Concepts
• From hexagonal geometry
• The quantity d/r is called the co-channel reuse ratioKrd 3
Krd 3/
Telcom 2700 9
K = i2 + ij + j2
r = cell radiusArea of hexagon = 2.61 r2
d = distance to co-channel cell
Frequency ReuseSITE A SITE BRSSI, dBm
-60
C/I
-90
120
Telcom 2700 10
Distance
r
d
-120

Frequency Reuse
A
B
A
BRelate cluster size to carrier to co-channel interference ratio C/I at the edge of a cell
A
B
B
A
A
B
B
A
B
Ag
propagation model of the form
Pr = Pt Ld-
L = constant depending on frequency,d = distance in meters, = path loss coefficient, Then at edge of a cell in center of
t k th C/I i i b
Telcom 2700 11
AA
K = 19
network the C/I is given by
d
r
LdP
LrP
I
C
tij
t
6
16
Frequency Reuse
Solving for d/r results in
/16 Cd
Example: Consider cellular system with a C/I requirement of C/I = 18 dB and a suburban
Remember , which results in
6
I
C
r
dpropagation environment with = 4 , determine the minimum cluster size. 18 dB 18 = 10log(x) 1.8 = log(x) x = 101.8 X = 63.0957,
K 1/3 (6 63 0957)0 5
Krd 3/
Telcom 2700 12
K = 1/3 x (6 x 63.0957)0.5 = 6.4857 ,
Since K must be an integer round up to nearest feasible cluster size => K = 7
/26
3
1
I
CK

Frequency Assignment
• Typical C/I values used in practice are 13-18 dB.
• Once the frequency reuse cluster size K determined frequencies
Example: You are operating a cellular network with 25KHz NMT traffic channels 1 through 12. Labeling the traffic channels as {f1, f2, f3, f4, f5, f6, f7, f8, size K determined frequencies
must be assigned to cells • Must maintain C/I pattern
between clusters.• Within a cluster – seek to
minimize adjacent channel interference
• Adjacent channel interference is interference from frequency
f9, f10, f11, f12} Place the traffic channels in the cells below such that a frequency reuse cluster size of 4 is used and adjacent channel interference is minimized
Telcom 2700 13
interference from frequency adjacent in the spectrum
f2f1
Sectoring1
23
21
3• Sectoring
• used to improve the C/I ratio
120 sectoring
• make cluster size K smaller
• Use directional antennas rather than omni-directional• cell divided into 3 (120o sectoring) or 6 (60o sectoring) equally sized sectors
• Frequencies/traffic channels assigned to cells must partitioned i t 3 6 di j i t t
Telcom 2700 14
into 3 or 6 disjoint sets
• Reduces the number of co-channel cells causing interference
• Disadvantages: need intra-cell handoff, increases complexity

Sectoring
5
12
32
1
3
43
52
1
67
55
5
55
5
120 sectoring
Telcom 2700 15
5
120o sectoring reduces number of interferers from 6 to 2
Sectored Frequency Planning
• Example: Allocate frequencies for a GSM operator in U.S. PCS B-bl k h 7 llblock who uses a 7 cell frequency reuse pattern with 3 sectors per cell
• Use a Frequency Chart –available from FCC web site
• Groups frequencies into 21 categories Cells A-G and sectors 1-3 in each cell
Telcom 2700 16

Sectored Frequency Planning
• Example: Allocate frequencies for a 1G Analog AMPS operator in cellular B-block who uses a 7 cell frequency reuse pattern with 3 sectors per cell
• Use a Frequency Chart – available from FCC web siteUse a Frequency Chart available from FCC web site– Groups frequencies into 21 categories Cells 1-7 and sectors A-B in each
cell
Telcom 2700 17
Cellular Network Traffic
• Large time of day variations in the traffic
• Spatial variations in the traffic

Traffic Engineering
• Given or N = T/K traffic channels per cell – what is grade of service (GoS) or how many users can be supported for a specific GoSbe suppo ted o a spec c GoS
• Required grade of service?– Usually 1-2% blocking probability during busy hour– Busy hour may be
1. busy hour at busiest cell 2. system busy hour 3. system average over all hours
B i l i ll d T ffi E i i
Telcom 2700 19
• Basic analysis called Traffic Engineering or Trunking – same as circuit switched telephony– use Erlang B and Erlang C Models
Traffic Engineering
• Estimate traffic distribution?– Traffic intensity is measured in Erlangs (mathematician AK Erlang)– One Erlang = completely occupied channel,
Example: a radio channel occupied for 30 min per hour carries 0 5– Example: a radio channel occupied for 30 min. per hour carries 0.5 Erlangs
• Traffic intensity per user AuAu = average call request rate x average holding time = x th
• Total traffic intensity = traffic intensity per user x number of users = Au x nu
• Example 100 subscribers in a cell20 make 1 call/hour for 6 min => 20 x 1 x 6/60 = 2E
Telcom 2700 20
20 make 1 call/hour for 6 min => 20 x 1 x 6/60 = 2E20 make 3 calls/hour for ½ min => 20 x 3x .5/60 = .5E60 make 1 call/hour for 1 min => 60 x 1 x 1/60 = 1E
100 users produce 3.5 E load or 35mE per user
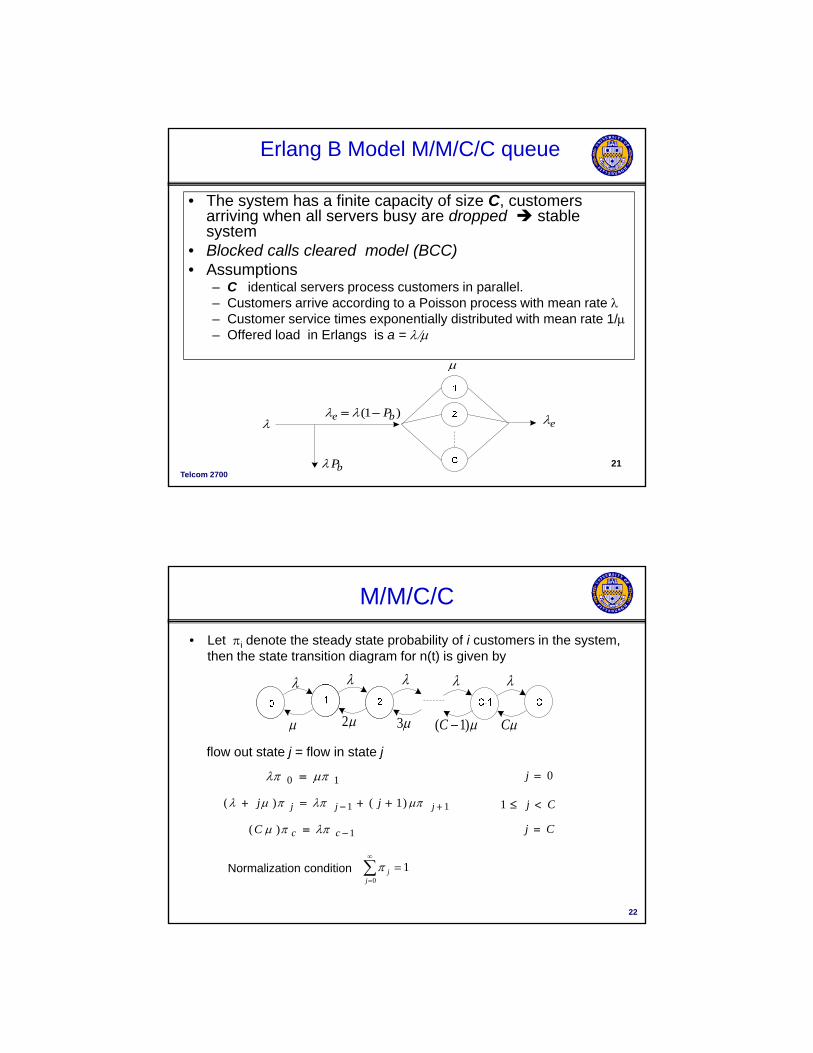
Erlang B Model M/M/C/C queue
• The system has a finite capacity of size C, customers arriving when all servers busy are dropped stable systemBlocked calls cleared model (BCC)• Blocked calls cleared model (BCC)
• Assumptions – C identical servers process customers in parallel.– Customers arrive according to a Poisson process with mean rate – Customer service times exponentially distributed with mean rate 1/– Offered load in Erlangs is a =
Telcom 2700 21
)1( be P
bP
e
M/M/C/C
• Let i denote the steady state probability of i customers in the system, then the state transition diagram for n(t) is given by
32 C)1( C
Cj 111 )1()( jjj jj
10 0j
flow out state j = flow in state j
22
Cj 111 )1()( jjj jj
Cj 1)( ccC
10
jjNormalization condition

M/M/C/C
ca!
Probability of a customer being blocked B(c,a)
c
n
n
na
cacB
0 !
!),(
B(c,a) Erlang’s B formula, Erlang’s blocking formulaErlang B formula can be computed from the recursive formula
),1()(
acBaB
Telcom 2700 23
),1(
),(),(
acBacacB
Usually determined from table or charts – many software programs Example for 100 users with a traffic load of 3.5 E – how many channels are need in a cell to support 2% call blocking ?From Erlang B table with 2% call blocking need 8 channels
Traffic Engineering Erlang B table
Telcom 2700 24

Traffic Engineering
Telcom 2700 25
M/M/C/C
Other performance metrics can be related to Erlang B formula B(c,a)The carried load
)),(1( acBe
)),(1( acBc
ae
)),(1( acBa
L
Effective throughput of the system
Mean server utilization
Mean number in the system
Telcom 2700 26
Average delay in the system1
W

Traffic Engineering Example
• Consider a single analog cell tower with 56 traffic channels, when all channels are busy calls are blocked. Calls arrive according to a Poisson process at a rate of 1 call per active user an hour. During the busy hour 3/4 the users are active The call holding time isbusy hour 3/4 the users are active. The call holding time is exponentially distributed with a mean of 120 seconds.
• (a) What is the maximum load the cell can support while providing 2% call blocking?From the Erlang B table with c= 56 channels and 2% call blocking the maximum load = 45.9 Erlangs
• (b) What is the maximum number of users supported by the cell during the busy hour?
Telcom 2700 27
Load per active user = 1 call x 120 sec/call x 1/3600 sec = 33.3 mErlangsNumber active users = 45.9/(0.0333) = 1377Total number users = 4/3 number active users = 1836
• Determine the utilization of the cell tower c = 45.9/56 = 81.96%
Erlang C M/M/C Model• C identical servers processes customers in parallel.• Customers arrive according to a Poisson process with
mean rate • Customer service times exponentially distributed with
mean rate 1/• Infinite system capacity – all customers are eventually
served – if servers are busy customers queue up• Blocked calls delayed model (BCD)
Telcom 2700 28

M/M/C
The server utilization ()
a
C
The traffic intensity (a) offered load (Erlangs)
The stability requirement
29
y q
CaC
a 1
With traffic intensity a Erlangs, C is the minimum number of servers for stability.
Telcom 2700
M/M/C
Let i denote the steady state probability of i customers in the system, then the state transition diagram for n(t) is given by
3 CC)1( C2
Cj 111 )1()( jjj jj
10 0j
Flow Balance equations
Telcom 2700 30
j11 jjj
Cj 11)( jjj CC
10
jjNormalization condition

M/M/C
c
Probability of a customer being delayed C(c,a) is important metric
1
0 )()!1(!
)()!1(),(
c
n
cn
c
cjj
acca
na
acca
acC
C(c,a) Erlang’s C formula, Erlang’s delay formula
31
In the telephone system, C(c,a) represents a blocked call delayed (BCD)Widely used to determine call center staffing Difficult to compute due to factorials - several software packages built around it (see links on web site) Tables and plots available (table on class web page)
Erlang C model
Tables and plots available

Erlang C Plots
number of servers
C(c
,a)
34
Erlang C Model
Other performance measures expressed in terms of C(c,a)
),(
1
),(
q
q
acCLW
aLL
acCac
aL
Telcom 2700 35
1
q
q
WW
acW

Erlang C model
Distribution of the waiting time in the queue
)1(
),(1
ln
acCp
t p
The pth percentile of the time spent waiting in the queue tp
tcq eacCtwP )1(),(1
Telcom 2700 36
)1( cp
Note: p > 1 - C(c,a)
Traffic Engineering Example 2• A telephone company has five operators to handle inquires for directory
assistance. Inquires arrive according to a Poisson process with an average rate of = 4.5 calls/minute. The time to process an inquiry is exponentially distributed with a mean of 1/ = 1 minute/call. If an arriving call sees all operators busy it is placed on hold until an operator becomes free. (a) What is the probability that a caller will have to wait on hold?
The offered load in Erlangs is 4.5 calls/min * 1 min/call = 4.5 erlangs with 5 operators from the Erlang C graphs given in the class handout the probability a caller will be delayed = C(c,a) = .75 computing an exact value from the Erlang C formula one gets C(5 4 5) = 7625C formula one gets C(5,4.5) .7625
(b) What is the 95 percentile of the time on hold?
note = a/c = 4.5/5 = .9, p = .95
)1(
),(1
ln
c
acCp
t p
yields tp = 5.4491 minutes

Traffic Engineering Example 3
• A service provider receives unsuccessful call attempts to wireless subscribers at a rate of 5 call per minute in a given geographic service area The unsuccessful calls are processed by voice mail andservice area. The unsuccessful calls are processed by voice mail and have an average mean holding time of 1 minute. When all voice mail servers are busy – customers are placed on hold until a server becomes free.
• Determine the minimum number of servers to keep the percentage of customers placed on hold or equal to 1%
The offered load is a = 5 call per minute x 1 minute/call = 5
From the Erlang C tables 13 servers are needed
Telcom 2700 38
From the Erlang C tables 13 servers are needed.
• Determine the .995% of the delay in access the voice servers
• With p = .995, C(c,a) = .01, c = 13, and = 1
)1(
),(
1ln
c
acC
p
t p
yields tp = .0866 minute = 5.2 secs
Summary
• Cellular Concept– Small cells
– Frequency Reuse
• Frequency Planning– Assignment of frequencies to cells
– Maintain C/I requirements
• Traffic Engineering– Erlang B model
– Erlang C model
Telcom 2700 39