


Biodiversity of Fishes Sex under Water Rainer Froese GEOMAR 06.02.14.
Upload
laura-ashley-sparksCategory
view
218download
0
Winners and Losers in the Future Ocean
Insights from Millions of Samples
Rainer Froese
IFM-GEOMAR, Kiel, Germany
EDIT Symposium
18th January 2011
1

Overview
• Millions of points, and then what?
• AquaMaps approach to range maps
• Some example maps
• Species richness map and transect
• MPA planning tool
• Invasives tool
• Winners and losers in the future Ocean
• Conclusions2

2 Million Points in FishBase(in 2000)
3

30 Million Collection Records for 118,000 Species in OBIS
4

GBIF: 260 Million Records
5

So We Have Millions of Points
• Now what?
• Where is the beef?
• Does it explain the origin of the Universe?
• Does it cure cancer?
• Why should I care?
• What‘s the point?
6

Show Species Distribution:60,152 points for Gadus morhua in GBIF
7

Map for Gadus morhua in EOL
8

We Must Do Better
• Gadus morhua, Atlantic Cod, is one of the best known species in the World
• We know its range, ecosystems, countries
• We know its preferences for depth, habitat, temperature, salinity, ...
9
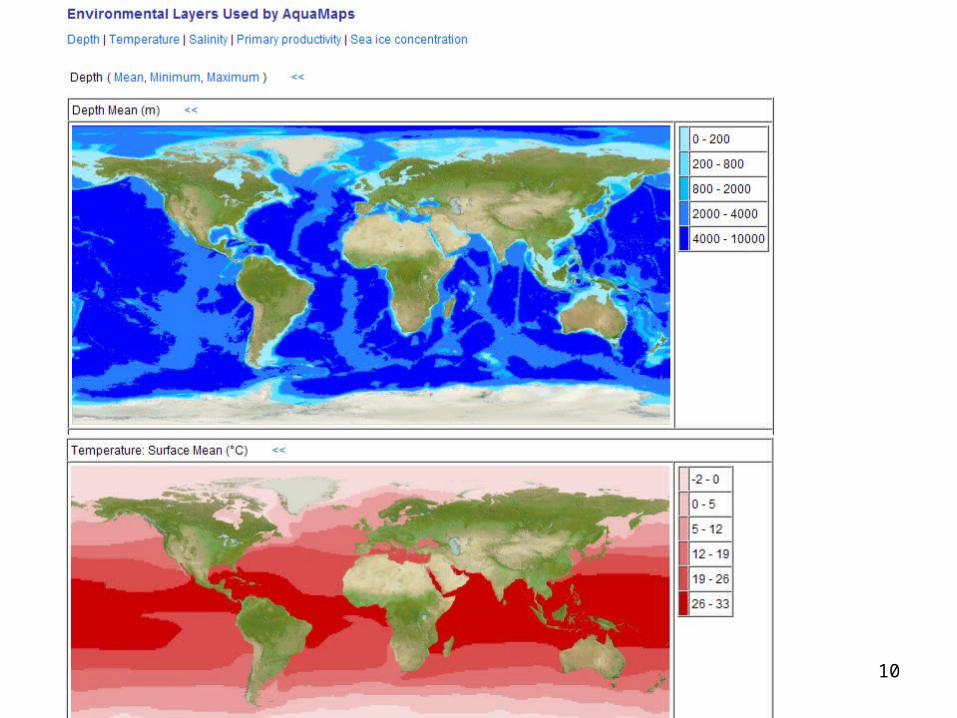
10

11
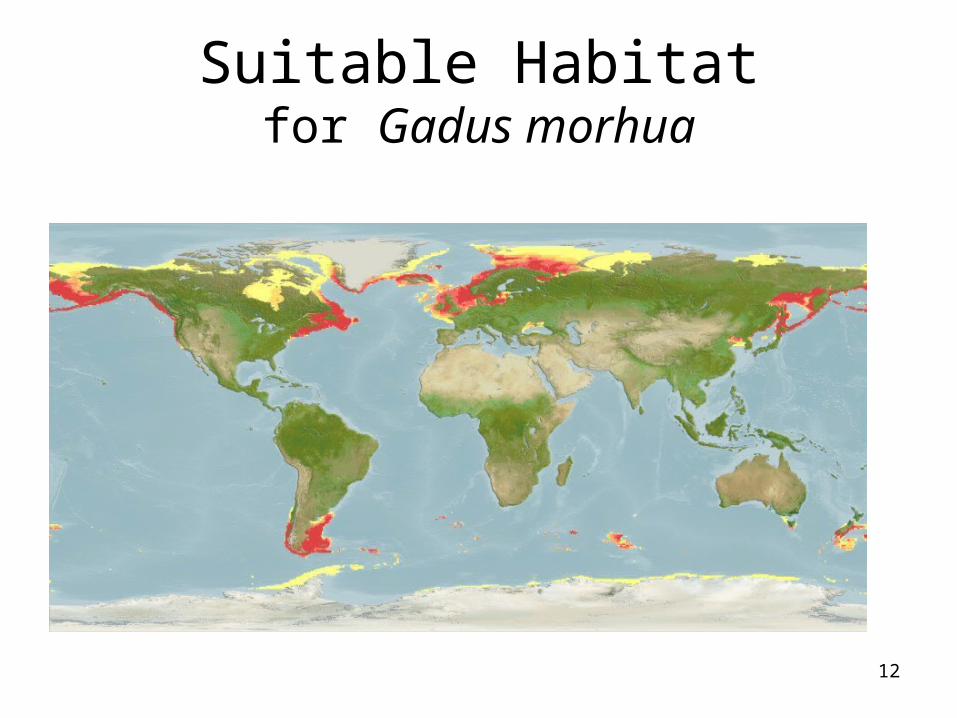
Suitable Habitatfor Gadus morhua
12

Range Map for Gadus morhua
13

2050 Range Mapfor Gadus morhua
14

AquaMaps Attempts to CombinePoints with other Knowledge
• Mass-production of computer-generated distribution maps
• Based on known range, environmental preferences and known occurrences
• With expert editing of `computer maps´
• For eventually all species on Earth
15

Currently >11,000 Maps
• Half of all marine fishes (~7,000)
• All marine mammals
• All marine reptiles (turtles, snakes)
• Many seabirds
• Over 2,000 invertebrates
• Important invasive species
16

Examples from AquaMapsWhale shark (cosmopolitan)
17

Whale shark (cosmopolitan)
18

19

20

21
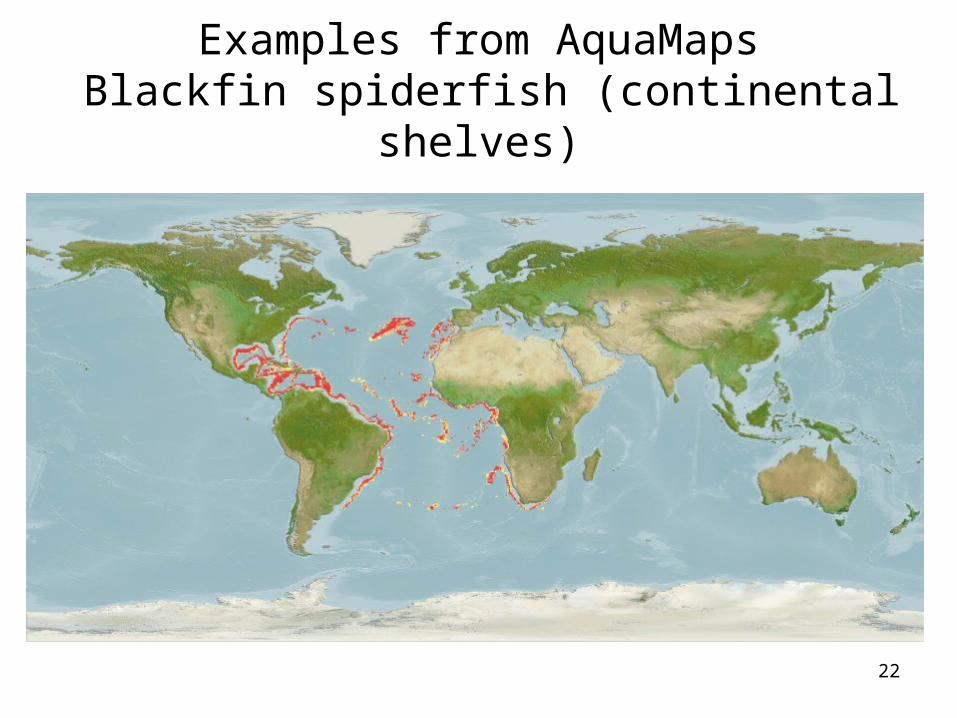
Examples from AquaMaps Blackfin spiderfish (continental shelves)
22

0
500
1000
1500
2000
2500
40 80 120 160 200 240 280
Longitude (degrees)
Nu
mb
er
of
sp
ec
ies
(n
)
Maldives
Galapagos
Marshall I. Howland/Baker
Sumatra
Borneo
Celebes/Halmahera
Somalia
Ecuador
Seamount
Tools:Equatorial Species Richness Transect across the Indo-Pacific
24

Tools :Where to Place an MPA
25
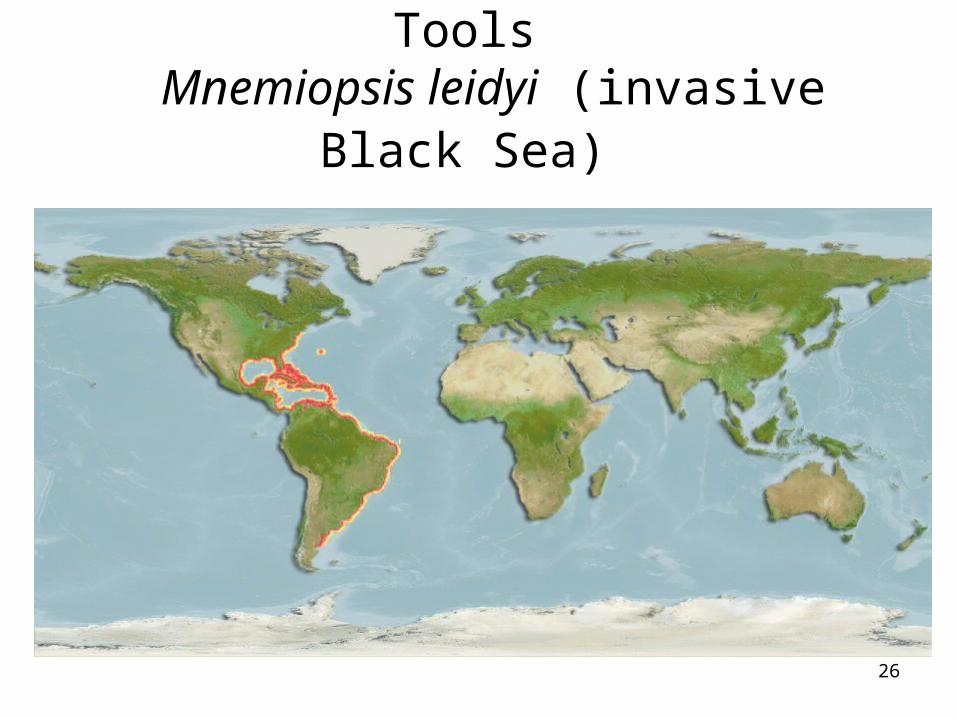
Tools Mnemiopsis leidyi (invasive Black Sea)
26

Tools Mnemiopsis leidyi (invasive Black Sea)
27

How About Climate Change?
28

Expected Changes in Environmental Parameters in 2050
Climate zone Surface Temp. (°C)
BottomTemp. (°C)
Salinity BottomSalinity
Ice concentration (%)
Arctic +0.7 +1.6 -1.2 -0.8 -9
Temperate N +0.4 +0.8 -0.7 -0.3 -2
Subtropical N +1.0 -0.1 -0.3 -0.0 0
Tropical +1.4 -0.3 -0.2 0.0 0
Subtropical S +0.5 +0.3 -0.2 0 0
Temperate S +0.4 +0.7 -0.1 0.0 -0.3
Antarctic +0.7 +0.5 -0.2 0.0 -3
29
Preliminary Analysis
• 342 marine fishes with verified maps
• Global suitable habitat in 1999 and 2050
• Only core habitat considered (P > 0.5)
30

More Losers than Winners
0
30
60
90
120
150
-100 -80 -60 -40 -20 0 20 40 60 80 100
Change in area (%)
Co
un
t
Change in area of suitable habitat between 2000 and 2050 for 342 marine fishes. Median loss of area is 6% (95% CL 3.8 – 7.4), significantly different from zero. 31

No Difference for Sharks
-100
-80
-60
-40
-20
0
20
40
60
Actinopterygii Elasmobranchii Holocephali
Ch
an
ge
in a
rea
(%
)
Change in area is not significantly different between 91 sharks & rays and 250 ray-finned fishes. The one species of Holocephali is Chimaera monstrosa.
32

No Role for Phylogeny
-100
-80
-60
-40
-20
0
20
40
60
0 1429 2857 4286 5714 7143 8571 10000
Phylogenetic rank
Ch
an
ge
in a
rea
(%
)
Change in suitable habitat by phylogenetic rank of species, from primitive on the left to highly derived on the right.
33

No Role for Uniqueness
-100
-80
-60
-40
-20
0
20
40
60
0.4 0.6 0.8 1.0 1.2 1.4 1.6
Phylogenetic uniqueness (PD50)
Ch
an
ge
in a
rea
(%
)
Change in area with suitable habitat over phylogenetic uniqueness (Faith, Reid and Hunter 2004) of the respective species. 34

No Role for Size
-100
-80
-60
-40
-20
0
20
40
60
10 100 1000 10000
Length (cm)
Ch
an
ge
in a
rea
(%
)
Change in area with suitable habitat over maximum body length of 342 species of marine fishes. 35

Migrants Not Prepared
-100
-80
-60
-40
-20
0
20
40
60
non-migratory oceanodromous
Ch
an
ge
in a
rea
(%
)
Change in area is not significantly different between 34 non-migratory (median -3.2%, 95% CL -17 – 1.6) and 96 oceanodromous species (median -3.7, 95% CL -9.4 - -0.8).
36

Deeper is Better
-100
-80
-60
-40
-20
0
20
40
60
1 bathy 2 dem 3 bpel 4 pel 5 reef
Ch
an
ge
in a
rea
(%
)
Change in area by preferred habitat of marine species. For 41 deep sea fishes, the median change of +2% (95% CL -0.9 – +3.7. For 103 demersal fishes, median loss is 3% (95% CL -6.5 - -0.9). For 31 benthopelagic fishes, the median loss of 3.3% (95% CL -12 – 3.8. For 55 pelagic fishes, the median loss is 13% (95% CL -17 - -2.9). For 112 reef-associated fishes, the median loss is 10% (-17 - -6.5).
37

Polar and Tropical Fishes Lose
-100
-80
-60
-40
-20
0
20
40
60
1 deep 2 polar 3 temp 4 sub 5 tropical
Ch
an
ge
in a
rea
(%
)
Change in area by climate zone. For 43 deep sea species, the median change is not significantly different from zero (median 1.8, 95% CL -2.5 – 3.7). Of five polar species, three lose 9 to 32% of suitable area. For 50 temperate species, median change is +2.3% (95% CL -0.1 – 4.0). For 112 subtropical species, the median loss is 7% (95% CL 3.8 – 13) and for 132 tropical species the median loss is 9% (95% CL 7 – 15).
38

1st Conclusions about Impact of Climate Change on Marine Fishes
• More losers than winners in the Future Ocean• Deep sea and demersal fishes are less affected • Polar and tropical fishes lose, temperate less
affected• Among fishes, phylogeny and size do not seem
to play a role
39

Who Does AquaMaps
• Rainer Froese, IFM-GEOMAR, Coordinator • Kristin Kaschner, Freiburg Uni., model development • Sven Kullander, NRM, extension to freshwater• Jonathan Ready, formerly NRM, implementation • Tony Rees, CSIRO, mapping tools • Paul Eastwood, CEFAS, valuation • Nina Garilao, IFM-GEOMAR, web programming • Josephine Rius Barile, WFC, database programming • Kathleen Reyes, WFC, map checking
40

Some FishBase Team MembersSome FishBase Team Members

Who Supports AquaMaps
• Governance by FishBase Consortium
• Past support from Pew Charitable Trusts, EU, USGS, OBIS, GBIF, Future Ocean Kiel, D4Science
• Involvement in new projects wanted
42


