WINERY ECONOMICS - Umpqua Community College, … · Calculate net present value (NPV), internal...
36
WINERY ECONOMICS By Trent Ball Agriculture Program, Chair, Yakima Valley Community College, and Partner, Agri-Business Consultants LLC.
Transcript of WINERY ECONOMICS - Umpqua Community College, … · Calculate net present value (NPV), internal...
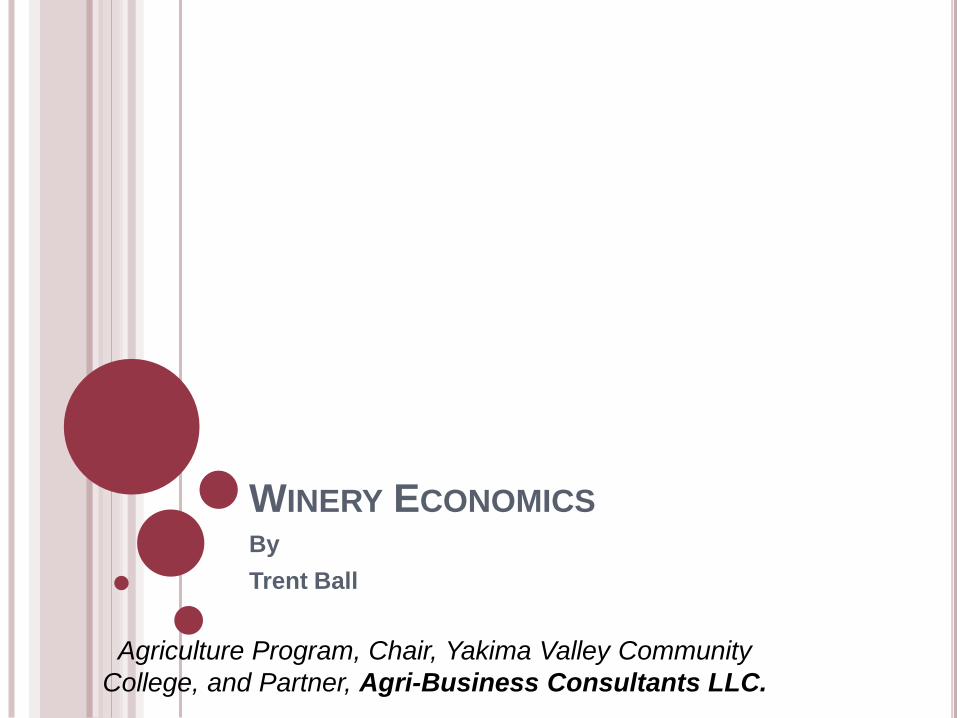
WINERY ECONOMICS By
Trent Ball
Agriculture Program, Chair, Yakima Valley Community
College, and Partner, Agri-Business Consultants LLC.

OUTLINE
World, US and PNW Wine Industry
Economics of investing in and operating smaller premium
wineries in the Pacific Northwest
Pricing, product mix, and investment alternatives

WORLD SUPPLY AND DEMAND SITUATION
World wine production in 2010
263,900,000 hl
World wine consumption in 2010
238,000,000 hl
Supply > Demand?

TOP WINE PRODUCING COUNTRIES
Country % of World Production
Italy 18.4%
France 17.3%
Spain 13.7%
USA 7.4%
Argentina 6.0%
China 4.9%

TOP WINE CONSUMING COUNTRIES
Country % of World Consumption
France 12.4%
USA 11.4%
Italy 10.3%
Germany 8.5%
China 6.0%
UK 5.5%

WINE SALES IN THE U.S.- 2002 TO 2012
IN MILLIONS OF GALLONS
Year Table Wine
Dessert Wine
Champagne/
Sparkling Wine
Total Wine
Total Retail Value (billion)
2012 (Est.) 749 65 42 856 $34.6
2011 724 71 41 836 $32.9
2010 681 66 37 784 $30.0
2009 666 64 33 764 $28.7
2008 650 65 32 746 $30.0
2007 647 62 33 742 $30.4
2006 627 57 32 717 $27.8
2005 609 52 31 692 $25.8
2004 589 45 31 665 $24.0
2003 570 40 29 639 $22.3
2002 552 37 28 617 $21.8

TABLE WINE VOLUME BY COLOR IN U.S.
SUPERMARKETS
COLOR 1991 1995 2008 2009
Red 17% 25% 44% 47%
White 49% 41% 42% 40%
Blush 34% 34% 14% 13%
TOTAL 100% 100% 100% 100%
Source: Based on U.S. supermarket data from ACNielsen.

CURRENT WINE SALES SITUATION
2012 wine sales in U.S. 856 million gallons
$34.6 billion value
Since 2000 sales growth value has been 80% Premium table wines priced at $7 or more per 750
ml account for: Fastest growing market segment in sales, most profitable

NUMBER OF WINERIES
Bonded
U.S. 7,600+
Washington 780+
Oregon 460+
0
5,000
10,000
15,000
20,000
25,000
30,000
35,000
40,000
45,000
0
20,000
40,000
60,000
80,000
100,000
120,000
140,000
160,000
180,000
2001 2002 2003 2004 2005 2006 2007 2008 2009 2010 2011
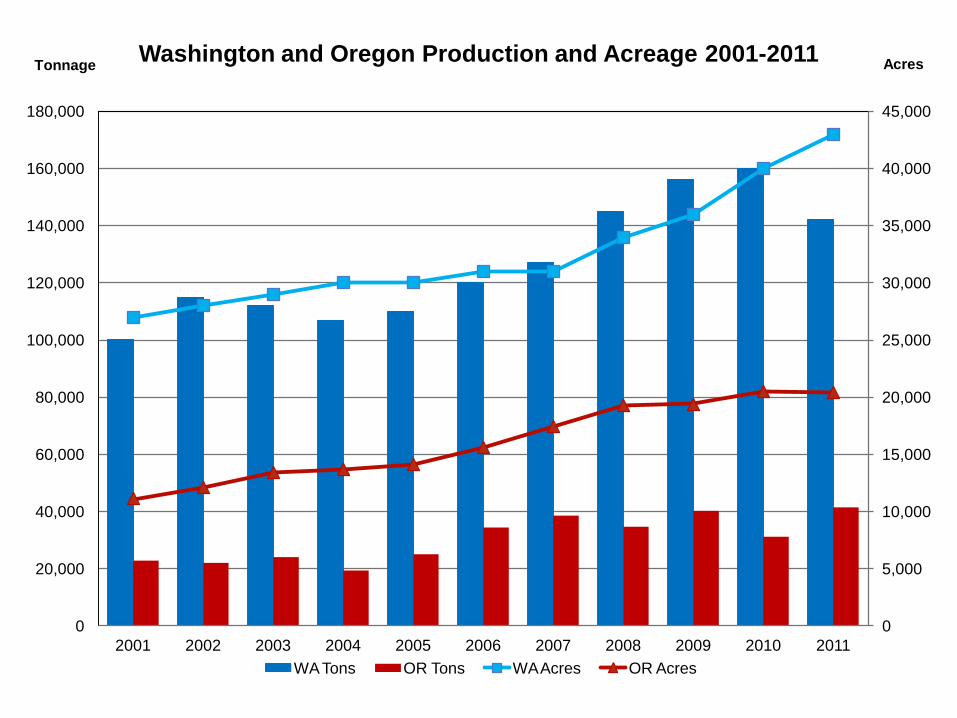
Washington and Oregon Production and Acreage 2001-2011
WA Tons OR Tons WA Acres OR Acres
Tonnage Acres

NUMBER OF VINEYARDS AND TONNAGE IN
SOUTHERN OREGON, 2002-2011
0
1,000
2,000
3,000
4,000
5,000
6,000
7,000
8,000
9,000
020406080
100120140160180200
2002 2004 2006 2008 2010
Pro
du
cti
on
(T
on
s)
Nu
mb
er o
f V
ine
ya
rds
Year Vineyards Tonnage
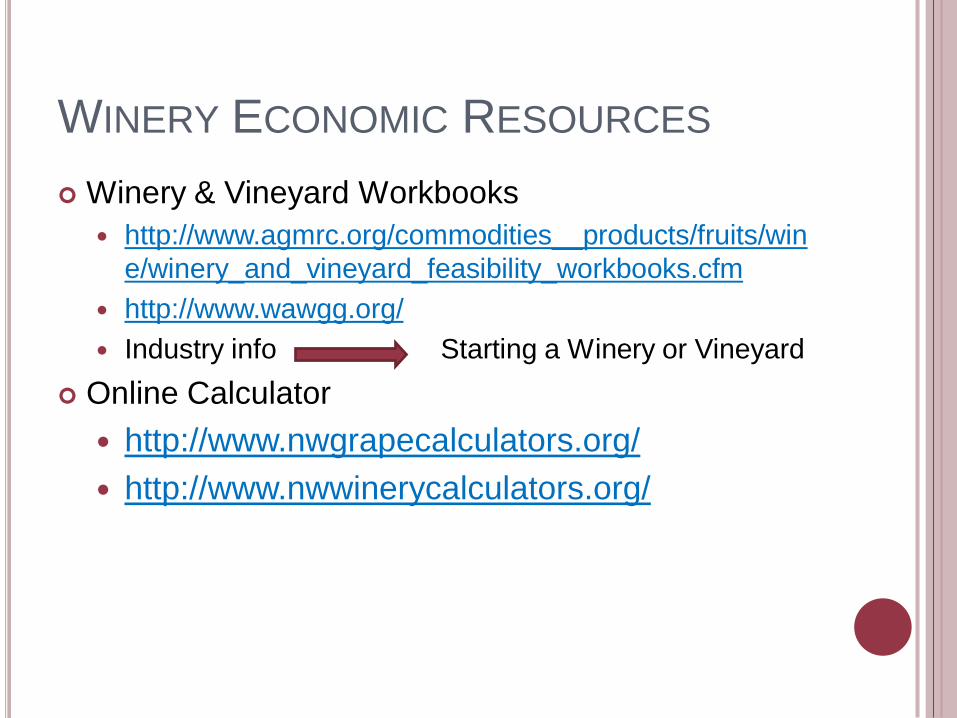
WINERY ECONOMIC RESOURCES
Winery & Vineyard Workbooks
http://www.agmrc.org/commodities__products/fruits/win
e/winery_and_vineyard_feasibility_workbooks.cfm
http://www.wawgg.org/
Industry info Starting a Winery or Vineyard
Online Calculator
http://www.nwgrapecalculators.org/
http://www.nwwinerycalculators.org/
http://www.agmrc.org/commodities__products/fruits/wine/winery_and_vineyard_feasibility_workbooks.cfm
http://www.agmrc.org/commodities__products/fruits/wine/winery_and_vineyard_feasibility_workbooks.cfm
ECONOMICS OF SMALL WASHINGTON WINERIES
500 to 10,000 cases of premium wines
Economic-engineering approach
Estimate the initial investment, operating costs, and
financial returns

NO STANDARD WINERY
Juice yield
Quality of wine
Temperatures and length of time of the fermentation process
Length of aging process
Use of oak cooperage
Labor and capital intensity
Bottling dates
Marketing methods
Access to grapes
Etc.

INFORMATION GENERATED IN THE ANALYSIS
Identify the personnel and capital assets required to
construct & operate 6 wineries of various sizes between
500 and 10K annual case production
Calculate the total dollar investment required to
construct each winery
Estimate annual operating costs for each winery
Calculate annual cash flow for each winery
Calculate net present value (NPV), internal rate of return
(IRR), equity payback, and debt recovery for each size
winery

INTRODUCTORY QUESTIONS
2,000 case winery
Product Mix 25% White
75% Red
Inflation cost of 2% annually
No bulk wine
150 gallons/ton juice recovery
Cooperage 100% of reds and 50% whites
30% new purchased annually

CAPITAL ASSETS- RECEIVING EQUIPMENT
Receiving Equipment Units Cost
Ship/
Install Total
Tons of grapes required based on winery size and juice
recovery 34.3
Picking Bins 20 $300.00 $15.00 $6,300.00
Hopper 1 $11,000.00 $550.00 $11,550.00
3-4 tons/hr Stemmer/Crusher 1 $6,495.00 $324.75 $6,819.75
900 lb Membrane Press 1 $18,500.00 $925.00 $19,425.00
1.5-30 gpm, 2" TC Must Pump 1 $5,873.00 $293.65 $6,166.65
5,000 lb, 42in. x 42in. Platform Scale 1 $1,200.00 $60.00 $1,260.00
Must Lines, 3" plastic flex (feet) 0 $6.21 $0.31 $0.00
Other 0 $0.00 $0.00 $0.00
Other 0 $0.00 $0.00 $0.00
TOTAL $51,521.40

TOTAL INVESTMENT COSTS BY EQUIPMENT
CATEGORY ($)
Cost Category 2000 Case Winery
Receiving Equipment $51,521.40
Bottling Equipment $0.00
Cellar Equipment $14,769.11
Materials Handling $54,631.50
Refrigeration $14,700.00
Fermentation/Storage $48,783.00
Cooperage $50,137.50
Tasting Room $7,490.70
Plant and Office $510,000.00
Total Investment Costs $752,133.21

TOTAL INVESTMENT & PER UNIT COSTS ($)
Cost Category
Per Unit Cost
$/Case $376.07
$/Gallon $158.17
$/750 ml $31.34

OPERATING COSTS
Equipment, land and operating financing
Grape costs
$1,000/ton whites and $2,000/ton reds
Bottling timeline and mobile bottling costs
Packaging
Labor
Other variable and fixed costs

VARIABLE (OPERATING) COSTS BY WINERY SIZE
Variable Cost 10 Year Avg $/Case
Grapes $65,726 $32.86
Packaging $39,112 $19.56
Mobile Bottling $8,856 $4.43
Taxes and Dues $14,940 $7.47
Full Time Labor $38,631 $19.32
Part Time Labor $12,811 $6.41
Marketing $14,235 $7.12
Utilities &Supplies $2,497 $1.25
Cellar Supplies $3,920 $1.96
Other $12,127 $6.06
Total Avg. VC $212,855 $106.43
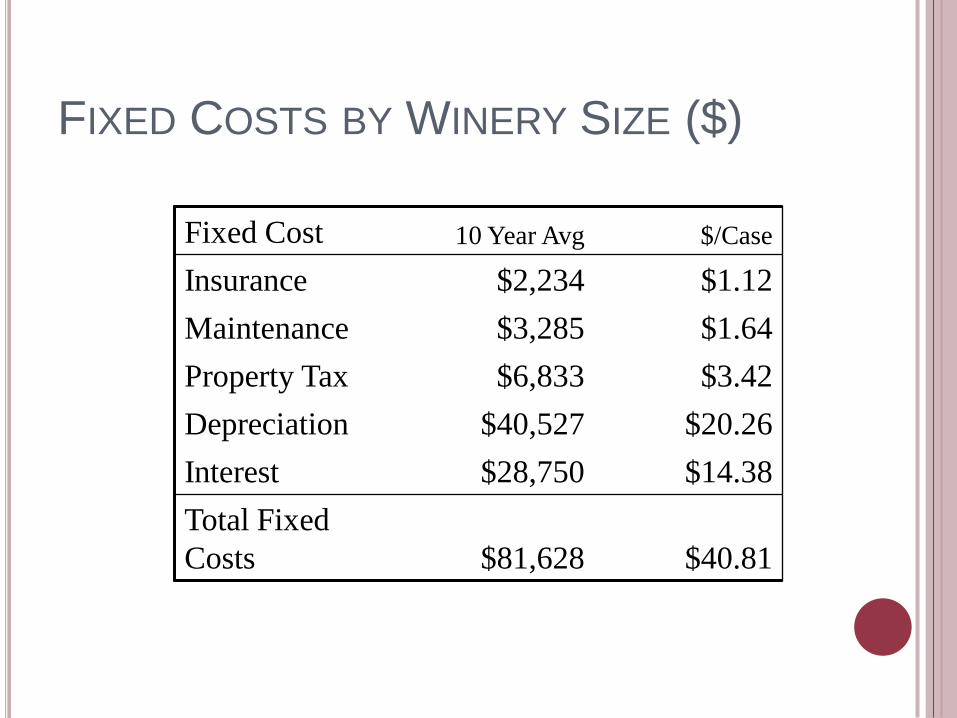
FIXED COSTS BY WINERY SIZE ($)
Fixed Cost 10 Year Avg $/Case
Insurance $2,234 $1.12
Maintenance $3,285 $1.64
Property Tax $6,833 $3.42
Depreciation $40,527 $20.26
Interest $28,750 $14.38
Total Fixed
Costs $81,628 $40.81
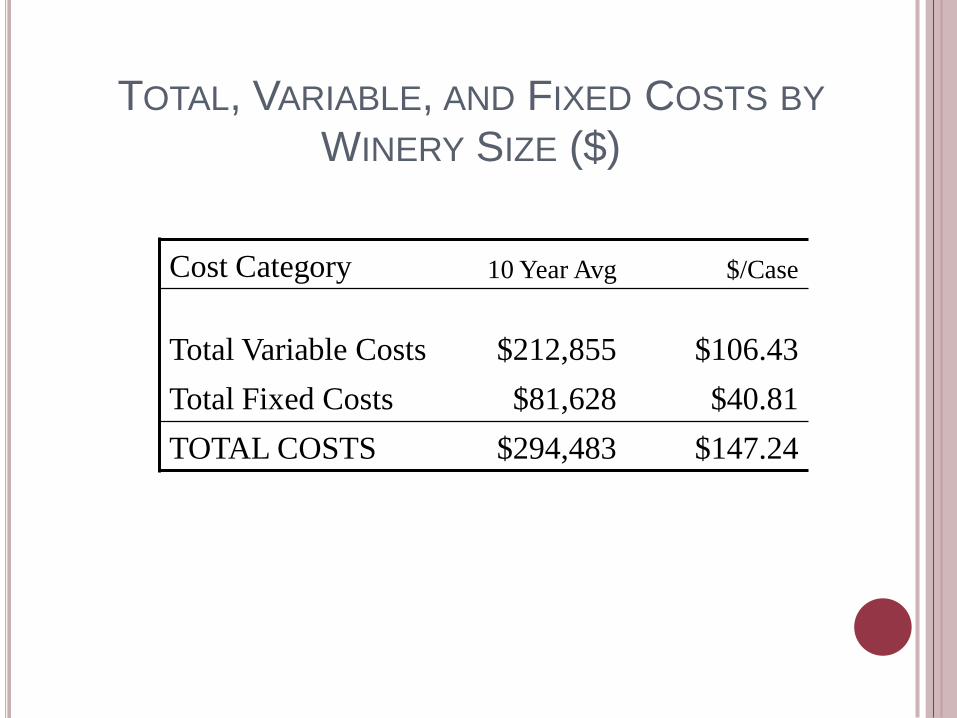
TOTAL, VARIABLE, AND FIXED COSTS BY
WINERY SIZE ($)
Cost Category 10 Year Avg $/Case
Total Variable Costs $212,855 $106.43
Total Fixed Costs $81,628 $40.81
TOTAL COSTS $294,483 $147.24
ASSUMPTIONS MADE IN CALCULATING
CASH FLOWS
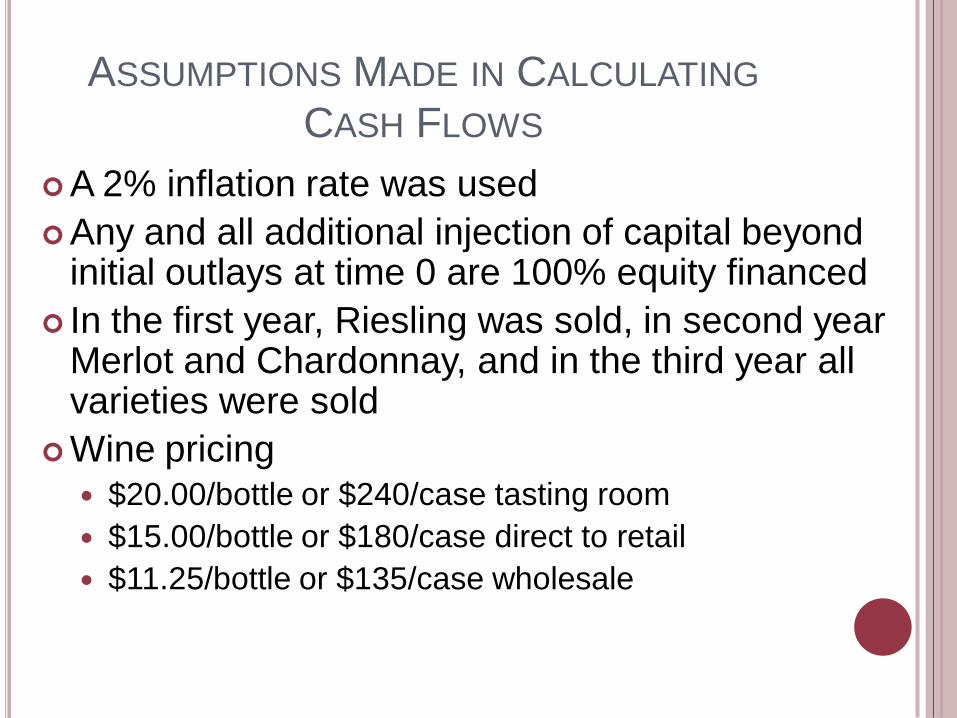
A 2% inflation rate was used
Any and all additional injection of capital beyond initial outlays at time 0 are 100% equity financed
In the first year, Riesling was sold, in second year Merlot and Chardonnay, and in the third year all varieties were sold
Wine pricing $20.00/bottle or $240/case tasting room
$15.00/bottle or $180/case direct to retail
$11.25/bottle or $135/case wholesale

WINERY SALES
Tasting room sales accounted for as % of premium cases
sold
Sales Price/bottle
(%) ($)
Tasting Room 75% $18.00
Direct to Retail 10% $15.00
Wholesale 15% $11.25

CASH FLOW STATEMENT
Earnings Before Taxes + Carryover Loss
Taxable Income Taxable Income - Income Tax
Gross Cash Flow Gross Cash Flow + Depreciation - Principal Payments
Net Cash Flow

FINANCIAL ANALYSIS TO DETERMINE
ACCEPTABILITY OF INVESTMENT
Net Present Value (NPV)
11% discount rate
Internal Rate of Return (IRR)
Equity payback period
Discounted payback period

CASH FLOW PROJECTIONS
Year Cash Flow
Discounted
Cash Flow
1 ($397,796.89) ($397,796.89)
2 ($239,163.52) ($215,462.63)
3 $88,351.16 $71,707.78
4 $91,951.24 $67,233.95
5 $95,446.11 $62,873.31
6 $143,283.11 $85,031.55
7 $119,378.78 $63,824.77
8 $107,492.07 $51,774.46
9 $104,112.31 $45,177.09
10 $105,995.99 $41,436.46

NET PRESENT VALUE (NPV), INTERNAL RATE OF
RETURN (IRR), EQUITY PAYBACK PERIOD, AND
DISCOUNTED PAYBACK PERIOD
Winery
(Cases)NPV ($) IRR
Equity
Payback (yrs)
Discounted
Payback (yrs)
2,000 ($124,200.15) 5.96% >10 >10
PRODUCT PRICE AND INPUT PRICE
CHANGES
What has a greater impact on returns and NPV
Product price change
Grape input price change
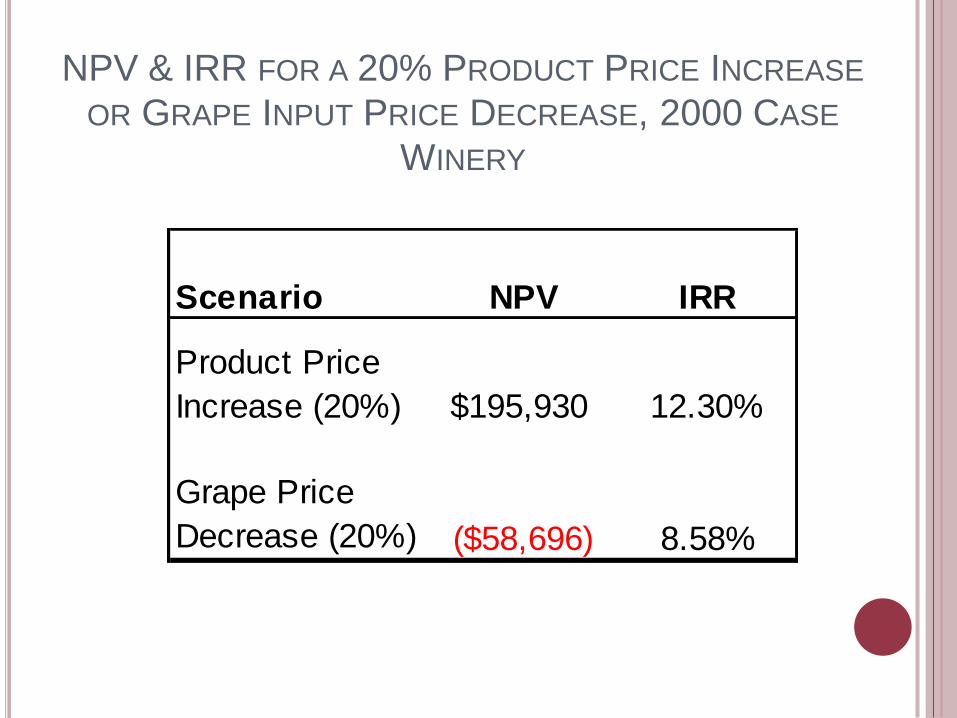
NPV & IRR FOR A 20% PRODUCT PRICE INCREASE
OR GRAPE INPUT PRICE DECREASE, 2000 CASE
WINERY
Scenario NPV IRR
Product Price
Increase (20%) $195,930 12.30%
Grape Price
Decrease (20%) ($58,696) 8.58%

PRODUCT VERSUS GRAPE PRICE
Impact on returns Product price has greater effect than grape input price
Bottom line can be dramatically influenced with control of product
price

INCUBATOR SCENARIO
Assume start-up winery will use an existing facility
No real estate loan
Monthly lease payment ($2,000/mn)
Keep existing capital loan
No equipment provided
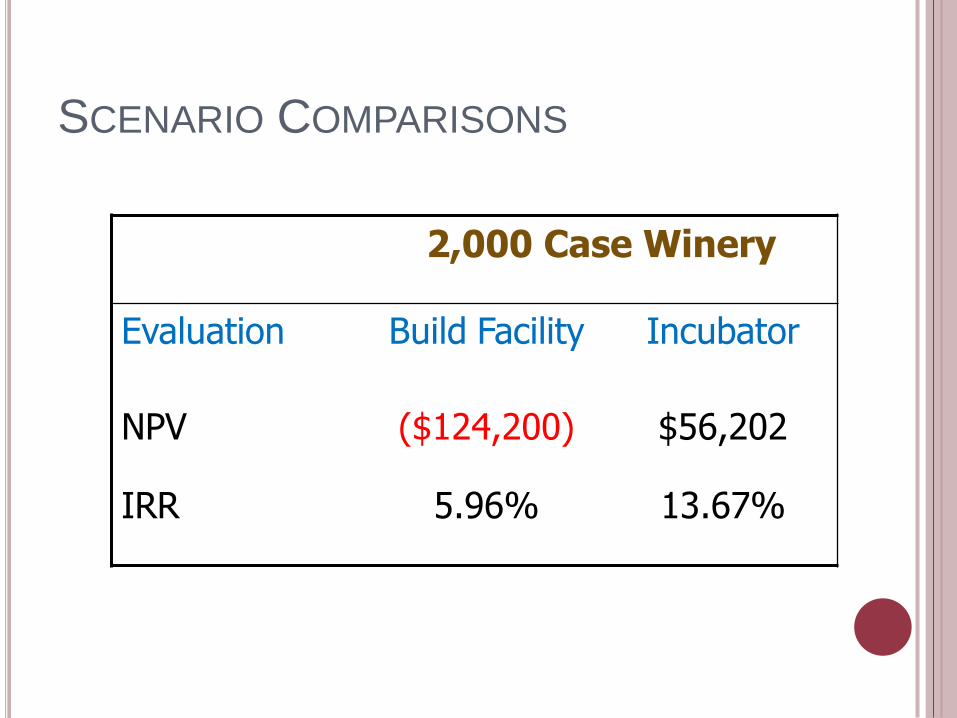
SCENARIO COMPARISONS
2,000 Case Winery
Evaluation Build Facility Incubator
NPV ($124,200) $56,202
IRR 5.96% 13.67%

SUMMARY AND CONCLUSIONS
Plant and office followed by cooperage were the largest investment costs
Economies of size exist with the wineries
The 10,000 case winery had highest IRR and shortest payback periods
Cooperage has significant impact on operation costs and quality
Product sales price control has more impact on returns than grape input price
Incubators can have positive financial benefit

THANKS FOR YOUR TIME!
Trent Ball Vineyard & Winery Technology Program, Chair, YVCC and Partner,
Agri-Business Consultants, LLC.