Wine Grape & Tree Fruit Production Okanag an Region · · 2014-12-04Wine Grape & Tree Fruit...
23
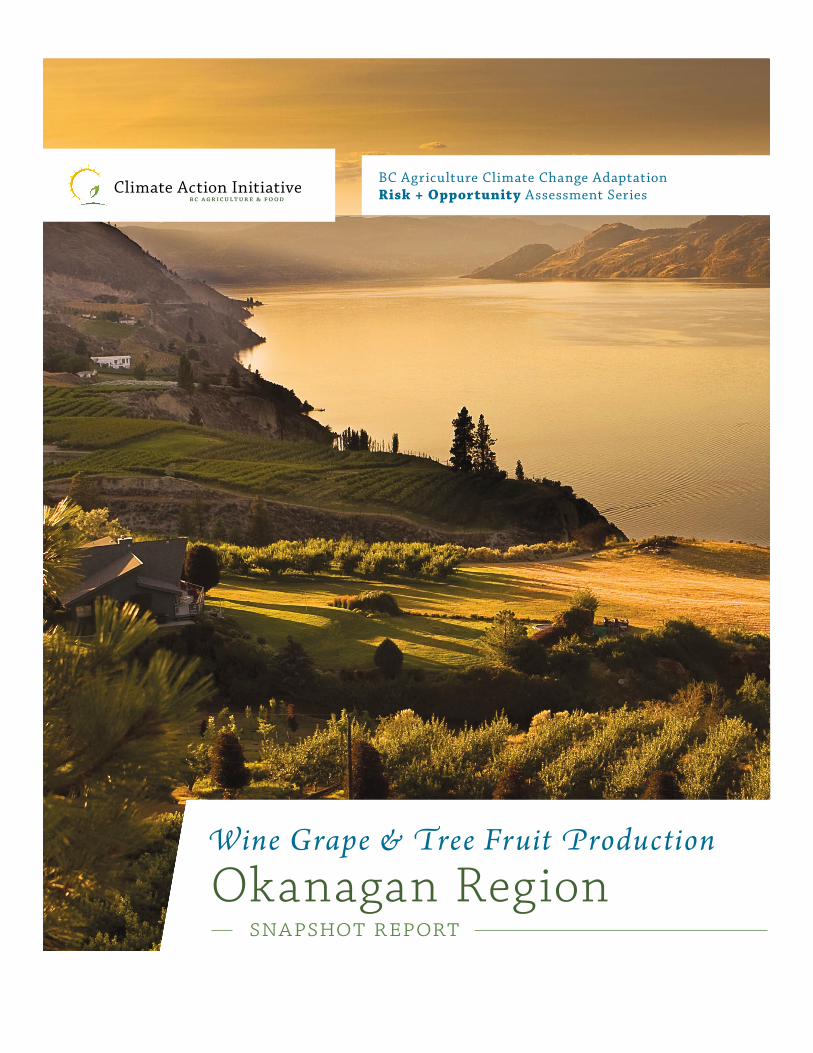
BC Agriculture Climate Change Adaptation Risk + Opportunity Assessment Series Wine Grape & Tree Fruit Production Okanagan Region snapshot report
Transcript of Wine Grape & Tree Fruit Production Okanag an Region · · 2014-12-04Wine Grape & Tree Fruit...
BC Agriculture Climate Change Adaptation Risk + Opportunity Assessment Series
Wine Grape & Tree Fruit Production
Okanagan Region snapshot report
published March 2012 by the British Columbia Agriculture & Food Climate Action Initiative www.BCAgClimateAction.ca
project funding provided by Agriculture and Agri-food Canada BC Ministry of Agriculture BC Ministry of Environment Pacific Institute for Climate Solutions
other project partners BCAC/ARDCorp BC Ministry of Agriculture Investment Agriculture Foundation
authors Erica Crawford & Emily MacNair
contributing authors Rachelle Beveridge & Dr. David Connell
graphic design Rocketday
photographs from Picture BC, under Creative Commons licenses: cover by Eric Simard; page 3, 17 by Brian Sprout; page 5, 10 by Wendy Coomber; page 15 by Tom Cooper
British Columbia Agriculture & Food Climate Action Initiative acknowledges the financial assistance of Agriculture and Agri-Food Canada, the BC Ministry of Agriculture, and the Investment Agriculture Foundation of BC for making this project possible.
Agriculture and Agri-Food Canada, the BC Ministry of Agriculture and the Investment Agriculture Foundation of BC, are pleased to participate in the creation of this publication. We are committed to working with our industry partners to address issues of importance to the agriculture and agri-food industry in British Columbia. Opinions expressed in this publication are those of the BC Agriculture and Food Climate Action Initiative and not necessarily those of the Investment Agriculture Foundation, the BC Ministry of Agriculture or Agriculture and Agri-Food Canada.
Acknowledgements
This project has been initiated by the BC Agriculture Council’s Climate Action Initiative (CAI) to address the priorities identified in
the BC Agriculture Climate Change Action Plan. The Action Plan is intended to guide the agriculture sector in adapting to a changing climate and mitigating greenhouse gas emissions.
The Action Plan is available at: www.BCAgClimateAction.ca
This project involved contributions from many people in different capacities from its early stages through to its completion. The project management team assisted in developing, guiding and executing the project: Dr. David Connell (University of Northern BC), Jennifer Pouliotte (BC Ministry of Environment) and Allen James (BC Agriculture Council). In addition, Dr. Connell played a key role in developing the focus group design and providing background research. Rachelle Beveridge assisted with background research, focus groups, analysis of the interviews and development of Chapter 4 of the Provincial Report. Lauren Klose helped with background research and materials for the focus groups.
An Advisory Committee guided the project from conceptual stages through research design and production of the final reports: Allen James, BC Agriculture Council; Ted Van der Gulik, Sean Darling, Ian McLachlan, Orlando Schmidt, Jennifer Curtis and Linda Wilson, BC Ministry of Agriculture; Thomas White, Jennifer Pouliotte and Celine Davis, BC Ministry of Environment; Denise Neilsen, Scott Smith and Doug Edwards, Agriculture and Agri-Food
Canada; Stewart Cohen, Environment Canada; and Tom Pedersen, Pacific Institute for Climate Solutions.
Trevor Murdock and the Pacific Climate Impacts Consortium provided their assistance, support and technical advice. Input was provided by Markus Schnorbus (PCIC), Ellen Pond (UBC-CALP), Livia Bizikova (IISD), Dave Trotter (BC Ministry of Agriculture) and Ngaio Hotte (SFU-ACT). Christopher Kay (BC Ministry of Agriculture) provided copy-editing.
Many agricultural organizations around the province (and their hard-working staff) assisted in communicating with their members about the project. A number of individual producers and Ministry of Agriculture staff assisted by providing feedback on the provincial draft and the snapshot report drafts.
Thank you as well to the many agricultural producers and Ministry of Agriculture specialists who participated in the interviews and focus groups. Without the producers, who volunteered and took time away from their operations to participate, this study would not have been possible.
The results of this project will be applied to two new Climate Action Initiative projects in 2012–2013. The On-Farm Adaptation Practices project will explore appropriate farm level adaptation practices for BC agriculture. The Regional Agricultural Adaptation Strategies project will pilot a collaborative adaptation planning process involving local and regional government and the agriculture industry organizations as partners.
Contents
2 Project Rationale & Methodology
3 Agricultural ProfileHistorical role of agriculture in the Okanagan
Agricultural land base, soils & climate
Characteristics of Okanagan agriculture
5 Current Resilience & Adaptive CapacityFinancial resources
Human & social resources
Knowledge resources: Information, extension & research
Physical resources
Policy & regulatory resources
10 The Climate ScienceWeather, variability & climate change
BC climate change projections
15 Impacts, Risks & Opportunities
17 Key ActionsOkanagan / tree fruit & wine grape producer focus group
19 Endnotes
Project Rationale & Methodology
The BC Agriculture Climate Change Adaptation Risk + Opportunity Assessment is intended to improve collective
knowledge of how changes to the climate may impact agricultural commodities in key regions of BC, and the risks and opportunities associated with these impacts. The most important element of this assessment has been gathering perspectives from agricultural producers about their ability to adapt to current and projected challenges and opportunities, as well as identification of approaches, tools and resources required to better support adaptation.
To address the project’s goals, a review of existing research in the areas of climate science and climate change and agriculture was conducted. Data regarding the current state of the BC sector was also reviewed. Original data was collected through thirty-seven interviews and twelve focus groups with producers and specialists across the province. Interviews were focused on assessing how well individual producers felt they could adapt to a range of current challenges and opportunities. The focus groups brought together small groups of producers and other specialists to discuss the projected changes in climate, and the associated risks and opportunities for their operations, regions and commodities.
This project is an initial step in building knowledge and understanding of the implications of climate change for BC agriculture. The incredible diversity of the BC agriculture sector cannot be captured in a single study. Due to the limited breadth and scope of this study, a select number of commodities and regions were included. However, this study does offer a foundation or baseline; a starting point for further
dialogue as well as guidance for development of approaches and resources to enhance BC’s agriculture sector in a changing climate.
The overall findings of this project are available through a provincial report. In addition, a series of region/commodity “Snapshot” reports have been developed. This “Snapshot” report is intended to communicate the findings and key action items associated with tree fruit and wine grape production in the Okanagan Region. The study’s overall recommendations (that apply across the province) are available through an Executive Summary document.
Report structure
■ Agricultural Profile provides a high level description of the sector, its major characteristics and context
■ Adaptive Capacity highlights challenges, strengths and variations in the Okanagan sector’s capacity to adapt to challenging conditions
■ Climate Science provides an introduction to the climate science, including a eview of provincial and regional level climate trends and projections
■ Impacts, Risks & Opportunities outlines the major climate change impacts, risks and opportunities for wine grape and tree fruit production
■ Key Actions highlights the priority actions identified through the focus groups
BC Agriculture Climate Change Adaptation Risk + Opportunity Assessment Series — The Okanagan Region March 2012 3
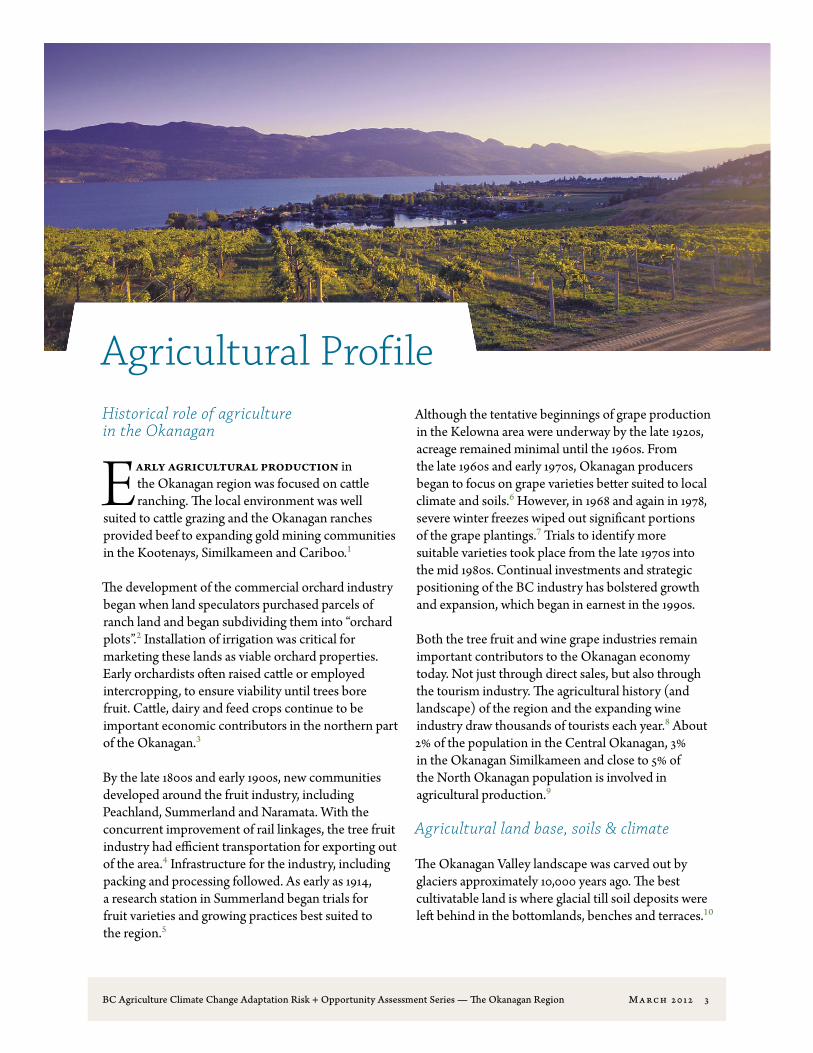
Agricultural ProfileHistorical role of agriculture in the Okanagan
Early agricultural production in the Okanagan region was focused on cattle ranching. The local environment was well
suited to cattle grazing and the Okanagan ranches provided beef to expanding gold mining communities in the Kootenays, Similkameen and Cariboo.1
The development of the commercial orchard industry began when land speculators purchased parcels of ranch land and began subdividing them into “orchard plots”.2 Installation of irrigation was critical for marketing these lands as viable orchard properties. Early orchardists often raised cattle or employed intercropping, to ensure viability until trees bore fruit. Cattle, dairy and feed crops continue to be important economic contributors in the northern part of the Okanagan.3
By the late 1800s and early 1900s, new communities developed around the fruit industry, including Peachland, Summerland and Naramata. With the concurrent improvement of rail linkages, the tree fruit industry had efficient transportation for exporting out of the area.4 Infrastructure for the industry, including packing and processing followed. As early as 1914, a research station in Summerland began trials for fruit varieties and growing practices best suited to the region.5
Although the tentative beginnings of grape production in the Kelowna area were underway by the late 1920s, acreage remained minimal until the 1960s. From the late 1960s and early 1970s, Okanagan producers began to focus on grape varieties better suited to local climate and soils.6 However, in 1968 and again in 1978, severe winter freezes wiped out significant portions of the grape plantings.7 Trials to identify more suitable varieties took place from the late 1970s into the mid 1980s. Continual investments and strategic positioning of the BC industry has bolstered growth and expansion, which began in earnest in the 1990s.
Both the tree fruit and wine grape industries remain important contributors to the Okanagan economy today. Not just through direct sales, but also through the tourism industry. The agricultural history (and landscape) of the region and the expanding wine industry draw thousands of tourists each year.8 About 2% of the population in the Central Okanagan, 3% in the Okanagan Similkameen and close to 5% of the North Okanagan population is involved in agricultural production.9
Agricultural land base, soils & climate
The Okanagan Valley landscape was carved out by glaciers approximately 10,000 years ago. The best cultivatable land is where glacial till soil deposits were left behind in the bottomlands, benches and terraces.10
BC Agriculture Climate Change Adaptation Risk + Opportunity Assessment Series — The Okanagan Region March 2012 4
Soil types and agricultural capability vary across the region and by elevation.11
In comparison with the rest of the province’s interior, the Okanagan Basin has warm summers with low humidity and relatively mild winters and springs. The Okanagan sits in the rainshadow of the Cascade and Coast Mountains and is classified as semi-arid.12 With long frost free periods and high temperatures during the growing season, the Okanagan has a highly favorable climate for agriculture.13
Annual precipitation and temperatures vary across the region with many microclimates throughout. On average, precipitation is the lowest in southern Canada. Average mean annual precipitation in the major valleys of the region ranges from 290 to 450 mm.14 Across much of the region the dry, hot summers and evapotranspiration lead to soil moisture deficits and irrigation is required.
In 2006, the total reported area farmed in the Okanagan was about 190,000 hectares. In 2010, the three Okanagan regional districts contained about 4% of the Agricultural Land Reserve (ALR) (175,000 hectares). Between 1974 and 2009, about 8% of the ALR land within these regions was removed (18,765 hectares were excluded and just under 4,000 hectares were included).15
Characteristics of Okanagan agriculture
In 2006, there were 3,865 farms in the Okanagan.16 With approximately 189,000 hectares farmed, the average farm size across the three Okanagan regional districts is just under 50 hectares (compared to the provincial average of 143 hectares).17 The average age of producers in the region is 54.18 The rapid increase in land prices in the Okanagan, largely due to residential development, has impacted affordability for new entrants. The cost of land in this area can be as much as double the provincial average.19
Apples, grapes and 96% of BC’s soft fruits are grown in the south-central Okanagan. Further north in the Kelowna-Vernon area, apples are the main tree-fruit crop. However, there has been a general shift away from many types of tree fruit (apples, pears, peaches, plums and apricots) in recent years, largely due to challenges with profitability. In the early 1980s there were about 11,500 hectares in tree fruit production and by 2006 this had dropped down to just over 7,000 hectares.20 Running counter to this trend, sweet cherry production increased quite substantially during this period.21
As tree fruit production has been shrinking, acreage has been shifting into wine grapes and there is now almost 4,000 hectares in grape production across the region.22 In the Central Okanagan Regional District alone, the period between 1991 and 2006 saw a 346% increase (861 hectares) in land devoted to grape production.23
The north Okanagan also has well established cattle and dairy industries and its poultry production has grown in recent years. Field crops, particularly alfalfa but also barley and tame hay/fodder crops are predominant in the north Okanagan.24 The Okanagan region as a whole, contributes significantly to organic production in the province across a range of crops including fruits, vegetables and greenhouse products. The Regional District of the Okanagan Similkameen contains approximately 25% of the province’s organic farms.25
BC Agriculture Climate Change Adaptation Risk + Opportunity Assessment Series — The Okanagan Region March 2012 5
Current Resilience & Adaptive Capacity
A dapting to changing and challenging conditions of all kinds is a constant element of agricultural practice, and producers have long
been in the business of maximizing their resources to adjust to variability. This variability can occur in a range of areas including weather, markets, input prices and regulations. To effectively manage their operations farmers have to continually learn, change and adjust their approaches, as well as collaborate with a broad range of partners.
Adaptive capacity describes the presence of necessary resources and the ability to mobilize those resources to effectively respond to various challenging conditions in both the immediate and long-term. Resources may be at the farm or sector level, or a result of the broader social, biophysical, economic, or institutional context. In addition, knowledge resources, the ability to re-organize and the capacity for ongoing learning, are critical to mobilizing effective responses to climate change.26 In part because future climate conditions may be unexpected or unprecedented, managing the effects of climate change requires, above all, flexibility to address a range of potential impacts and to change course as required.
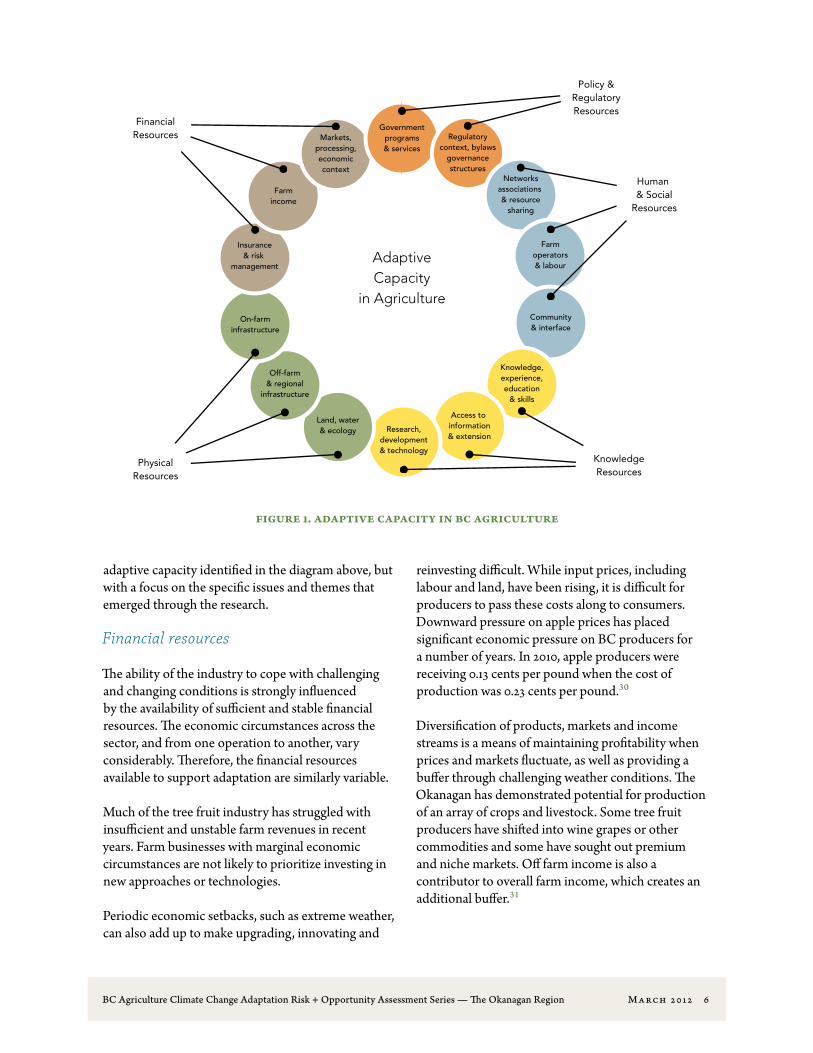
Figure 1 outlines many elements that factor into the agriculture sector’s ability to adapt. These elements
are expressed as five interrelated types of resources: financial, physical, human & social, knowledge and policy & regulatory.27
Evaluating the approaches, resources and tools currently utilized by producers to manage through challenging or changing conditions, is a first step in exploring the resilience of the industry.28 For this reason, the interviews conducted with producers and other specialists focused on existing resources and tools employed to manage through variability or difficult conditions, as well as current barriers or challenges to adapting and overall resilience.
Some studies evaluate adaptive capacity through quantitative data. Various indicators can be used to measure the industry’s capacity in certain areas.29 This study does not employ a quantitative approach, in part because the BC sector’s diversity does not lend itself well to this type of analysis. In addition, many elements of adaptive capacity cannot be meaningfully expressed in quantitative terms.
For this reason, the majority of the data that informs the analysis below was drawn from interviews with producers and other sector specialists; additional data was collected throughout the focus group sessions. The analysis is divided into the five categories of
BC Agriculture Climate Change Adaptation Risk + Opportunity Assessment Series — The Okanagan Region March 2012 6
adaptive capacity identified in the diagram above, but with a focus on the specific issues and themes that emerged through the research.
Financial resources
The ability of the industry to cope with challenging and changing conditions is strongly influenced by the availability of sufficient and stable financial resources. The economic circumstances across the sector, and from one operation to another, vary considerably. Therefore, the financial resources available to support adaptation are similarly variable.
Much of the tree fruit industry has struggled with insufficient and unstable farm revenues in recent years. Farm businesses with marginal economic circumstances are not likely to prioritize investing in new approaches or technologies.
Periodic economic setbacks, such as extreme weather, can also add up to make upgrading, innovating and
reinvesting difficult. While input prices, including labour and land, have been rising, it is difficult for producers to pass these costs along to consumers. Downward pressure on apple prices has placed significant economic pressure on BC producers for a number of years. In 2010, apple producers were receiving 0.13 cents per pound when the cost of production was 0.23 cents per pound.30
Diversification of products, markets and income streams is a means of maintaining profitability when prices and markets fluctuate, as well as providing a buffer through challenging weather conditions. The Okanagan has demonstrated potential for production of an array of crops and livestock. Some tree fruit producers have shifted into wine grapes or other commodities and some have sought out premium and niche markets. Off farm income is also a contributor to overall farm income, which creates an additional buffer.31
Governmentprograms& services
Regulatorycontext, bylaws
governancestructures
Networksassociations & resource
sharing
Farmoperators& labour
Community& interface
Knowledge,experience,education
& skills
Access to information& extension
Research,development& technology
Land, water& ecology
Off-farm& regional
infrastructure
On-farminfrastructure
Insurance& risk
management
Farmincome
Markets,processing,economiccontext
AdaptiveCapacity
in Agriculture
FinancialResources
PhysicalResources
KnowledgeResources
Human & Social
Resources
Policy &RegulatoryResources
Figure 1. Adaptive capacity in BC agriculture
BC Agriculture Climate Change Adaptation Risk + Opportunity Assessment Series — The Okanagan Region March 2012 7
Linkages between tourism and agriculture are strong in the Okanagan region and associated diversification opportunities have been positive for many agricultural operators. Direct farm gate sales to visitors are an important source of income for some operations. However, this also creates a vulnerability to economic downturns that reduce the number of tourists to the area.
Human & social resources
The primary asset for enhancing the resilience of agriculture is farmers themselves. However, across the province the current human and social resources of the sector are being stretched and this is impacting the ability to manage through difficult and changing conditions.
Farm operators
As noted in the agricultural profile, the demographics indicate that many producers in the Okanagan are nearing retirement. When difficult conditions arise that require new approaches and investments, producers contemplating retirement are more likely to maintain the status quo or consider exiting the industry, which may also be the more cost-effective option. Producers with a longer planning horizon (new entrants or those with clear succession plans) are more likely to adapt to change or adopt new technologies and practices.
For the wine grape industry, which has been growing, there is no concern with attracting new entrants. Rather, this part of the industry is struggling to secure qualified labour. In recent years there have been sector-wide challenges with availability of local labour and the wine grape sector is additionally challenged
because it is seeking workers with specific knowledge and skills.
Networks & organizations
There are multiple agricultural organizations and networks that provide education, research and support for producers in the wine grape and tree fruit industries in the Okanagan. The presence of these well established producer organizations is valuable in the context of new, challenging or variable conditions.
Some of the organizations supporting the sector include:
→ BC Wine Grape Council
→ Grape Growers Association
→ BC Wine Institute
→ BC Fruit Growers Association
→ Okanagan Kootenay Cherry Growers Association
→ New Variety Development Council
→ BC Tree Fruits
→ Certified Organic Associations of BC
These groups provide a broad range of services for producers including marketing, information and re-search and program delivery. However, as government has stepped away from providing certain supports to producers, the pressure on industry organizations to fill these gaps is growing and the staff and funding resources of these organizations are being stretched.
Knowledge resources: Information, extension & research
The Okanagan region has many producers with decades of experience in agriculture. At the same time, when producers encounter new or challenging cir-cumstances, or wish to bolster their decision-making, they seek out information through a range of sources.
Generally good years enable improving equipment and the operation… When you
can manage risks you can afford to take more risks. If you can’t afford it, you won’t make certain decisions. In terms of replanting or
trying a new crop — people won’t make this investment. Without money or some
investment security, people can’t do things that have longer term investment payback.
— cherry grower, Kelowna
BC Agriculture Climate Change Adaptation Risk + Opportunity Assessment Series — The Okanagan Region March 2012 8
Web-based resources are increasingly drawn upon by producers for all types of information. Recently developed tools like the irrigation calculator32, can be easily accessed on-line. Producers can also draw on web resources from comparable jurisdictions. However, for geographic — or commodity — specific information, most producers continue to utilize more traditional options including educational workshops, field days, conferences or direct consultation with experts. Producers also share information with each other or seek it out through suppliers (of equipment, plant material, inputs etc).
As the BC Ministry of Agriculture’s role in extension has been substantially reduced, more producers across BC now pay for private consultants or rely on industry organizations to provide extension and information. As noted above, there are strong associations for both grapes and tree fruit and a number of education and extension resources are available to producers. However, availability of extension is variable and gaps exist for producers without sufficient financial resources (to pay for extension), for those not connected to associations with extension services and for new entrants to the industry. It was noted that for new entrants to the grape industry (with limited knowledge and experience) managing through variable or difficult conditions can be problematic.
The Okanagan has been home to a number of industry-led and collaborative research initiatives, spanning a range of topics. Tree fruit breeding and variety trials have been on-going in the Okanagan for many decades. The development of the agricultural water demand model, as well as studies of climate impacts and crop suitability, provides more local information for producers in the Okanagan than is available in other areas of the province to date. The water supply constraints in the region and the presence of a federal research facility (Summerland Pacific Agri-Food Research Centre) have created a positive context for agriculture climate change impacts research. Cross-sectoral research around water management is another important asset for adaptation in the region.33
Despite these examples of research partnerships, producers in the Okanagan note a lack of research and of resources to support priority areas such as pest and
disease monitoring and management. Coordination and communication of research findings was noted as an overall gap; in some cases industry organizations lack the resources to undertake this task.
In addition, although climate change impacts research has been undertaken in the Okanagan, sharing this information in a form that can be utilized by producers is an ongoing challenge.
Physical resources
The nature and condition of on-farm and surrounding physical resources plays an important role in the ability of producers to adapt to difficult conditions. This is particularly true with respect to variability and extremes in weather, which can challenge the existing infrastructure and available physical resources.
On-farm infrastructure: Equipment, technology & farm practices
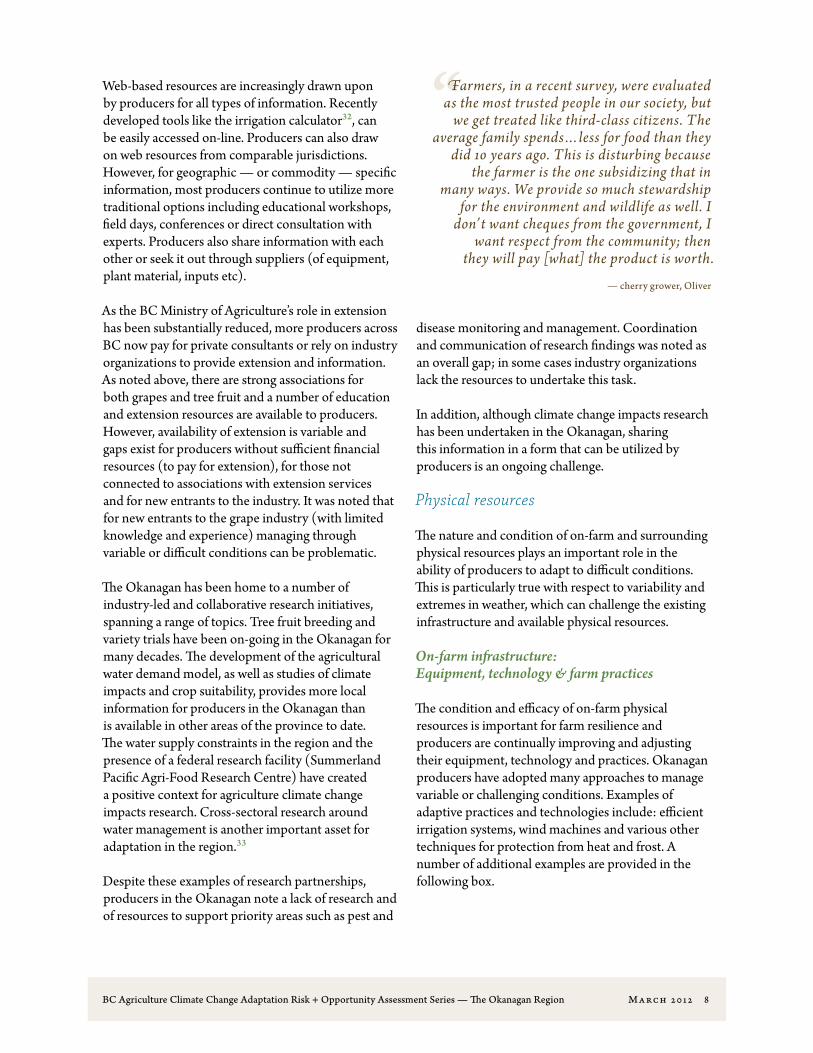
The condition and efficacy of on-farm physical resources is important for farm resilience and producers are continually improving and adjusting their equipment, technology and practices. Okanagan producers have adopted many approaches to manage variable or challenging conditions. Examples of adaptive practices and technologies include: efficient irrigation systems, wind machines and various other techniques for protection from heat and frost. A number of additional examples are provided in the following box.
Farmers, in a recent survey, were evaluated as the most trusted people in our society, but
we get treated like third-class citizens. The average family spends…less for food than they
did 10 years ago. This is disturbing because the farmer is the one subsidizing that in
many ways. We provide so much stewardship for the environment and wildlife as well. I
don’t want cheques from the government, I want respect from the community; then
they will pay [what] the product is worth.
— cherry grower, Oliver
BC Agriculture Climate Change Adaptation Risk + Opportunity Assessment Series — The Okanagan Region March 2012 9
Current management practices & approaches
→ Water efficient irrigation technology & practices (drip & dual systems, water metering, quota systems, soil management, cover crops, etc)
→ Wind machines
→ Techniques to delay bud break
→ Pruning, irrigation & sprays (to prevent sun scald, splitting, frost damage)
→ Use of weather forecasting
→ Site selection & engineering
→ Diversification of growing locations
→ External expertise (consultants)
→ Variety trials & selection
→ Conventional, Integrated Pest Management & organic pest & disease control measures
→ Harvest window adjustment
→ Direct & niche marketing
The extent to which producers are flexible with regards to investing in new technologies and practices is defined largely by other factors including: knowledge and information, financial resources and willingness to alter current approaches. The previously noted financial and informational contraints are limiting factors for adopting more costly on-farm infrastructure.
Local & regional infrastructure
Much of the physical infrastructure that farm businesses depend on is located beyond the boundaries of the farm. Regional and local infrastructure plays a central role in the ability of producers to manage through challenging and variable conditions. Some of the most important elements of this off-farm infrastructure relate to water management.
Access to water and future water supply was of substantial concern for tree fruit and wine grape producers. While producers are improving irrigation efficiency and their own practices, broader water availability, infrastructure and accessibility have a substantial impact on the ability to maintain productivity in adverse conditions, and on the range of options available in the future.
Patterns of land use and management have a significant bearing on agriculture’s adaptive capacity. Changes that are made to the land base have both immediate and long-term impacts on agricultural production. In many parts of the Okanagan the agricultural industry finds itself in ever-closer proximity to residential and urban development, which can influence water supply, hydrology and overall land and resource management patterns. While agriculture uses approximately 55% of the region’s water, development pressures factor significantly into increasing demand on the water supply in the area (34% residential outdoor and indoor use).34
In the Okanagan, the areas that require collective approaches for effective adaptation include: water supply and storage, and land use planning (particularly for impacts of competing land uses).
Policy & regulatory resources
The policy and regulatory framework shapes the interface between government and the agriculture sector. Agriculture is embedded in a complex regulatory framework with numerous government agencies. This can create a challenging and fragmented environment for producers managing through difficult or variable conditions.
Producers also raised concerns regarding policy and regulatory frameworks that constrain producers with respect to their management options, which in turn reduce their ability to respond to changing or difficult conditions. Areas of particular concern were water, pest and wildlife management.
BC Agriculture Climate Change Adaptation Risk + Opportunity Assessment Series — The Okanagan Region March 2012 10
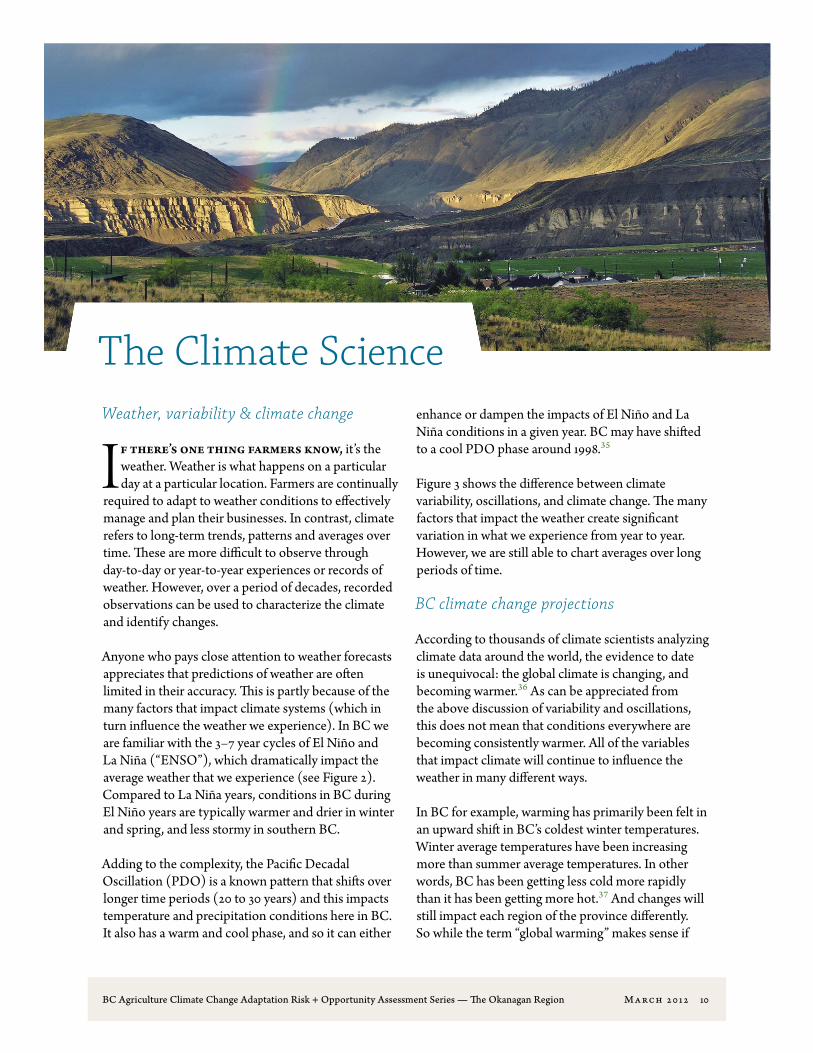
The Climate ScienceWeather, variability & climate change
If there’s one thing farmers know, it’s the weather. Weather is what happens on a particular day at a particular location. Farmers are continually
required to adapt to weather conditions to effectively manage and plan their businesses. In contrast, climate refers to long-term trends, patterns and averages over time. These are more difficult to observe through day-to-day or year-to-year experiences or records of weather. However, over a period of decades, recorded observations can be used to characterize the climate and identify changes.
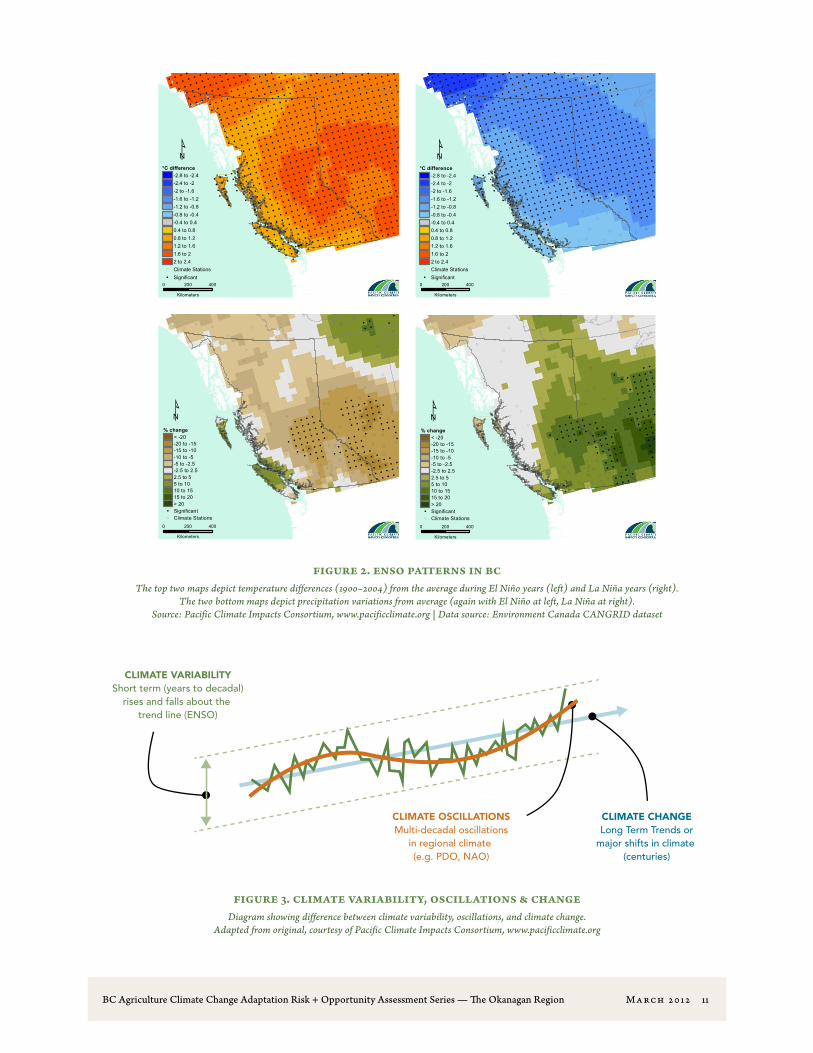
Anyone who pays close attention to weather forecasts appreciates that predictions of weather are often limited in their accuracy. This is partly because of the many factors that impact climate systems (which in turn influence the weather we experience). In BC we are familiar with the 3–7 year cycles of El Niño and La Niña (“ENSO”), which dramatically impact the average weather that we experience (see Figure 2). Compared to La Niña years, conditions in BC during El Niño years are typically warmer and drier in winter and spring, and less stormy in southern BC.
Adding to the complexity, the Pacific Decadal Oscillation (PDO) is a known pattern that shifts over longer time periods (20 to 30 years) and this impacts temperature and precipitation conditions here in BC. It also has a warm and cool phase, and so it can either
enhance or dampen the impacts of El Niño and La Niña conditions in a given year. BC may have shifted to a cool PDO phase around 1998.35
Figure 3 shows the difference between climate variability, oscillations, and climate change. The many factors that impact the weather create significant variation in what we experience from year to year. However, we are still able to chart averages over long periods of time.
BC climate change projections
According to thousands of climate scientists analyzing climate data around the world, the evidence to date is unequivocal: the global climate is changing, and becoming warmer.36 As can be appreciated from the above discussion of variability and oscillations, this does not mean that conditions everywhere are becoming consistently warmer. All of the variables that impact climate will continue to influence the weather in many different ways.
In BC for example, warming has primarily been felt in an upward shift in BC’s coldest winter temperatures. Winter average temperatures have been increasing more than summer average temperatures. In other words, BC has been getting less cold more rapidly than it has been getting more hot.37 And changes will still impact each region of the province differently. So while the term “global warming” makes sense if
BC Agriculture Climate Change Adaptation Risk + Opportunity Assessment Series — The Okanagan Region March 2012 11
CLIMATE VARIABILITYShort term (years to decadal)
rises and falls about the trend line (ENSO)
CLIMATE OSCILLATIONSMulti-decadal oscillations
in regional climate (e.g. PDO, NAO)
CLIMATE CHANGELong Term Trends or
major shifts in climate (centuries)
Figure 2. ENSO patterns in BCThe top two maps depict temperature differences (1900–2004) from the average during El Niño years (left) and La Niña years (right).
The two bottom maps depict precipitation variations from average (again with El Niño at left, La Niña at right). Source: Pacific Climate Impacts Consortium, www.pacificclimate.org | Data source: Environment Canada CANGRID dataset
Figure 3. Climate variability, oscillations & changeDiagram showing difference between climate variability, oscillations, and climate change.
Adapted from original, courtesy of Pacific Climate Impacts Consortium, www.pacificclimate.org
(
(
(
(
(
(
((
(
(
(
(
(
(
(
(
(
(
(
(
(
(
(
(
(
(
(
(
(
( (
(
((
(
(
(
(
(
(
((
(
(
(
(
(
(
(
(
(
(
(
(
(
(
(
((
(
(
(
(
(
(
(
((
(
(
(
(
(
(
(
(
(
(
(
(
(
(
(
(
(
(
!
!
!
!
!
!
!
!
!
!
!
!
!
!
!
!
!
!
!
!
!
!
!
!
!
!
!
!
!
!
!
!
!
!
!
!
!
!
!
!
!
!
!
!
!
!
!
!
!
!
!
!
!
!
!
!
!
!
!
!
!
!
!
!
!
!
!
!
!
!
!!
!
!
!
!
!
!
!
!
!
!
!
!
!
!
!
!
!
!
!
!
!
!
!
!
!
!
!
!
!
!
!
!
!
!
!
!
!
!
!
!
!
!
!!
!
!
!
!
!
!
!
!
!
!
!
!
!
!
!
!
!
!
!
!
!!
!
!
!
!
!
!
!
!
!
!
!
!
!
!
!
!
!
!
!
!
!
!
!
!
!
!
!
!
!
!
!
!
!
!
!
!
!
!
!
!
!!
!
!
!
!
!
!
!
!
!
!
!
!
!
!
!
!
!
!
!
!
!
!
!
!
!
!
!
!
!
!
!
!
!
!
!!
!
!
!
!
!
!
!
!
!
!
!
!
!
!
!
!
!
!
!
!
!
!
!
!
!
!
!
!
!
!
!
!
!
!
!
!
!
!
!
!
!
!
!
!
!
!
!
!
!
!
!
!
!
!
!!
!
!
!
!
!
!
!
!
!
!
!
!
!
!
!
!
!
!
!
!
!
!
!
!
!
!
!
!
!
!
!
!
!
!
!
!
!
!
!
!
!
!
!
!
!
!
!
!
!
!
!
!
!
!
!
!
!
!
!
!
!
!
!
!
!
!
!
!
!
!
!
!
!
!
!
!
!
!
!
!
!
!
!
!
!
!
!
!
!
!
!
!
!
!
!
!
!
!
!
!
!
!
!
!
!
!
!
!
!
!
!
!
!
!
!
!
!
!
!
!
!
!
!
!
!
!
!
!
!
!
!
!!
!
!
!
!
!
!
!
!
!
!
!
!
!
!
!
!
!
!
!
!
!
!
!
!
!
!
!
!
!
!
!
!
!
!
!
!
!
!
!
!
!
!
!
!
!
!
!
!
!
!
!
!
!
!
!
!
!
!
!
!!
!
!
!
!
!
!
!
!
!
!
!
!
!
!
!
!
!
!
!
!
!
!
!
!
!
!
!
!
!
!
!
!
!
!!
!
!
!
!
!
!
!
!
!
!
!
!
!
! !
!
!
!
!
!
!
!
!
!
!
!
!
!
!
!
!
!
!
!
!
!
!
!
!
!
!
!
!
!
!
!
!
!
!
!
!
!
!
!
!
!
!
!
!
!
!
!
!
!
!
!
!
!
!
!
!
!
!
!
!
!
!
!
!
!
!
!
!
!!
!
!
!
!
!
!
!
!
!
!
!
!
!
!
!
! !
!
!
!
!
!
!
!
!
!
!
!
!
!!
!
!
!
!
!
!
!
!
!
!
!
!
!
!
!
!
!
!
!
!
!
!
!
!
! !
!
!
!
!
!
!
!
!
!
!
!
!
!
!
!
!
!
!
!
!
!
!
!
!
!!
!
!
!
!
!
!
!
!
!
!
!!
!
!
!
!
!
!
!
!
!
!
!
!
!
!
!
!
!
!
!
!
!
!
!
!
!
!
!
!
!
!
!
!
!
!
!
!
!
!
!
!
!
!
!
!
!
!
!
!
!
!
!
!
!
!
!
!
!
! !
!
!
!
!
!
!
!
!
!
!
!
!
!
!
!
!
!
!
!
!
!
!
!
!
!
!
!
!
!
!
!
!
!
!
!
!
!
!
!
!
!
!
!
!
!
!
!
!
!
!
!
!
!
!
!
!
!
!
!
!
!
!
!
!
!
!
!
!!
!
!
!
!
!
!
!
!
!
!
!
!
!
!
!
!
!
!
!
!
!
!
!
!
!
!
!
!
!
!
!
!
!
!
!
!
!
!
!
!
!
!
!
!
!
!
!
!
!
!
!
!
!
!
!
!
!
!!
!
!
!
!
!
!
!
!
!
!
!
!
!
!
!
!
!
!
!
!
!
!
!
!!
!
!
!
!
!
!
!
!
!
!
!
!
!
!
!
!
!
!
!
!
!
!
!
!
!
!
!
!
!
!
!
!
!
!
!
!
!
!
!
!
!
!
!
!
!
!
!
!
!
!
!
!
!
!
!
!
!
!
!
!
!
!
!
!
!
!
!
!
!
!
!
!
!
!
!
!
!
!
!
!
!
!
!
!
!
!
!
!
!
!
!!
!
!
!
!
!
!
!
!
!
!
!
!
!
!
!
!
!
!
!!
!
!
!
!
!
!
!
!
!
!
!
!
!
!
!
!
!
!
!
!
!
!
!
!
!
!
!
!
!
!
!
!
!
!
!
!
!
!
!
!
!
!
!
!
!
!
!
!
!
!
!
!
!
!!
!
!
!
!
!
!
!
!
!
!
!
!
!
!
!
!
!
!
!
!
!
!
!
!
!
!
!
!
!
!
!
!
!
!
!
!
!
!
!
!
!
!
!
!
!
!
!
!
!
!
!
!
!
!
!
!
!
!
!
!!
!
!
!
!
!!
!
!
!
!
!
!
!
!
!
!
!
!
!
!
!
!
!
!
! !
!
!
!
!
!
!
!
!
!
!
!
!
!
!
!
!
!
!
!
!
!
!
!
!
!
!
!
!
!
!
!
!
!
!
!
!
!
!
!
!
!
!
!
!!
!
!
!
!
!
!
!
!
!
!
!
!
!
!
!
!
!
!
!
!
!
!!
!
!
!
!
!
!
!
!
!
!
!
!
!!
!
!
!
!
!
!
!
!
!
!
!
! !
!
!
!
!
!
!
!
!
!
!
!
!
!
!
!
!
!
!
!
!
!
!
!
!
!
!
Winter mean temperature - El Niño (1900-2004)
¹
0 200 400
Kilometers
°C difference-2.8 to -2.4-2.4 to -2-2 to -1.6-1.6 to -1.2-1.2 to -0.8-0.8 to -0.4-0.4 to 0.40.4 to 0.80.8 to 1.21.2 to 1.61.6 to 22 to 2.4
( Climate Stations! Significant
(
(
(
(
(
(
(
(
(
(
(
(
(
(
(
(
(
(
(
(
(
(
(
(
(
(
(
(
(
(
(
(
(
(
(
(
(
(
(
(
(
(
(
(
(
(
((
(
(
(
(
(
(
(
(
(
(
(
(
(
(
(
(
( (
(
(
(
(
(
(
(
(
(
((
(
(
(
(
( (
(
(
(
(
(
(
((
(
(
(
(
(
(
(
(
(
(
(
(
(
(
(
((
((
(
(
(
(
(
(
(
(
(
(
(
(
(
(
(
(
(
(
(
(
(
(
(
(
(
(
((
(
(
(
(
(
(
(
(
(
(
((
(
(
(
(
(
(
(
(
(
(
(
(
(
(
(
(
(
(
(
(
(
(
(
(
((
(
(
((
(
(
(
(
(
(
(
(
(
(
(
(
(
(
(
(
(
(
(
(!
!
!
!
!!
!
!
!
!
!
!
!
!
!
!
!
!
!
!
!
!
!
!
!
!
!
!
!
!
!
!
!
!
!
!
!
!
!
!
!
!
!
!
!
!
!
!
!
!
!
!
!
!
!
!
!
!
!
!
!
!
!
!
!
!
!
!
!
!
!
!
!
!
!
!
!
!
!
!
!
!
!
!
!
!
!
!
!
!
!
!
!
!
!
!
!!
!
!!
!
!
!
!
!
!
!
!
!
!
!
!
!
!
!
!
!
!
!
!!
!
!
!
!
!
!
!!
!
!
!
!
!
!!
!
!
!
!
!
!
!
!
!
!
!
!
!
!
!
!
!
!
!
!!
!
Winter precipitation - El Niño (1900-2004)
¹
0 200 400
Kilometers
% change< -20-20 to -15-15 to -10-10 to -5-5 to -2.5-2.5 to 2.52.5 to 55 to 1010 to 1515 to 20> 20
! Significant( Climate Stations
(
(
(
(
(
(
((
(
(
(
(
(
(
(
(
(
(
(
(
(
(
(
(
(
(
(
(
(
( (
(
((
(
(
(
(
(
(
((
(
(
(
(
(
(
(
(
(
(
(
(
(
(
(
((
(
(
(
(
(
(
(
((
(
(
(
(
(
(
(
(
(
(
(
(
(
(
(
(
(
(
!
!
!
!
!
!
!
!
!
!
!
!
!
!
!
!
!
!
!
!
!
!
!
!
!
!
!
!
!
!
!
!
!
!
!
!
!
!
!
!
!
!
!
!
!
!
!
!
!
!
!
!
!
!
!
!
!
!
!
!
!
!
!
!
!
!
!
!
!
!
!
!
!
!
!
!
!
!
!
!
!
!
!
!
!
!
!!
!
!
!
!
!
!
!
!
!
!
!
!
!
!
!
!
!
!
!
!
!
!
!
!
!
!
!
!
!
!
!
!
!
!
!
!
!
!
!
!
!
!
!
!
!
!
!!
!
!
!
!
!
!
!
!
!
!
!
!
!
!
!
!
!
!
!
!
!
!
!
!
!
!
!
!!
!
!
!
!
!
!
!
!
!
!
!
!
!
!
!
!
!
!
!
!
!
!
!
!
!
!
!
!
!
!
!
!
!
!
!
!
!
!
!
!
!!
!
!
!
!
!
!
!
!
!
!!
!
!
!
!
!
!
!
!
!
!
!
!
!
!
!
!
!
!
!
!
!
!
!
!
!
!
!
!
!!
!
!
!
!
!
!
!
!
!
!
!
!
!
!
!
!
!
!
!
!
!
!
!
!
!
!
!
!
!
!
!
!
!
!
!
!
!
!
!
!
!
!
!
!
!
!
!
!
!
!
!
!
!
!
!
!!
!
!
!
!
!
!
!
!
!
!
!
!
!
!
!
!
!
!
!
!
!
!
!
!
!
!
!
!
!
!
!
!
!
!
!
!
!
!
!
!
!
!
!
! !
!
!
!
!
!
!
!
!
!
!
!
!
!
!
!
!
!
!
!
!
!
!
!
!
!
!
!
!
!
!
!! !
!
!
!
!
!
!
!
!
!
!
!
!
!
!
!
!
!
!
!
!
!
!
!
!
!
!
!
!
!
!
!
!
!
!
!
!
!
!
!
!
!
!
!
!
!
!
!
!
!
!
!
!
!
!
!
!
!!
!
!
!
!
!
!
!
!
!
!
! !
!
!
!
!
!
!
!
!
!
!!
!
!
!
!
!
!
!
!
!
!
!
!
!
!
! !
!
!
!
!
!
!
!
!
!
!
!
!
!
!
!
!
!
!
!
!
!!
!
!
!
!
!
!
!
!
!
!!
!
!
!
!
!
!
!
!
!
!
!
!
!
!
!
!
!
!
!
!
!
!
!
!
!
!
!
!
!
!
!
!
!
!
!
!
!
!
!
!
!
!
!
!
!
!
! !
!
!
!
!
!
!
!
!
!
!
!
!
!
!
!
!
!
!
!
!
!
!
!
!
!
!
!
!
!
!
!
!
!
!
!
!
!
!
!
!
!
!
!
!
!
!
!
!
!
!
!
!
!
!
!
!
!
!!
!
!
!
!
!
!
!
!
!
!
!
!
!
!
!
!
!
!
!
!
!
!
!
!
!
!
!
!
!
!
!
!
!
!
!
!
!
!
!!
!
!
!
!
!
!
!!
!
!
!
!
!
!
!
!
!
!
!
!
!
!
!
!
!
!
!
!
!
!
!
!
!
!
!
!
!
!
!
!
!
!
!
!
!
!
!
!
!
!
!
!
!
!
!
!
!
!
!
!
!
!
!
!
!
!
!
!
!
!
!
!
!
!
!
!
!
!
!
!
!
!
!
!
!
!
!
!
!
!!
!
!
!
!
!
!
!
!!
!
!
!
!
!
!!
!
!
!
!
!
!
!
!
!
!
!
!
!
!
!
!
!
!
!
!
!
!
!
!
!
!
!
!
!
!
!
!
!
!
!
!
!
!
!
!
!
!
!
!
!
!!
!
!
!
!
!
! !
!
!
!
!
!
!
!
!
!
!
!
!
!!
!
!
!
!
!
!
!
!
!
!
!
!
!
!
!
!
!
!
!
!
!
!
!
!
!
!
!
!
!
!
!
!
!
!
!
!
!
!
!
!
!
!
!
!
!
!
! !
!
!
!
!
!
!
!
!
!
!
!
!
!
!
!
!
!
!
!
!
!
!
!
!
!
!
!
!
!
!
!
!
!!
!
!
!
!
!
!
!
!
!
!
!!
!
!
!
!
!
!
!
!
!
!
!!
!
!
!
!
!
!
!
!
!
!
!
!
!
!
!
!
!
!
!
!
!
!
!
!
!
!
!
!!
Winter mean temperature - La Niña (1900-2004)
¹
0 200 400
Kilometers
°C difference-2.8 to -2.4-2.4 to -2-2 to -1.6-1.6 to -1.2-1.2 to -0.8-0.8 to -0.4-0.4 to 0.40.4 to 0.80.8 to 1.21.2 to 1.61.6 to 22 to 2.4
( Climate Stations! Significant
(
(
(
(
(
(
(
(
(
(
(
(
(
(
(
(
(
(
(
(
(
(
(
(
(
(
(
(
(
(
(
(
(
(
(
(
(
(
(
(
(
(
(
(
(
(
((
(
(
(
(
(
(
(
(
(
(
(
(
(
(
(
(
( (
(
(
(
(
(
(
(
(
(
((
(
(
(
(
( (
(
(
(
(
(
(
((
(
(
(
(
(
(
(
(
(
(
(
(
(
(
(
((
((
(
(
(
(
(
(
(
(
(
(
(
(
(
(
(
(
(
(
(
(
(
(
(
(
(
(
((
(
(
(
(
(
(
(
(
(
(
((
(
(
(
(
(
(
(
(
(
(
(
(
(
(
(
(
(
(
(
(
(
(
(
(
((
(
(
((
(
(
(
(
(
(
(
(
(
(
(
(
(
(
(
(
(
(
(
(
!
!
!
!
!
!
!
!!
!
!
!
!
!
!
!!
!
!
!
!
!
!
!
!
!
!
!
!
!
!
!
!
!
!
!
!
!
!
!
!
!
!
!
!
!
!
!
!
!
!
!
!
!
!
!
!
!
!
!
!
!
!
!
!
!
!
!
!
!
!!
!
!
!
!
!
!
!
!
! !
!
!!
!!
!
!
!
!
!
!
!
!
!
!!
!
!!
!
!
!
!
!
!
!
!
!
!
!
!
!
!
!
!
!
!
!
!
!
!
!!
!
!
!
!
!
!
!
!
!
!
!
!
!
!
!
!
!!
!
!
!
!
!
!
!
!
!
!
!
!
!
!
!
!
!
!
!
!
!
!
!
!
!
!
!
!
!
!
!
!
!
!
!
!
!
!
!
!
!
!
!
!
!
!
!
Winter precipitation - La Niña (1900-2004)
¹
0 200 400
Kilometers
% change< -20-20 to -15-15 to -10-10 to -5-5 to -2.5-2.5 to 2.52.5 to 55 to 1010 to 1515 to 20> 20
! Significant( Climate Stations
BC Agriculture Climate Change Adaptation Risk + Opportunity Assessment Series — The Okanagan Region March 2012 12
you talk about the overall trend, at a regional level, “climate change” is a more appropriate way to describe what is occurring.
While rising sea levels do not directly impact all regions, this could potentially reduce the overall agricultural land base of the province. Global sea level has risen more than 20 cm since 1899,38 but this varies considerably by location due to land movement (rising or falling) and climate and weather variability. Future projections show that sea level rise will continue. Estimates for the BC coast over the next century suggest a possible sea level rise of at least 80 to 120 cm at the Fraser River Delta, and 50 to 80 cm at Nanaimo.39
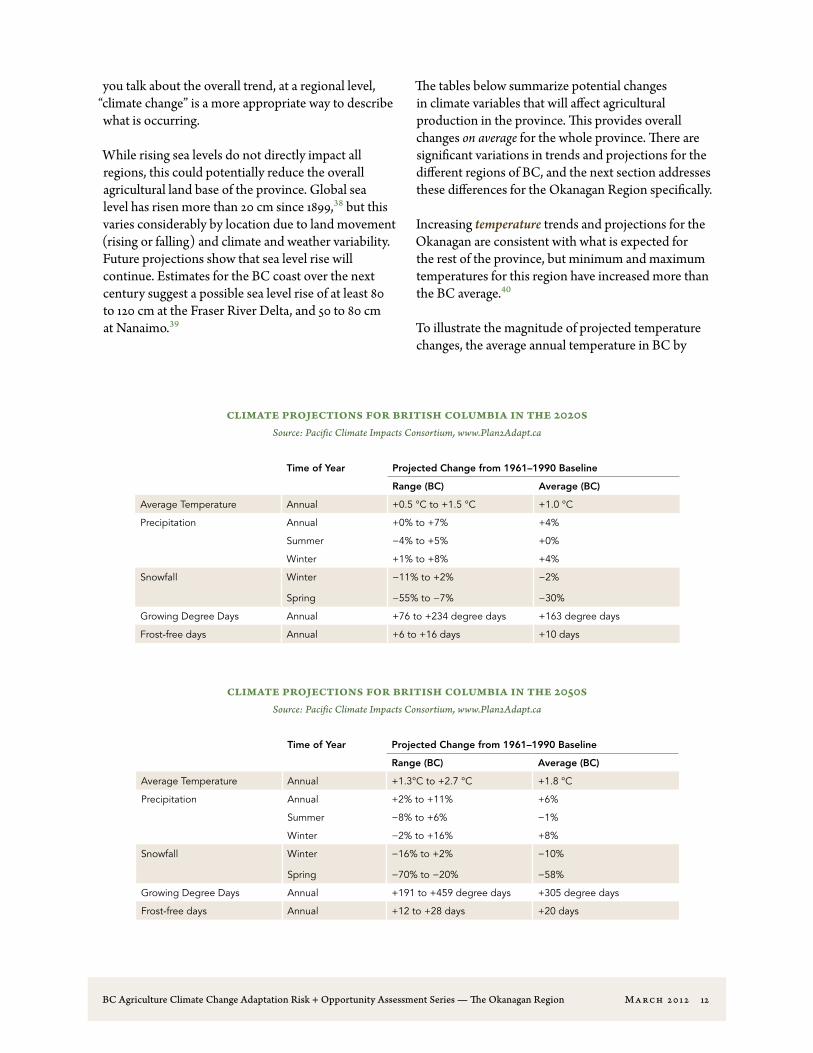
The tables below summarize potential changes in climate variables that will affect agricultural production in the province. This provides overall changes on average for the whole province. There are significant variations in trends and projections for the different regions of BC, and the next section addresses these differences for the Okanagan Region specifically.
Increasing temperature trends and projections for the Okanagan are consistent with what is expected for the rest of the province, but minimum and maximum temperatures for this region have increased more than the BC average.40
To illustrate the magnitude of projected temperature changes, the average annual temperature in BC by
Climate Projections for British Columbia in the 2020sSource: Pacific Climate Impacts Consortium, www.Plan2Adapt.ca
Time of Year Projected Change from 1961–1990 Baseline
Range (BC) Average (BC)
Average Temperature Annual +0.5 °C to +1.5 °C +1.0 °C
Precipitation Annual +0% to +7% +4%
Summer −4% to +5% +0%
Winter +1% to +8% +4%
Snowfall Winter −11% to +2% −2%
Spring −55% to −7% −30%
Growing Degree Days Annual +76 to +234 degree days +163 degree days
Frost-free days Annual +6 to +16 days +10 days
Climate Projections for British Columbia in the 2050sSource: Pacific Climate Impacts Consortium, www.Plan2Adapt.ca
Time of Year Projected Change from 1961–1990 Baseline
Range (BC) Average (BC)
Average Temperature Annual +1.3°C to +2.7 °C +1.8 °C
Precipitation Annual +2% to +11% +6%
Summer −8% to +6% −1%
Winter −2% to +16% +8%
Snowfall Winter −16% to +2% −10%
Spring −70% to −20% −58%
Growing Degree Days Annual +191 to +459 degree days +305 degree days
Frost-free days Annual +12 to +28 days +20 days
BC Agriculture Climate Change Adaptation Risk + Opportunity Assessment Series — The Okanagan Region March 2012 13
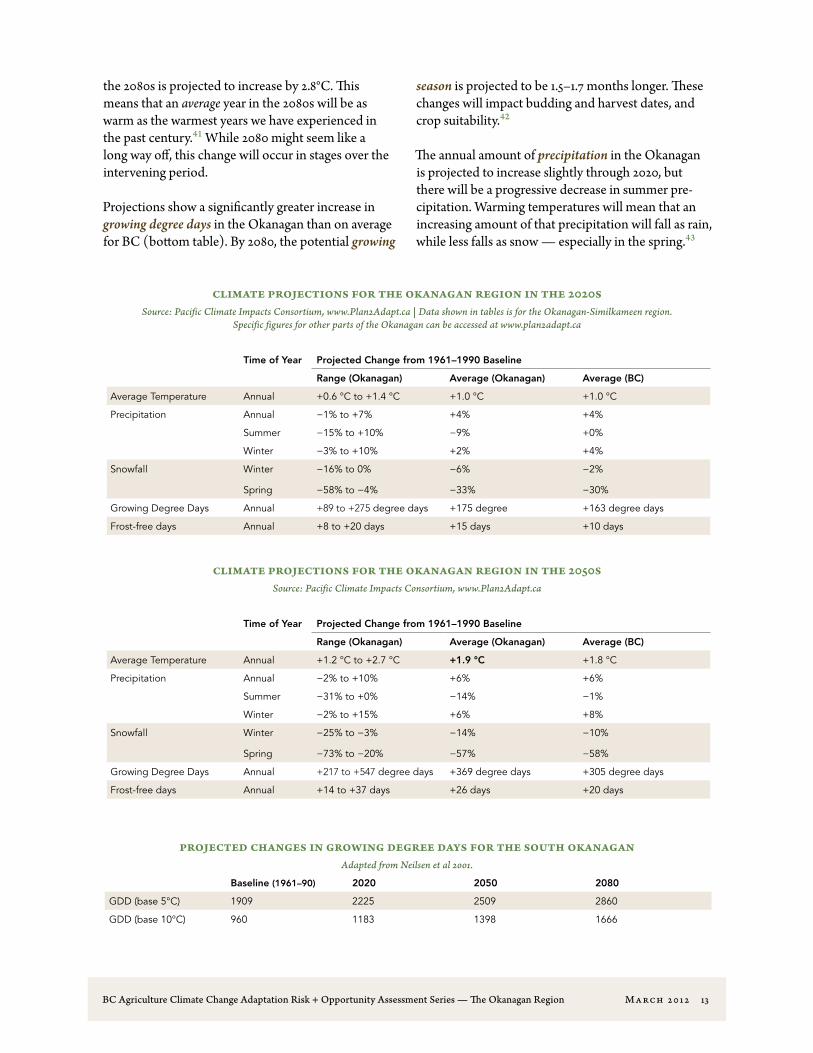
Climate Projections for the Okanagan Region in the 2020sSource: Pacific Climate Impacts Consortium, www.Plan2Adapt.ca | Data shown in tables is for the Okanagan-Similkameen region.
Specific figures for other parts of the Okanagan can be accessed at www.plan2adapt.ca
Time of Year Projected Change from 1961–1990 Baseline
Range (Okanagan) Average (Okanagan) Average (BC)
Average Temperature Annual +0.6 °C to +1.4 °C +1.0 °C +1.0 °C
Precipitation Annual −1% to +7% +4% +4%
Summer −15% to +10% −9% +0%
Winter −3% to +10% +2% +4%
Snowfall Winter −16% to 0% −6% −2%
Spring −58% to −4% −33% −30%
Growing Degree Days Annual +89 to +275 degree days +175 degree +163 degree days
Frost-free days Annual +8 to +20 days +15 days +10 days
Climate Projections for the Okanagan Region in the 2050sSource: Pacific Climate Impacts Consortium, www.Plan2Adapt.ca
Time of Year Projected Change from 1961–1990 Baseline
Range (Okanagan) Average (Okanagan) Average (BC)
Average Temperature Annual +1.2 °C to +2.7 °C +1.9 °C +1.8 °C
Precipitation Annual −2% to +10% +6% +6%
Summer −31% to +0% −14% −1%
Winter −2% to +15% +6% +8%
Snowfall Winter −25% to −3% −14% −10%
Spring −73% to −20% −57% −58%
Growing Degree Days Annual +217 to +547 degree days +369 degree days +305 degree days
Frost-free days Annual +14 to +37 days +26 days +20 days
Projected changes in growing degree days for the south OkanaganAdapted from Neilsen et al 2001.
Baseline (1961–90) 2020 2050 2080
GDD (base 5°C) 1909 2225 2509 2860
GDD (base 10°C) 960 1183 1398 1666
the 2080s is projected to increase by 2.8°C. This means that an average year in the 2080s will be as warm as the warmest years we have experienced in the past century.41 While 2080 might seem like a long way off, this change will occur in stages over the intervening period.
Projections show a significantly greater increase in growing degree days in the Okanagan than on average for BC (bottom table). By 2080, the potential growing
season is projected to be 1.5–1.7 months longer. These changes will impact budding and harvest dates, and crop suitability.42
The annual amount of precipitation in the Okanagan is projected to increase slightly through 2020, but there will be a progressive decrease in summer pre-cipitation. Warming temperatures will mean that an increasing amount of that precipitation will fall as rain, while less falls as snow — especially in the spring.43
BC Agriculture Climate Change Adaptation Risk + Opportunity Assessment Series — The Okanagan Region March 2012 14
Over the past thirty years, a decrease in annual streamflow has been observed in the Okanagan, along with an increase in the average minimum flows and a decrease in average high flows. As the hydrology of the Okanagan is driven by snow, the projected shift to a more rain-dominated regime and the reduction in snowpack will have significant impacts on streamflow and surface water. A decreased snowmelt in the spring will lower peak flows at that time, and the timing of spring peak flows will occur progressively earlier as a result. Overall, more variable timing of peak flows is expected, and annual flows are projected to decrease.44 On the other hand, groundwater recharge is also expected to occur earlier in the year when evaporative demand is lower, which could result in a minor increase in groundwater reserves.45
Based on future projections and detailed modeling for the south Okanagan, studies have shown that an increasing evapotranspiration rate and longer growing season will increase crop water demand in the future. Increases of between 12% and 20% are projected for 2020, 24–38% for 2050, and 40–61% for 2080. To put this in perspective, conditions giving rise to what is considered “extreme” crop water demand today (occurring about 1% of the time in the historical record), would be the average by the 2050s (occurring about 46% of the time).46
Furthermore, the timing of high demand and low supply in the region tends to coincide, creating the potential for supply shortages. Modeling suggested that areas drawing water from the main channel and lake system would likely have sufficient supplies, but those drawing from tributaries may not.47 Without taking specific measures to adapt, projections suggest that the total annual water demand for the Okanagan will be greater than available annual inflows by later this century.48 A detailed study of future climate change scenarios for Trout Creek* showed an increased frequency of crop water demand exceeding the existing irrigation supply capacity, as well as an increased frequency of drought.49
Extreme weather events are projected to occur more often in BC in the future, and studies have shown some specific trends already.50 These include an increase in heavy rainfall events in the spring, and an increase in extreme wet and extreme dry conditions in summer. The intensity and magnitude of precipitation events is projected to increase in the future.
Forest fires have become more frequent and severe in western North America, and this trend is projected to continue.51
* Water withdrawals from Trout Creek are predominantly for agricultural use.
BC Agriculture Climate Change Adaptation Risk + Opportunity Assessment Series — The Okanagan Region March 2012 15
Impacts, Risks & Opportunities
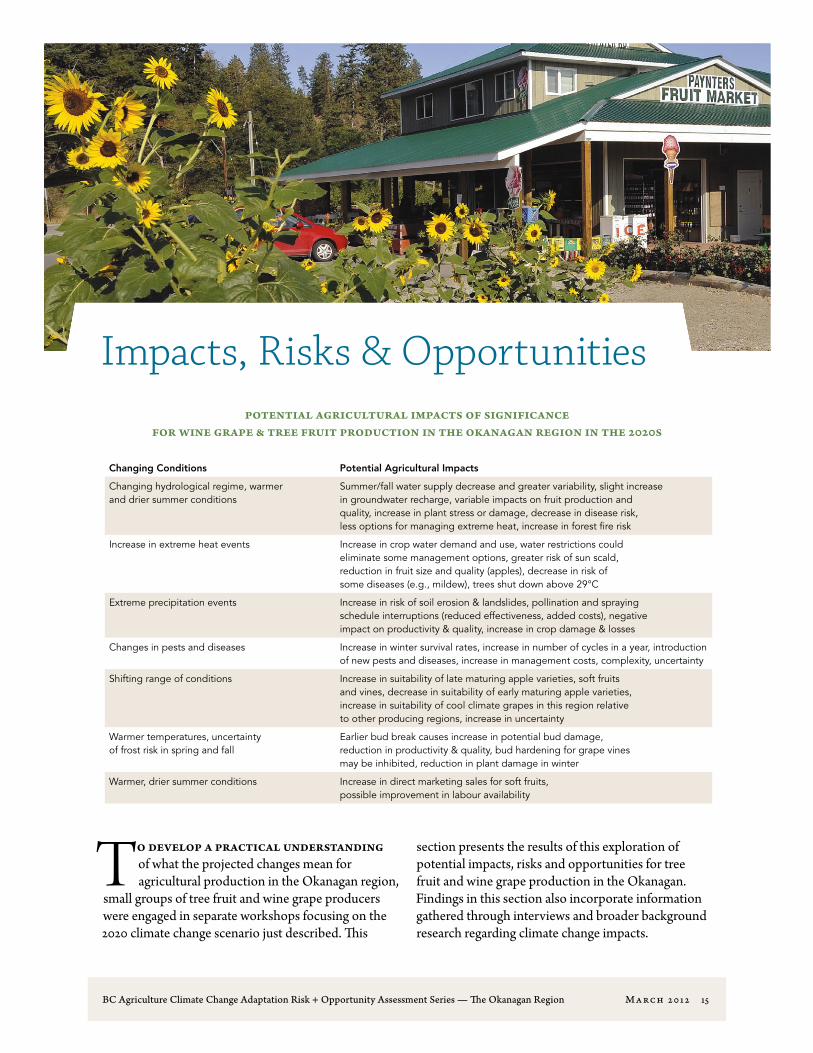
To develop a practical understanding of what the projected changes mean for agricultural production in the Okanagan region,
small groups of tree fruit and wine grape producers were engaged in separate workshops focusing on the 2020 climate change scenario just described. This
section presents the results of this exploration of potential impacts, risks and opportunities for tree fruit and wine grape production in the Okanagan. Findings in this section also incorporate information gathered through interviews and broader background research regarding climate change impacts.
Potential agricultural impacts of significance for Wine Grape & Tree Fruit production in the Okanagan Region in the 2020s
Changing Conditions Potential Agricultural Impacts
Changing hydrological regime, warmer and drier summer conditions
Summer/fall water supply decrease and greater variability, slight increase in groundwater recharge, variable impacts on fruit production and quality, increase in plant stress or damage, decrease in disease risk, less options for managing extreme heat, increase in forest fire risk
Increase in extreme heat events Increase in crop water demand and use, water restrictions could eliminate some management options, greater risk of sun scald, reduction in fruit size and quality (apples), decrease in risk of some diseases (e.g., mildew), trees shut down above 29°C
Extreme precipitation events Increase in risk of soil erosion & landslides, pollination and spraying schedule interruptions (reduced effectiveness, added costs), negative impact on productivity & quality, increase in crop damage & losses
Changes in pests and diseases Increase in winter survival rates, increase in number of cycles in a year, introduction of new pests and diseases, increase in management costs, complexity, uncertainty
Shifting range of conditions Increase in suitability of late maturing apple varieties, soft fruits and vines, decrease in suitability of early maturing apple varieties, increase in suitability of cool climate grapes in this region relative to other producing regions, increase in uncertainty
Warmer temperatures, uncertainty of frost risk in spring and fall
Earlier bud break causes increase in potential bud damage, reduction in productivity & quality, bud hardening for grape vines may be inhibited, reduction in plant damage in winter
Warmer, drier summer conditions Increase in direct marketing sales for soft fruits, possible improvement in labour availability
BC Agriculture Climate Change Adaptation Risk + Opportunity Assessment Series — The Okanagan Region March 2012 16
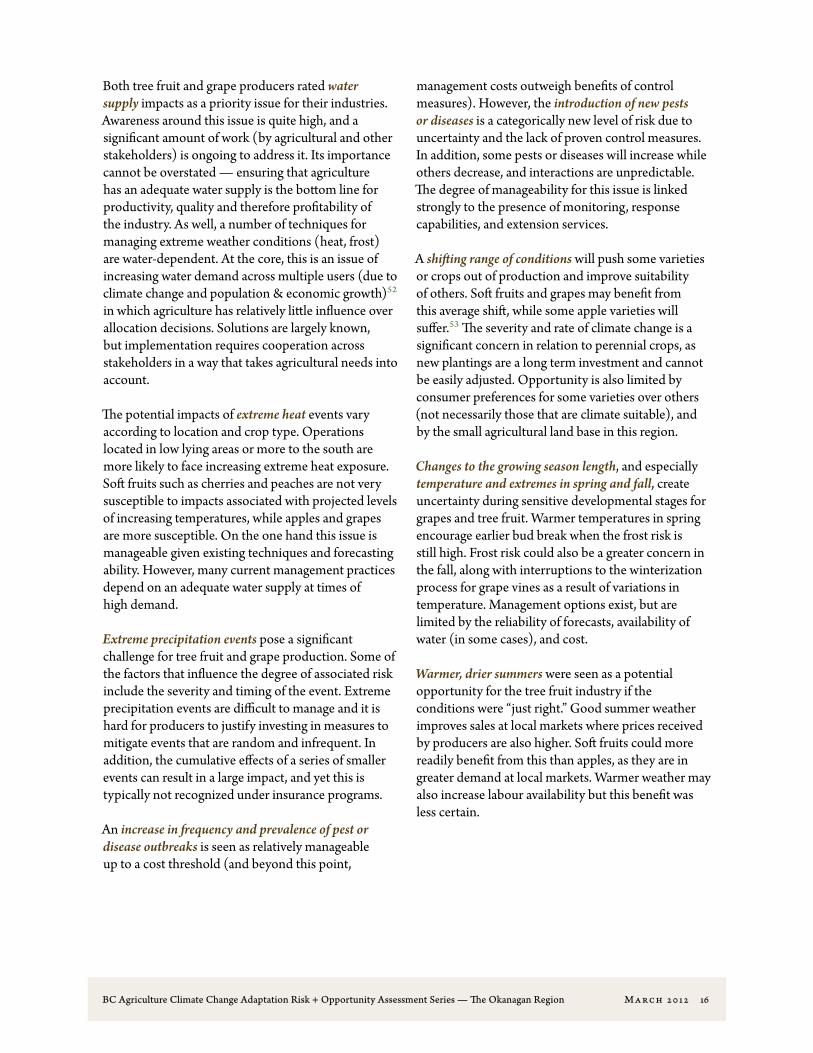
Both tree fruit and grape producers rated water supply impacts as a priority issue for their industries. Awareness around this issue is quite high, and a significant amount of work (by agricultural and other stakeholders) is ongoing to address it. Its importance cannot be overstated — ensuring that agriculture has an adequate water supply is the bottom line for productivity, quality and therefore profitability of the industry. As well, a number of techniques for managing extreme weather conditions (heat, frost) are water-dependent. At the core, this is an issue of increasing water demand across multiple users (due to climate change and population & economic growth)52 in which agriculture has relatively little influence over allocation decisions. Solutions are largely known, but implementation requires cooperation across stakeholders in a way that takes agricultural needs into account.
The potential impacts of extreme heat events vary according to location and crop type. Operations located in low lying areas or more to the south are more likely to face increasing extreme heat exposure. Soft fruits such as cherries and peaches are not very susceptible to impacts associated with projected levels of increasing temperatures, while apples and grapes are more susceptible. On the one hand this issue is manageable given existing techniques and forecasting ability. However, many current management practices depend on an adequate water supply at times of high demand.
Extreme precipitation events pose a significant challenge for tree fruit and grape production. Some of the factors that influence the degree of associated risk include the severity and timing of the event. Extreme precipitation events are difficult to manage and it is hard for producers to justify investing in measures to mitigate events that are random and infrequent. In addition, the cumulative effects of a series of smaller events can result in a large impact, and yet this is typically not recognized under insurance programs.
An increase in frequency and prevalence of pest or disease outbreaks is seen as relatively manageable up to a cost threshold (and beyond this point,
management costs outweigh benefits of control measures). However, the introduction of new pests or diseases is a categorically new level of risk due to uncertainty and the lack of proven control measures. In addition, some pests or diseases will increase while others decrease, and interactions are unpredictable. The degree of manageability for this issue is linked strongly to the presence of monitoring, response capabilities, and extension services.
A shifting range of conditions will push some varieties or crops out of production and improve suitability of others. Soft fruits and grapes may benefit from this average shift, while some apple varieties will suffer.53 The severity and rate of climate change is a significant concern in relation to perennial crops, as new plantings are a long term investment and cannot be easily adjusted. Opportunity is also limited by consumer preferences for some varieties over others (not necessarily those that are climate suitable), and by the small agricultural land base in this region.
Changes to the growing season length, and especially temperature and extremes in spring and fall, create uncertainty during sensitive developmental stages for grapes and tree fruit. Warmer temperatures in spring encourage earlier bud break when the frost risk is still high. Frost risk could also be a greater concern in the fall, along with interruptions to the winterization process for grape vines as a result of variations in temperature. Management options exist, but are limited by the reliability of forecasts, availability of water (in some cases), and cost.
Warmer, drier summers were seen as a potential opportunity for the tree fruit industry if the conditions were “just right.” Good summer weather improves sales at local markets where prices received by producers are also higher. Soft fruits could more readily benefit from this than apples, as they are in greater demand at local markets. Warmer weather may also increase labour availability but this benefit was less certain.
BC Agriculture Climate Change Adaptation Risk + Opportunity Assessment Series — The Okanagan Region March 2012 17
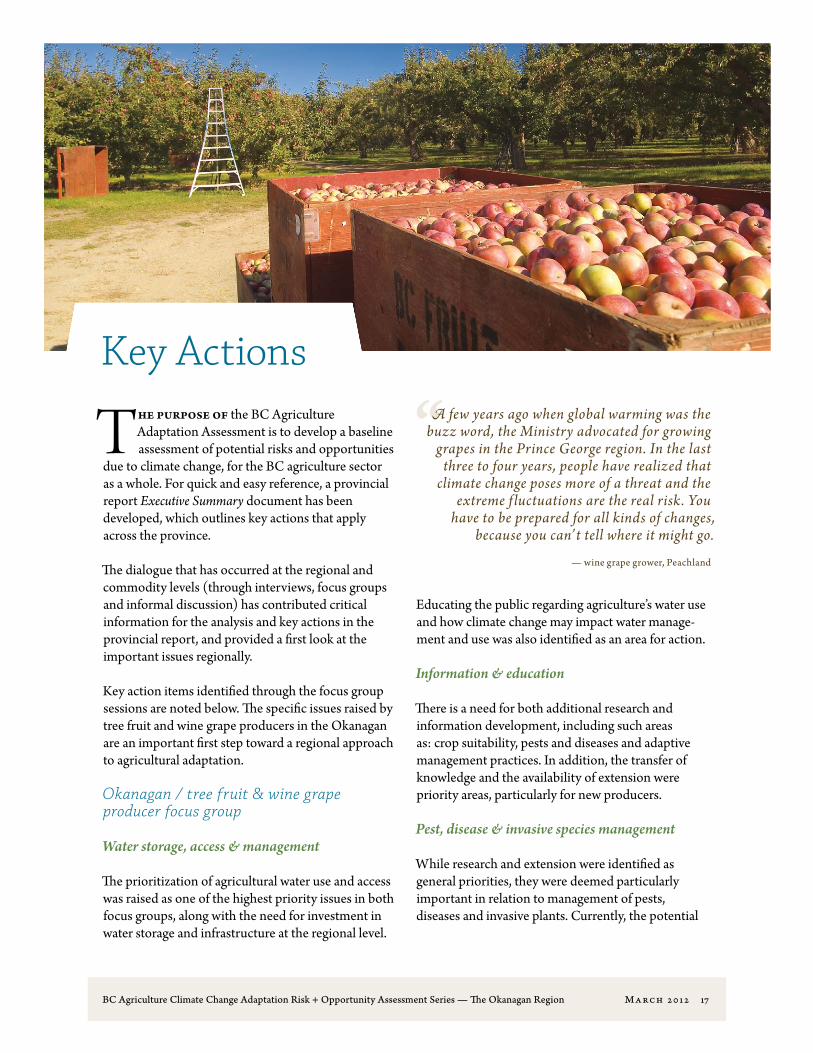
Key Actions
The purpose of the BC Agriculture Adaptation Assessment is to develop a baseline assessment of potential risks and opportunities
due to climate change, for the BC agriculture sector as a whole. For quick and easy reference, a provincial report Executive Summary document has been developed, which outlines key actions that apply across the province.
The dialogue that has occurred at the regional and commodity levels (through interviews, focus groups and informal discussion) has contributed critical information for the analysis and key actions in the provincial report, and provided a first look at the important issues regionally.
Key action items identified through the focus group sessions are noted below. The specific issues raised by tree fruit and wine grape producers in the Okanagan are an important first step toward a regional approach to agricultural adaptation.
Okanagan / tree fruit & wine grape producer focus group
Water storage, access & management
The prioritization of agricultural water use and access was raised as one of the highest priority issues in both focus groups, along with the need for investment in water storage and infrastructure at the regional level.
Educating the public regarding agriculture’s water use and how climate change may impact water manage-ment and use was also identified as an area for action.
Information & education
There is a need for both additional research and information development, including such areas as: crop suitability, pests and diseases and adaptive management practices. In addition, the transfer of knowledge and the availability of extension were priority areas, particularly for new producers.
Pest, disease & invasive species management
While research and extension were identified as general priorities, they were deemed particularly important in relation to management of pests, diseases and invasive plants. Currently, the potential
A few years ago when global warming was the buzz word, the Ministry advocated for growing
grapes in the Prince George region. In the last three to four years, people have realized that
climate change poses more of a threat and the extreme f luctuations are the real risk. You
have to be prepared for all kinds of changes, because you can’t tell where it might go.
— wine grape grower, Peachland
BC Agriculture Climate Change Adaptation Risk + Opportunity Assessment Series — The Okanagan Region March 2012 18
spread of spotted-wing drosophila is of particular concern for soft fruit producers.
Development of an effective collective monitoring, surveillance and response systems is needed. While growers and producer associations are doing what they can, at present there is too much of a time lag in addressing emerging pests.
Management practices & approaches
Managing a tree fruit or wine grape operation requires knowledge of many practices and approaches. However, looking ahead to the changing conditions, particularly increasing variability and extremes, sup-port for adaptive management practices is important. It was suggested that operations will need to “retool” to adapt. Review of management tools and technolo-gies along with information, extension and incentives in support of this transition process will be needed.
Collective approaches for infrastructure management
As is the case across the province, many of the key agricultural adaptation issues in the Okanagan region relate to off-farm infrastructure and collective
management decisions. Developing cooperative and cross-agency approaches is a priority. Some of the key areas of need identified were: water supply and storage, extreme events preparation and management, pest and disease monitoring and control, and land use decisions.
Risk management & compensation programs
The effectiveness of current compensation programs was of concern in circumstances where damage and losses cannot be mitigated, particularly incremental or repeated losses. Adjusting inflexible approaches (use of income margins or average yield for compensation) and improving the accessibility of compensation was deemed to be a high priority.
It’s troubling because we’ve always had less pressure in terms of pests and diseases in the
Okanagan. The insect complex seems to be changing but it ’s difficult to say with certainty
that this is due to climate change…Warming of climate could be positive for grape growers,
but with the unknown factors of pests and diseases it is hard to be certain of impacts.
— wine grape grower, Peachland
BC Agriculture Climate Change Adaptation Risk + Opportunity Assessment Series — The Okanagan Region March 2012 19
Endnotes1 Webber, Jean. A Rich and Fruitful Land:
The History of the Valleys of the Okanagan, Similkameen and Shuswap. Harbour Publishing, Madeira Park: 1999. P.54.
2 Koroscil, Paul M. The British Garden of Eden: Settlement History of the Okanagan Valley, British Columbia. Simon Fraser University: 2003. pp.70–103.
3 BC Ministry of Agriculture & Lands. Regional District of North Okanagan Agricultural Overview. July 2008. http://www.agf.gov.bc.ca/resmgmt/sf/agoverviews_2006census/RD_North_OK_Ag_Overview.pdf
4 Wilson, Wayne. “History of the Okanagan Valley Wine Region.” British Columbia VQA Wineshop, http://www.bcvqawine.ca/p/history-of-okanagan-valley-wine-region.html
5 Cannings, Richard J. and Eva Durance. Human use of natural resources in the South Okanagan and Lower Similkameen valleys in Smith, I.M., and G.G.E. Scudder, eds. Assessment of species diversity in the Montane Cordillera Ecozone. Burlington: Ecological Monitoring and Assessment Network, 1998.http://www.naturewatch.ca/eman/reports/publications/99_montane/humans/humans07.html
6 Wilson, Wayne. “History of the Okanagan Valley Wine Region.” British Columbia VQA Wineshop, http://www.bcvqawine.ca/p/history-of-okanagan-valley-wine-region.html
7 Wilson, Wayne. “History of the Okanagan Valley Wine Region.” British Columbia VQA Wineshop, http://www.bcvqawine.ca/p/history-of-okanagan-valley-wine-region.html
8 Our Okanagan: Okanagan Valley Regional Profile. P.9 http://www.ourokanagan.ca/assets/files/OK%20VALLEY%20PROFILE.pdf
9 BC Ministry of Agriculture & Lands. Regional District of Okanagan Similkameen Agricultural Overview. July 2008. http://www.agf.gov.bc.ca/resmgmt/sf/agoverviews_2006census/RD_OK_SIM_Ag_Overview.pdf BC Ministry of Agriculture & Lands. Regional District of Central Okanagan Agricultural Overview. February 2009. http://www.investkelowna.com/documents/RDCentralOkAgOv.pdf BC Ministry of Agriculture & Lands. Regional District of North Okanagan Agricultural Overview. July 2008. http://www.agf.gov.bc.ca/resmgmt/sf/agoverviews_2006census/RD_North_OK_Ag_Overview.pdf
10 Main Report of the Consultative Board: Canada British Columbia Okanagan Basin Agreement. Chapter 1 http://www.waterbucket.ca/okw/?sid=3&id=114&type=single
11 Main Report of the Consultative Board: Canada British Columbia Okanagan Basin Agreement. Chapter 1 http://www.waterbucket.ca/okw/?sid=3&id=114&type=single
12 Cohen, Stewart and Tanuja Kulkarni (eds.) Water Management & Climate Change in the Okanagan Basin. Environment Canada & University of British Columbia. 2001. P 9. http://www.nrcan.gc.ca/earth-sciences/projdb/pdf/46_e.pdf
13 Main Report of the Consultative Board: Canada British Columbia Okanagan Basin Agreement. Chapter 1 http://www.waterbucket.ca/okw/?sid=3&id=114&type=single
14 Cohen, Stewart and Tanuja Kulkarni (eds.) Water Management & Climate Change in the Okanagan Basin. Environment Canada & University of British Columbia. 2001. P 9. http://www.nrcan.gc.ca/earth-sciences/projdb/pdf/46_e.pdf
15 Agricultural Land Reserve: Table 2: Area Included and Excluded from the ALR by Regional District in hectares for the period from 1974 to December 31, 2009. http://www.alc.gov.bc.ca/alr/stats/Table2_incl-excl_RDallyears.pdf
16 BC Ministry of Agriculture & Lands. Regional District of Okanagan Similkameen Agricultural Overview. July 2008. http://www.agf.gov.bc.ca/resmgmt/sf/agoverviews_2006census/RD_OK_SIM_Ag_Overview.pdf BC Ministry of Agriculture & Lands. Regional District of Central Okanagan Agricultural Overview. February 2009. http://www.investkelowna.com/documents/RDCentralOkAgOv.pdf BC Ministry of Agriculture & Lands. Regional District of North Okanagan Agricultural Overview. July 2008. http://www.agf.gov.bc.ca/resmgmt/sf/agoverviews_2006census/RD_North_OK_Ag_Overview.pdf
17 Ibid.
18 Statistics Canada: 2006 Census of Agriculture: Average age of farm operators: http://www.statcan.gc.ca/pub/95-629-x/8/4124836-eng.htm#59
19 British Columbia Agriculture in the Classroom Foundation. “Grow BC” A Guide to BC’s Agriculture Resources. ‘Thompson-Okanagan Region Agriculture Profile” p. 19
20 BC Ministry of Agriculture & Lands. 2006 Census of Agriculture and Historical Comparisons. July 2007. http://www.agf.gov.bc.ca/stats/Census/2006_Agriculture_Census.pdf
21 BC Ministry of Agriculture & Lands. 2006 Census of Agriculture and Historical Comparisons. July 2007. http://www.agf.gov.bc.ca/stats/Census/2006_Agriculture_Census.pdf
22 British Columbia Grape Growers Association. 2011 BC Grape Acreage Report. http://www.grapegrowers.bc.ca
23 BC Ministry of Agriculture & Lands. Regional District of Central Okanagan Agricultural Overview. February 2009. http://www.investkelowna.com/documents/RDCentralOkAgOv.pdf
24 BC Ministry of Agriculture & Lands. Regional District of North Okanagan Agricultural Overview. July 2008. http://www.agf.gov.bc.ca/resmgmt/sf/agoverviews_2006census/RD_North_OK_Ag_Overview.pdf
25 BC Ministry of Agriculture & Lands. Regional District of Okanagan Similkameen Agricultural Overview. July 2008. http://www.agf.gov.bc.ca/resmgmt/sf/agoverviews_2006census/RD_OK_SIM_Ag_Overview.pdf
26 Stokes, C. and M. Howden (eds.) 2010. Adapting Agriculture to Climate Change. CSIRO Publishing: Melbourne.
27 This framework for adaptive capacity was developed based on our interviews with producers in BC, together with approaches presented in Belliveau et al 2006; Moser et al 2008; Smit & Wandel 2006; Reid et al 2007; Yohe & Tol 2002; Smit & Pilifosova 2003; Stokes and Howden 2010
28 http://www.climate-decisions.org/2_Adaptive%20Capacity.htm
29 A strong example of this type of analysis may be found in: The Prairie Climate Resilience Project: Indicators of Adaptive Capacity to Climate Change for Agriculture in the Prairie Region of Canada. http://www.iisd.org/pdf/2007/climate_adaptive_cap.pdf
30 Land, Margaret. Fruit & Vegetable Magazine. http://www.fruitandveggie.com/content/view/3068/38/
31 BC Ministry of Agriculture. Fast Stats 2010: Agriculture, Aquaculture and Food. June 1, 2011. P.16 http://www.agf.gov.bc.ca/stats/faststats/FastStats2010_R2.pdf
32 http://www.irrigationbc.com
33 For example, the Okanagan Water Supply and Demand Study (http://www.obwb.ca/wsd/) and the multi-stakeholder decision support tool “Okanagan Fish/Water Management Tool” (http://essa.com/tools/okfwm/). Also see Cohen, S., D. Neilsen, and R. Welbourn (eds.). 2004. Expanding the Dialogue on Climate Change & Water Management in the Okanagan Basin, British Columbia. Final Report for project A463/433, Climate Change Impacts and Adaptation Program, Natural Resources Canada.
34 Okanagan Water Supply and Demand Project http://www.obwb.ca/wsd/key-findings/water-use
35 Jakob, M., McKendry, I., and Lee, R. 2003. Long-term changes in rainfall intensity in Vancouver, British Columbia. Canadian Water Resources Journal. 28(4): 587–604.
36 IPCC, 2007: Climate Change 2007: Synthesis Report. Contribution of Working Groups I, II and III to the Fourth Assessment Report of the Intergovernmental Panel on Climate Change [Core Writing Team, Pachauri, R.K and Reisinger, A. (eds.)]. IPCC, Geneva, Switzerland, 104 pp.
37 Rodenhuis, D.R., Bennett, K.E., Werner, A.T., Murdock, T.Q., Bronaugh, D. 2009. Hydro-climatology and future climate impacts in British Columbia. Pacific Climate Impacts Consortium, University of Victoria, Victoria BC.
38 Mazzotti S., C. Jones, and R.E. Thomson, 2008. Relative and absolute sea level rise in western Canada and northwestern United States from a combined tide gauge-GPS analysis . Journal of Geophysical Research — Oceans. 113 (C11).
39 Bornhold, B., 2008. Projected sea level changes for British Columbia in the 21st century. BC Climate Change Branch and the Government of Canada. 9 pp.
40 Rodenhuis et al 2009
41 Ibid: pg 77.
42 Neilsen, D., S. Smith, W. Koch, G. Frank, J. Hall and P. Parchomchuk. 2001. Impact of climate change on crop water demand and crop suitability in the Okanagan Valley, BC. Technical Bulletin 01-15. Pacific Agri-Food Research Centre, Summerland, BC. 32pp.; and Rayne, S., K. Forest, and K. Friesen, 2011. Projected Climate Change Impacts on Grape Growing in the Okanagan Valley, British Columbia, Canada. Nature Precedings, February 25, 2011. Accessed 30/8/11 at http://precedings.nature.com/documents/3162/version/2
43 Pacific Climate Impacts Consortium, Plan2Adapt Climate Change Tool for Planners. Accessed at http://pacificclimate.org/tools-and-data/plan2adapt
BC Agriculture Climate Change Adaptation Risk + Opportunity Assessment Series — The Okanagan Region March 2012 20
44 Rodenhuis et al 2009; and Merritt, W., Y. Alila, M. Barton, B. Taylor, S. Cohen, and D. Neilsen, 2006. Hydrologic response to scenarios of climate change in subwatersheds of the Okanagan Basin, British Columbia. Journal of Hydrology, 326: 79–108.
45 Toews, M.W. and D.M. Allen. 2009. Evaluating different GCMs for predicting spatial recharge in an irrigated arid region. J. Hydrol. 374: 265–281.
46 Cohen, S., D. Neilsen, S. Smith, T. Neale, B. Taylor, M. Barton, W. Merritt, Y. Alila, P. Shepherd, R. McNeill, J. Tansey, J. Carmichael and S. Langsdale. 2006. Learning with local help: expanding the dialogue on climate change and water management in the Okanagan Region, British Columbia, Canada. Climatic Change, 75: 331–358.
47 Neilsen et al 2001
48 Langsdale, S., Beall, A., Carmichael, J., Cohen, S. and Forster, C. 2006. Description of the model; in Participatory Integrated Assessment of Water Management and Climate Change in the Okanagan Basin, British Columbia, (ed.) S. Cohen and T. Neale; Report submitted to the Climate Change Impacts and Adaptation Program, Natural Resources Canada. Retrieved from: http://adaptation.nrcan.gc.ca/projdb/pdf/a846_e.pdf; and Walker, I.J. and Sydneysmith, R. (2008): British Columbia. In, From Impacts to Adaptation: Canada in a Changing Climate. D.S. Lemmen, F.J. Warren, J. Lacroix and E. Bush (eds); Gov. Canada, Ottawa,p. 329–386.
49 Neilsen, D., Smith, C. A. S., Frank, G., Koch, W., Alila, Y., Merritt, W. S., Taylor, W. G., Barton, M., Hall, J. W. and Cohen, S. J. 2006. Potential impacts of climate change on water availability for crops in the Okanagan Basin, British Columbia. Can. J. Soil Sci. 86: 921–936.
50 Stone, D. A., A. J. Weaver, and F. W. Zwiers, 2000. Trends in Canadian precipitation intensity. Atmos.–Ocean, 38: 321–347; and Zhang, X., Vincent, L.A., Hogg, W.D. and Niitsoo, A., 2000. Temperature and precipitation trends in Canada during the 20th century. Atmosphere-Ocean, 38(3): 395–429.
51 Walker and Sydneysmith 2008
52 See Okanagan Water Supply and Demand Project for more information: http://www.obwb.ca/wsd
53 Neilsen et al 2001