Wind Study and GPS Dropsonde Applicability to Airdrop Testing
15
(c)2001 American Institute of Aeronautics & Astronautics or Published with Permission of Author(s) and/or Author(s)' Sponsoring Organization. A01-29297 16 th AIAA Aerodynamic Decelerator Systems Technology Conference and Seminar 21 - 24 May 2001 Boston, MA AIAA 2001-2022 WIND STUDY AND GPS DROPSONDE APPLICABILITY TO AIRDROP TESTING Katherine Kelly and Brooksie Pena Test Directors, U.S. Army Yuma Proving Ground Aviation and Airdrop Systems Division, ATTN: CSTE-DTC-YP-MT-EA Yuma, AZ 85365-9110 Abstract Wind measurement accuracy has been demonstrated to be a significant factor in airdrop accuracy. The U.S. Army Yuma Proving Ground (YPG) has undertaken a study to better understand the behavior of winds both over a wide geographic area and over time. In addition, multiple systems for measuring and modeling winds have been evaluated. This paper addresses the following three areas: (1) documentation of the data collection and processing methods currently being used at YPG, (2) comparison of the performance of the wind estimation systems in use at YPG, and (3) assessment of the effectiveness of the Global Positioning System (GPS) Dropsonde techniques for wind estimation and post-processing of airdrop data in support of airdrop testing. Specifically, the paper assesses the ability of the GPS dropsonde techniques to sufficiently estimate true wind velocity for airdrop testing. The evaluation of the applicability of GPS-based dropsondes has involved addressing the following issues: (1) impact of the descent rate of the GPS dropsonde system on the wind estimate, (2) errors involved with using the GPS ground track velocities as the wind, estimate directly, (3) difference of accuracy of the two systems and the degree of accuracy required for this technique, and (4) the usefulness of the GPS dropsonde ground track data- in post-processing when attempting to derive the actual trajectory of the payload. Introduction The Radiosonde Wind Measuring System (RAWIN) has been the accepted standard of wind estimation used throughout the test community. RAWIN balloon launches are done about 2500 times per year at YPG. RAWIN balloon launches are automatically conducted every few hours daily at YPG, which provides a good This paper is declared a work of the U.S. Government and is not subject to copyright protection in the United States. record of the weather at YPG, year-round. For airdrop tests, to determine airdrop release points and for post- processing wind-corrected data, RAWIN balloons are launched at approximately 1-hour intervals near the release time in the vicinity of the Drop Zone (DZ). Throughout the history of airdrop testing, it has been shown that the RAWIN data, as collected, are insufficient for flight dynamic evaluations. Therefore, an alternative method for estimating winds is being implemented. This technique involves dropping a calibrated system along with the test items instrumented to measure winds. This study documents the current methods for wind measurement and evaluates each of these systems. System Description One of the objectives of this paper is to document the methods currently utilized for atmospheric data estimation at YPG. This effort has focused on two methods used for wind estimation to include the LORAN based RAWIN balloons and GPS equipped dropsondes. This paper documents the types of raw measurements being obtained, the types of sensors used for data acquisition, the data collection and recording/transmission rates for each measurement, and the processing methods for each of the measurement systems. In some cases, detailed documentation was not available for each system. Therefore, interviews of system operators and physical system investigations have been recorded. Vaisala RS80 Radiosondes are used at weather stations all over the world for synoptic observations as well as in numerous defense and research programs. The RS80 is the radiosonde model YPG utilizes. Radiosondes are weather measurement instruments that measure upper air profiles of pressure, temperature, and humidity when launched into the upper atmosphere on a weather balloon. The accuracy of the temperature sensor is to 0.2 degrees C, the humidity to 3 percent, and the pressure to 0.5 millibars. The radiosonde is checked against ground conditions before being launched. Each radiosonde has a receiver for Loran-C navigation 1 American Institute of Aeronautics and Astronautics
Transcript of Wind Study and GPS Dropsonde Applicability to Airdrop Testing
(c)2001 American Institute of Aeronautics & Astronautics or Published with Permission of Author(s) and/or Author(s)' Sponsoring Organization.
A01-2929716th AIAA Aerodynamic DeceleratorSystems Technology Conference and
Seminar
21 - 24 May 2001Boston, MA
AIAA 2001-2022
WIND STUDY AND GPS DROPSONDE APPLICABILITY TO AIRDROP TESTING
Katherine Kelly and Brooksie PenaTest Directors, U.S. Army Yuma Proving Ground
Aviation and Airdrop Systems Division, ATTN: CSTE-DTC-YP-MT-EAYuma, AZ 85365-9110
AbstractWind measurement accuracy has been demonstrated tobe a significant factor in airdrop accuracy. The U.S.Army Yuma Proving Ground (YPG) has undertaken astudy to better understand the behavior of winds bothover a wide geographic area and over time. In addition,multiple systems for measuring and modeling windshave been evaluated. This paper addresses thefollowing three areas: (1) documentation of the datacollection and processing methods currently being usedat YPG, (2) comparison of the performance of the windestimation systems in use at YPG, and (3) assessmentof the effectiveness of the Global Positioning System(GPS) Dropsonde techniques for wind estimation andpost-processing of airdrop data in support of airdroptesting. Specifically, the paper assesses the ability ofthe GPS dropsonde techniques to sufficiently estimatetrue wind velocity for airdrop testing. The evaluationof the applicability of GPS-based dropsondes hasinvolved addressing the following issues: (1) impact ofthe descent rate of the GPS dropsonde system on thewind estimate, (2) errors involved with using the GPSground track velocities as the wind, estimate directly,(3) difference of accuracy of the two systems and thedegree of accuracy required for this technique, and (4)the usefulness of the GPS dropsonde ground track data-in post-processing when attempting to derive the actualtrajectory of the payload.
IntroductionThe Radiosonde Wind Measuring System (RAWIN)has been the accepted standard of wind estimation usedthroughout the test community. RAWIN balloonlaunches are done about 2500 times per year at YPG.RAWIN balloon launches are automatically conductedevery few hours daily at YPG, which provides a good
This paper is declared a work of the U.S. Government and is notsubject to copyright protection in the United States.
record of the weather at YPG, year-round. For airdroptests, to determine airdrop release points and for post-processing wind-corrected data, RAWIN balloons arelaunched at approximately 1-hour intervals near therelease time in the vicinity of the Drop Zone (DZ).Throughout the history of airdrop testing, it has beenshown that the RAWIN data, as collected, areinsufficient for flight dynamic evaluations. Therefore,an alternative method for estimating winds is beingimplemented. This technique involves dropping acalibrated system along with the test items instrumentedto measure winds. This study documents the currentmethods for wind measurement and evaluates each ofthese systems.
System DescriptionOne of the objectives of this paper is to document themethods currently utilized for atmospheric dataestimation at YPG. This effort has focused on twomethods used for wind estimation to include theLORAN based RAWIN balloons and GPS equippeddropsondes. This paper documents the types of rawmeasurements being obtained, the types of sensors usedfor data acquisition, the data collection andrecording/transmission rates for each measurement, andthe processing methods for each of the measurementsystems. In some cases, detailed documentation wasnot available for each system. Therefore, interviews ofsystem operators and physical system investigationshave been recorded.
Vaisala RS80 Radiosondes are used at weather stationsall over the world for synoptic observations as well asin numerous defense and research programs. The RS80is the radiosonde model YPG utilizes. Radiosondes areweather measurement instruments that measure upperair profiles of pressure, temperature, and humiditywhen launched into the upper atmosphere on a weatherballoon. The accuracy of the temperature sensor is to0.2 degrees C, the humidity to 3 percent, and thepressure to 0.5 millibars. The radiosonde is checkedagainst ground conditions before being launched. Eachradiosonde has a receiver for Loran-C navigation
1American Institute of Aeronautics and Astronautics

(c)2001 American Institute of Aeronautics & Astronautics or Published with Permission of Author(s) and/or Author(s)' Sponsoring Organization.
signals. Wind speed and direction are determined fromsuccessive positional fixes by the Loran-C receiver.The wind speed and directions are then interpolatedbetween pressure surfaces. The altitude of the pressuresurfaces above ground level (AGL) or mean sea level(MSL) is calculated inside the Vaisala software.Positional fixes and wind calculations are completewithin this software. The observed data are transmittedto the ground equipment that processes the data intoweather messages. The transmission frequencies are inthe 400.15 to 406 megahertz (MHz) or 1668 to 1700MHz Meteorological Aids Band. Externally, these datacan be examined at intervals of 5 seconds until 8minutes have elapsed, then at intervals of 10 seconds.The balloon's progress is monitored from ground levelup to 30 kilometers (km).
In order to measure winds closer in time to the airdrop,and as close as possible to the drop coordinates, YPGhas developed a system called the WindPack. TheWindPack is based upon a 12-channel GPS receiverand, in addition to the receiver, includes a smallcomputer, a power supply, and a flash card recordingdevice. These components are housed in an extrudedaluminum container 4 inches high and approximately 6inches in diameter. Power for the WindPack isprovided by a 5-amp-hour, lead acid gel-cell batterythat is contained in a bracket attached to the bottom ofthe container. The container, with battery, weighsapproximately 10 pounds. An antenna attached to asmall ground plane is connected to the GPS receiver inthe container through a 3-foot cable. This allows theantenna to be located external to the rigging. TheWindPack is illustrated in Figure 1.
The WindPack is typically packed in honeycomb toabsorb some of the landing shock. The honeycomb ismounted on a plywood structure and secured with A-7Astraps. This structure is then attached to the WindPackparachute with a D-ring and clevis. A typical riggingconfiguration is shown in Figure 2.
FIGURE 2. Rigged WindPack
Two parachute configurations are implemented with theWindPack system. The purpose of the twoconfigurations is to achieve both high and low velocityrates of descent. Vertigo Inc. of Lake Elsinore,California, has developed both tri-lobe canopies. The9.83-foot tri-lobe, typically weighted to a 15 to 35 feetper second (fps) descent velocity, has a coefficient ofdrag of 0.560. The 2.75-foot tri-lobe, typicallyweighted to a 60 to 80 fps descent velocity, has acoefficient of drag of 0.479. The smaller 2.75-foot tri-lobe parachute is initially deployed, and at pre-designated low altitude (-2500 ft AGL) an FF-2Automatic Activation Device (AAD) triggers the HighAltitude Air Release System (HAARS) to deploy thelarger tri-lobe and induce a lower rate of descent forimpact of the payload. Oscillations of these parachutesare very small. An airdrop of the WindPack system inthe low velocity configuration is shown in Figure 3.
FIGURE 1. WindPack
American Institute of Aeronautics and Astronautics

(c)2001 American Institute of Aeronautics & Astronautics or Published with Permission of Author(s) and/or Author(s)' Sponsoring Organization.
FIGURE 3. WindPack in Flight, Shown is the Tri-LobeParachute Built by Vertigo, Inc.
Two scenarios are used to acquire the wind data. Oneis to airdrop the WindPack as soon as the test itemleaves the aircraft. The two systems drop through thesame air mass at the same time so the WindPackmeasurements provide the best possible representationof the wind conditions experienced by the test item.The second scenario is used if several test items are tobe launched on multiple passes over the DZ in a shortperiod of time. In this case a WindPack is airdroppedduring a pass near the beginning of the drop sequenceand one near the end of the drop sequence. If the dropsequence is long enough, it is desirable to dropadditional WindPacks between the beginning and theend of the test.
As soon as the WindPack leaves the aircraft it acquiresthe GPS signals and begins to record the GPS data. Therecorded parameters include GPS code phase and
carrier phase for each satellite tracked by the receiver,as well as the ephemeris from each satellite. Theseparameters are measured and recorded at a 10 Hz rateand each sample is time-tagged with GPS time. At theconclusion of the drop, the flash card containing thesedata is retrieved from the WindPack for processing.
During processing, corrections are applied to theWindPack measurements to improve their accuracy.These corrections are derived from measurementsrecorded from a ground-based receiver during the drop.The ground receiver tracks the same satelliteconstellation of the WindPack through an antenna thathas been precisely surveyed. The difference betweenthe range to the satellite as measured by the receiverand that computed from the known location of theantenna is an error in the measurement. Since nearly allthe error is common to both the WindPackmeasurement and the ground receiver measurement, theerror determined by processing the ground receivermeasurements can be removed from the measurementsrecorded by the WindPack during the drop. Once themeasurement errors are removed, the position andvelocity of the WindPack as a function of time isderived.
Analysis of WindPack FeasibilityAs shown above, the WindPack measures ground speedof the tri-lobe parachute system. In order to effectivelyapply this system, it was crucial to validate theassumption that the ground velocities could be used asan estimate of the true horizontal wind. Figure 4illustrates the variations of wind estimates over time,demonstrating a need for a timely wind estimationsystem such as the WindPack.
American Institute of Aeronautics and Astronautics

(c)2001 American Institute of Aeronautics & Astronautics or Published with Permission of Author(s) and/or Author(s)' Sponsoring Organization.
-15 -10 -5 0 5 10Wind Speed (feet per second)
15 20
FIGURE 4. Wind Changes Over Time
The measured ground track velocity from theWindPack is taken as the assumed wind. This windestimate is then fed into a point mass model of theWindPack with the only other force being drag andweight. The simulation then provides an estimate ofground track under that assumed wind condition. Thedifference between this modeled ground track and the
actual measured ground track reflects the errors in thewind estimate. The magnitude of these errors indicatesthe significance of accounting for momentum changescaused by changes in the wind. Figure 5 presents theresults of this validation. Use of the measured groundtrack velocity as the wind estimate resulted in errors ofless than 0.3 feet per second.
American Institute of Aeronautics and Astronautics

(c)2001 American Institute of Aeronautics & Astronautics or Published with Permission of Author(s) and/or Author(s)' Sponsoring Organization.
0.5
0
I "°-5*/>£ 05
0 §0 100 150 200 250 300 350 400
UJ
8-0.50 50 100 150 200 250 300 350 4000.5
o
-0.5
^ . ( • y ^ v ^ s . v - - - ~ ^ v Y v ^ — ^ v w ^ ^ ^ v - ^ A v A ^ v ^
0 50 tOO 150 200 250". ';.' • ; - :
: . : : - •,:.. v •'" Time (seconds)
FIGURE 5. Wind Estimation Results
To further assess this technique, the methods for windestimation utilized with hurricane dropsondes1 areapplied. Hock, et al, derived techniques for correctingground speed measurements to formulate windestimates in high shear environments. These techniquesare then applied to the measured WindPack data. Thederived wind estimate is compared to the measuredground speed.
The data in Figure 6 show that the corrected windestimate, using the hurricane approach, differs from themeasured ground track by less than 0.3 feet per second.More errors are seen close to ground impact whereadditional shears are present.
0.5
-0.5
0.5
v> 0
50 100 150 200 250 300 350 400
-0.5
t0 50 100 150 200 250 300 350 400
Time (seconds)
FIGURE 6. Hurricane Wind Estimation Results
American Institute of Aeronautics and Astronautics

(c)2001 American Institute of Aeronautics & Astronautics or Published with Permission of Author(s) and/or Author(s)' Sponsoring Organization.
The results shown in Figure 5 indicate that themomentum effects can be ignored for wind estimationfor the WindPack. Figure 7 illustrates the comparisonof the wind estimate to the winds measured by theRAWIN. Recall that the RAWIN balloon was launchedonly every hour. The closest RAWIN data were usedfor this comparison.
launches and airdrops in the same location. The data,time of activation, and position of initial activation havebeen recorded for each event. For each test the windestimate is plotted as a function of altitude in a commonreference system. The data have been correlated byaltitude (using linear interpolation when required) anddifferenced. The data have been reviewed to assess the
Smooth lines - RAWIN data
NOTE: Vertical winds not provided by RAWIN
50 100 150 200 250 300 350 400
• FIGURE 7. Wind Estimation Compared to RAWIN
These results demonstrate this technique will providesignificantly better estimates of winds than using theRAWIN system. By adjusting the weight of thecalibration system to match the descent rate of the testitem, the two parachutes will be subjected to the same(as close as possible) atmospheric conditions. Usingthe measured GPS ground track velocities is anadequate approximation for wind estimation. Othertechniques, such as that presented above, may providesome refinement on the wind estimates, but thedifference is likely to be insignificant for most testing.The key to application of this technique is the use of avery stable parachute due to the reductions in apparentmass effects resulting from oscillations.
Flight Test Procedures and ResultsThe effect of variations in time, location, and rate ofdescent on the wind data collection methods has beenevaluated. The data have been obtained at the samplingrates and in the formats provided in regular operations.Multiple sets of data for each wind estimation methodhave been obtained for various conditions. Windestimations were conducted with the RAWIN and theWindPack. Each data collection system is launched orairdropped from a pre-established starting position.Comparison of the two systems included simultaneous
magnitude and variation of the difference of the windestimates. Spatial and time differences of themeasurements are considered as a contributor to thedifference in the wind estimates.
Wind Characterization Over Time and Distance
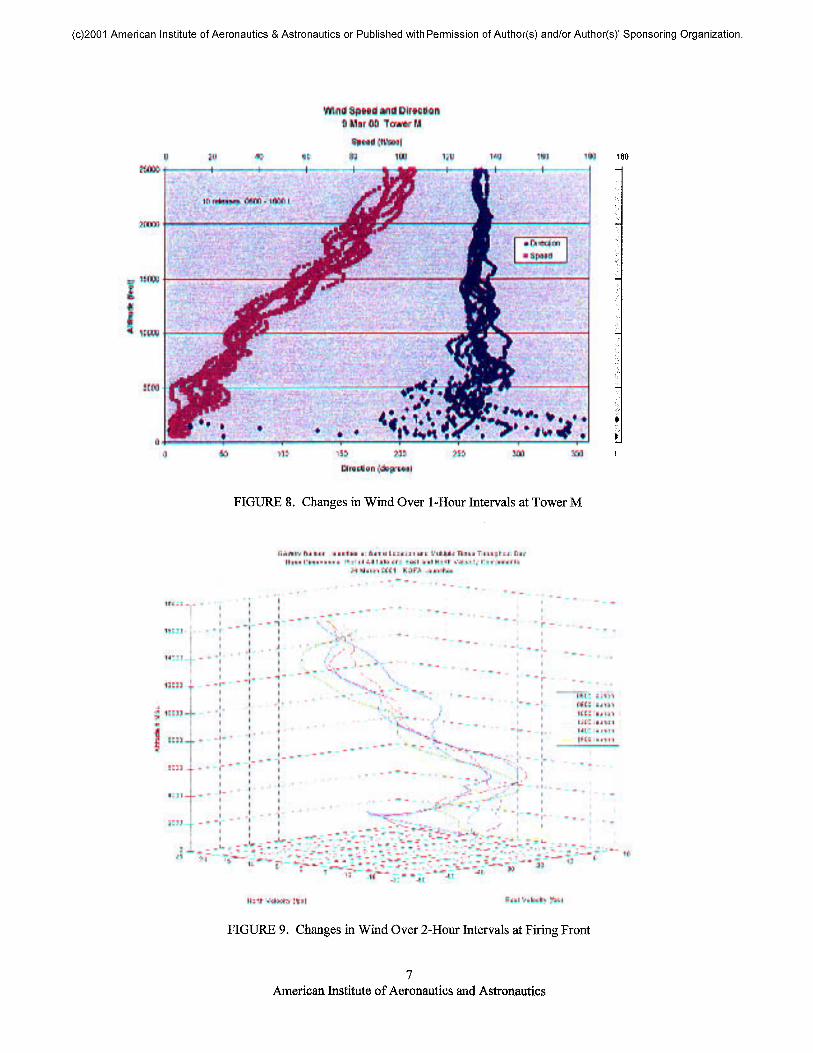
To demonstrate the variation of winds over time,RAWIN balloon data were obtained several timesthroughout a day, from the same location. There aretwo locations, Tower M and Firing Front, whereRAWIN balloons are automatically sent up multipletimes throughout the day, usually at 1- to 2-hourintervals. For this study, 2 days were selected whenballoon launches had been conducted at least every 2hours from the same location (9 March 2000 at TowerM and 26 March 2001 at Firing Front). Wind datathroughout each of these days was plotted as a functionof altitude to demonstrate how much the winds canchange over various time durations. The followingplots illustrate the trends of wind changes throughout atypical day at Tower M (see Figure 8) and Firing Front(see Figure 9) on the Kofa Range at YPG. These plotsshow that the wind varies greatly in magnitude anddirection at the lower altitudes (<5000 ft) in the samelocation over a period of time.
American Institute of Aeronautics and Astronautics
(c)2001 American Institute of Aeronautics & Astronautics or Published with Permission of Author(s) and/or Author(s)' Sponsoring Organization.
25000 +
200CO
150CO
10QGO
5000
20-H
Wind Speed and Direction9 Mar 00 Tower M
Speed (ft/see)60 80 100 120H——————K-
140
150 200Direction (d&groos)
FIGURE 8. Changes in Wind Over 1-Hour Intervals at Tower M
RAW IN Balloon Launches at Same Location and Multiple Times Throughout DayThree Dimensional Plot of Altitude and East and North Velocity Components
26 March 2001: KOFA Launches
16000— - - -
North Velocity (fps) East Velocity (fps)
FIGURE 9. Changes in Wind Over 2-Hour Intervals at Firing Front
American Institute of Aeronautics and Astronautics

(c)2001 American Institute of Aeronautics & Astronautics or Published with Permission of Author(s) and/or Author(s)' Sponsoring Organization.
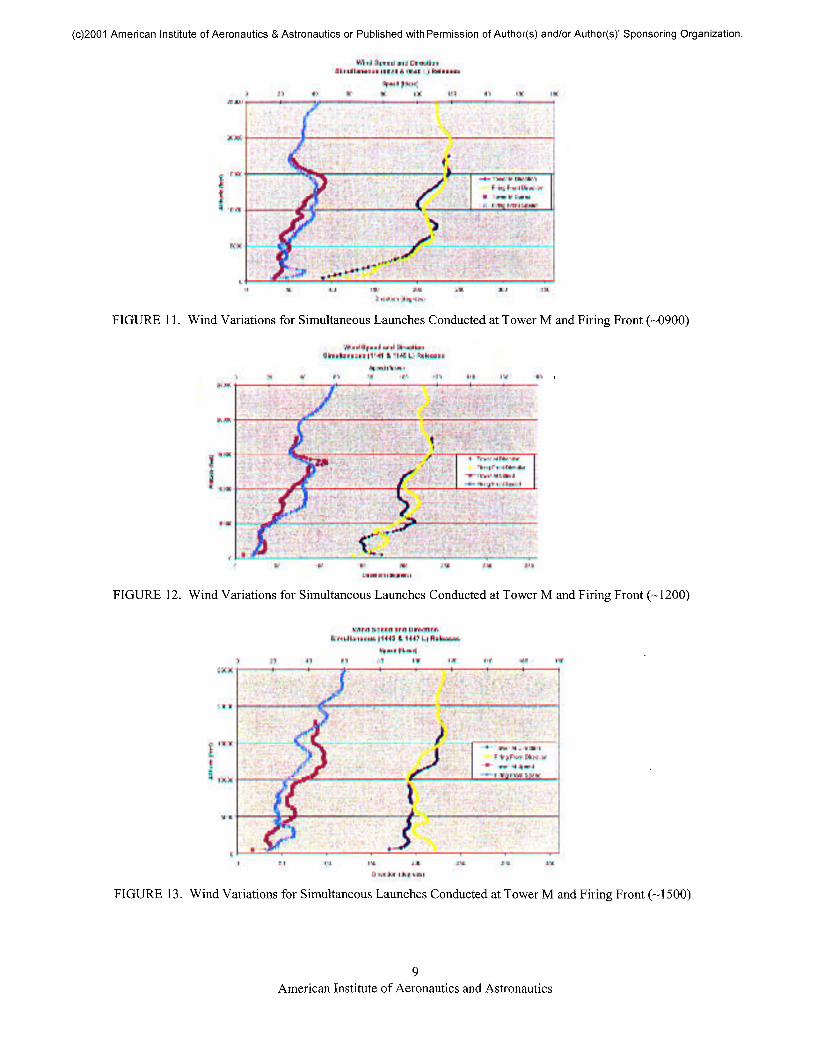
It then becomes relevant to review wind speed anddirection changes at different locations ofsimultaneous balloon launches. SimultaneousRAWIN launches were performed at multiple sitesto analyze the effects of distance separation onwind data collection. For comparisons at 50kilometers apart, RAWIN balloons were released atthe same time from the Firing Front and LaPosaDZ. Firing Front Road is at 430 feet MSL. Theballoon release point at La Posa is at 1322 feetMSL, and the terrain near La Posa DZ is up to3000 feet MSL. The wind profile at each location
was plotted as a function of mean sea level altitudefor comparison. A plot showing this comparison isshown in Figure 10. For comparisons at 55kilometers apart, RAWIN balloons were releasedboth at Tower M and at Firing Front. Tower M isat 476 feet MSL. Three simultaneous launchesthroughout one day at approximately 0900, 1200,and 1500 were correlated. The wind profile at eachlocation was plotted as a function of mean sea levelaltitude for comparison. Plots showing thiscomparison are shown in Figures 11 to 13.
RAWIN Balloon Data for Kofa And LaPosa During Simultaneous Launches (1000)Altitude vs. North and East Wind Velocities
Altit
ude
MSL
(fee
t)
"̂
—— La Posa: N-- — La Posa: E
— Kofa: North— Kofa: East
^
Drth
V*\ .(}...... j.i
Il „̂
c-^v̂
x
V-_ - - _ ,^- _
I
"~~-
..̂ h
..j;-;
0 -60 -50 -40 -30 -20 -10 0 10 20 3(Wind Velocity (feet per second)
FIGURE 10. Wind Variations for Simultaneous RAWINLaunches Conducted at La Posa and Firing Front
American Institute of Aeronautics and Astronautics
(c)2001 American Institute of Aeronautics & Astronautics or Published with Permission of Author(s) and/or Author(s)' Sponsoring Organization.
Wind Speed and DirectionSimultaneous (0824 & 0840 L) Releases
200Direction (degrees)
FIGURE 11. Wind Variations for Simultaneous Launches Conducted at Tower M and Firing Front (-0900)
Wind Speed and DirectionSimultaneous (1141 & 1149 L) Releases
40 60 100 120 140 160 180
-Tower M DirectionFiring Front Direction
-Tower M Speed- Firing Front Speed
0 50 100 150 200 250 300 350
Direction (degrees)
FIGURE 12. Wind Variations for Simultaneous Launches Conducted at Tower M and Firing Front (-1200)
Wind Speed and DirectionSimultaneous (1442 & 1447 L) Releases
Speed (ft/sec)20 40 80 100 120 140 161
~ Tower M DirectionFiring Front Direction
!-Tower M Speed- Firing Front Speed
Direction (degrees)
FIGURE 13. Wind Variations for Simultaneous Launches Conducted at Tower M and Firing Front (-1500)
American Institute of Aeronautics and Astronautics

(c)2001 American Institute of Aeronautics & Astronautics or Published with Permission of Author(s) and/or Author(s)' Sponsoring Organization.
The preceding plots demonstrate several trends. Whencomparing the Firing Front to the LaPosa launches, theterrain in between the two locations remains theprimary consideration. With a mountain range of about2000 feet on the southern side of La Posa DZ, it appearsthe winds become consistent with each other at about10,000 feet MSL. Close to the ground, they differgreatly (up to approximately 15 fps difference inmagnitude).
When comparing the Firing Front to the Tower Mlaunches, it is noticeable that later in the day the windscloser to the ground also vary to the same degree. It isalso observed from these plots that the winds becomemore consistent in speed and direction at about a10,000-foot altitude.
Computed Air Release Point (CARP) Comparison
Wind estimates are used in calculating release points aswell as for post-processing airdrop data. In order todetermine the effect of using late winds or winds a greatdistance from the DZ, the release points have beencalculated for the various wind profiles that were usedin this wind study.
The following profiles were compared: two sites at 50km (31 miles) separation, two sites at 55 km (34 miles)separation, and one site with multiple RAW IN releasesthroughout the day. The descent rate of the airdrop testitem, as well as the airdrop altitude, is a variable used inthe release point calculations. For all of the followingrelease point calculations, a descent rate of 28 feet/secwas used. The airdrop altitude used in the calculations
is stated for each profile and is at least 10,000 feet MSLThe altitude stated for each profile is the altitude atwhich the airdrop test item is considered under canopyand falling at 28 feet per second rate of descent. Forcomparison purposes, forward throw, as well as altitudeloss during opening, was not considered in calculatingthe release point.
For the two sites at 50-kilometer separation, the windestimates from the La Posa and Firing Front launcheswere used. If a drop were conducted at La Posa DZ,calculating wind estimates from data obtained at LaPosa versus Firing Front would result in a difference ofrelease point of approximately 800 meters at an altitudeof 10,000 feet MSL.
For the two sites at a 55-kilometer separation, the windestimates from Tower M and Firing Front were used.Determining a CARP from wind data up to 17,500 feetMSL obtained at Tower M versus Firing Front for thiscase, results in a difference in release points thatincreases in the afternoon launches. At 0900 local time,the difference in offset would be 1300 meters, at 1200local time the difference in offset would be 3500meters, and at 1500 local time the difference in offsetwould be 3000 meters.
For determining the effect of using old winds, the windsat Firing Front at 0500, 0800, 1000, 1200, 1300, and1600 were used. Release points were calculated fromthe wind estimates at each time at an altitude of 10,000and 18,000 feet MSL. Table 1 depicts the difference inrelease points for all time intervals.
TABLE 1. Difference in Release Points Calculatedfrom Multiple RAWIN Balloon Launches
Altitudeft MSL10,00010,00010,00010,00010,000
18,00018,00018,00018,00018,000
LaunchTime0800L1000L1200L1300L1600L
0800L1000L1200L1300L1600L
Difference in Release Pt (meters)0500L 0800L 1000L 1200L 1300L733 0808 76 0816 303 295 01386 686 614 597 01556 829 757 905 467
1092 01133 432 0946 435 188 01734 887 607 790 02684 1735 1551 1738 954
10American Institute of Aeronautics and Astronautics

(c)2001 American Institute of Aeronautics & Astronautics or Published with Permission of Author(s) and/or Author(s)' Sponsoring Organization.
As would be expected, the table shows that thechange in winds vary at different times of the day.As the altitude increases from 10,000 feet MSL to18,000 feet MSL, the difference in release pointincreases greatly. It is also noted the greater delaysin time of wind data collection causes immensedifferences in the CARP
Precision of WindPack
A flight test was conducted on 6 February 2001 toreview how winds vary across the DZ duringsimultaneous airdrops of several WindPacks andincludes comparison to RAWIN data collectionwithin 15 minutes of the airdrop in the samevicinity. For the wind comparisons at differentlocations in a DZ, four WindPacks were weightedto 68 pounds to achieve a 28 feet per second rate of
descent and a 9.83-foot tri-lobe parachute wasused. The airdrop test occurred at Sidewinder DZfrom a UH-1 Helicopter. A WindPack wasdropped from a helicopter at the leading edge ofthe DZ at an altitude of 10,000 feet MSL, and thenthe other three WindPacks were dropped at 5-second intervals as the helicopter flew across theDZ at about 70 Knots Indicated Air Speed. Withthe 5-second interval between each drop, theWindPacks were about 200 meters apart (600meter spread).
Figures 14 through 16 are from the airdropscomparing the four consecutive WindPacks acrossSidewinder DZ to each other and to thesimultaneous RAWIN launch in same location ofthe drop.
Simultaneous WindPacks Airdropped Across Sidewinder Drop ZoneThree Dimensional Position Plot Relative to the Center of the Drop Zone
7000
6000,
|4ooo:-§3000-
^ 2000
1000-
0;1000 •'̂ "*•-,. _--v'<_ ^^. ^--^~'~ ^ ^ - s , - - " C ~ " ~ ^ ^ - ^ ^ 7-^,
^^><-^^>< 'v->. " - -_ - - - ' * i -^ x ^x- .n_^- '^~'"^^ ^ ^ - ^ ^ ^,--^%\ "--^1000
-1000-2000
North: Feet (DZ local)
-3000-4000 -7000 -6000
-5000-4000
-3000 •2000-1000
East: Feet (DZ local)
FIGURE 14. Trajectories of Simultaneous WindPacks Airdropped Across the DZ
11American Institute of Aeronautics and Astronautics

(c)2001 American Institute of Aeronautics & Astronautics or Published with Permission of Author(s) and/or Author(s)' Sponsoring Organization.
1000
0
££>
|-1000
a*CDu_
f -2000o
-3000
-4000-70
Ground Track of Simultaneous WindPacks Airdropped Across Sidewinder Drop ZoneNorth vs. East (DZ local: Relative to the Center of the Drop Zone)
I I
/
— Wind Pa— Wind Pa— Wind Pa— Wind Pa
/""""
;kage1 --:kage2:kage 3:kage 4
_____.— —
i. — — — . ...
r"~"
X^
,
.../'...;:1 1---""
y...... ._,
i
i j _ _ _ _ _ _ _ _ _
•-..X)
••'
DO -6000 -5000 -4000 -3000 -2000 -1000 0 101East: Feet (DZ Local)
FIGURE 15. Ground Track of Simultaneous WindPacks Airdropped Across the DZ
Simultaneous RAWIN Balloon Launch and Four WindPack Airdrops: Sidewinder DZAltitude vs. North and East Wind Velocities
-20 -10 0 10 20 30 40Wind Velocity (feet per second) (+ East) Wind From the West
(+ North) Wind From the South
FIGURE 16. Comparison of RAWIN and WindPack North and East Wind Velocity Components
12American Institute of Aeronautics and Astronautics
(c)2001 American Institute of Aeronautics & Astronautics or Published with Permission of Author(s) and/or Author(s)' Sponsoring Organization.
There are a number of observations that can bemade from the previous plots. The WindPack dataare relatively consistent with each other across theDZ, which contributes to the argument that they areprecisely collecting wind data. The WindPack isshown as an exceptionally precise windmeasurement tool. It is also realized that the windvariation over a DZ (-600 meter spread) isminimal. However, there are great differencesbetween the WindPack and RAWIN wind data.The wind velocities vary up to 10 feet per secondin magnitude. This could be due to the differencein sample rates and accuracies of the two systems.
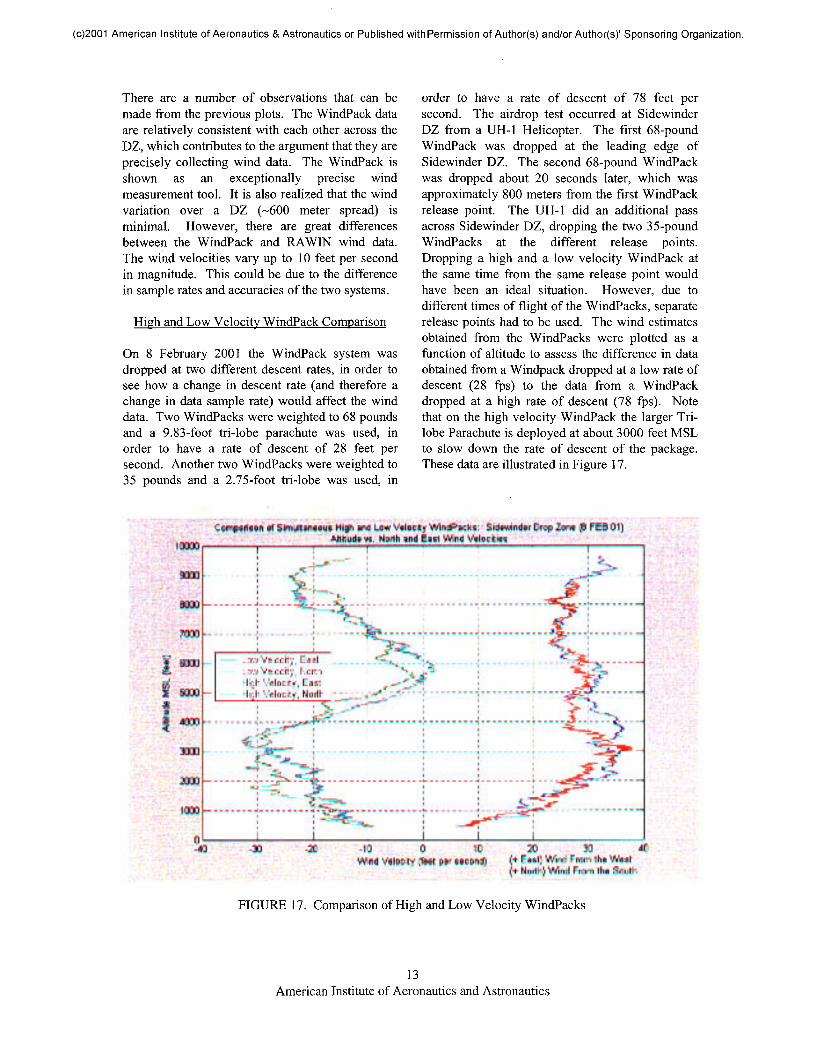
High and Low Velocity WindPack Comparison
On 8 February 2001 the WindPack system wasdropped at two different descent rates, in order tosee how a change in descent rate (and therefore achange in data sample rate) would affect the winddata. Two WindPacks were weighted to 68 poundsand a 9.83-foot tri-lobe parachute was used, inorder to have a rate of descent of 28 feet persecond. Another two WindPacks were weighted to35 pounds and a 2.75-foot tri-lobe was used, in
order to have a rate of descent of 78 feet persecond. The airdrop test occurred at SidewinderDZ from a UH-1 Helicopter. The first 68-poundWindPack was dropped at the leading edge ofSidewinder DZ. The second 68-pound WindPackwas dropped about 20 seconds later, which wasapproximately 800 meters from the first WindPackrelease point. The UH-1 did an additional passacross Sidewinder DZ, dropping the two 35-poundWindPacks at the different release points.Dropping a high and a low velocity WindPack atthe same time from the same release point wouldhave been an ideal situation. However, due todifferent times of flight of the WindPacks, separaterelease points had to be used. The wind estimatesobtained from the WindPacks were plotted as afunction of altitude to assess the difference in dataobtained from a Windpack dropped at a low rate ofdescent (28 fps) to the data from a WindPackdropped at a high rate of descent (78 fps). Notethat on the high velocity WindPack the larger Tri-lobe Parachute is deployed at about 3000 feet MSLto slow down the rate of descent of the package.These data are illustrated in Figure 17.
Comparison of Simultaneous High and Low Velocity WindPacks: Sidewinder Drop Zone (8 FEB01)Altitude vs. North and East Wind Velocities
Low Velocity, EastLow Velocity, NorthHigh Velocity, EastHigh Velocity, North
-30 -20 -10 0 10Wind Velocity (feet per second)
20 30 40(+East) Wind From the West(+ North) Wind From the South
FIGURE 17. Comparison of High and Low Velocity WindPacks
13American Institute of Aeronautics and Astronautics

(c)2001 American Institute of Aeronautics & Astronautics or Published with Permission of Author(s) and/or Author(s)' Sponsoring Organization.
When attempting to evaluate the effects of rate ofdescent on the wind measurements performed bythe WindPack, it is realized that there aredifferences in the data for simultaneous airdrops. Itis unknown if these discrepancies are actualchanges in wind or a resultant loss of accuracy ofthe WindPack when weighted to a higher verticalvelocity. It can be noted that there are apparentoscillations in the higher rate of descent. Theseoscillations look as though they are higher infrequency, but roughly the same magnitude of thelower velocity WindPack. The oscillations appearto be the same after the high velocity load wasdecelerated at about 3000 feet MSL. Differencesin the wind velocities at the lower altitudes (whenthe WindPacks are closer in rate of rate of descentto each other) can be contributed to changes inrelease points and time separations.
Post-Processing Applicability
Finally, a WindPack was airdroppedsimultaneously with a WindPack instrumentedpayload weighted at the same rate of descent inorder to correct the trajectory of the payload forwinds. The example includes an airdrop of a G-12parachute on a 2200-pound A22 container and asimultaneous WindPack drop. The horizontal windcomponents were effectively "subtracted" out ofthe payload GPS data to compute the wind speedrelative to the air mass. This test was conducted todemonstrate the effectiveness of the post-processing advantages of the WindPackinstrumentation. This is shown in Figure 18.Figure 18 shows a nominal zero airspeed in theNorth and East components with periodicvariations induced by accelerations. Only with avalid wind estimate, could the true airspeed bedetermined.
G-12 Parachute with A22 Container Actual Trajectory Corrected For Winds
-3- 2000,C3<£2•2 1500,
| 1000,
North Velocity (m/s) East Velocity (m/s)
FIGURE 18. Illustration of WindPack Post-Processing Applied to Airdrop Payloads
14American Institute of Aeronautics and Astronautics

(c)2001 American Institute of Aeronautics & Astronautics or Published with Permission of Author(s) and/or Author(s)' Sponsoring Organization.
Conclusions
This study shows the ability to obtain a moreprecise wind estimate using the YPG WindPackover that of Rawinsonde data. In addition, windvariations over time and distance were assessed.Sources of error or differences in wind data couldhave come from slight variations in location andtime of the launches and airdrops that would haveaffected the correlations made. Analysis of verticalvelocities was not conducted. When there areapparent variations in vertical velocity, it may bedue to thermals present, which could causelocalized perturbations to winds. Further testingshould be conducted to evaluate the verticalvelocities and how thermal s can affect them.
Another area that requires additional validationwould include that of the comparison of high andlow velocity WindPacks. Testing should be doneto attribute causes to the difference in wind profilesof high and low velocity WindPacks, anddetermine if there is a loss of accuracy at the higherrate of descent.
It can be stated that to have a wind estimate closeto the proximity and time of the airdrop is the mostideal case. However, using delayed winds orwinds in the near vicinity to calculate the CARPwould not drastically hinder airdrop operations.Using the WindPack data to calculate the CARP ismore accurate, but these data have a greaternecessity when post-processing airdrop-relatedposition data is a requirement. The airdropdevelopmental testing environment will greatlybenefit from this capability.
References
1. Hock, T.F. and J.L. Franklin, 1999: "TheNCAR GPS Dropwindsonde", BulletinAmerican Meteorological Society, Vol.80, Number 3, 407-420.
2. Dellicker, S., "Low Cost ParachuteNavigation Guidance and Control," MSthesis, Naval Postgraduate School,September 1999.
3. Dellicker, S., "Low Cost ParachuteNavigation Guidance and Control,"AIAA-99-1706, 1999
4. Porter, W., "AGAS, WindCharacterization," presentation, May2000.
5. Bybee, J., "Wind Study", email, 28 April2001.
6. Weingarton, D., "RAWIN Balloon",email, 8 March 2001.
15American Institute of Aeronautics and Astronautics