Wind Resource Estimation Meteorology (Climatology) for ...
70
Wind Resource Estimation Meteorology (Climatology) for Wind Energy Søren Larsen Wind Energy Department Risø DTU Denmark
Transcript of Wind Resource Estimation Meteorology (Climatology) for ...
Wind Resource Estimation
Meteorology (Climatology) for Wind Energy
Søren Larsen
Wind Energy Department
Risø DTU
Denmark
Content
1 Questions to Meteorology and Answers.
2 Methodology based on extrapolation of observed data. Examples taken from the WAsP program).
3 Methodology based on numerical weather modelling.Two examples with similar but somewhat different
methodology, one from Mali and one from Finland

What are the Questions to Meteorology ?
Question: What annual power production can be expected at a given geographical location with a given wind turbine?. (Can it balance the expenses?).
The annually averaged wind power pr m2, P, is given as:
W(u) is the annual mean wind speed distribution.
Now for a wind turbine, WT, at the same spot:
3 3
0
1 1( )( )
2 2Air AnnualP u W u u duρ ρ∞
= < > =∫
3,
0
1( ) ( ) , ( ) ( ) ( )
2WT AnnualP W u C u du C u c u A uρ∞
≈ ≡∫
A is the area swept by the rotor. C(u) is denoted the power curve. Each wind turbine can be delivered with several power curves. Mainly by blade modification !, c(u) is the efficiency of the WT.
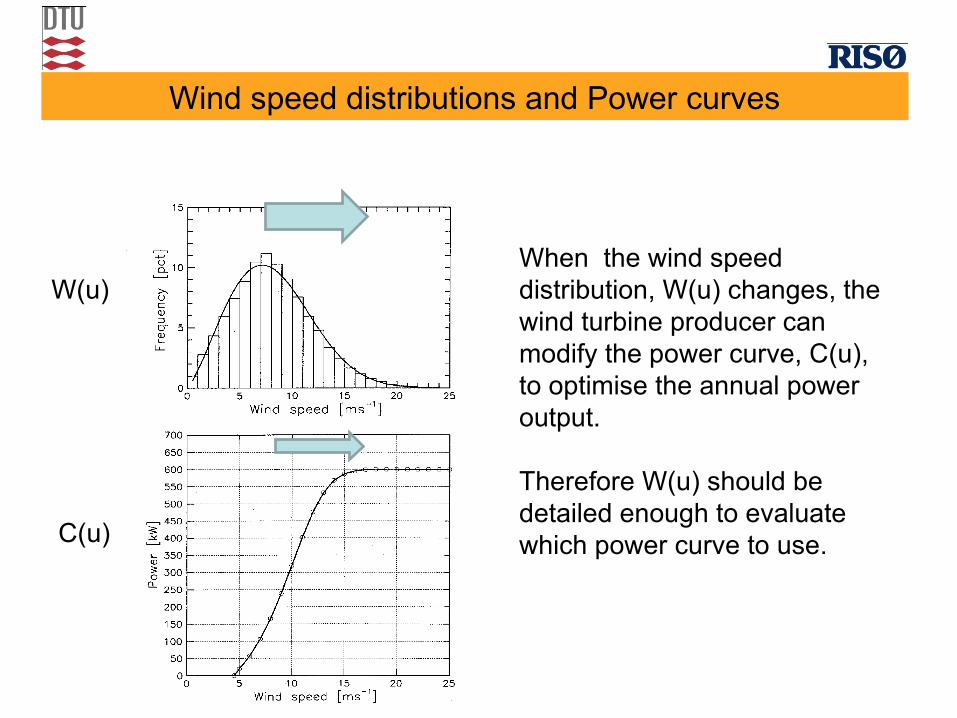
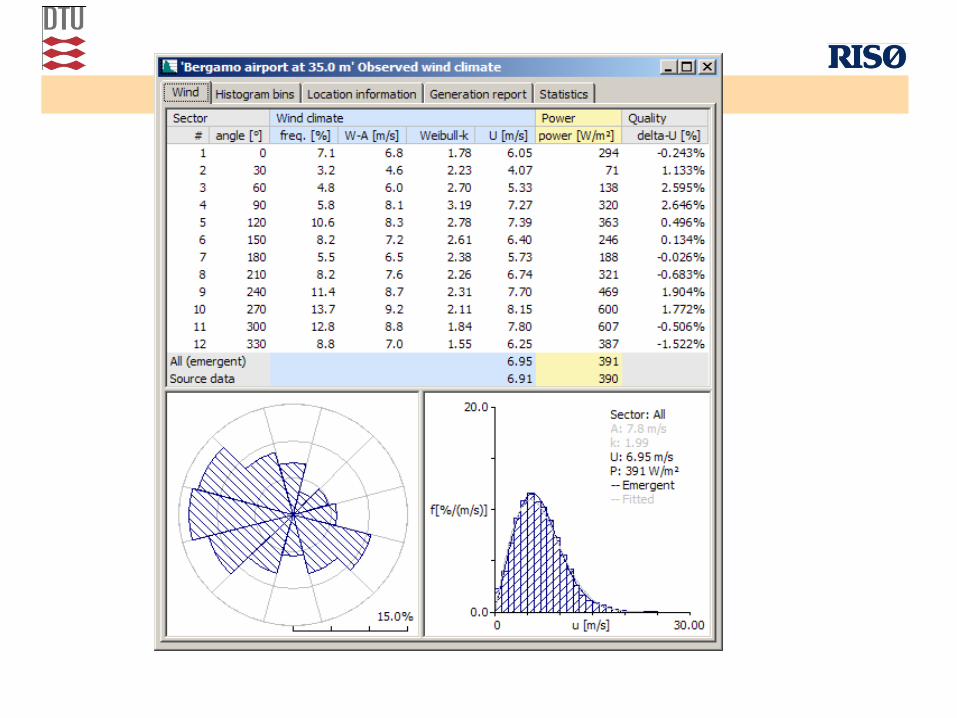
Wind speed distributions and Power curves
When the wind speed distribution, W(u) changes, the wind turbine producer can modify the power curve, C(u), to optimise the annual power output.
Therefore W(u) should be detailed enough to evaluate which power curve to use.
W(u)
C(u)

Well documented and serviced climate monitoring station
How to obtain high quality wind series of sufficient duration to determine the annual
mean distribution ?
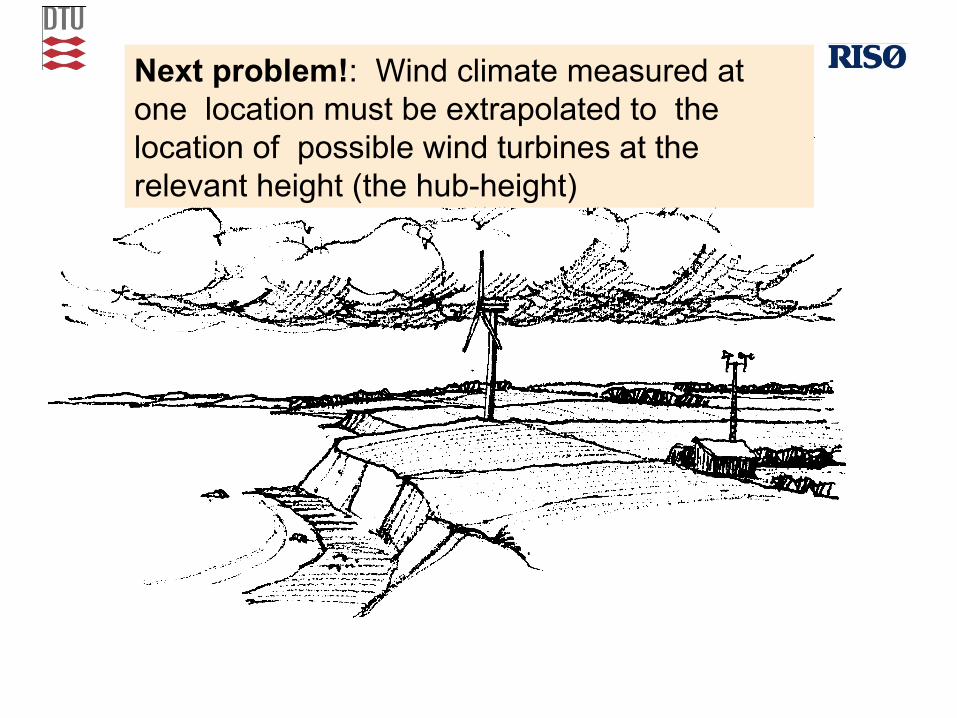
Next problem!: Wind climate measured at one location must be extrapolated to the location of possible wind turbines at the relevant height (the hub-height)

Linear interpolation ?The wind is strongly dependent on very local terrain features

WIND
FLUX
WAVES
FLUX
Boundary Layer Meteorology Perspective
FLUX
Roughnesses: Z0 , Z0T , -, -, - , ZD
For wind energy, we are most interested in high winds. Therefore, one can simplify considering only neutral flows, where the temperature conditions are unimportant. Hence only Z0 is relevant.
Free Atmosphere. Geostrophic wind
Atmospheric Boundary Layer
Internal Boundary Layers
Obstacle
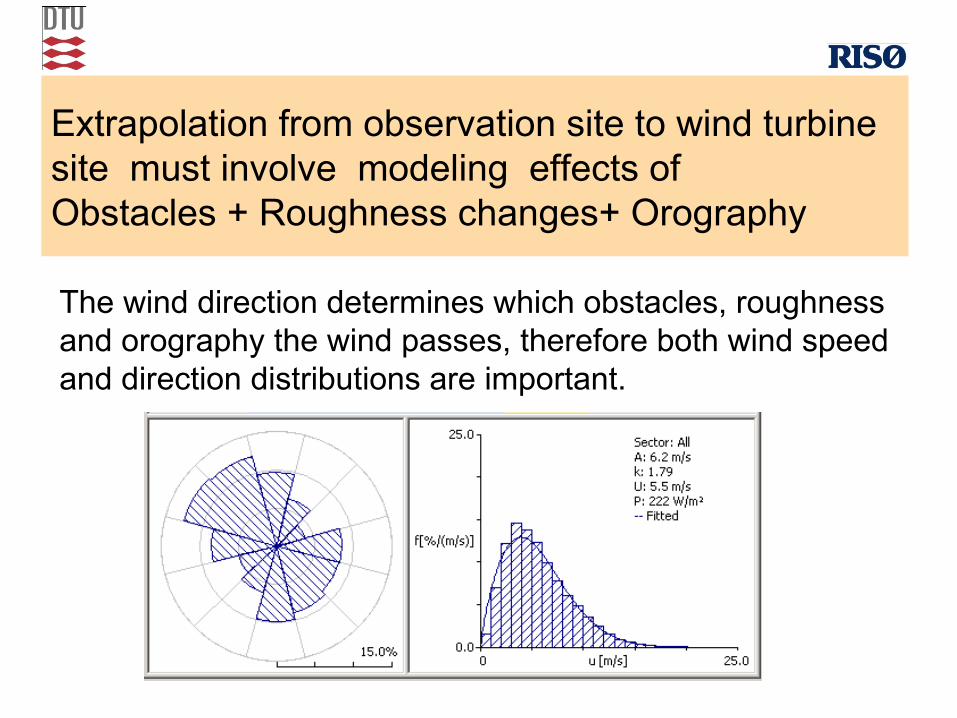
Extrapolation from observation site to wind turbine site must involve modeling effects of Obstacles + Roughness changes+ Orography
The wind direction determines which obstacles, roughness and orography the wind passes, therefore both wind speed and direction distributions are important.

Obstacles

What is an obstacle?
After Meroney (1977)
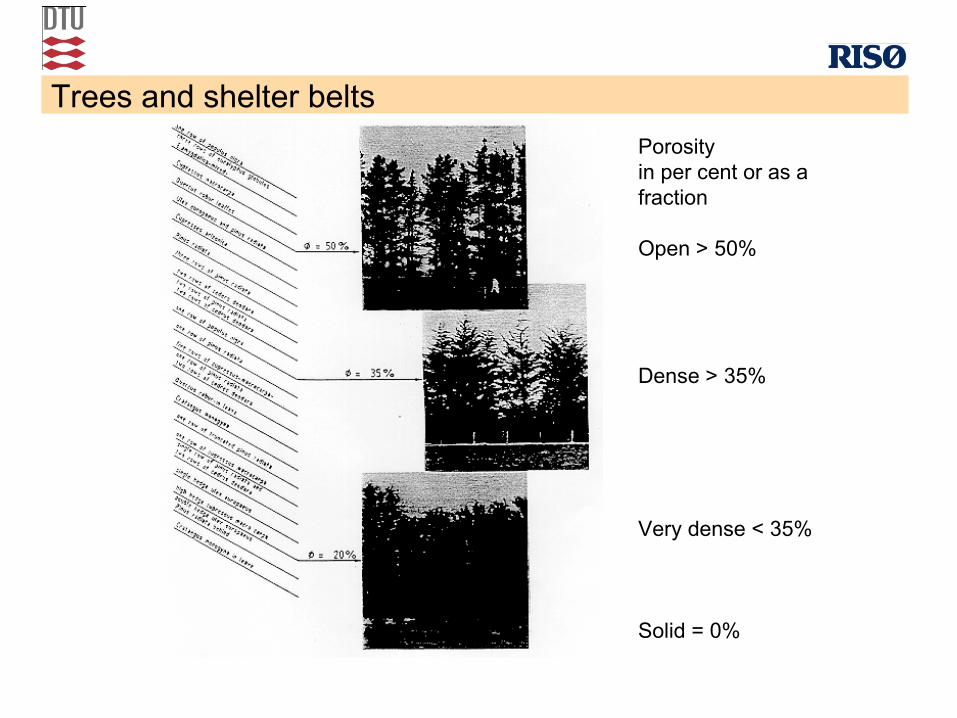
Trees and shelter belts
Porosityin per cent or as afraction
Open > 50%
Dense > 35%
Very dense < 35%
Solid = 0%
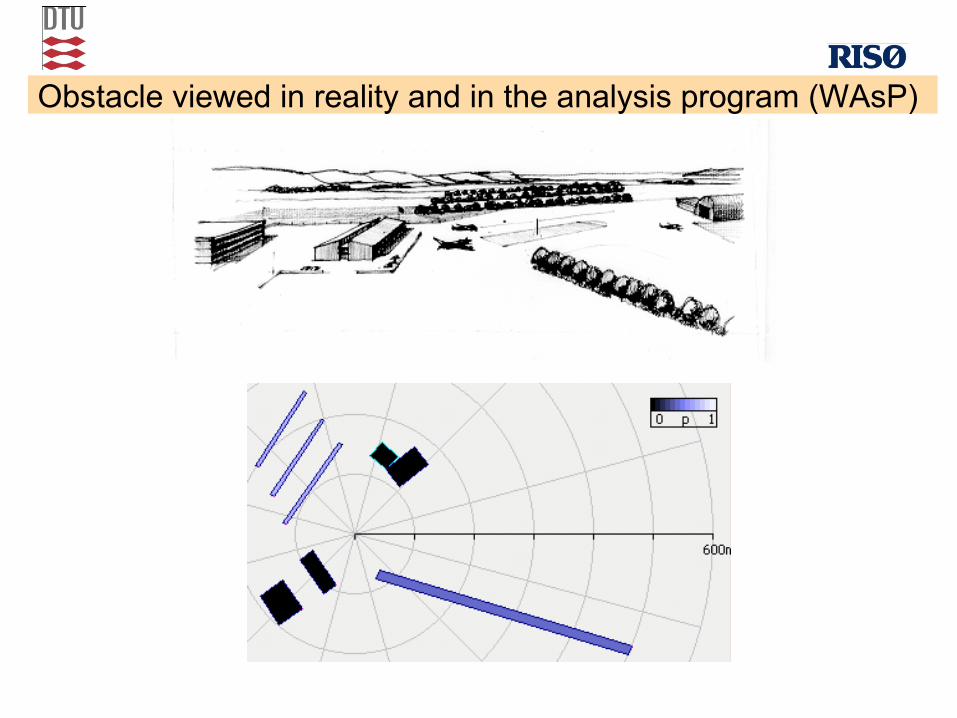
Obstacle viewed in reality and in the analysis program (WAsP)

Roughness
The friction between the moving air and the surface!
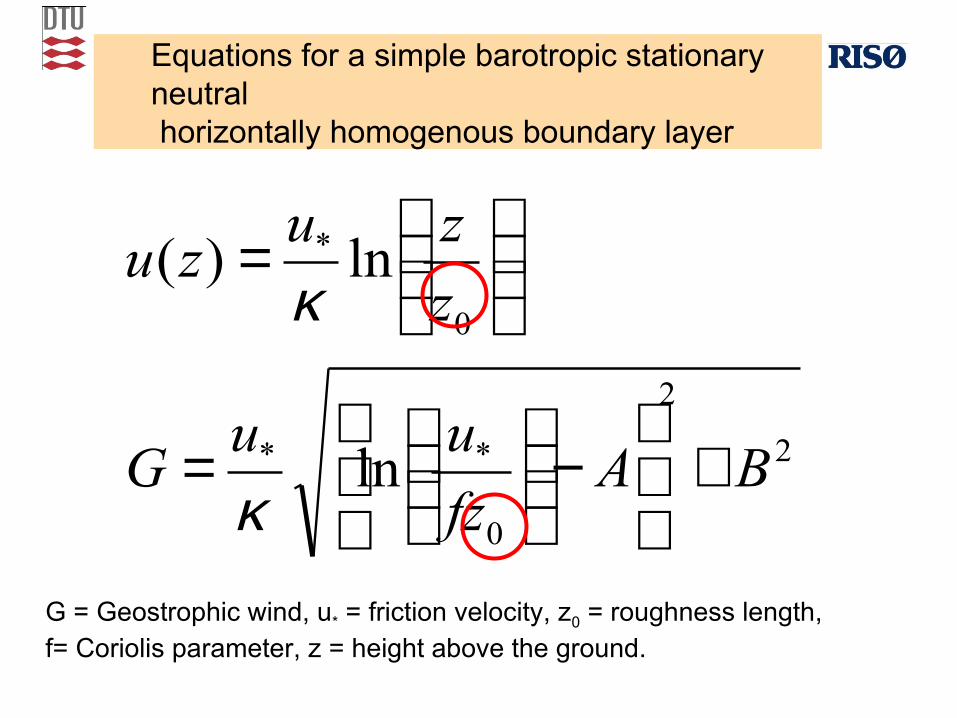
Equations for a simple barotropic stationary neutral horizontally homogenous boundary layer
2
2
0
**
0
*
ln
ln)(
BAfz
uuG
z
zuzu
+
−
=
=
κ
κ
G = Geostrophic wind, u* = friction velocity, z0 = roughness length, f= Coriolis parameter, z = height above the ground.
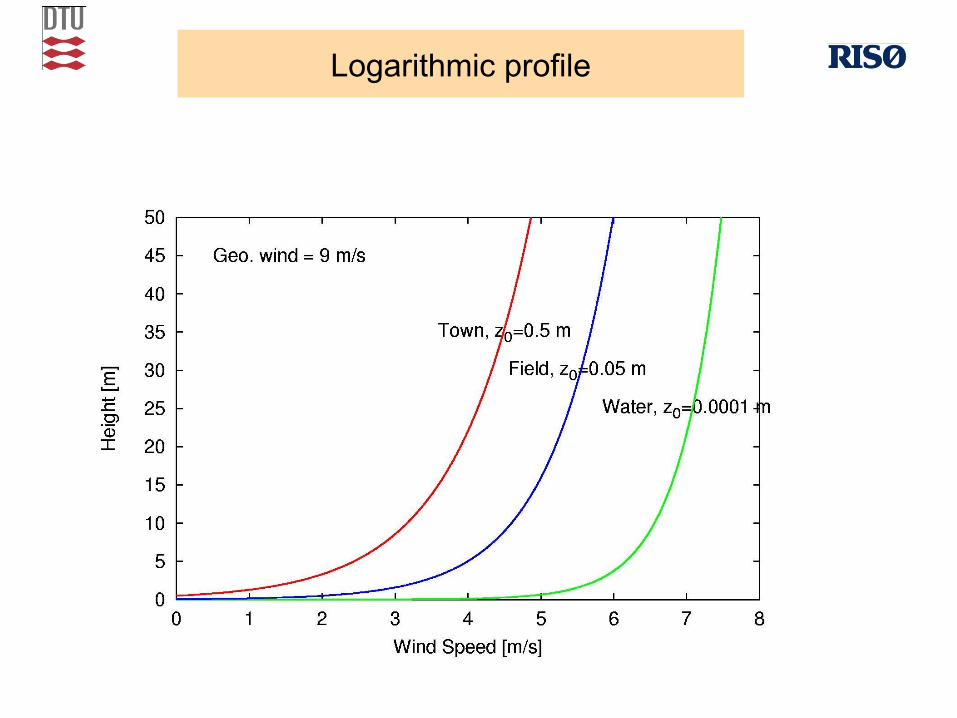
Logarithmic profile
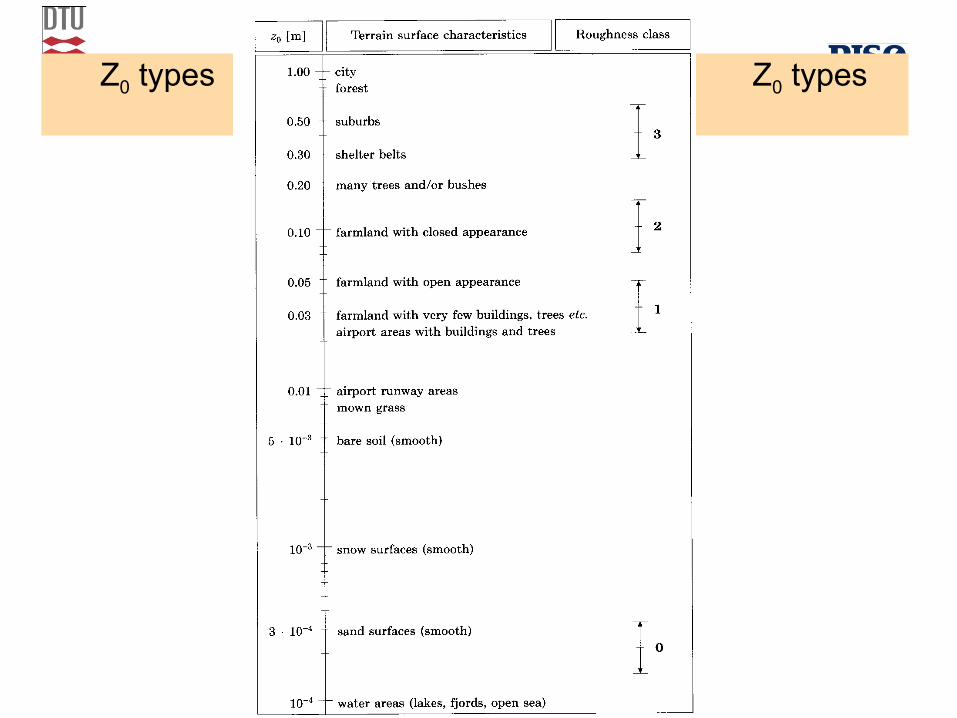
Z0 types Z0 types
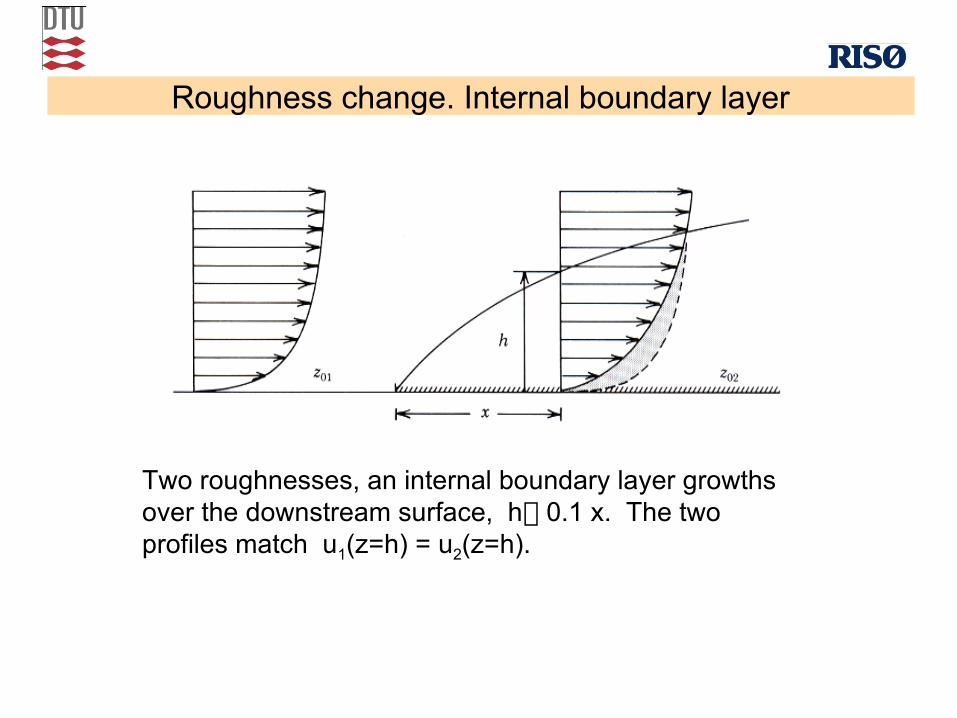
Roughness change. Internal boundary layer
Two roughnesses, an internal boundary layer growths over the downstream surface, h 0.1 x. The two profiles match u1(z=h) = u2(z=h).

Orography
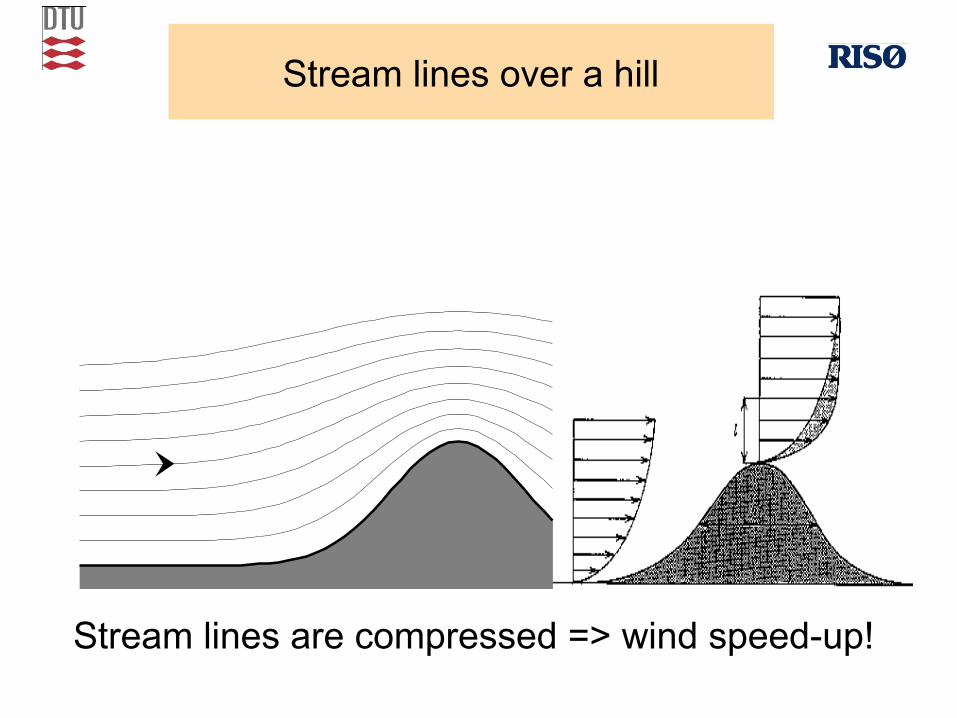
Stream lines are compressed => wind speed-up!
Stream lines over a hill
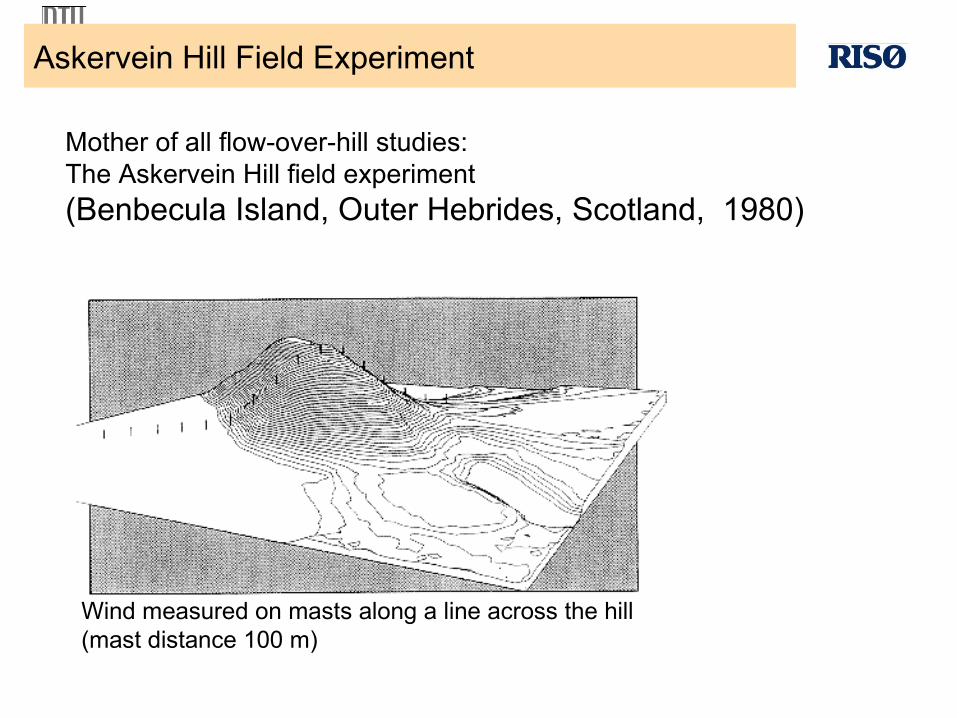
Mother of all flow-over-hill studies:The Askervein Hill field experiment
(Benbecula Island, Outer Hebrides, Scotland, 1980)
Askervein Hill Field Experiment
Wind measured on masts along a line across the hill(mast distance 100 m)
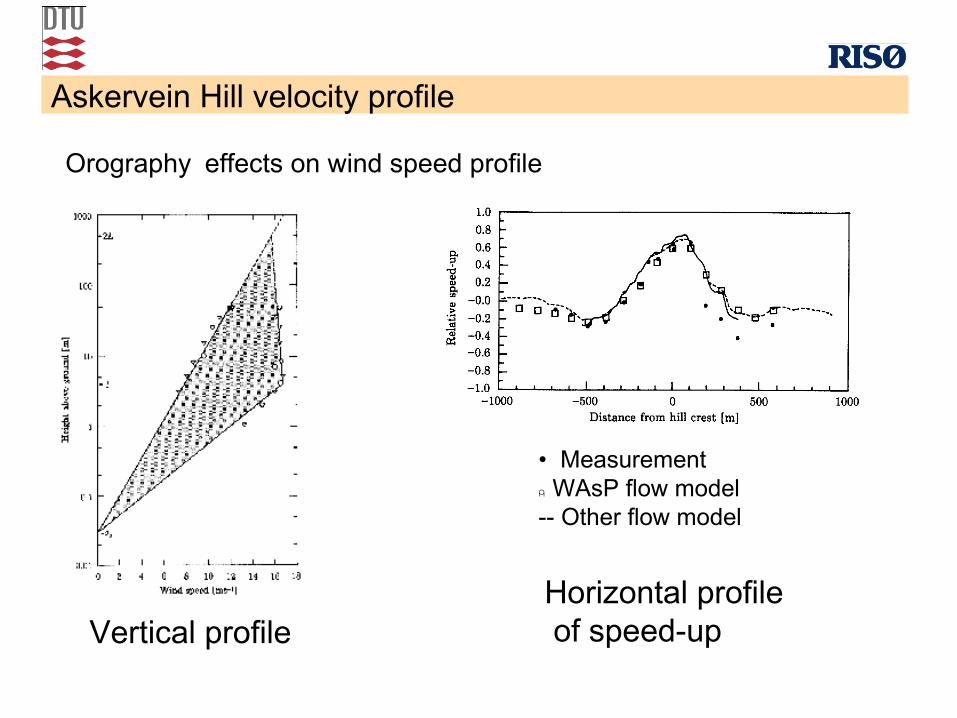
Orography effects on wind speed profile
Askervein Hill velocity profile
Vertical profileHorizontal profile of speed-up
• Measurement � WAsP flow model
-- Other flow model

In practis the neccesary information is provided by:
• Meteorology stations.
•Maps showing orography, and land use.
•Airborne and space surface monitoring.
•Material published by dedicated organisations.
•Site inspections (can be very Important !)
•Everything
With data and models collected, computations can start.
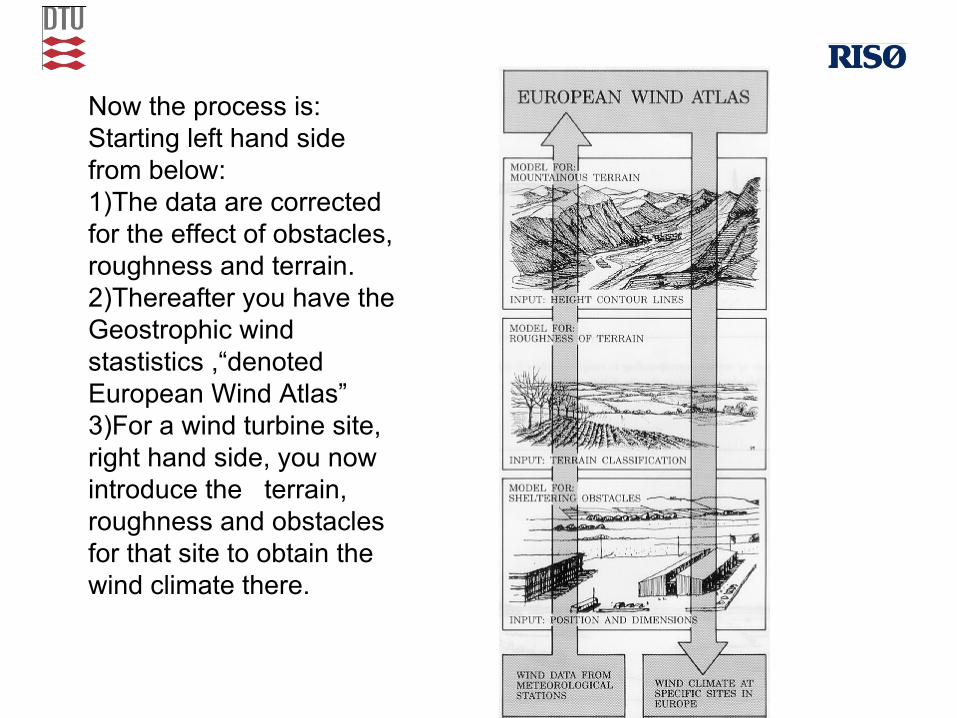
Now the process is:Starting left hand side from below:1)The data are corrected for the effect of obstacles, roughness and terrain. 2)Thereafter you have the Geostrophic wind stastistics ,“denoted European Wind Atlas”3)For a wind turbine site, right hand side, you now introduce the terrain, roughness and obstacles for that site to obtain the wind climate there.
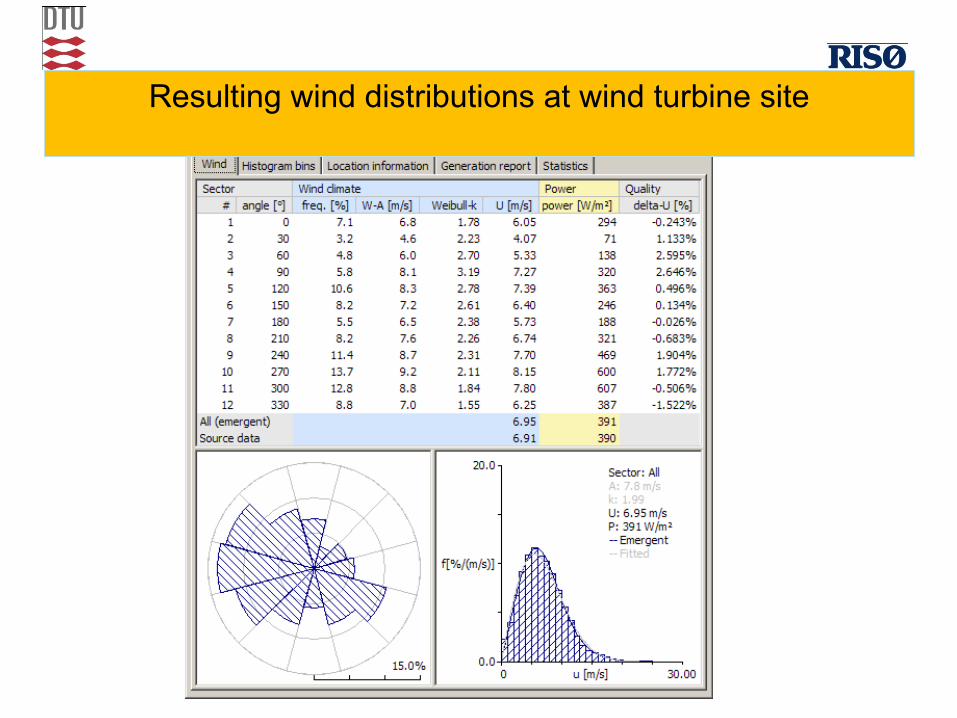
Resulting wind distributions at wind turbine site
Power production basics
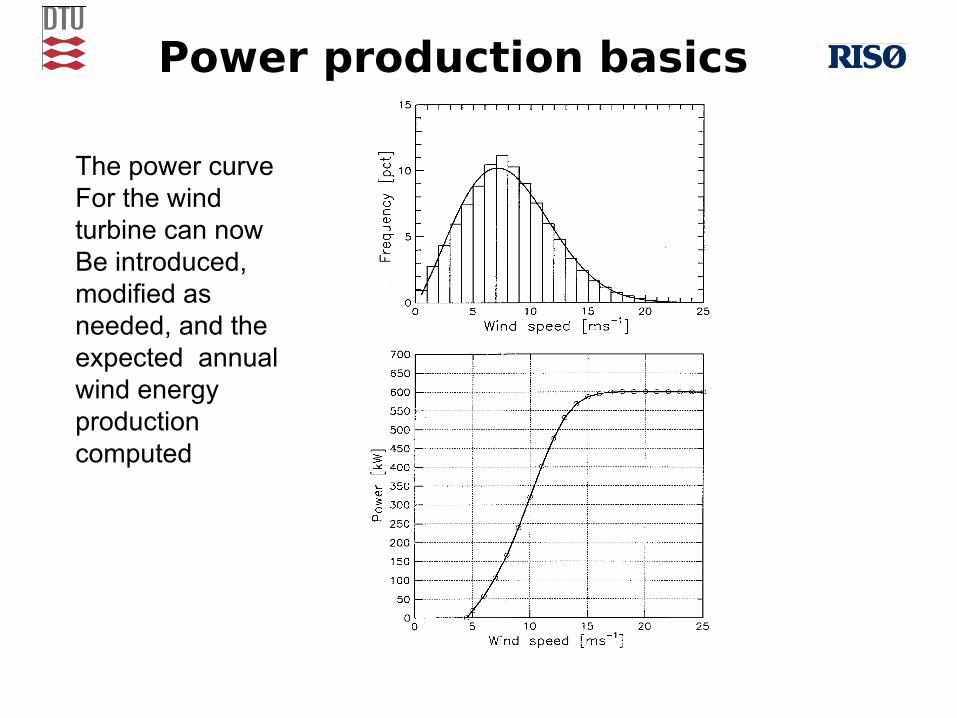
The power curve For the wind turbine can nowBe introduced, modified as needed, and the expected annual wind energy production computed
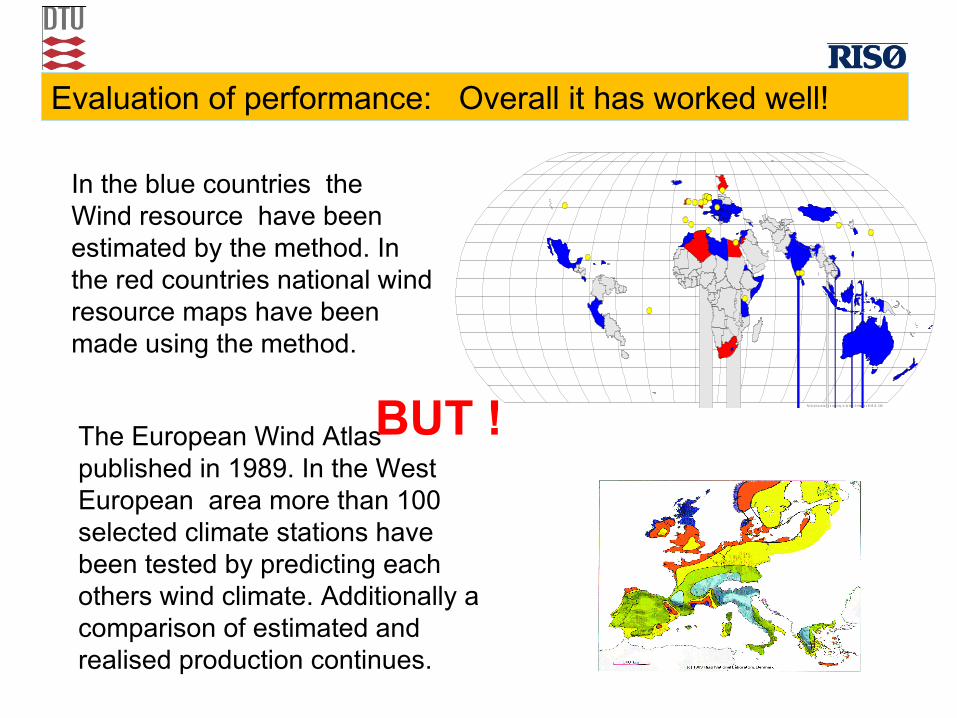
Evaluation of performance: Overall it has worked well!
Po l i t i c a l b o u n d a r i es a c co r d i n g to G o l d e n S o f t w a r e ' s W O R LD . G S B
The European Wind Atlas published in 1989. In the West European area more than 100 selected climate stations have been tested by predicting each others wind climate. Additionally a comparison of estimated and realised production continues.
In the blue countries the Wind resource have been estimated by the method. In the red countries national wind resource maps have been made using the method.
BUT !
The limitations to data extrapolation procedures.
• It needs good quality climate data not too far away ( Geostrophic wind and “general climate”should be similar at the two locations).
It corrects for differences in obstacles, orography, and roughness at the two locations-nothing else.
• It is linear, effects are added .
• It is based almost only on neutral stability boundary layer modelling!
• Roughness of land and water surface can vary with location, but not in time, as for example with season and wind speed.
• Therefore it can not claim to model each situation, but it claims to represent well the annual wind speed and direction distribution, for the parts of the world, where it has been well tested.
If several of the deficiencies are serious, e.g. Good climate observations not available. What then ?
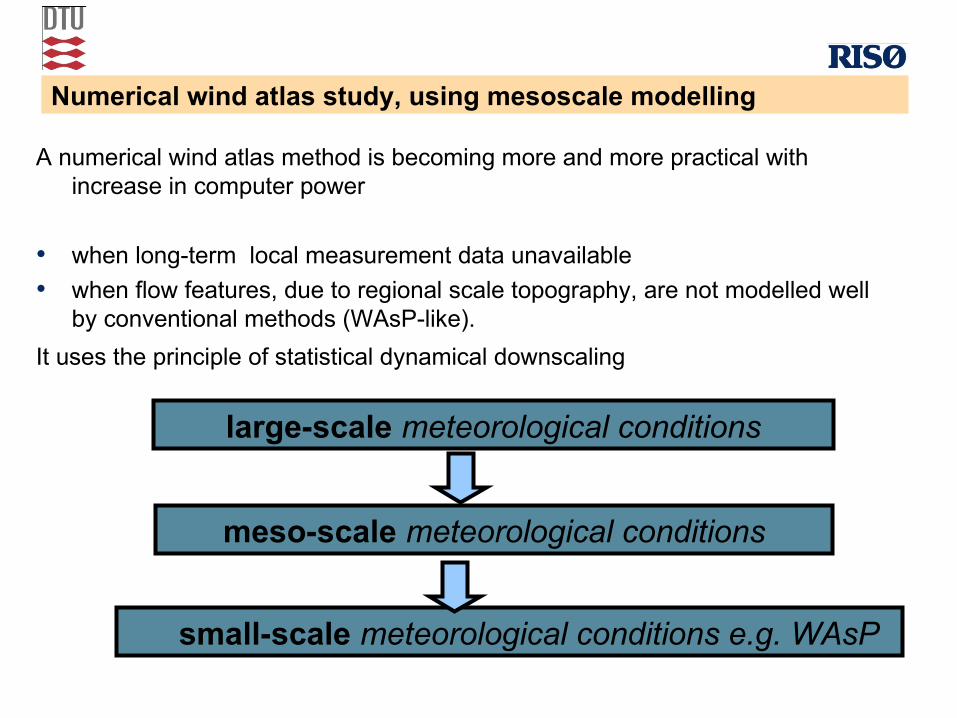
Numerical wind atlas study, using mesoscale modelling
A numerical wind atlas method is becoming more and more practical with increase in computer power
• when long-term local measurement data unavailable
• when flow features, due to regional scale topography, are not modelled well by conventional methods (WAsP-like).
It uses the principle of statistical dynamical downscaling
small-scale meteorological conditions e.g. WAsP
large-scale meteorological conditions
meso-scale meteorological conditions
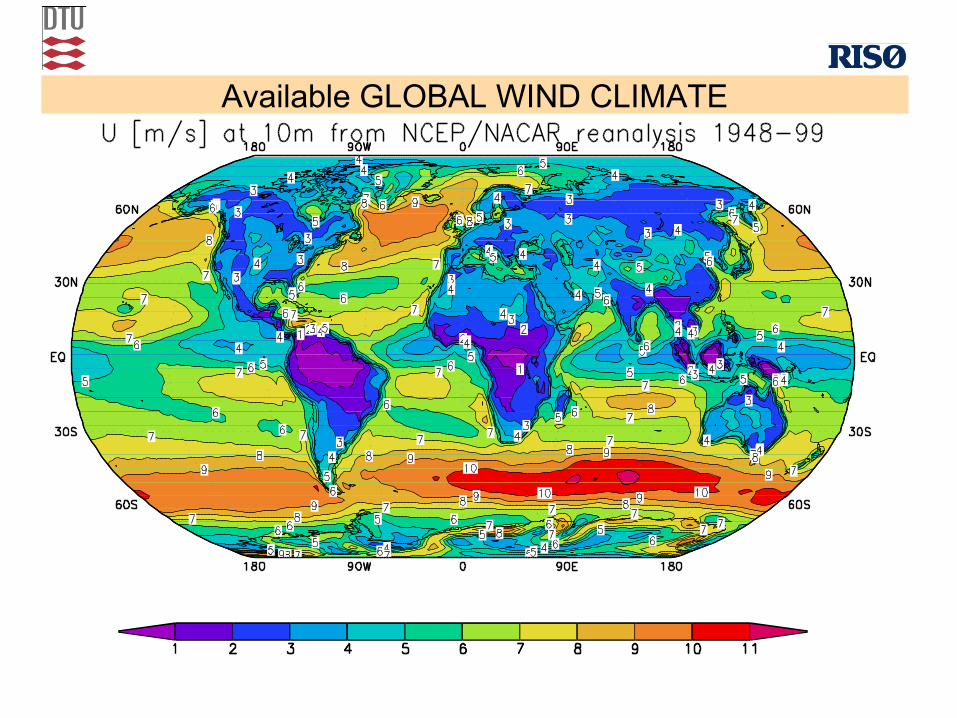
Available GLOBAL WIND CLIMATE
Large-scale meteorological conditions
NCEP/NCAR reanalysis data provides large-scale, long-term atmospheric forcing.
• 2.5 x 2.5 degree resolution
• 4 times daily
• 15 levels
• 1948 to present
All grid points contain all variables in the models used,
NCEP/NCAR data is used to calculate profiles of
• geostrophic wind
• potential temperature at 0, 1500, 3000, 5500 m (1977-2006)
Numerical wind atlas study, using mesoscale modelling : Here Mali

Numerical wind atlas study for Mali using mesoscale modelling
Need following ingredients:
• a tool to calculate how atmospheric flow is modified by terrain
• mesoscale model downscaling
i.e. represented by in previous slide.
The meso-scale model needs:
• information about large-scale meteorological conditions
• information about terrain :
• surface elevation (orography)
• surface roughness
Numerical wind atlas study for Mali using mesoscale modelling
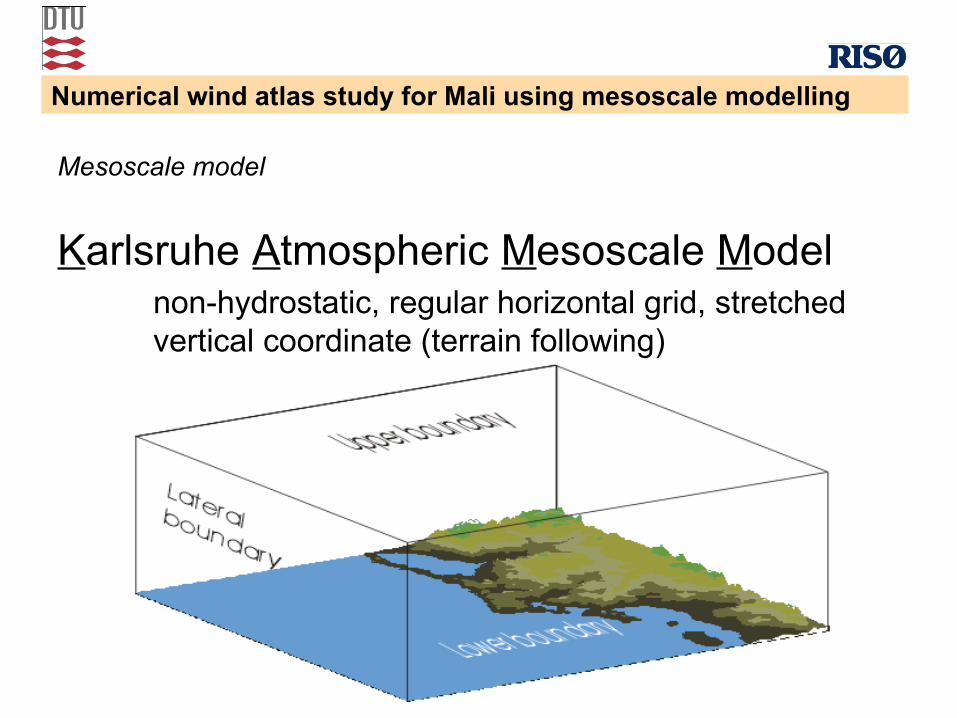
Mesoscale model
Karlsruhe Atmospheric Mesoscale Modelnon-hydrostatic, regular horizontal grid, stretched vertical coordinate (terrain following)
Numerical wind atlas study for Mali using mesoscale modelling
Terrain description
Orography
• SRTM30 data – approx. 1km resolution.
The Space Shuttle Radar Topographical Mission data is provide by the National (USA) Geospatial-
Intelligence Agency (NGA) and the National (USA) Aeronautics and Space Administration (NASA).
Surface roughness
• USGS GLCC 30 dataset – approx. 1km resolution.
• Land use surface roughness (via look-up table)
The Global Land Cover Classification (GLCC) is provided by the United States Geological Survey.
Mali is a large country therefore 3 calculation domains have been used to give complete coverage (7.5 km resolution).
Numerical wind atlas study for Mali using mesoscale modelling
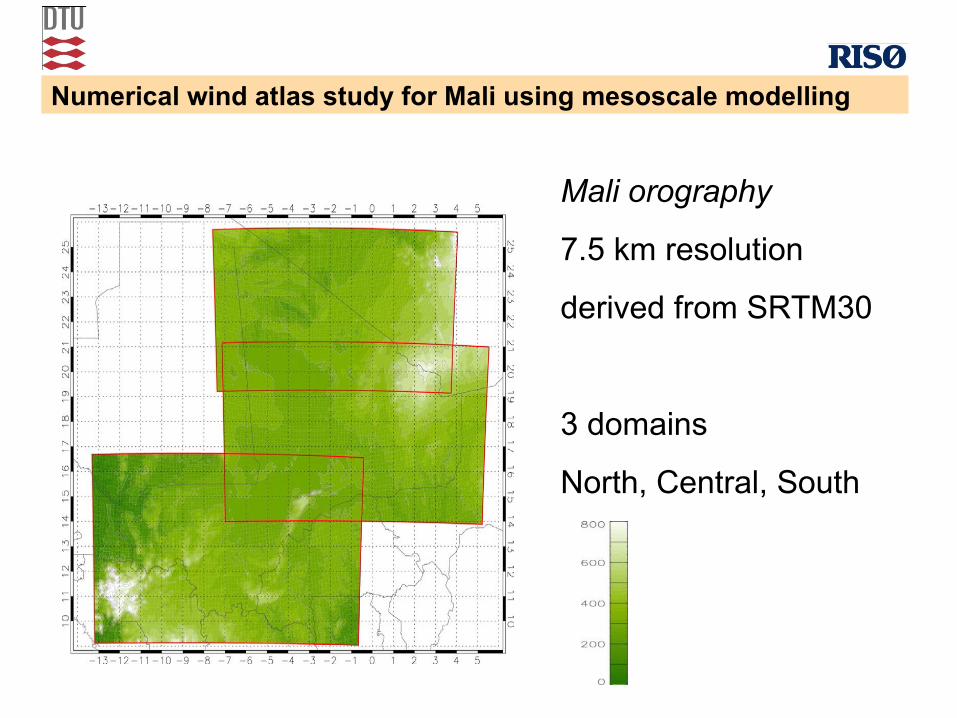
Mali orography
7.5 km resolution
derived from SRTM30
3 domains
North, Central, South
Numerical wind atlas study for Mali using mesoscale modelling
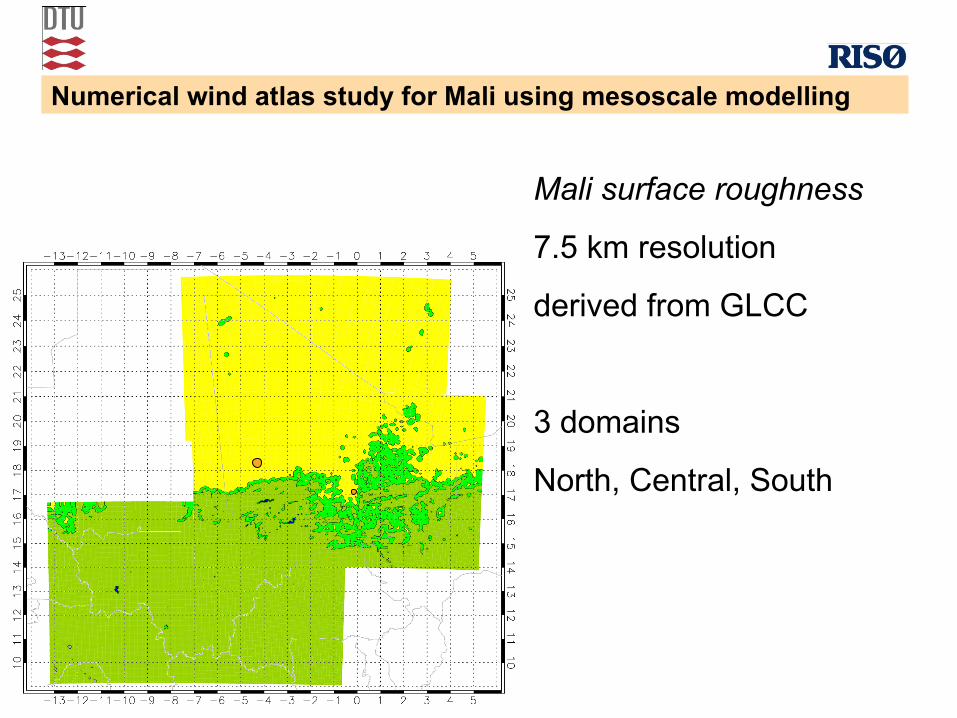
Mali surface roughness
7.5 km resolution
derived from GLCC
3 domains
North, Central, South
We have the terrain description, large-scale atmospheric conditions, and mesoscale scale model ready to run, so…
• We could run KAMM using 30 years of 4 times daily data as large-scale forcing conditions
30*365*4 = 43800 integrations
A lot of work! …and also repetition.
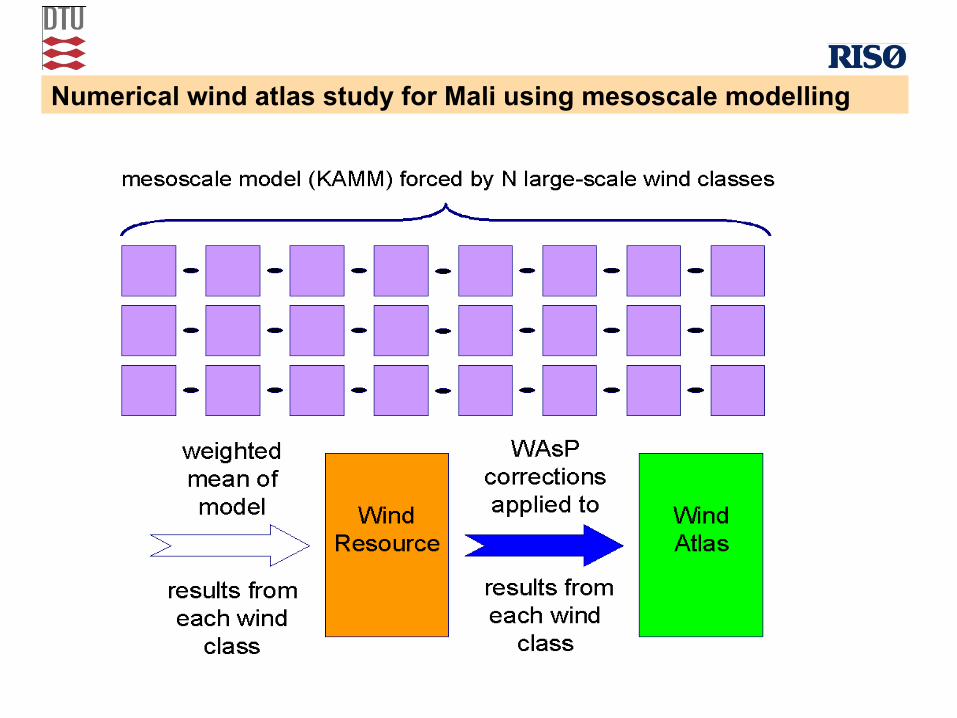
• Instead we select around 130 representative conditions, called wind classes profiles or aggregation.
• “Statistical-dynamical downscaling”
Numerical wind atlas study for Mali using mesoscale modelling
Numerical wind atlas study for Mali using mesoscale modelling
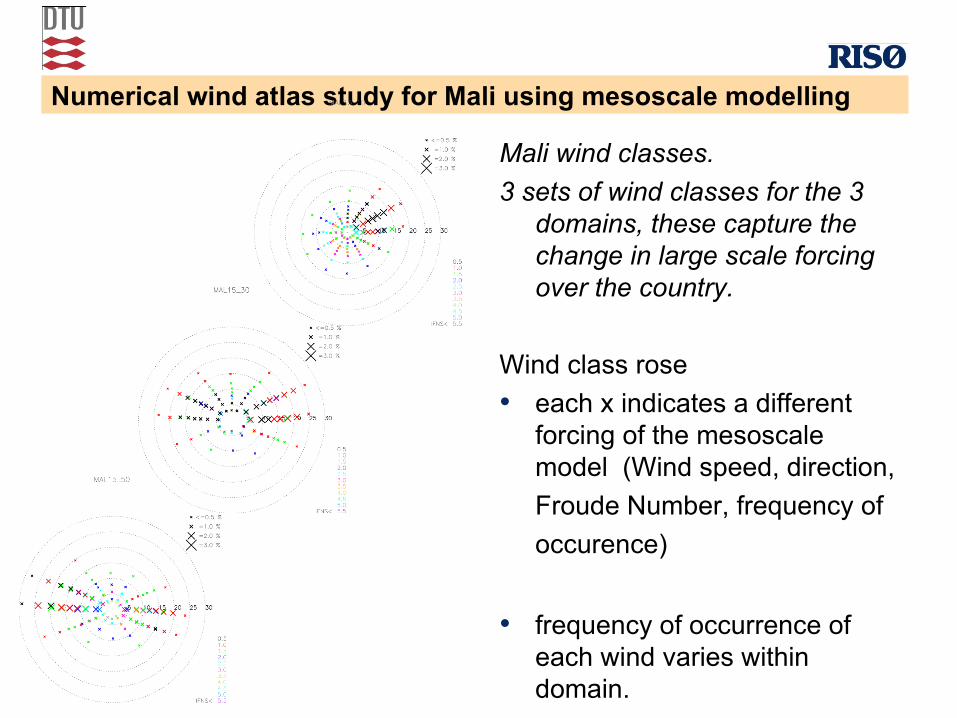
Mali wind classes.
3 sets of wind classes for the 3 domains, these capture the change in large scale forcing over the country.
Wind class rose
• each x indicates a different forcing of the mesoscale model (Wind speed, direction,
Froude Number, frequency of
occurence)
• frequency of occurrence of each wind varies within domain.
Numerical wind atlas study for Mali using mesoscale modelling

Numerical wind atlas study for Mali using mesoscale modelling
Mali wind resource map
Mean simulated wind speed
at 50 m a.g.l
• orography and roughness as in mesoscale model
• annual mean
Finally application of the micro-scale model WAsP focused on relevant point locations to :
• Compare model wind climate with measured wind climate existing measuring sites. Apply micro scale terrain features
• Predict the annual wind energy production for selected sites , with micro-scale terrain features, and chosen wind turbines with given power curves.
Numerical wind atlas study for Mali using mesoscale modelling
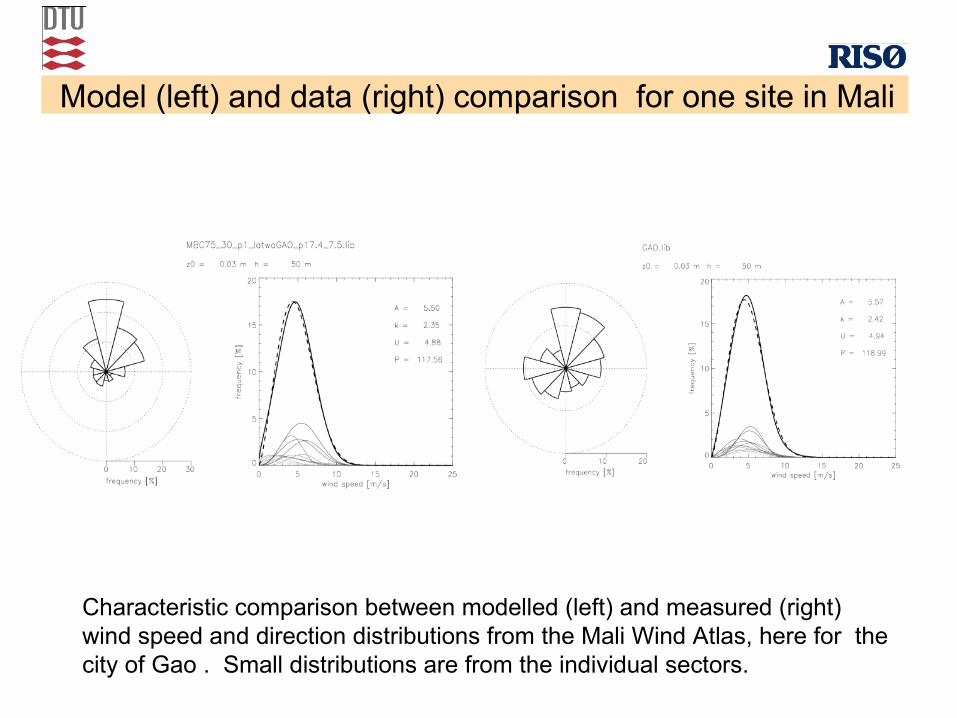
Model (left) and data (right) comparison for one site in Mali
Characteristic comparison between modelled (left) and measured (right) wind speed and direction distributions from the Mali Wind Atlas, here for the city of Gao . Small distributions are from the individual sectors.
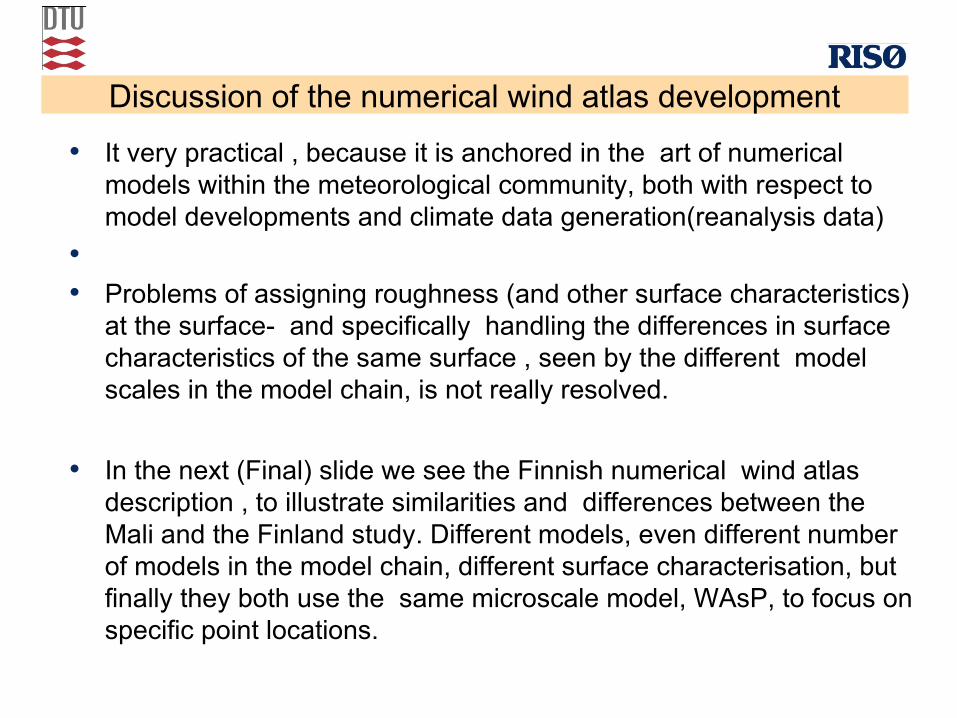
Discussion of the numerical wind atlas development
• It very practical , because it is anchored in the art of numerical models within the meteorological community, both with respect to model developments and climate data generation(reanalysis data)
•
• Problems of assigning roughness (and other surface characteristics) at the surface- and specifically handling the differences in surface characteristics of the same surface , seen by the different model scales in the model chain, is not really resolved.
• In the next (Final) slide we see the Finnish numerical wind atlas description , to illustrate similarities and differences between the Mali and the Finland study. Different models, even different number of models in the model chain, different surface characterisation, but finally they both use the same microscale model, WAsP, to focus on specific point locations.
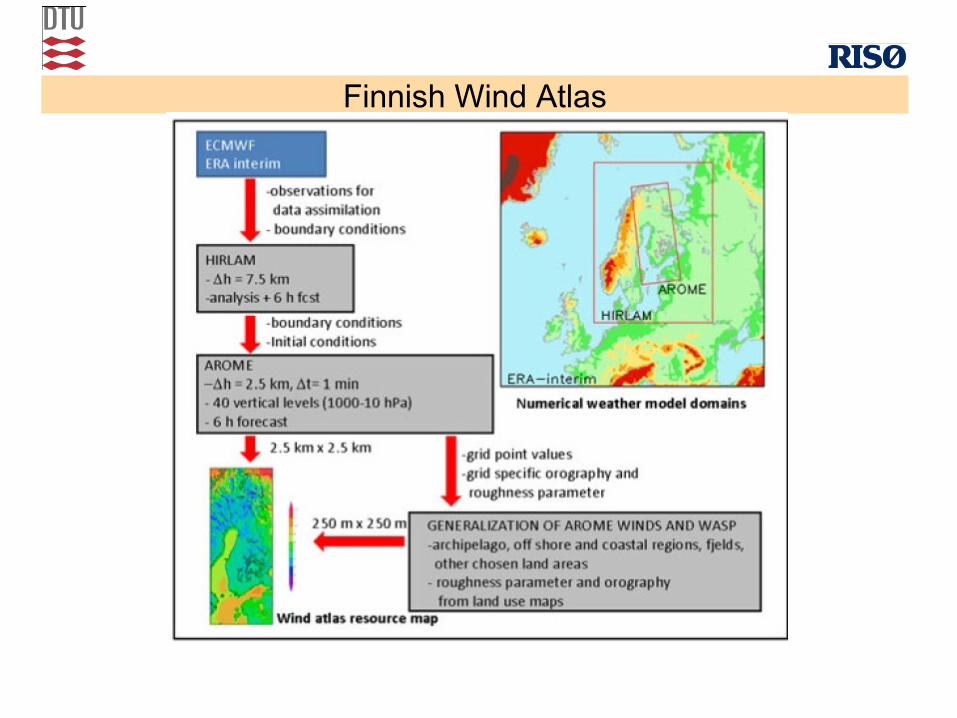
Finnish Wind Atlas
Wind Atlas.
A Wind Atlas for a area is a data-model system that can predict the wind energy production at any location within the area, by a given wind turbine.For design the wind is important as well, but we do not discuss it here.
For decisions about, if, when and where to erect wind turbines, it has therefore been quite an important tool. As for all meteorological modelling, it is also somewhat an art with many assumptions, simplification and even individual preferences included, and it is under constant development . Therefore, the continued comparison with data will remain an essential part of the area.
Thank you for your attention!

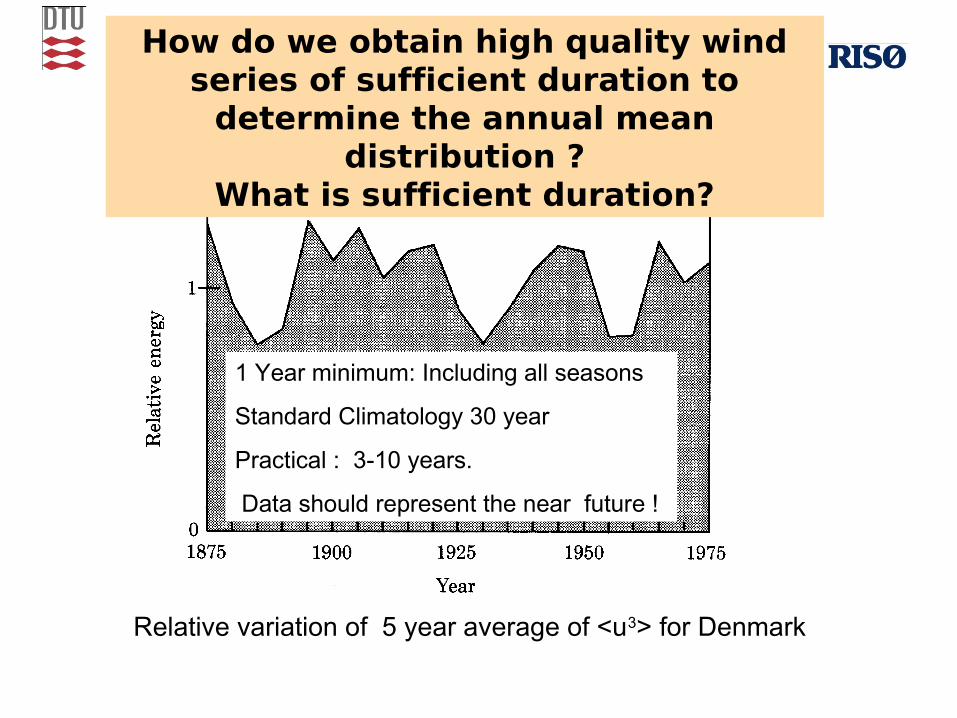
How do we obtain high quality wind series of sufficient duration to
determine the annual mean distribution ?
What is sufficient duration?
1 Year minimum: Including all seasons
Standard Climatology 30 year
Practical : 3-10 years.
Data should represent the near future !
Relative variation of 5 year average of <u3> for Denmark

Effects of an obstacle
Reduction of wind speed in per cent due to shelter by a two-dimensional obstacle of zero porosity. Based on the expressions given by Perera (1981)
Numerical wind atlas study for Mali using mesoscale modelling
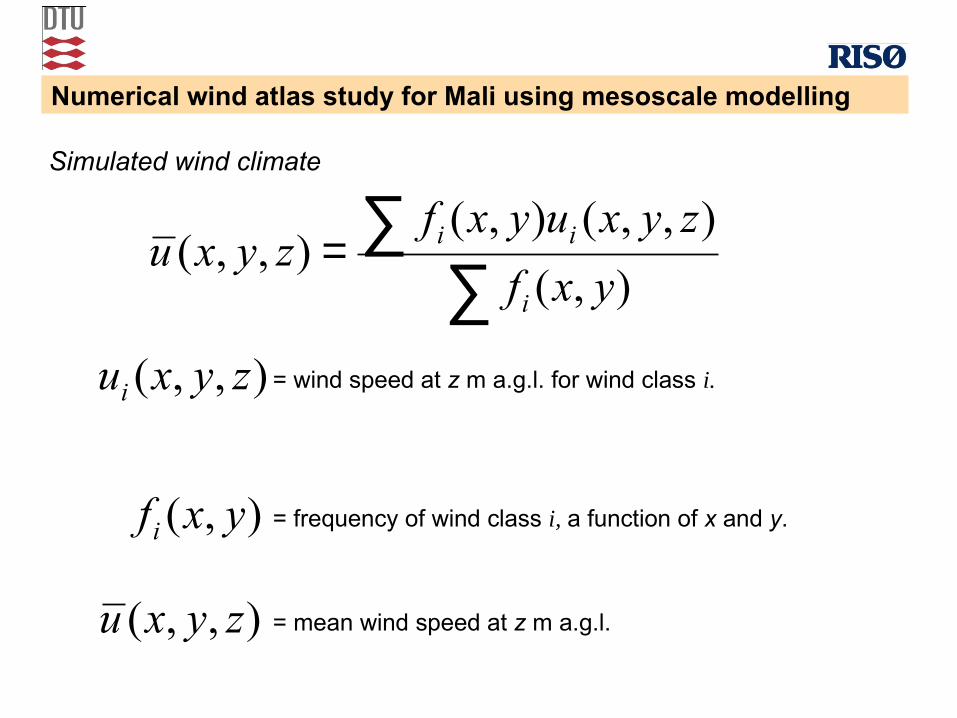
= wind speed at z m a.g.l. for wind class i.
= frequency of wind class i, a function of x and y.
= mean wind speed at z m a.g.l.
∑∑=
),(
),,(),(),,(
yxf
zyxuyxfzyxu
i
ii
),,( zyxui
),,( zyxu
),( yxfi
Simulated wind climate
Numerical wind atlas study for Mali using mesoscale modelling
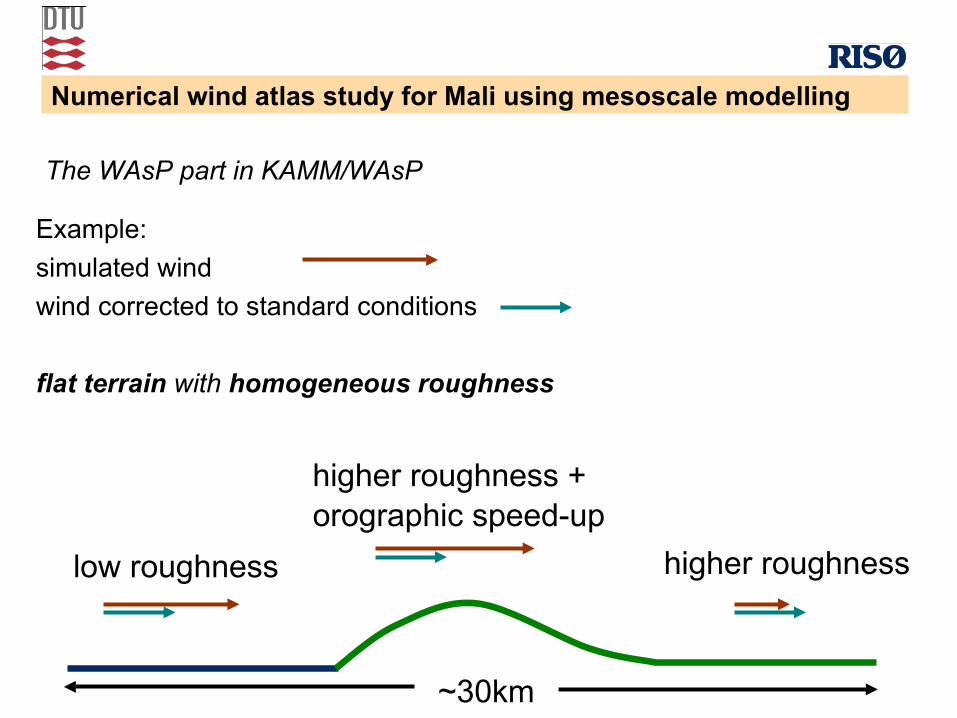
Example:
simulated wind
wind corrected to standard conditions
flat terrain with homogeneous roughness
low roughness higher roughness
~30km
orographic speed-uphigher roughness +
The WAsP part in KAMM/WAsP
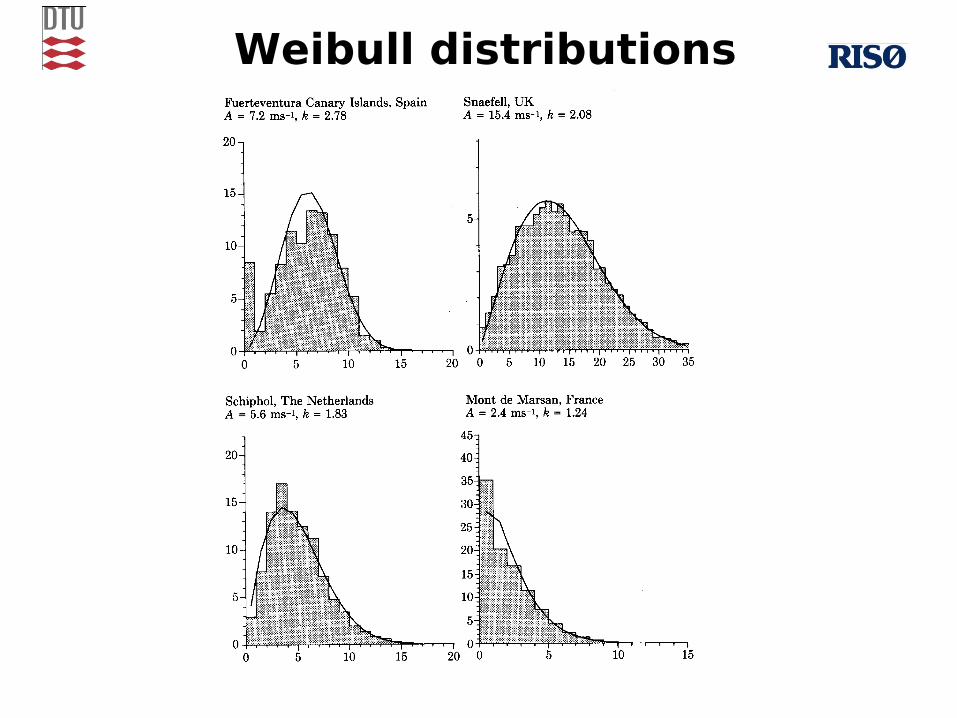
Weibull distributions
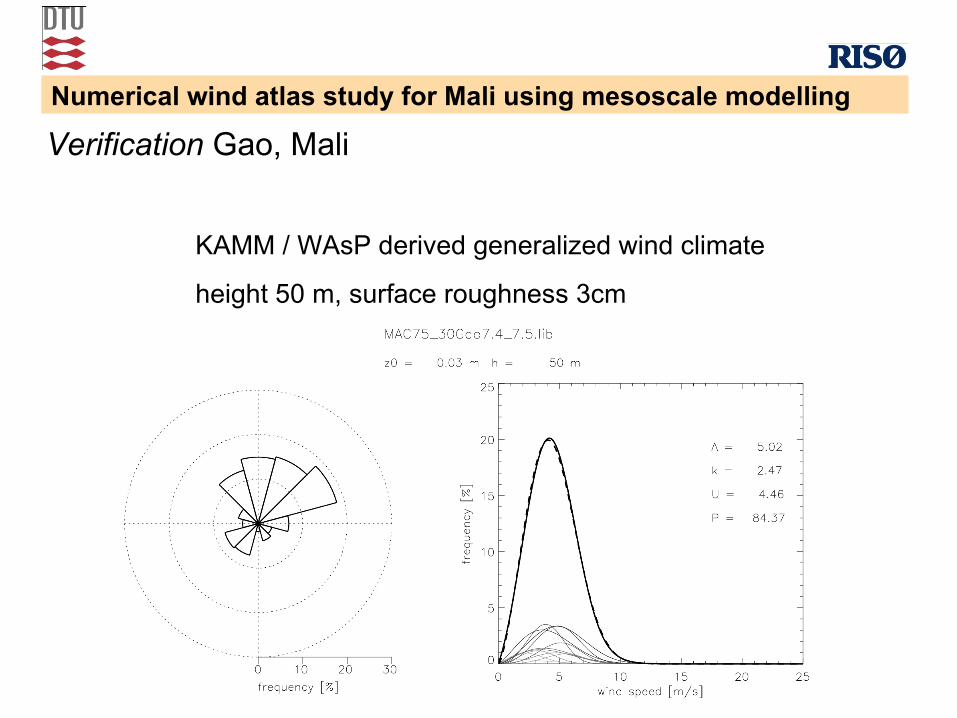
Verification Gao, Mali
Numerical wind atlas study for Mali using mesoscale modelling
KAMM / WAsP derived generalized wind climate
height 50 m, surface roughness 3cm
Numerical wind atlas study for Mali using mesoscale modelling
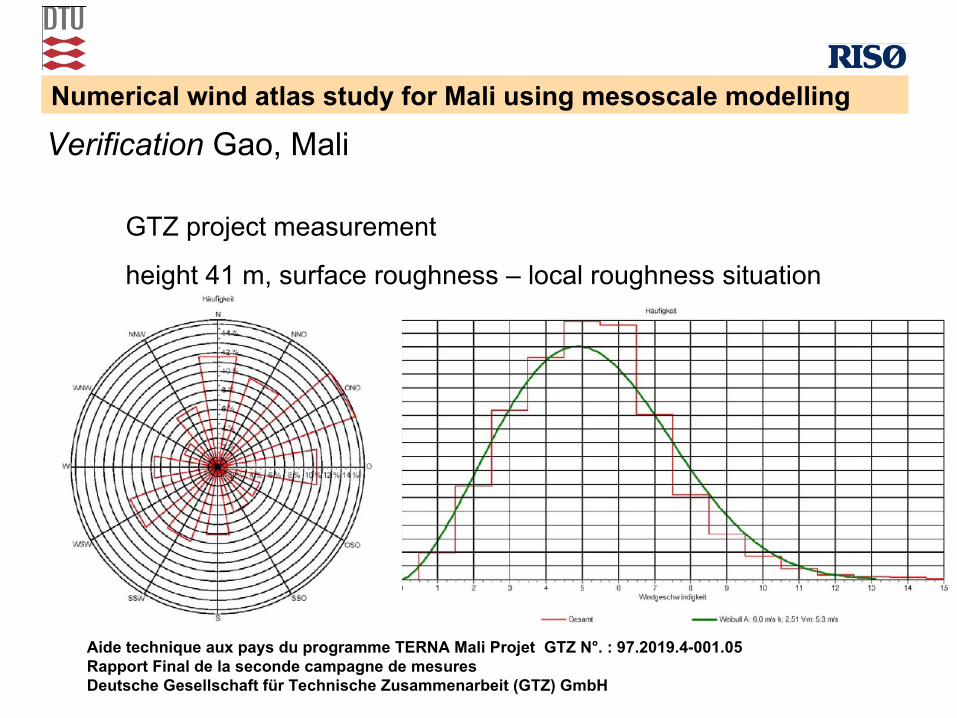
Aide technique aux pays du programme TERNA Mali Projet GTZ N°. : 97.2019.4-001.05Rapport Final de la seconde campagne de mesuresDeutsche Gesellschaft für Technische Zusammenarbeit (GTZ) GmbH
Verification Gao, Mali
GTZ project measurement
height 41 m, surface roughness – local roughness situation

Numerical wind atlas study for Mali using mesoscale modelling
By inspection it can be seen that the direction rose and wind speed distribution are rather close for the model derived wind climate and the measured climate.
A proper verification requires the comparison of generalized wind climates. The GTZ measurements at Gao can be analysed with WAsP to account for orographic and surface roughness effects on the local wind.
Orographic information can be obtained from SRTM data.
Roughness information can be obtained from on-site survey and satellite imagery.
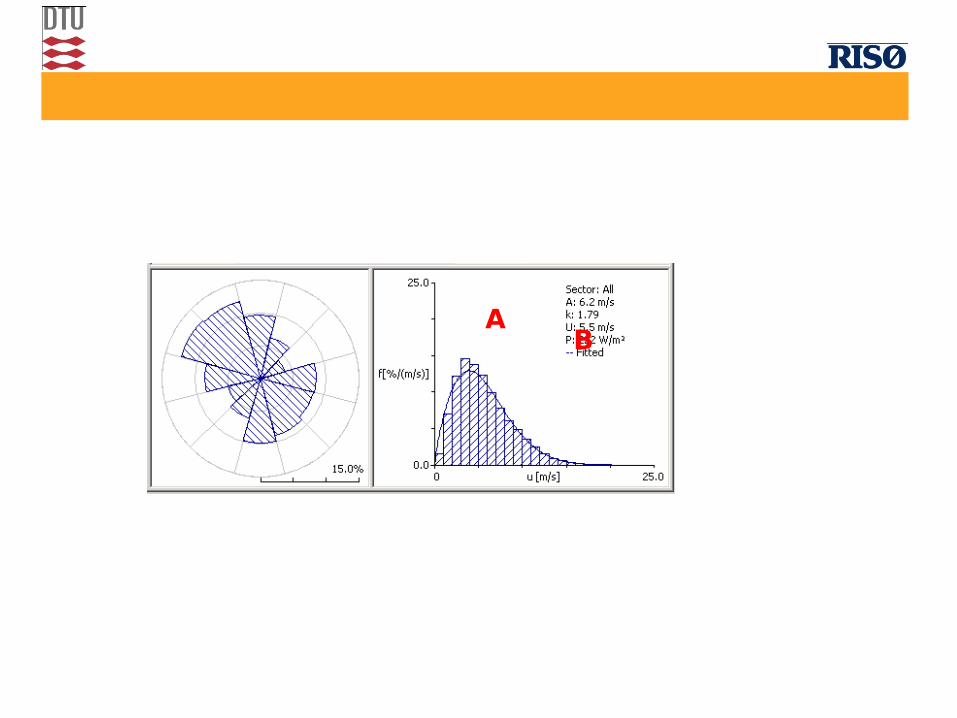
BA
Numerical wind atlas study for Mali using mesoscale modelling
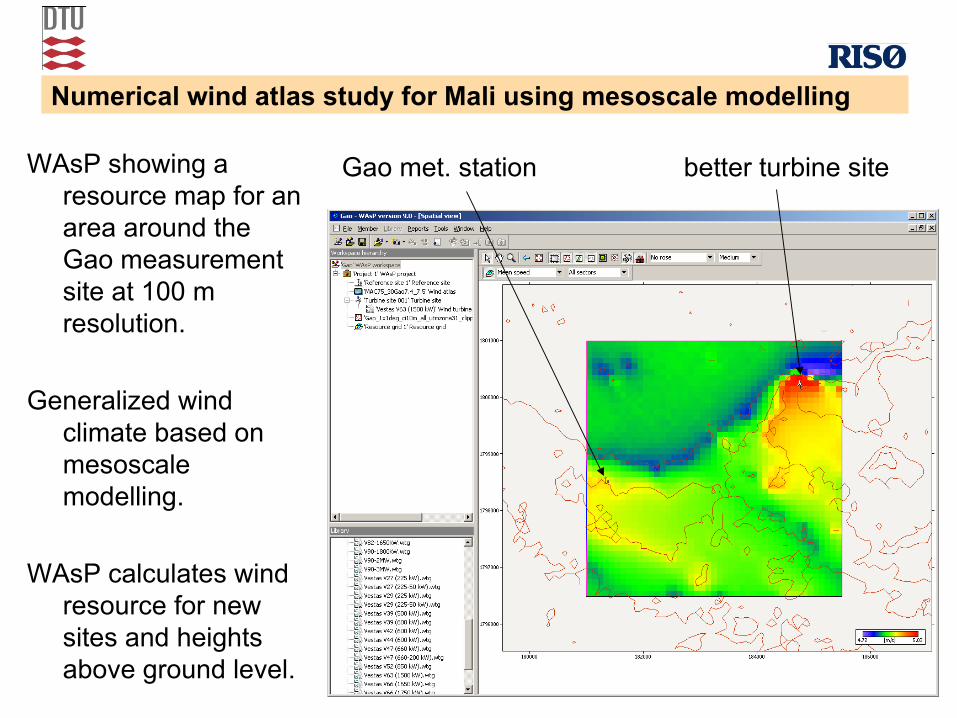
WAsP showing a resource map for an area around the Gao measurement site at 100 m resolution.
Generalized wind climate based on mesoscale modelling.
WAsP calculates wind resource for new sites and heights above ground level.
Gao met. station better turbine site
Numerical wind atlas study for Mali using mesoscale modelling
Conclusions
• Wind resource has been estimated for all of Mali at 7.5 km resolution using the KAMM/WAsP numerical wind atlas methodology.
• 3 domains used to cover entire country
• 3 sets of wind classes used to capture change in large scale forcing over country
• Output includes generalized climate statistics for any location in Mali, giving wind direction and wind speed distribution.
• the climate statistics can be used directly in the WAsP software
• high resolution topographical information added in WAsP
• verification studies
• wind turbine annual power production calculations
• First qualitative comparison with wind measurements (GAO) indicates broad agreement of KAMM/WAsP and observations
Numerical wind atlas study for Mali using mesoscale modelling
On Manque:
• Valider/calibrer les modellisation avec plus des données meteorologique, avec le WAsP application come a Gao mais plus systematique
• Fair des estimates de la production eolienne a des placements differentes avec application des parametres de les differentes turbine eoliennes.
Numerical wind atlas study for Mali using mesoscale modelling
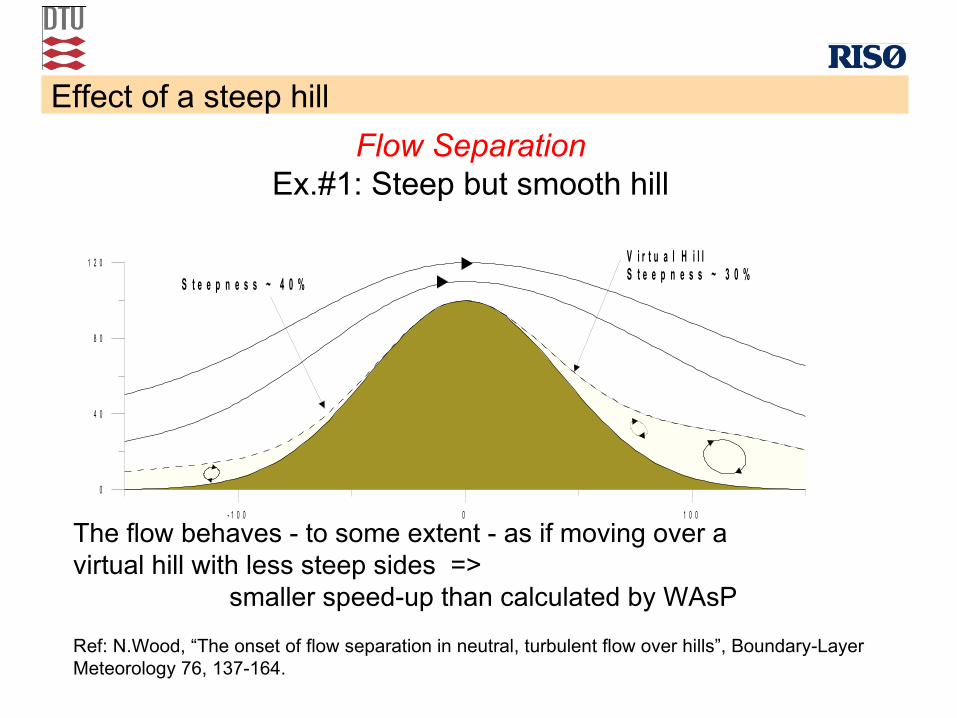
Flow SeparationEx.#1: Steep but smooth hill
Effect of a steep hill
The flow behaves - to some extent - as if moving over avirtual hill with less steep sides =>
smaller speed-up than calculated by WAsP
Ref: N.Wood, “The onset of flow separation in neutral, turbulent flow over hills”, Boundary-Layer Meteorology 76, 137-164.
- 1 0 0 0 1 0 0
0
4 0
8 0
1 2 0 V i r t u a l H i l lS t e e p n e s s ~ 3 0 %
S t e e p n e s s ~ 4 0 %
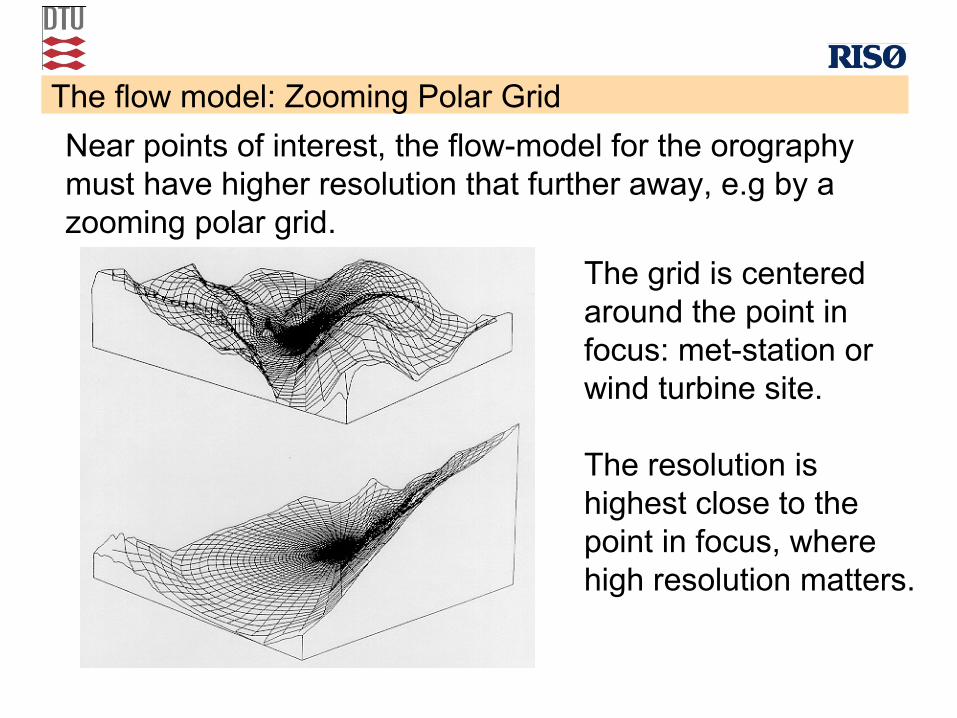
Near points of interest, the flow-model for the orography must have higher resolution that further away, e.g by a zooming polar grid.
The flow model: Zooming Polar Grid
The grid is centered around the point in focus: met-station or wind turbine site.
The resolution is highest close to the point in focus, where high resolution matters.

Numerical wind atlas study for Mali using mesoscale modelling
Acknowledgements
• Deutsche Gesellschaft für Technische Zusammenarbeit (GTZ) GmbH: for providing measurement data for Gao from the project “Aide technique aux pays du programme TERNA Mali Projet” GTZ N°. : 97.2019.4-001.05 “Rapport Final de la seconde campagne de mesures”.
• NCEP/NCAR reanalysis data are provided by the National (USA) Center for Environmental Prediction (NCEP) and the National (USA) Center for Atmospheric Research (NCAR).
• SRTM data is provided by the National (USA) Geospatial-Intelligence Agency (NGA) and the National (USA) Aeronautics and Space Administration (NASA).
• The roughness data is derived from the United States Geological Survey (USGS) Global Land Cover Classification.
• KAMM is used with kind permission from Karlsruhe University, Germany.

Numerical wind atlas study for Mali using mesoscale modelling
Mali wind atlas map
Mean generalized wind speed
at 50 m a.g.l.,
• standard conditions
• flat terrain
• surface roughness 0.03m
• annual mean
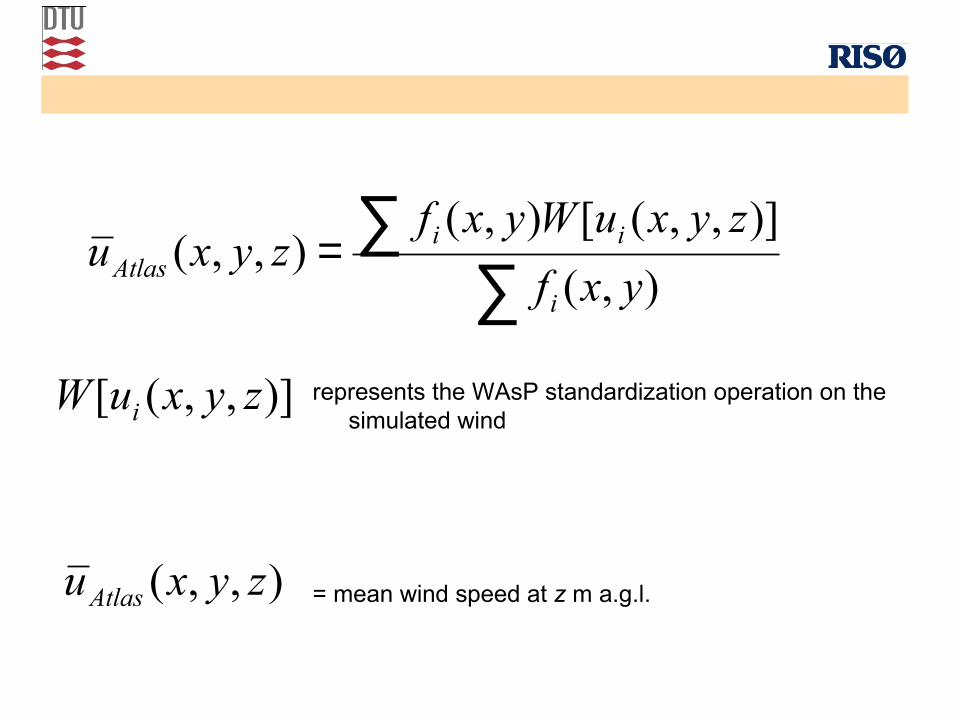
represents the WAsP standardization operation on the simulated wind
= mean wind speed at z m a.g.l.
∑∑=
),(
)],,([),(),,(
yxf
zyxuWyxfzyxu
i
iiAtlas
)],,([ zyxuW i
),,( zyxuAtlas
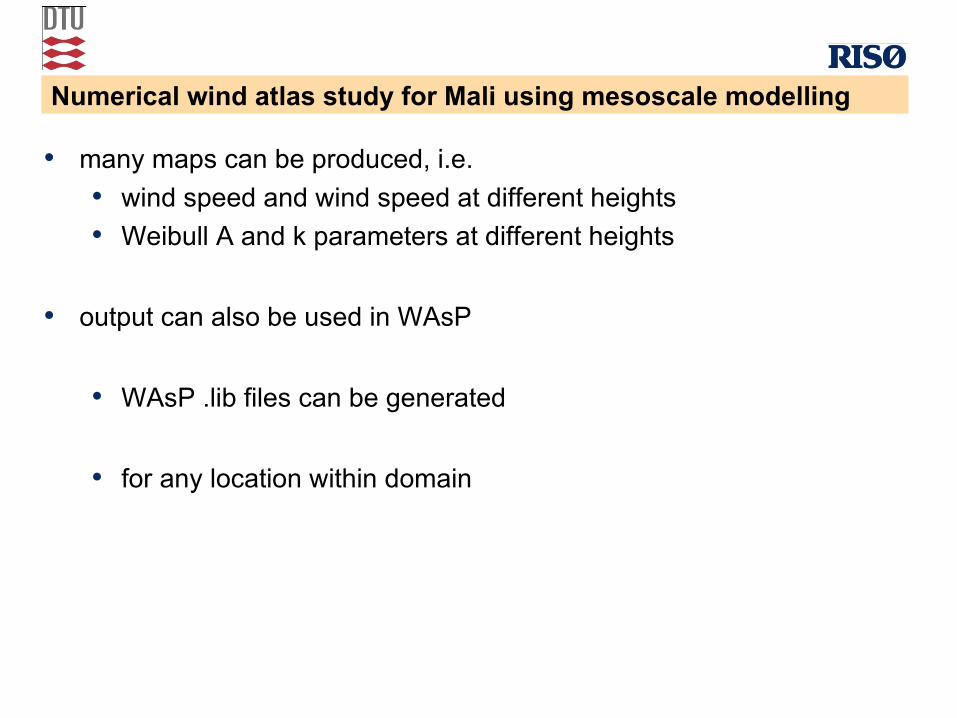
• many maps can be produced, i.e.
• wind speed and wind speed at different heights
• Weibull A and k parameters at different heights
• output can also be used in WAsP
• WAsP .lib files can be generated
• for any location within domain
Numerical wind atlas study for Mali using mesoscale modelling
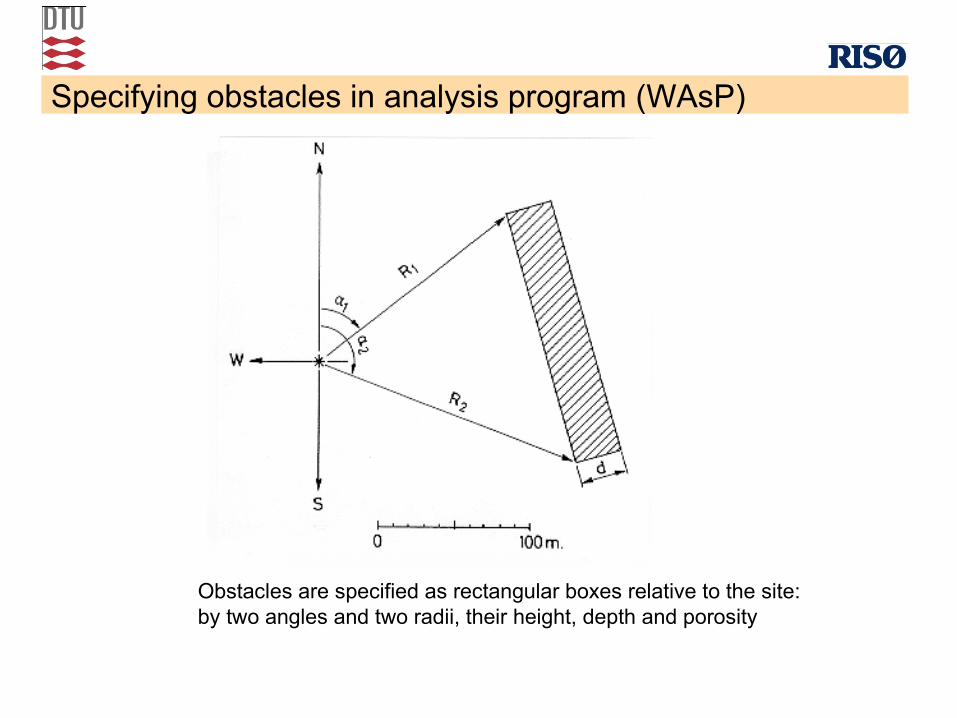
Specifying obstacles in analysis program (WAsP)
Obstacles are specified as rectangular boxes relative to the site:by two angles and two radii, their height, depth and porosity
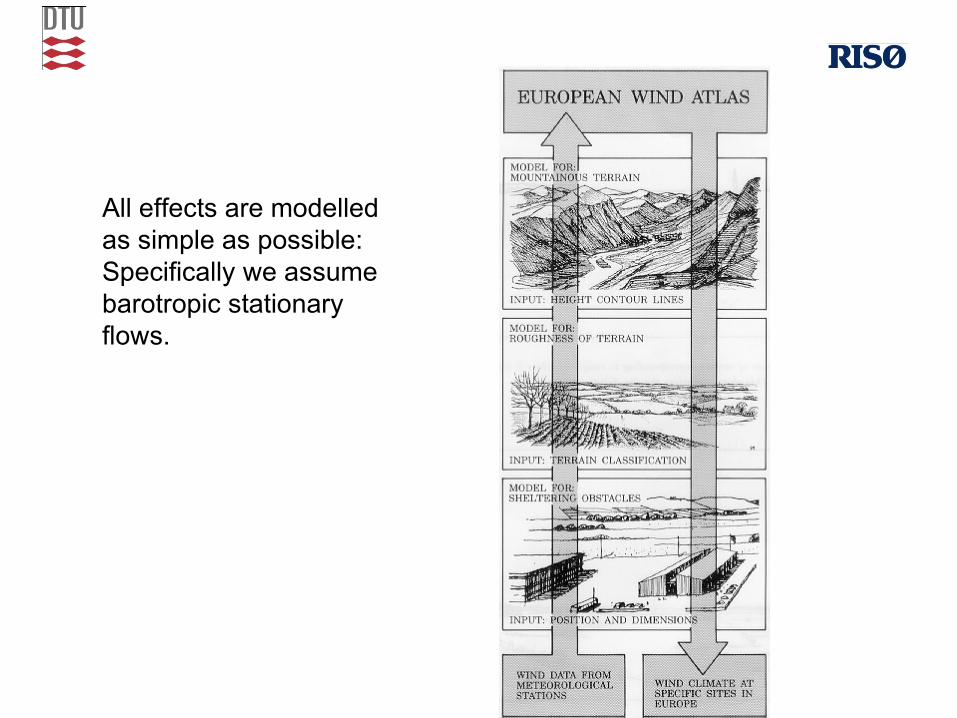
All effects are modelled as simple as possible:Specifically we assume barotropic stationary flows.
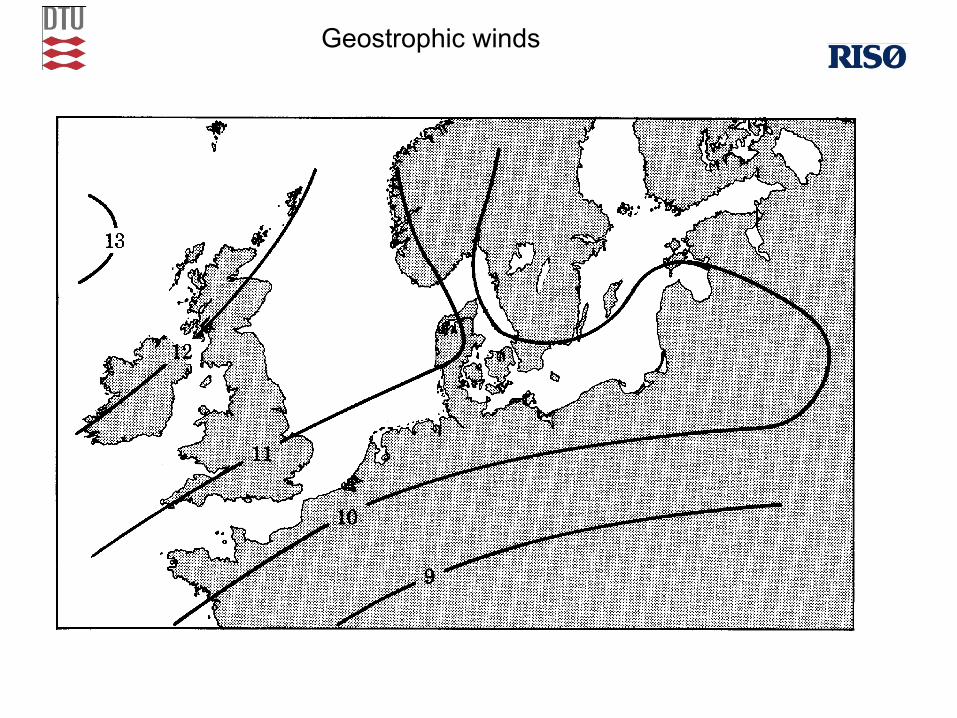
Geostrophic winds