
Wind resource, energy and uncertainty · Wind resource assessment Wind analysis Wind flow modelling...
28
Wind resource, energy and uncertainty Author: Chiara Pavani Organization: GL Garrad Hassan
Transcript of Wind resource, energy and uncertainty · Wind resource assessment Wind analysis Wind flow modelling...
Wind resource, energy and uncertainty
Author:Chiara Pavani
Organization:GL Garrad Hassan

2
GL GARRAD HASSAN: EXPERTS IN RENEWABLE ENERGY
Onshore & Offshore Wind Wave & Tidal Solar PV & CSP
Chiara Pavani GL Garrad Hassan Ancona, May 2013
3
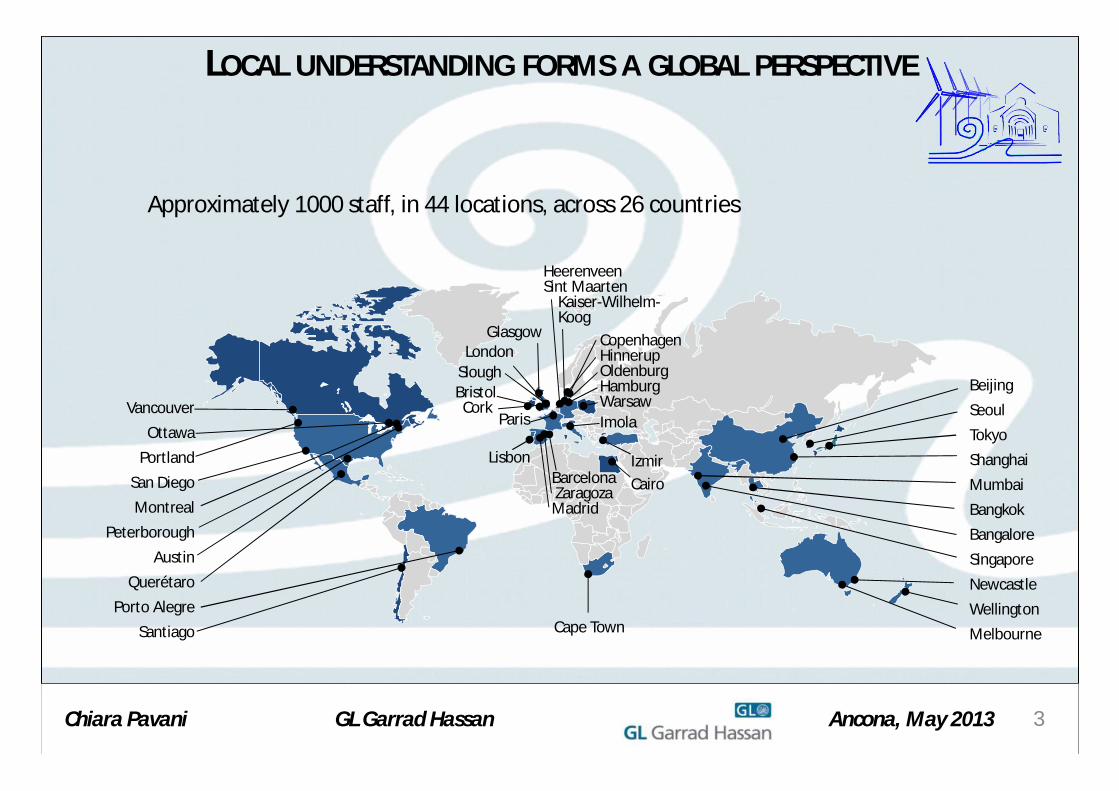
LOCAL UNDERSTANDING FORMS A GLOBAL PERSPECTIVE
Approximately 1000 staff, in 44 locations, across 26 countries
VancouverOttawa
PortlandSan DiegoMontreal
PeterboroughAustin
QuerétaroPorto Alegre
Santiago
BeijingSeoulTokyoShanghaiMumbaiBangkokBangaloreSingaporeNewcastleWellingtonMelbourne
BristolCork
Paris
IzmirCairo
CopenhagenHinnerupOldenburgHamburgWarsaw
LisbonBarcelonaZaragozaMadrid
Imola
LondonSlough
Glasgow
Cape Town
HeerenveenSint Maarten
Kaiser-Wilhelm-Koog
Chiara Pavani GL Garrad Hassan Ancona, May 2013

4
PROVIDING LIFECYCLE SUPPORT TO ALL STAKEHOLDERS
•Project Developers•Owners and Operators•Investors•Manufacturers•Governments and NGOs
Chiara Pavani GL Garrad Hassan Ancona, May 2013
5
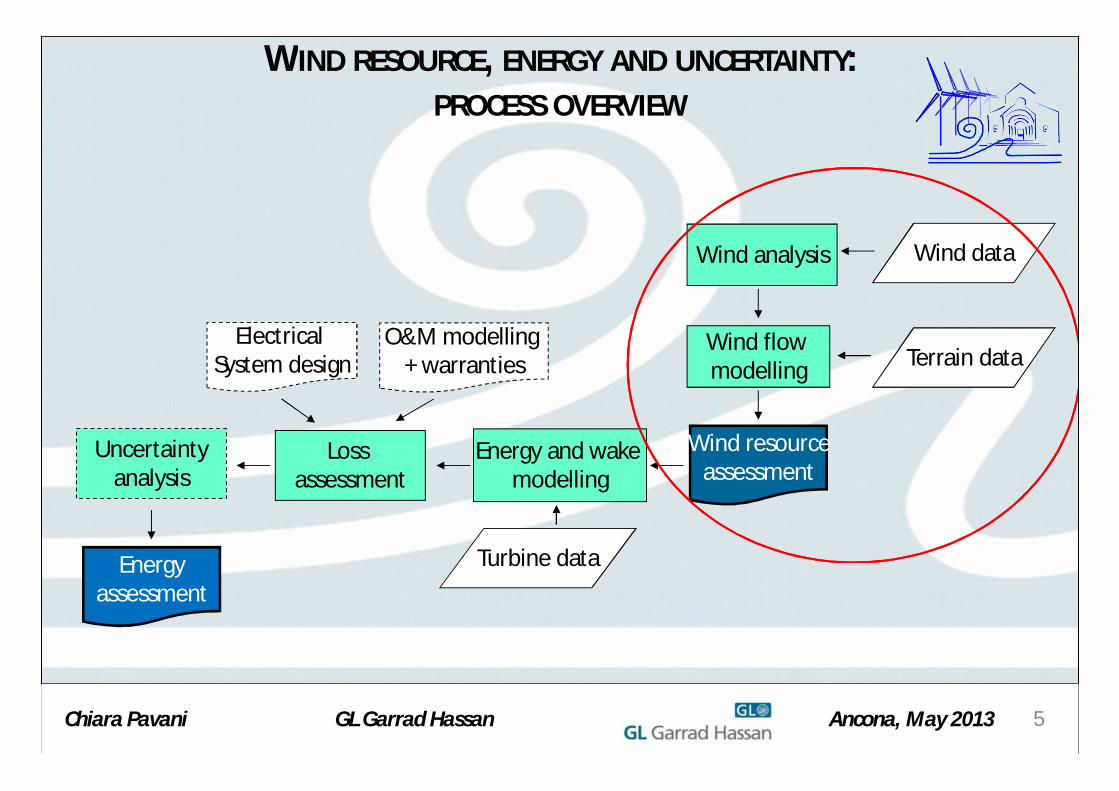
WIND RESOURCE, ENERGY AND UNCERTAINTY:PROCESS OVERVIEW
Wind data
Wind resourceassessment
Wind analysis
Wind flow modelling Terrain data
Energy and wake modelling
Turbine data
Loss assessment
Energyassessment
Uncertaintyanalysis
O&M modelling + warranties
Electrical System design
Chiara Pavani GL Garrad Hassan Ancona, May 2013
6
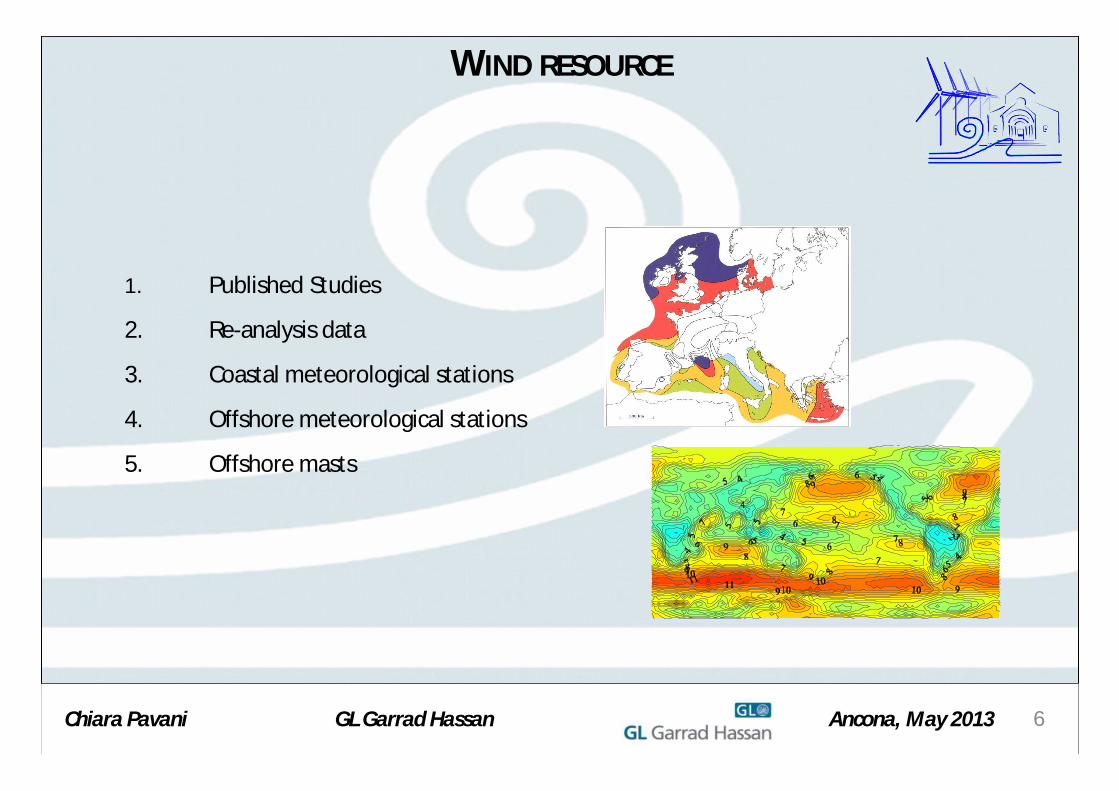
1. Published Studies
2. Re-analysis data
3. Coastal meteorological stations
4. Offshore meteorological stations
5. Offshore masts
WIND RESOURCE
Chiara Pavani GL Garrad Hassan Ancona, May 2013

7
WIND DATA: PUBLISHED STUDIES
1. Risø – European Wind Atlashttp://www.windatlas.dk/europe/oceanmap.html 2. RSE - Interactive Wind Atlashttp://atlanteeolico.rse-web.it/viewer.htm
Quick, cheap and easy Wide spatial coverage
Limited accuracy Low resolution
Chiara Pavani GL Garrad Hassan Ancona, May 2013
8
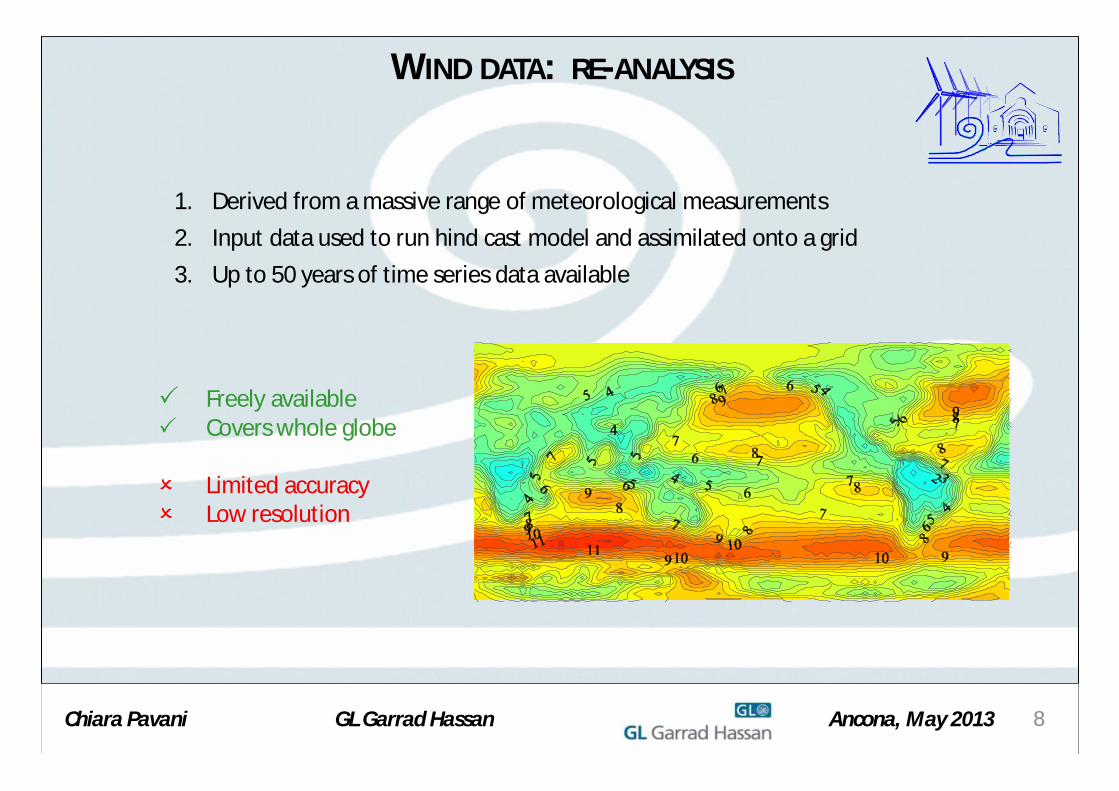
WIND DATA: RE-ANALYSIS
1. Derived from a massive range of meteorological measurements2. Input data used to run hind cast model and assimilated onto a grid3. Up to 50 years of time series data available
Freely available Covers whole globe
Limited accuracy Low resolution
Chiara Pavani GL Garrad Hassan Ancona, May 2013
9
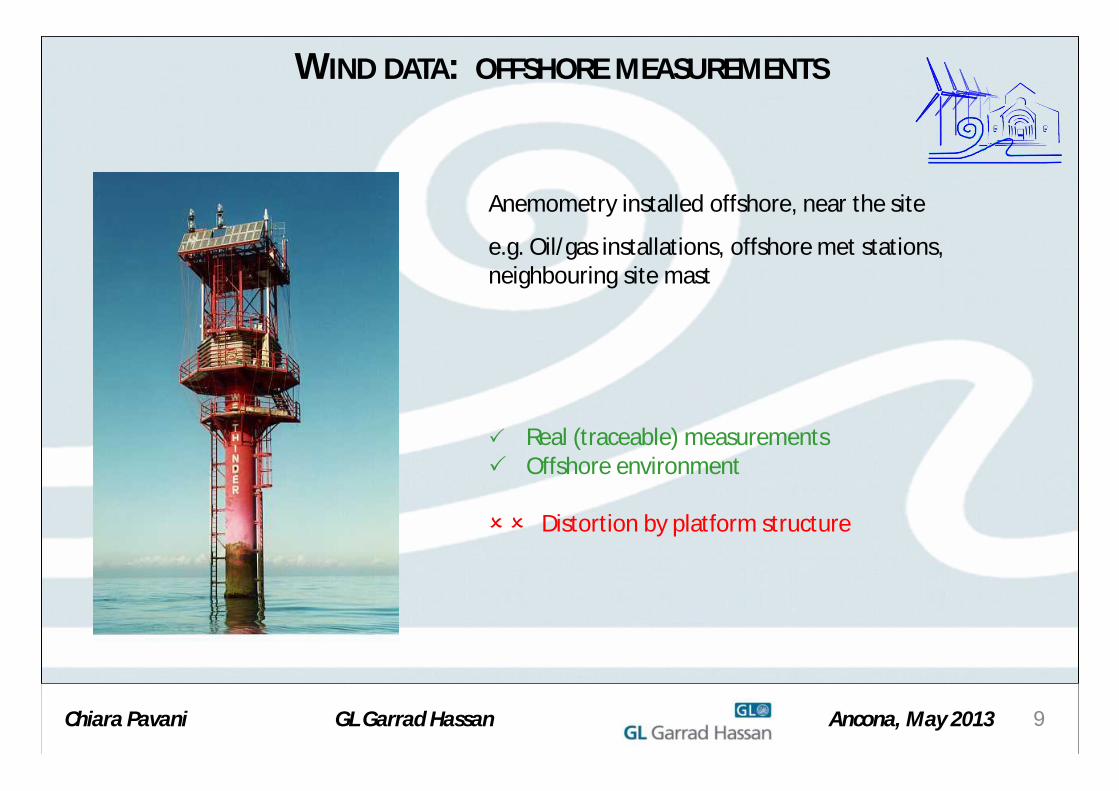
WIND DATA: OFFSHORE MEASUREMENTS
Real (traceable) measurements Offshore environment
Distortion by platform structure
Anemometry installed offshore, near the site
e.g. Oil/gas installations, offshore met stations, neighbouring site mast
Chiara Pavani GL Garrad Hassan Ancona, May 2013
10
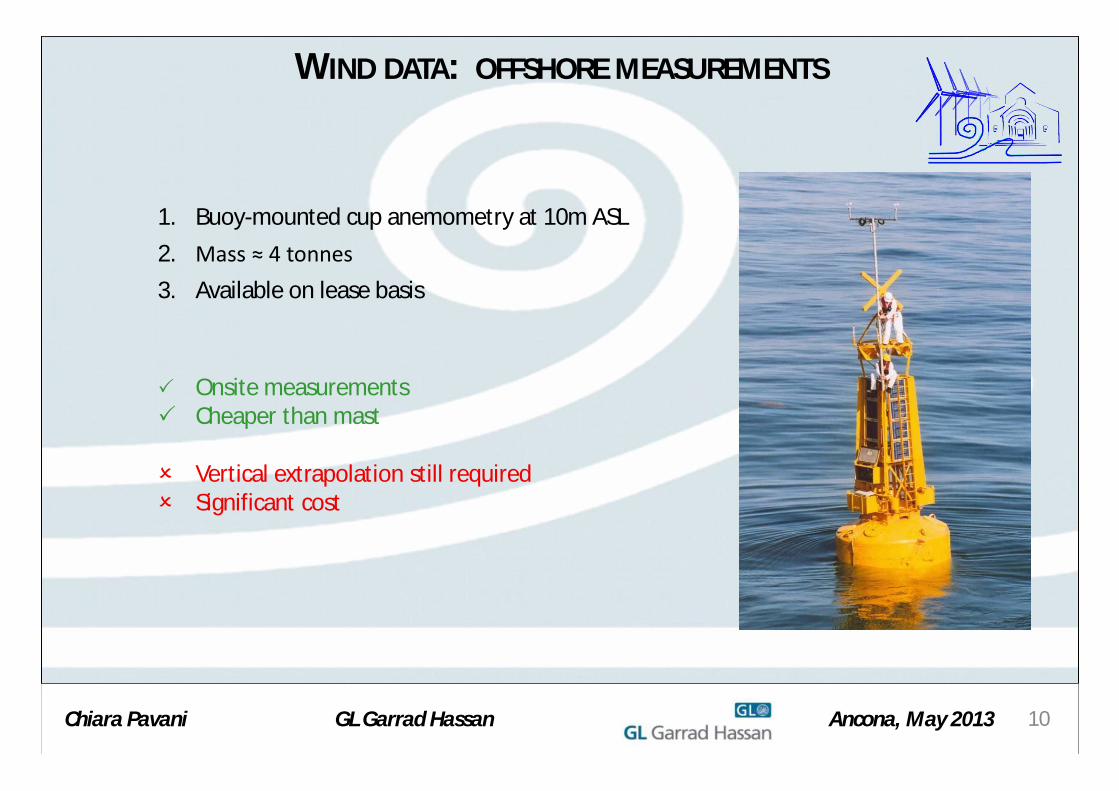
WIND DATA: OFFSHORE MEASUREMENTS
1. Buoy-mounted cup anemometry at 10m ASL 2. Mass ≈ 4 tonnes3. Available on lease basis
Onsite measurements Cheaper than mast
Vertical extrapolation still required Significant cost
Chiara Pavani GL Garrad Hassan Ancona, May 2013

11
WIND DATA: REMOTE SENSING BY LIDAR
Cost (if deployed on existing structure) Measurement of wind shear
Sensitivity to meteorological phenomena High power consumption (~200W) Not industry standard (yet) Validation campaign required Lack of redundancy
1. Measurements at up to 200 m height2. Usually based on fixed platforms; 3. New options for floating LIDAR
+ 10 m
-----------
- 10 mSampled volumesfor a given height.
(Light Detection And Ranging)
Chiara Pavani GL Garrad Hassan Ancona, May 2013
12
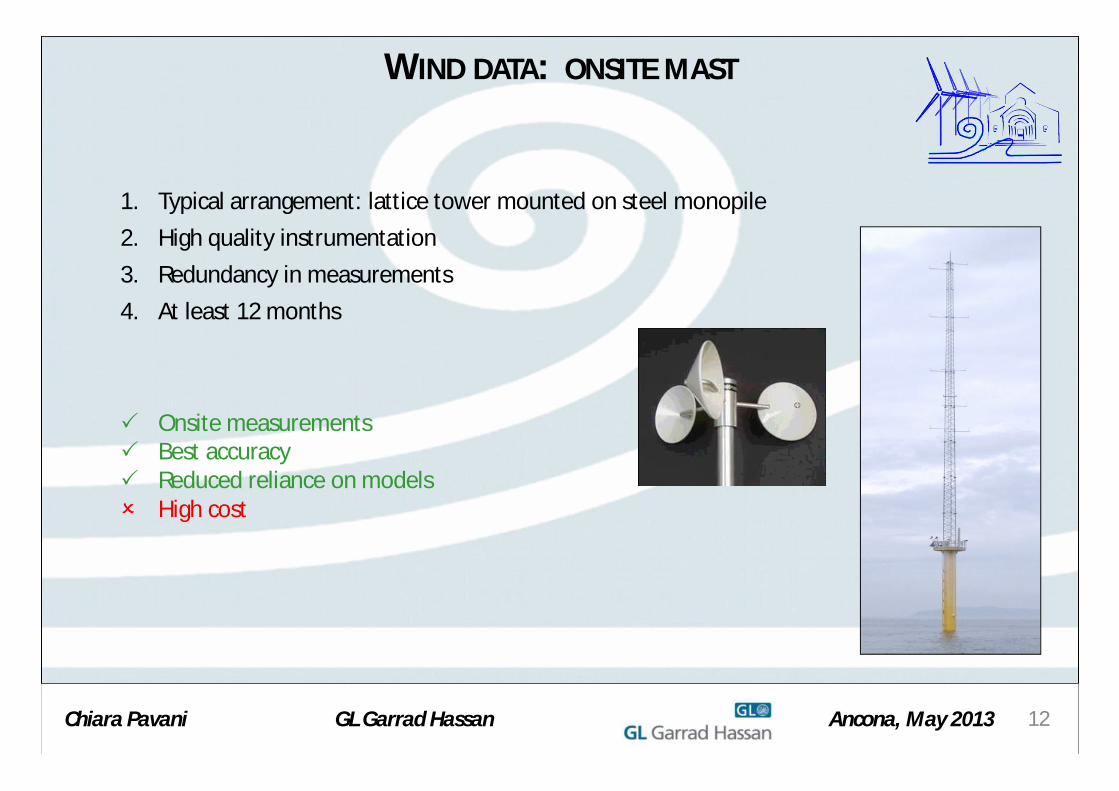
WIND DATA: ONSITE MAST
1. Typical arrangement: lattice tower mounted on steel monopile2. High quality instrumentation3. Redundancy in measurements4. At least 12 months
Onsite measurements Best accuracy Reduced reliance on models High cost
Chiara Pavani GL Garrad Hassan Ancona, May 2013

13
1. Frequency distribution2. Diurnal variation3. Wind rose
1. Compile wind speed / direction statistics
2. Correlate with long term reference data
3. Long term wind regime4. Wind speed and direction
frequency distribution at the mast
WIND MONITORING AND DATA PROCESSING
Chiara Pavani GL Garrad Hassan Ancona, May 2013
14
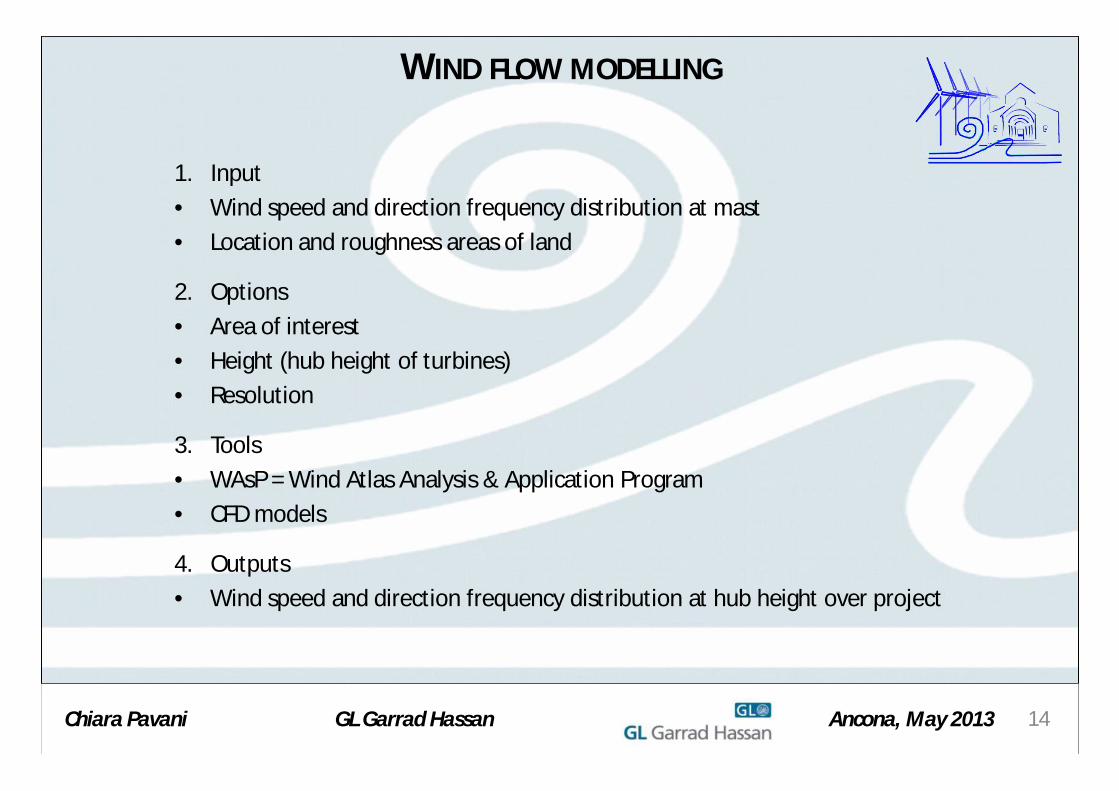
WIND FLOW MODELLING
1. Input• Wind speed and direction frequency distribution at mast• Location and roughness areas of land
2. Options• Area of interest• Height (hub height of turbines)• Resolution
3. Tools• WAsP = Wind Atlas Analysis & Application Program • CFD models
4. Outputs• Wind speed and direction frequency distribution at hub height over project
Chiara Pavani GL Garrad Hassan Ancona, May 2013
15
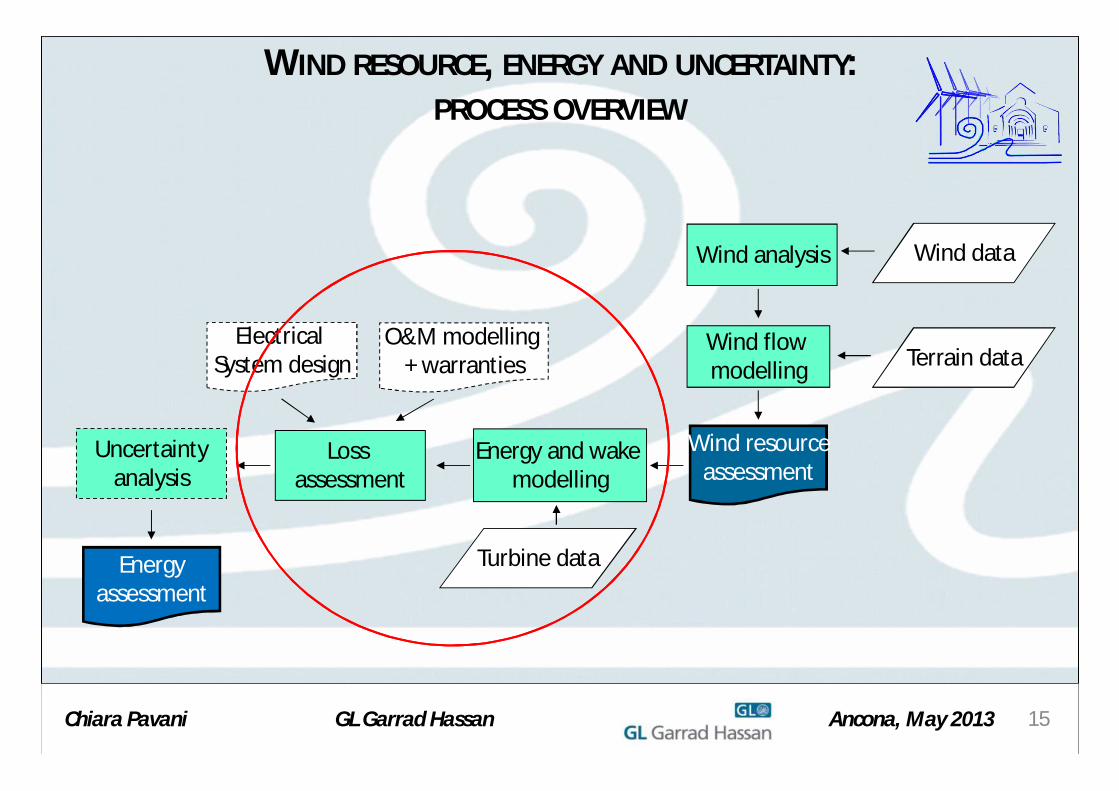
WIND RESOURCE, ENERGY AND UNCERTAINTY: PROCESS OVERVIEW
Wind data
Wind resourceassessment
Wind analysis
Wind flow modelling Terrain data
Energy and wake modelling
Turbine data
Loss assessment
Energyassessment
Uncertaintyanalysis
O&M modelling + warranties
Electrical System design
Chiara Pavani GL Garrad Hassan Ancona, May 2013
16
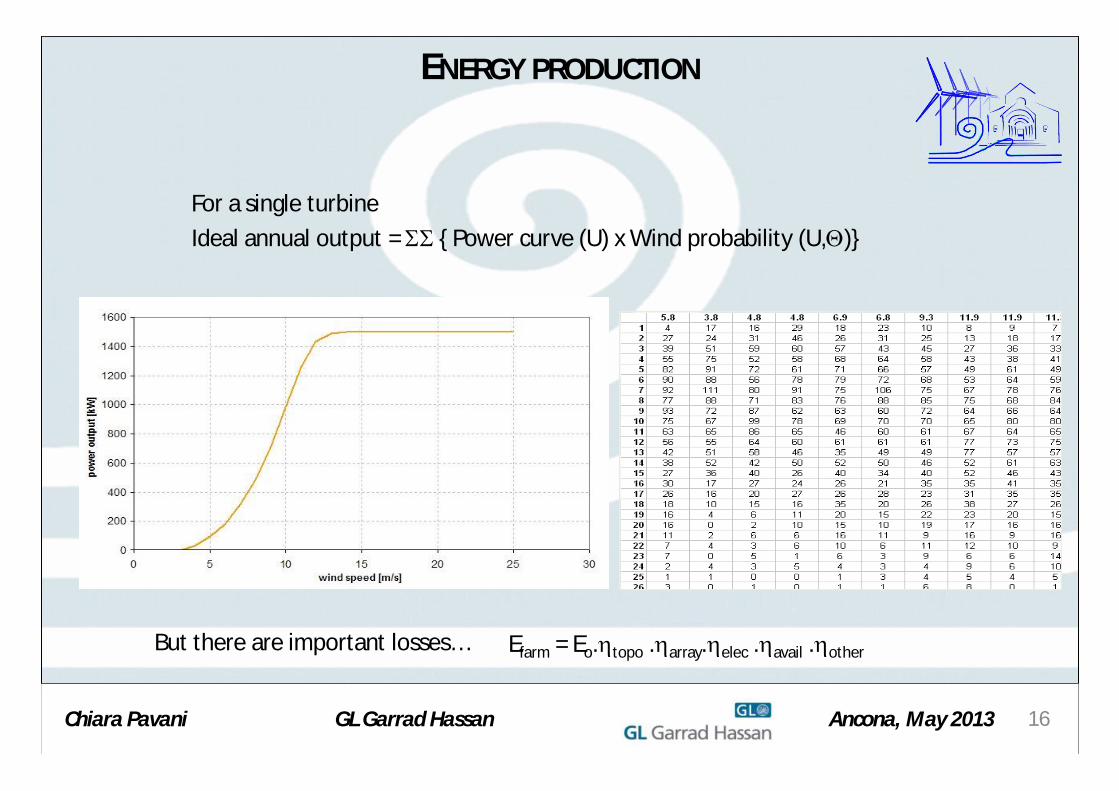
ENERGY PRODUCTION
For a single turbine Ideal annual output = { Power curve (U) x Wind probability (U,)}
But there are important losses… Efarm = Eo.topo .array.elec .avail .other
Chiara Pavani GL Garrad Hassan Ancona, May 2013

17
ENERGY PREDICTION – OVERALL NET YIELD
Major losses to be considered1. Wakes: internal and external2. Electrical system losses3. Availability
And more minor losses1. Environmental2. Utility downtime
Chiara Pavani GL Garrad Hassan Ancona, May 2013
18
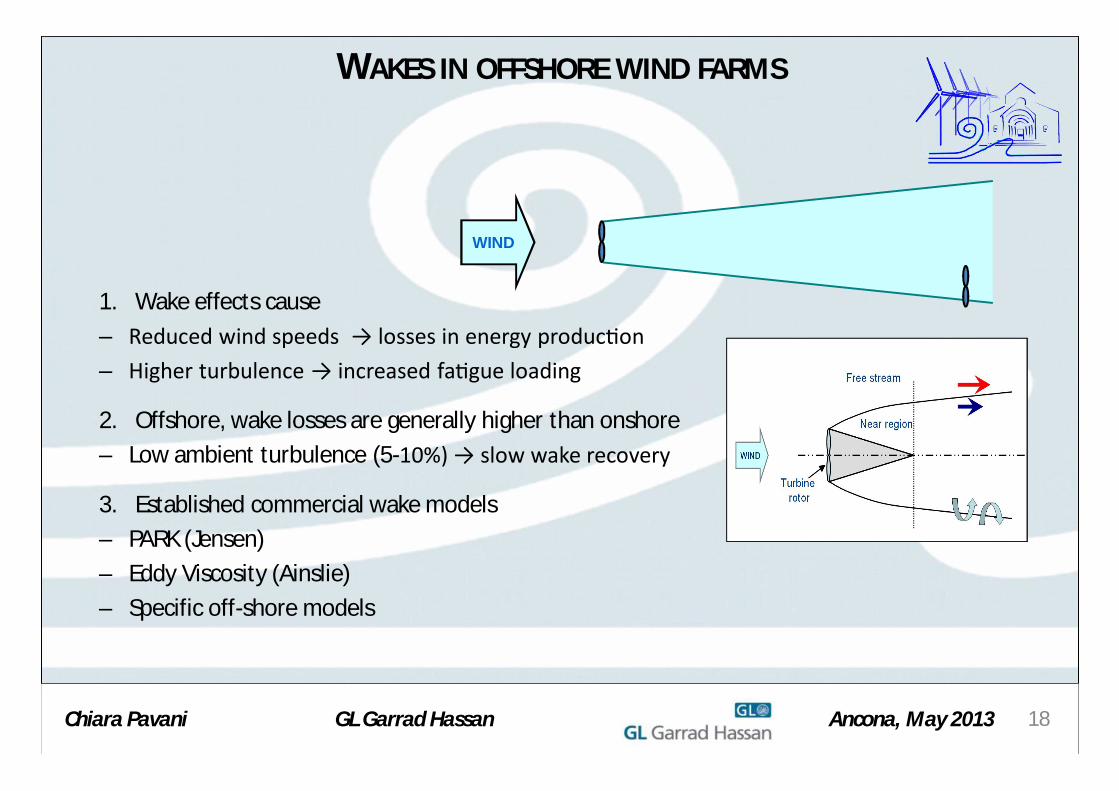
WAKES IN OFFSHORE WIND FARMS
1. Wake effects cause– Reduced wind speeds → losses in energy produc on– Higher turbulence → increased fa gue loading
2. Offshore, wake losses are generally higher than onshore– Low ambient turbulence (5-10%) → slow wake recovery
3. Established commercial wake models – PARK (Jensen) – Eddy Viscosity (Ainslie)– Specific off-shore models
WIND
Chiara Pavani GL Garrad Hassan Ancona, May 2013
19
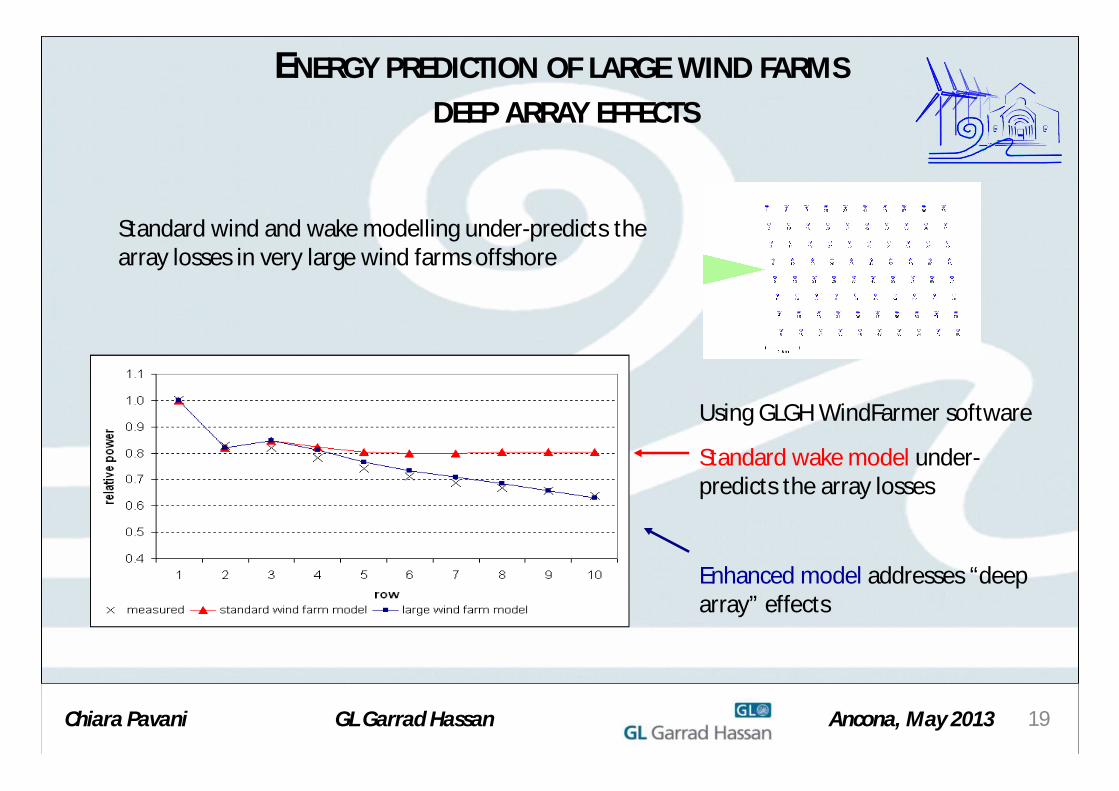
Using GLGH WindFarmer software
Standard wake model under-predicts the array losses
Enhanced model addresses “deep array” effects
ENERGY PREDICTION OF LARGE WIND FARMSDEEP ARRAY EFFECTS
Standard wind and wake modelling under-predicts the array losses in very large wind farms offshore
Chiara Pavani GL Garrad Hassan Ancona, May 2013

20
LAYOUT OPTIMISATION
1. To minimise wake effectsMaximise spacing in dominant wind directionAs large spacing as possible, but
• may have limited sea-space • electrical cabling is more costly
2. Regular arrays favoured initially• Easier to plan• Easier to navigateBut can they give minimum array effects?
3. Typically • 7 D x 5 D in existing wind farms• May see >10 D if more sea-space• Minimum spacing 6 x 4 D (for fatigue reasons)
Chiara Pavani GL Garrad Hassan Ancona, May 2013
21
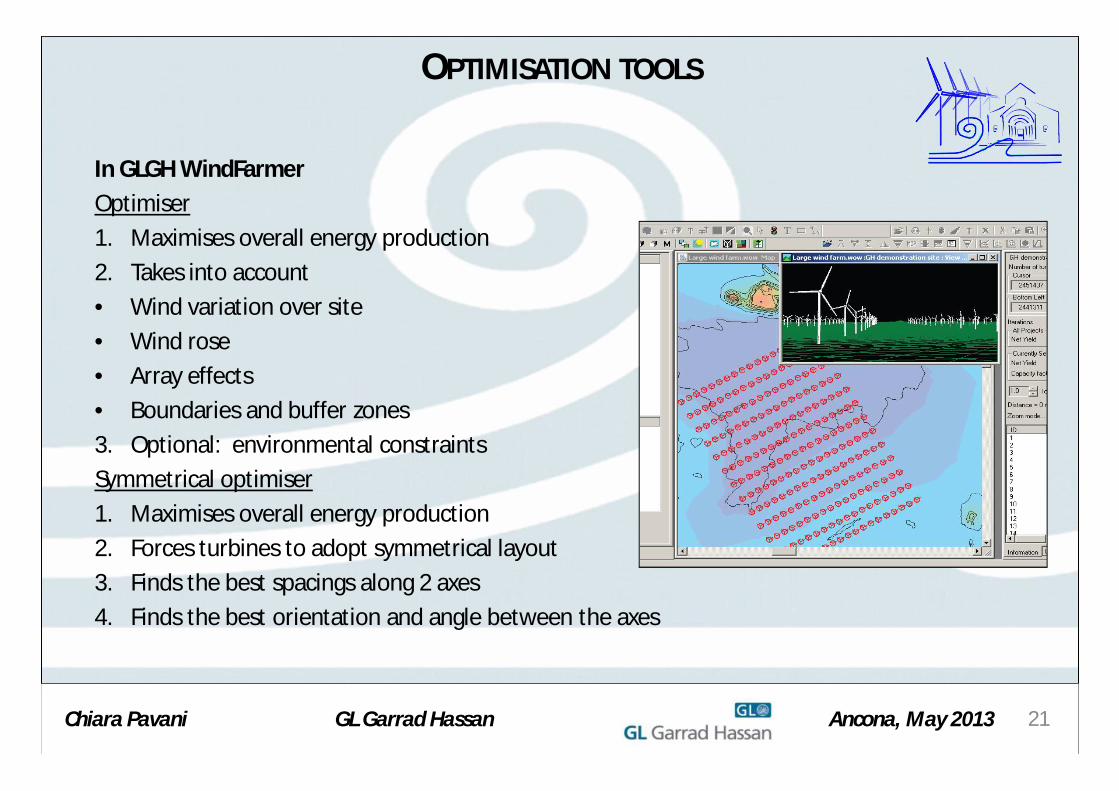
OPTIMISATION TOOLS
In GLGH WindFarmerOptimiser1. Maximises overall energy production2. Takes into account • Wind variation over site• Wind rose• Array effects• Boundaries and buffer zones3. Optional: environmental constraintsSymmetrical optimiser1. Maximises overall energy production2. Forces turbines to adopt symmetrical layout3. Finds the best spacings along 2 axes4. Finds the best orientation and angle between the axes
Chiara Pavani GL Garrad Hassan Ancona, May 2013

22
WIND RESOURCE, ENERGY AND UNCERTAINTY
Wind data
Wind resourceassessment
Wind analysis
Wind flow modelling Terrain data
Energy and wake modelling
Turbine data
Loss assessment
Energyassessment
Uncertaintyanalysis
O&M modelling + warranties
Electrical System design
Chiara Pavani GL Garrad Hassan Ancona, May 2013
23
UNCERTAINTY ANALYSIS
Annual energy production is central estimate
Sources of uncertainty:1. Instrument accuracy;2. Measurement period;3. Wind data correlations;4. Consistency of reference sources;5. Wake modelling.
For some, the uncertainty will be calculated as the standard error, others are estimatedApply energy sensitivity to convert wind speed uncertainties to energy uncertainties
Sources of uncertainty are combined assuming they are independent processesS = SQRT ( A² + B² + C² +…)
Chiara Pavani GL Garrad Hassan Ancona, May 2013

24
OBJECTIVE OF WIND AND ENERGY ASSESSMENTTHROUGHOUT DEVELOPMENT
“ to reduce energy prediction uncertainty… …to an appropriate level at each development stage”
Ene
rgy σ
Chiara Pavani GL Garrad Hassan Ancona, May 2013
25
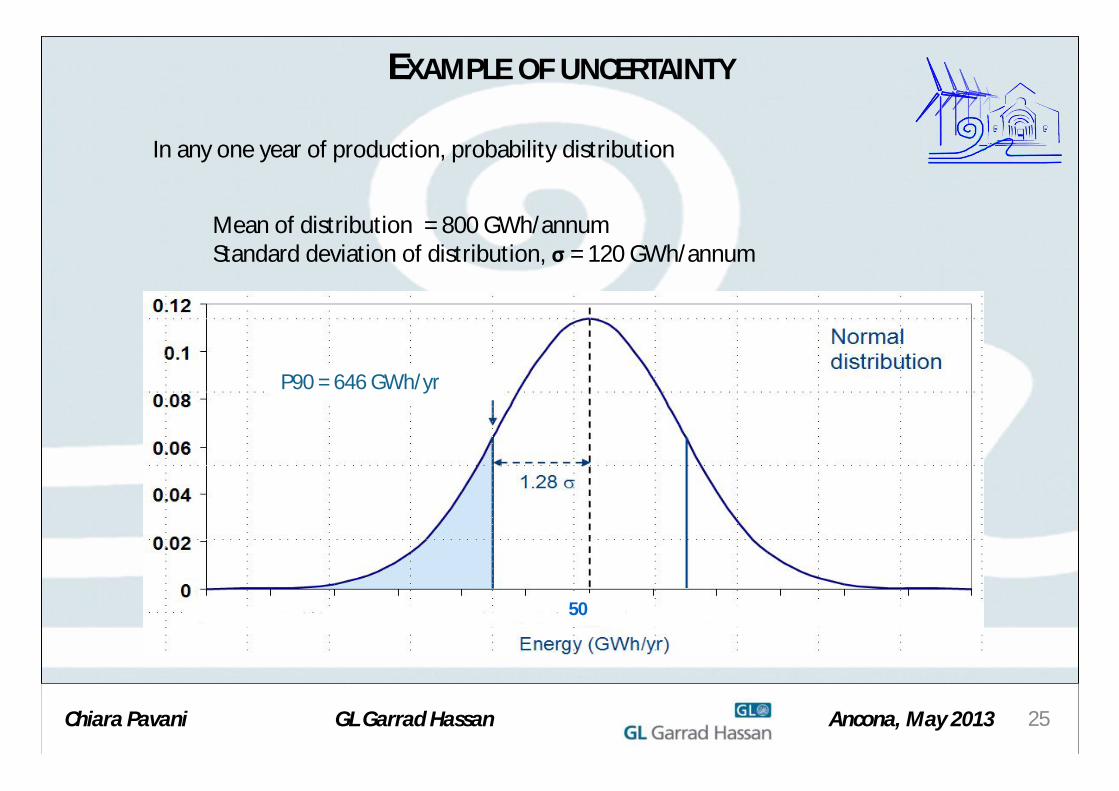
In any one year of production, probability distribution
Mean of distribution = 800 GWh/annumStandard deviation of distribution, σ = 120 GWh/annum
50
P90 = 646 GWh/yr
EXAMPLE OF UNCERTAINTY
Chiara Pavani GL Garrad Hassan Ancona, May 2013

26
Mean of distribution = 800 GWh/annumStandard deviation of distribution, σ = 120 GWh/annum
P50 – Annual net energy production which has a 50% chance of being exceeded
P90 – Annual net energy production which has a 90% change of being exceeded
P90/P50 – Useful normalised value to compare uncertainty of different wind farms
Probability of exceedance, %
A = no. of σ
below central
EnergyGWh/yr
50 0 800.0
75 0.6745 719.0
90 1.2816 646.0
95 1.6449 603.0
EXAMPLE OF CONFIDENCE LIMITS
Chiara Pavani GL Garrad Hassan Ancona, May 2013

27
Maximising the energy yield in the design of the wind farm:
1. Wake analysis;
2. Energy assessment;
3. Large wind farm array effects;
4. Layout optimisation;
Reducing the uncertainties in the energy prediction:
1. Wind measurement - quality monitoring and certified design equipment, best practice guidelines;
2. Long-term data set available;
3. Specific wake modelling.
CONCLUSIONS
Chiara Pavani GL Garrad Hassan Ancona, May 2013