Wind Resource Assessment in the City of N'djamena in Chad
15
INTERNATIONAL JOURNAL of RENEWABLE ENERGY RESEARCH M.A.Abdraman et al., Vol.6, No.3, 2016 Wind Resource Assessment in the City of N'djamena in Chad Mahamat A. Abdraman*, **; Abakar M. Tahir**; Daniel Lissouc*** ; Myrin Y. Kazet * and Ruben M. Mouangue**** ‡ *Department of GEEA, ENSAI, PAI, University of Ngaoundere, Cameroon ** Institut National Supérieur du Sahara et du Sahel d’Iriba, Chad ***Department of Renewable Energy, HTTTC, Kumba, University of Buea, Cameroon ****Department of Energetic Engineering, UIT, University of Ngaoundere, PO BOX. 455 Ngaoundere Cameroon. ([email protected], [email protected], [email protected], [email protected], [email protected]) ‡ Corresponding Author; Ruben M. Mouangue, PO BOX. 455 Ngaoundere Cameroon, Tel: +237 677 46 10 06, Fax: +237 222 25 42 58, [email protected] / [email protected] Received: 11.04.2016 Accepted: 10.06.2016 Abstract: The aim of this study is to evaluate the wind energy potential of the city of N'Djamena, and to evaluate of the annual energy produced at an altitude of 100 m by simulating wind data using the wind speeds data collected at N'Djamena airport’s weather station for a twelve months period. In this perspective, we start with the description of the site through the determination of parameters related to the wind, the mathematical modeling of the frequency distribution of the wind: Weibull distribution and processing and numerical simulation of the actual wind data collected on a selected site of the city of N’Djamena. We then estimate its wind potential, the prediction of the electrical energy prod uction and, determine the direction of the wind on the site. We conduct an analysis of wind turbulence considering different factors such as surrounding obstacles near the measurement tower of the airport in N'Djamena, topography, roughness of the site and choice of wind mill. As a result, the installation of a wind farm of 10 wind mill Vestas V80 / 1.8 MW at 100 meters would produce 50,420 MWh of energy. Keywords: Wind energy - energy transformation – Wasp - simulation –N’Djamena. 1. Introduction The negative effects of fossil fuels on the environment have led scientists to consider the possibility of using renewable energy to generate electricity. Among the many clean or green power resources, there is wind power, which has experienced very rapid growth over the past two decades. Indeed, major technological advances have been made, which has reduced the cost of producing wind- generated electricity. Today, the share of renewable energy accounts for only about 20.2% of global electricity production [1]. Because of the pollution and the production of greenhouse gases generated by the use of fossil fuel, wind power, which is a reliable and promising renewable energy, has been growing interest due to its almost inexhaustible and non-polluting characteristics [2, 3]. The conversion of wind energy for electricity generation or pumping could thus help to reduce a number of problems of African people. The main objective of this article is to assess the wind resource available in the city of Ndjamena as to contribute to the development of the exploitation of domestic energy resources offered by the wind potential of the Chad. The present manuscript is organized as follow: in the first time, the description of the study area is present; after the material and methods used are showed; then the results are
Transcript of Wind Resource Assessment in the City of N'djamena in Chad
INTERNATIONAL JOURNAL of RENEWABLE ENERGY RESEARCH M.A.Abdraman et al., Vol.6, No.3, 2016
Wind Resource Assessment in the City of
N'djamena in Chad
Mahamat A. Abdraman*, **; Abakar M. Tahir**; Daniel Lissouc*** ; Myrin Y. Kazet* and Ruben M.
Mouangue****‡
*Department of GEEA, ENSAI, PAI, University of Ngaoundere, Cameroon
** Institut National Supérieur du Sahara et du Sahel d’Iriba, Chad
***Department of Renewable Energy, HTTTC, Kumba, University of Buea, Cameroon
****Department of Energetic Engineering, UIT, University of Ngaoundere, PO BOX. 455 Ngaoundere Cameroon.
([email protected], [email protected], [email protected], [email protected], [email protected])
‡ Corresponding Author; Ruben M. Mouangue, PO BOX. 455 Ngaoundere Cameroon, Tel: +237 677 46 10 06,
Fax: +237 222 25 42 58, [email protected] / [email protected]
Received: 11.04.2016 Accepted: 10.06.2016
Abstract: The aim of this study is to evaluate the wind energy potential of the city of N'Djamena, and to evaluate of the annual
energy produced at an altitude of 100 m by simulating wind data using the wind speeds data collected at N'Djamena airport’s
weather station for a twelve months period. In this perspective, we start with the description of the site through the
determination of parameters related to the wind, the mathematical modeling of the frequency distribution of the wind: Weibull
distribution and processing and numerical simulation of the actual wind data collected on a selected site of the city of
N’Djamena. We then estimate its wind potential, the prediction of the electrical energy production and, determine the direction
of the wind on the site. We conduct an analysis of wind turbulence considering different factors such as surrounding obstacles
near the measurement tower of the airport in N'Djamena, topography, roughness of the site and choice of wind mill. As a
result, the installation of a wind farm of 10 wind mill Vestas V80 / 1.8 MW at 100 meters would produce 50,420 MWh of
energy.
Keywords: Wind energy - energy transformation – Wasp - simulation –N’Djamena.
1. Introduction
The negative effects of fossil fuels on the environment
have led scientists to consider the possibility of using
renewable energy to generate electricity. Among the many
clean or green power resources, there is wind power,
which has experienced very rapid growth over the past two
decades. Indeed, major technological advances have been
made, which has reduced the cost of producing wind-
generated electricity. Today, the share of renewable energy
accounts for only about 20.2% of global electricity
production [1].
Because of the pollution and the production of greenhouse
gases generated by the use of fossil fuel, wind power,
which is a reliable and promising renewable energy, has
been growing interest due to its almost inexhaustible and
non-polluting characteristics [2, 3]. The conversion of
wind energy for electricity generation or pumping could
thus help to reduce a number of problems of African
people.
The main objective of this article is to assess the wind
resource available in the city of Ndjamena as to contribute
to the development of the exploitation of domestic energy
resources offered by the wind potential of the Chad.
The present manuscript is organized as follow: in the first
time, the description of the study area is present; after the
material and methods used are showed; then the results are
INTERNATIONAL JOURNAL of RENEWABLE ENERGY RESEARCH M.A.Abdraman et al., Vol.6, No.3, 2016
1023
presented; finally the last section summarizes work and
gives perspectives for future continuation.
2. Description of the Town of N’Djamena with
Geographical Data
N'Djamena is the capital city of the Republic of Chad,
situated at an elevation of 297 m above the sea, in the
Central West region of the country, at the confluence of
Chari and Logone rivers. Located on the right bank of
Char river. The town is connected to the left bank of the
Chari by two bridges: a single track bridge (the Chagoua
bridge), and a double-track bridge (the Taiwan bridge).
Cameroonian town of Kousseri is located about 10 km
from N'Djamena, on the left bank of Logone river, which
marks the border and is accessible by the Ngueli bridge.
The weather station is located at the airport Ndjamena and
its measuring mast for wind data has the following
geographical coordinates: longitude 15 ° 12 ° latitude and
01'48.49''E 07'36.24N.
Fig. 1. Measuring mast for wind data at n’djamena airport
3. Material and Methods
3.1. Material
3.1.1. Golden software
Golden Software is a specialized tool for the development
of the topographic map. It embeds a grid-based mapping
program which interpolates irregularly spaced XYZ data
into a regularly spaced grid. The resolution of our map is
200 m, resulting in 4500 data points processed with the
databases in Excel software. The grid is used to produce
different types of maps including cutting, vector, image,
shaded relief, 3D surface and wireframe 3D charts.
Generally, gridding and mapping options are available and
can produce the maps that best fit our data.
3.1.2. Wasp
WAsP (Wind Atlas Analysis and Application Program) is
a digital tool developed in 1987 by the Atmospheric
Physics Department of the Danish RISO National
Laboratory. This computer code benefits of a positive
feedback from users; it is the reference software of the
wind industry for the analysis of wind resources, the
establishment of wind atlas, and the choice of installing
wind turbines on a site. WAsP was used to create our
different entry files.
3.2. Mathematical modeling
3.2.1. Modeling of the distribution of frequencies of the
wind
3.2.1.1. The Weibull Distribution
The Weibull distribution is a special case of the Pearson
distribution [4]. In this distribution, variations in wind
speed are characterized by two features: the probability
density function and the cumulative distribution function.
The probability density function f(v) indicates the fraction
of time (or probability) for which the wind has given
velocity v.
(1)
With K the form factor (without unit) and C the scale
factor (m/s). The cumulative distribution function of the
velocity v or Weibull cumulative distribution function F
(v) gives the fraction of time (or the probability) for which
the wind speed is less than or equal to v.
INTERNATIONAL JOURNAL of RENEWABLE ENERGY RESEARCH M.A.Abdraman et al., Vol.6, No.3, 2016
1024
(2)
The average wind speed according to the Weibull
distribution is calculated by the following formula:
(3)
The distribution of Weibull proves to be suitable for the
description of the statistical properties of the wind [5, 6,
7].
3.2.1.2. Estimates of Weibull parameters
There are several methods for determining the parameters
K and C from the wind data of a site. The most common
are: the graphic method, method of moment, maximum
likelihood method, the modified maximum likelihood
method and the standard deviation method [4, 8, 7]. Since
wind data are available in the format of frequency
distribution, the recommended method is the modified
maximum likelihood method [7]. Weibull parameters are
determined using equations (4) and (5):
(4)
(5)
Where Vi is the midpoint of the interval of speeds i, n the
number of intervals, f (Vi) the frequency for which the
wind speed falls in the interval i, F (v = 0) the probability
that the wind speed is greater than or equal to zero.
Equation (4) is solved numerically by successive iterations
until the convergence of the value of K using a code
written in FORTRAN 90. The computations are initialized
with K = 2. After convergence, equation (5) is then
explicitly resolved using the value of K to find that of C.
3.2.2. Modeling of an obstacle
Near an obstacle, such as a building, the wind is strongly
influenced. The mast of the anemometer to the airport is
surrounded by buildings and trees, which influences the
data-gathering. The exploitation of those requires taking
into account the various obstacles of the site.
We model the obstacle as follows:
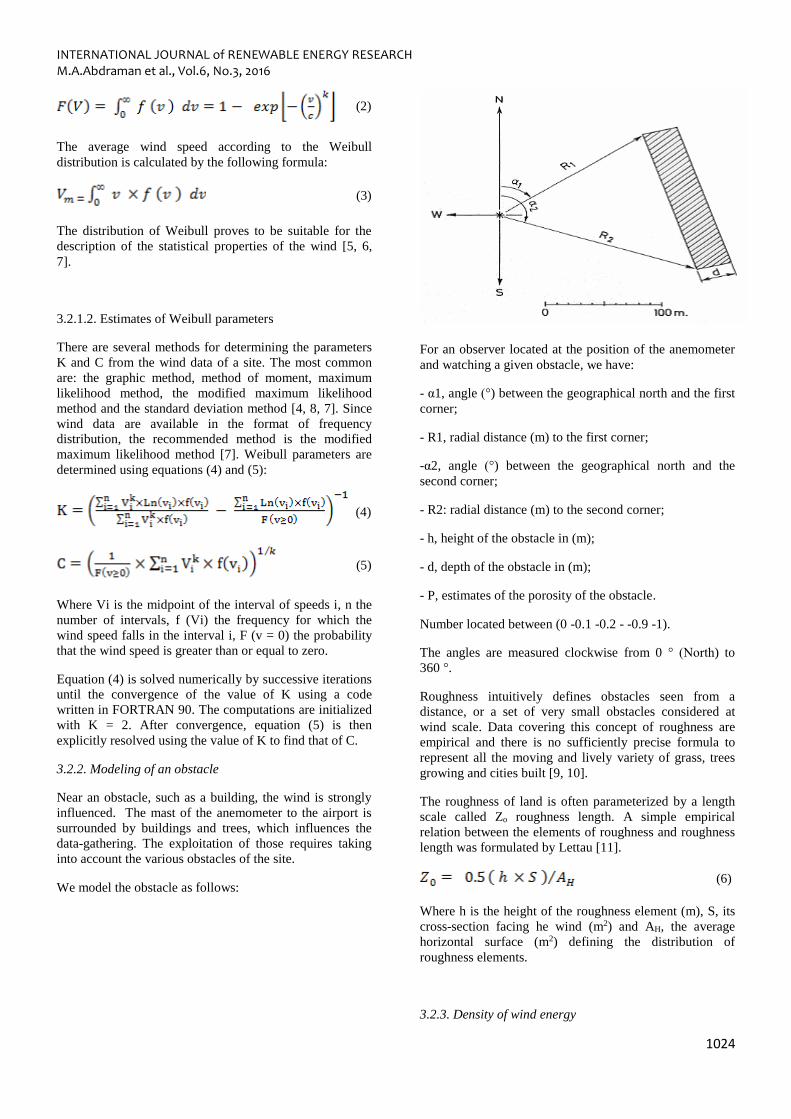
For an observer located at the position of the anemometer
and watching a given obstacle, we have:
- α1, angle (°) between the geographical north and the first
corner;
- R1, radial distance (m) to the first corner;
-α2, angle (°) between the geographical north and the
second corner;
- R2: radial distance (m) to the second corner;
- h, height of the obstacle in (m);
- d, depth of the obstacle in (m);
- P, estimates of the porosity of the obstacle.
Number located between (0 -0.1 -0.2 - -0.9 -1).
The angles are measured clockwise from 0 ° (North) to
360 °.
Roughness intuitively defines obstacles seen from a
distance, or a set of very small obstacles considered at
wind scale. Data covering this concept of roughness are
empirical and there is no sufficiently precise formula to
represent all the moving and lively variety of grass, trees
growing and cities built [9, 10].
The roughness of land is often parameterized by a length
scale called Zo roughness length. A simple empirical
relation between the elements of roughness and roughness
length was formulated by Lettau [11].
(6)
Where h is the height of the roughness element (m), S, its
cross-section facing he wind (m2) and AH, the average
horizontal surface (m2) defining the distribution of
roughness elements.
3.2.3. Density of wind energy
INTERNATIONAL JOURNAL of RENEWABLE ENERGY RESEARCH M.A.Abdraman et al., Vol.6, No.3, 2016
1025
The available power in a wind flow of velocity v is
obtained from the relation:
(7)
Where ρ is the air density (kg/m3), and A, the scanned
surface (m2) of the blade of the wind turbine. Expressing
this power per area unit, we have:
(8)
The time fraction for which this velocity v prevailing in
the system is given by the probability distribution function
f (v). Thus, the energy contributed by v, per time unit and
per area unit, is P(v) × f (v). So the total energy contributed
by all possible speeds in the wind regime, available by
area unit and time unit (Energy Density ED) can be
expressed as follows [4, 12, 13]:
(9)
3.2.4. Statistical data processing
a- Calculating the arithmetic velocity mean
(10)
b- Calculating arithmetic weighted velocity mean
(11)
c- Calculating of the average power per area
unit (energy density)
(12)
4. Results of Numerical Simulation
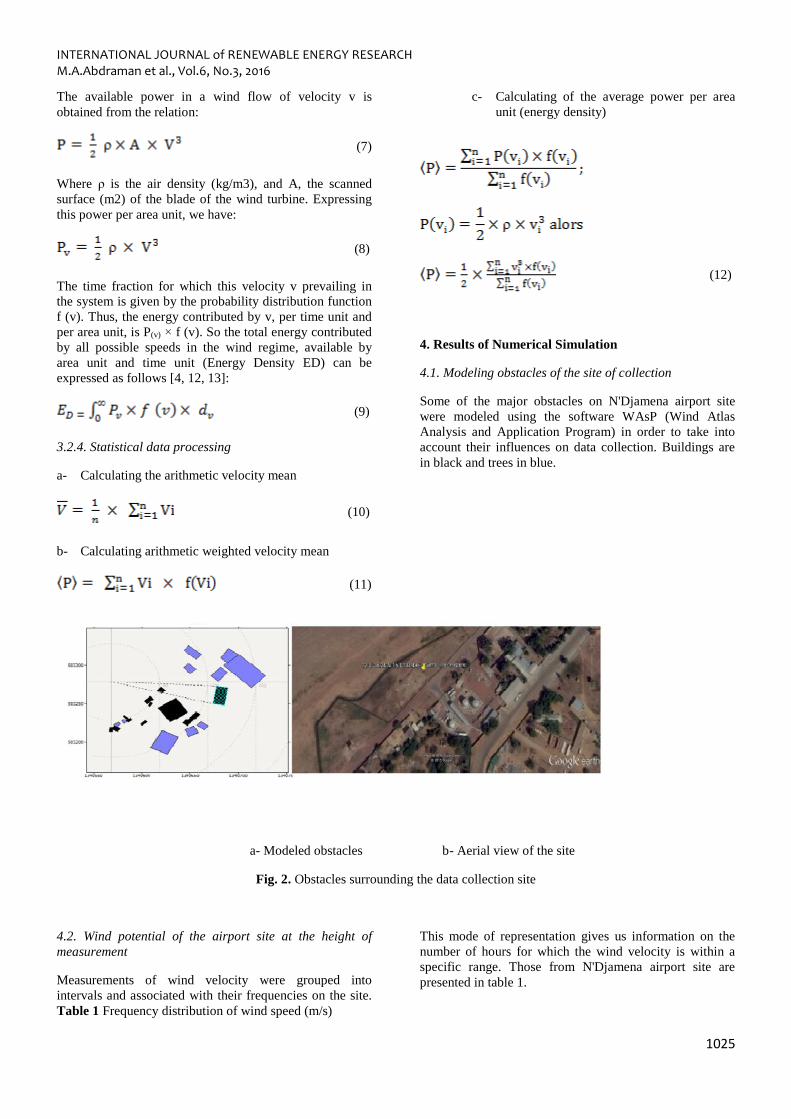
4.1. Modeling obstacles of the site of collection
Some of the major obstacles on N'Djamena airport site
were modeled using the software WAsP (Wind Atlas
Analysis and Application Program) in order to take into
account their influences on data collection. Buildings are
in black and trees in blue.
a- Modeled obstacles b- Aerial view of the site
Fig. 2. Obstacles surrounding the data collection site
4.2. Wind potential of the airport site at the height of
measurement
Measurements of wind velocity were grouped into
intervals and associated with their frequencies on the site.
This mode of representation gives us information on the
number of hours for which the wind velocity is within a
specific range. Those from N'Djamena airport site are
presented in table 1.
Table 1 Frequency distribution of wind speed (m/s)
INTERNATIONAL JOURNAL of RENEWABLE ENERGY RESEARCH M.A.Abdraman et al., Vol.6, No.3, 2016
1026
Speeds 0-1 1-2 2-3 3-4 4-5 5-6 6-7 7-8 8-9 9-10
Frequencies 6.7 13.5 21.2 19.7 13.1 9.4 6.3 3.9 2.4 1.4
Speeds 10-11 11-12 12-13 13-14 14-15 - - - - -
Frequencies 0.9 0.6 0.5 0.3 0.1
Weibull parameters for this distribution are: C = 4.2 m / s
and K = 1.44. The wind rose shows the distribution of
recorded wind directions on the site. It allows us to know
the prevailing wind direction. The atmospheric circulation
at ground level is mainly driven by the North East wind
direction.
Frequency analysis of the wind speed highlights the
predominant speed classes. Therefore, and according to the
characteristics of the wind turbines on the market, one can
select those that provide the best performance. We group
the distribution of wind speed by classes, the frequency
being expressed directly in percentage; it allows us to
know the probability that a speed value is not exceeded.
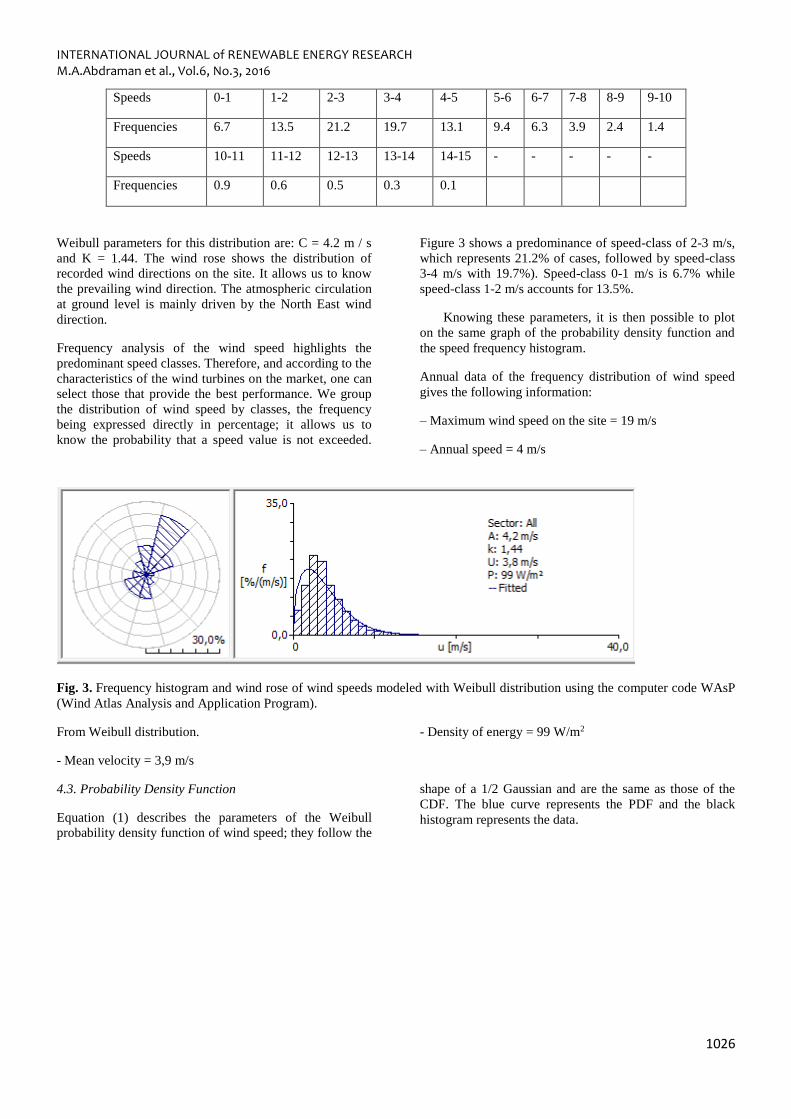
Figure 3 shows a predominance of speed-class of 2-3 m/s,
which represents 21.2% of cases, followed by speed-class
3-4 m/s with 19.7%). Speed-class 0-1 m/s is 6.7% while
speed-class 1-2 m/s accounts for 13.5%.
Knowing these parameters, it is then possible to plot
on the same graph of the probability density function and
the speed frequency histogram.
Annual data of the frequency distribution of wind speed
gives the following information:
– Maximum wind speed on the site = 19 m/s
– Annual speed = 4 m/s
Fig. 3. Frequency histogram and wind rose of wind speeds modeled with Weibull distribution using the computer code WAsP
(Wind Atlas Analysis and Application Program).
From Weibull distribution.
- Mean velocity = 3,9 m/s
- Density of energy = 99 W/m2
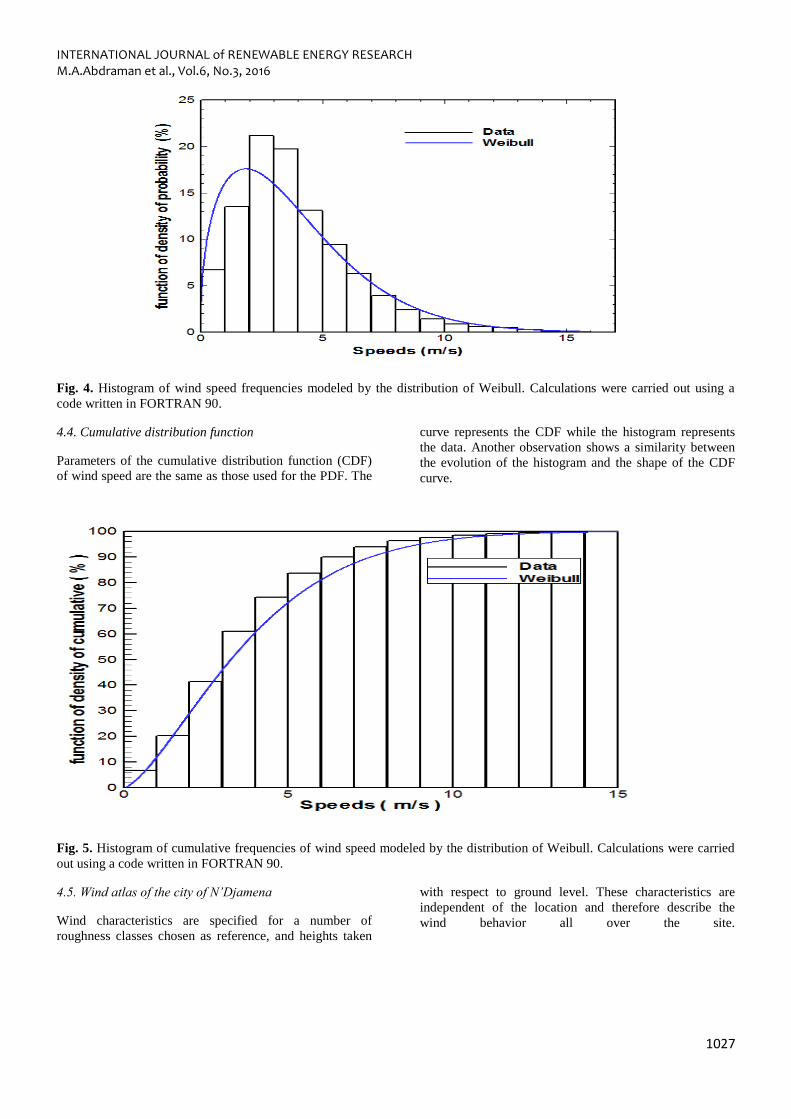
4.3. Probability Density Function
Equation (1) describes the parameters of the Weibull
probability density function of wind speed; they follow the
shape of a 1/2 Gaussian and are the same as those of the
CDF. The blue curve represents the PDF and the black
histogram represents the data.
INTERNATIONAL JOURNAL of RENEWABLE ENERGY RESEARCH M.A.Abdraman et al., Vol.6, No.3, 2016
1027
Fig. 4. Histogram of wind speed frequencies modeled by the distribution of Weibull. Calculations were carried out using a
code written in FORTRAN 90.
4.4. Cumulative distribution function
Parameters of the cumulative distribution function (CDF)
of wind speed are the same as those used for the PDF. The
curve represents the CDF while the histogram represents
the data. Another observation shows a similarity between
the evolution of the histogram and the shape of the CDF
curve.
Fig. 5. Histogram of cumulative frequencies of wind speed modeled by the distribution of Weibull. Calculations were carried
out using a code written in FORTRAN 90.
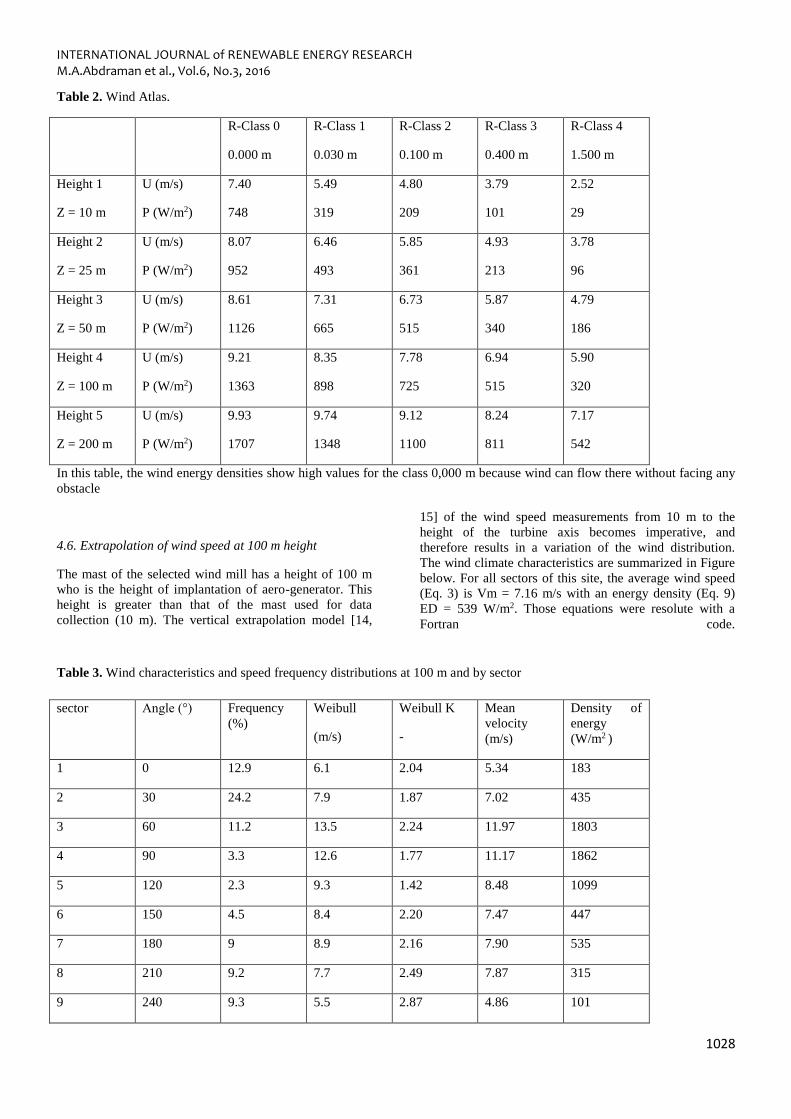
4.5. Wind atlas of the city of N’Djamena
Wind characteristics are specified for a number of
roughness classes chosen as reference, and heights taken
with respect to ground level. These characteristics are
independent of the location and therefore describe the
wind behavior all over the site.
INTERNATIONAL JOURNAL of RENEWABLE ENERGY RESEARCH M.A.Abdraman et al., Vol.6, No.3, 2016
1028
Table 2. Wind Atlas.
R-Class 0
0.000 m
R-Class 1
0.030 m
R-Class 2
0.100 m
R-Class 3
0.400 m
R-Class 4
1.500 m
Height 1
Z = 10 m
U (m/s)
P (W/m2)
7.40
748
5.49
319
4.80
209
3.79
101
2.52
29
Height 2
Z = 25 m
U (m/s)
P (W/m2)
8.07
952
6.46
493
5.85
361
4.93
213
3.78
96
Height 3
Z = 50 m
U (m/s)
P (W/m2)
8.61
1126
7.31
665
6.73
515
5.87
340
4.79
186
Height 4
Z = 100 m
U (m/s)
P (W/m2)
9.21
1363
8.35
898
7.78
725
6.94
515
5.90
320
Height 5
Z = 200 m
U (m/s)
P (W/m2)
9.93
1707
9.74
1348
9.12
1100
8.24
811
7.17
542
In this table, the wind energy densities show high values for the class 0,000 m because wind can flow there without facing any
obstacle
4.6. Extrapolation of wind speed at 100 m height
The mast of the selected wind mill has a height of 100 m
who is the height of implantation of aero-generator. This
height is greater than that of the mast used for data
collection (10 m). The vertical extrapolation model [14,
15] of the wind speed measurements from 10 m to the
height of the turbine axis becomes imperative, and
therefore results in a variation of the wind distribution.
The wind climate characteristics are summarized in Figure
below. For all sectors of this site, the average wind speed
(Eq. 3) is Vm = 7.16 m/s with an energy density (Eq. 9)
ED = 539 W/m2. Those equations were resolute with a
Fortran code.
Table 3. Wind characteristics and speed frequency distributions at 100 m and by sector
sector Angle (°) Frequency
(%)
Weibull
(m/s)
Weibull K
-
Mean
velocity
(m/s)
Density of
energy
(W/m2 )
1 0 12.9 6.1 2.04 5.34 183
2 30 24.2 7.9 1.87 7.02 435
3 60 11.2 13.5 2.24 11.97 1803
4 90 3.3 12.6 1.77 11.17 1862
5 120 2.3 9.3 1.42 8.48 1099
6 150 4.5 8.4 2.20 7.47 447
7 180 9 8.9 2.16 7.90 535
8 210 9.2 7.7 2.49 7.87 315
9 240 9.3 5.5 2.87 4.86 101
INTERNATIONAL JOURNAL of RENEWABLE ENERGY RESEARCH M.A.Abdraman et al., Vol.6, No.3, 2016
1029
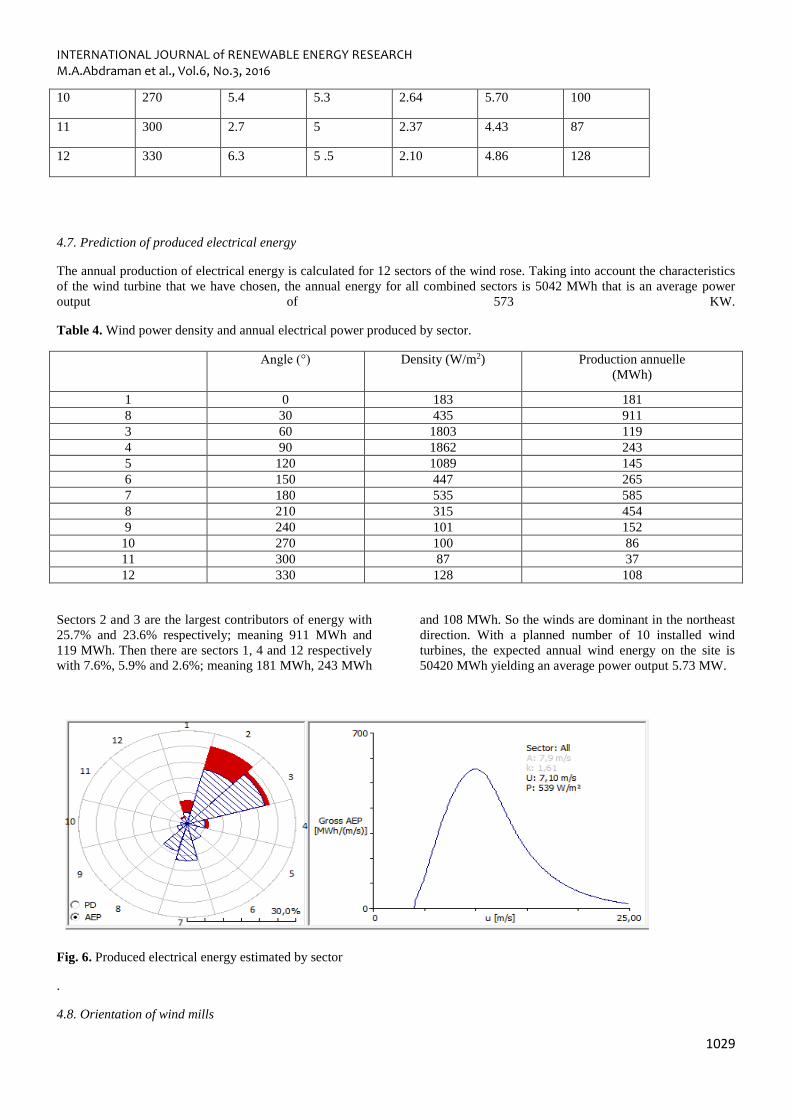
4.7. Prediction of produced electrical energy
The annual production of electrical energy is calculated for 12 sectors of the wind rose. Taking into account the characteristics
of the wind turbine that we have chosen, the annual energy for all combined sectors is 5042 MWh that is an average power
output of 573 KW.
Table 4. Wind power density and annual electrical power produced by sector.
Angle (°) Density (W/m2) Production annuelle
(MWh)
1 0 183 181
8 30 435 911
3 60 1803 119
4 90 1862 243
5 120 1089 145
6 150 447 265
7 180 535 585
8 210 315 454
9 240 101 152
10 270 100 86
11 300 87 37
12 330 128 108
Sectors 2 and 3 are the largest contributors of energy with
25.7% and 23.6% respectively; meaning 911 MWh and
119 MWh. Then there are sectors 1, 4 and 12 respectively
with 7.6%, 5.9% and 2.6%; meaning 181 MWh, 243 MWh
and 108 MWh. So the winds are dominant in the northeast
direction. With a planned number of 10 installed wind
turbines, the expected annual wind energy on the site is
50420 MWh yielding an average power output 5.73 MW.
Fig. 6. Produced electrical energy estimated by sector
.
4.8. Orientation of wind mills
10 270 5.4 5.3 2.64 5.70 100
11 300 2.7 5 2.37 4.43 87
12 330 6.3 5 .5 2.10 4.86 128
INTERNATIONAL JOURNAL of RENEWABLE ENERGY RESEARCH M.A.Abdraman et al., Vol.6, No.3, 2016
1030
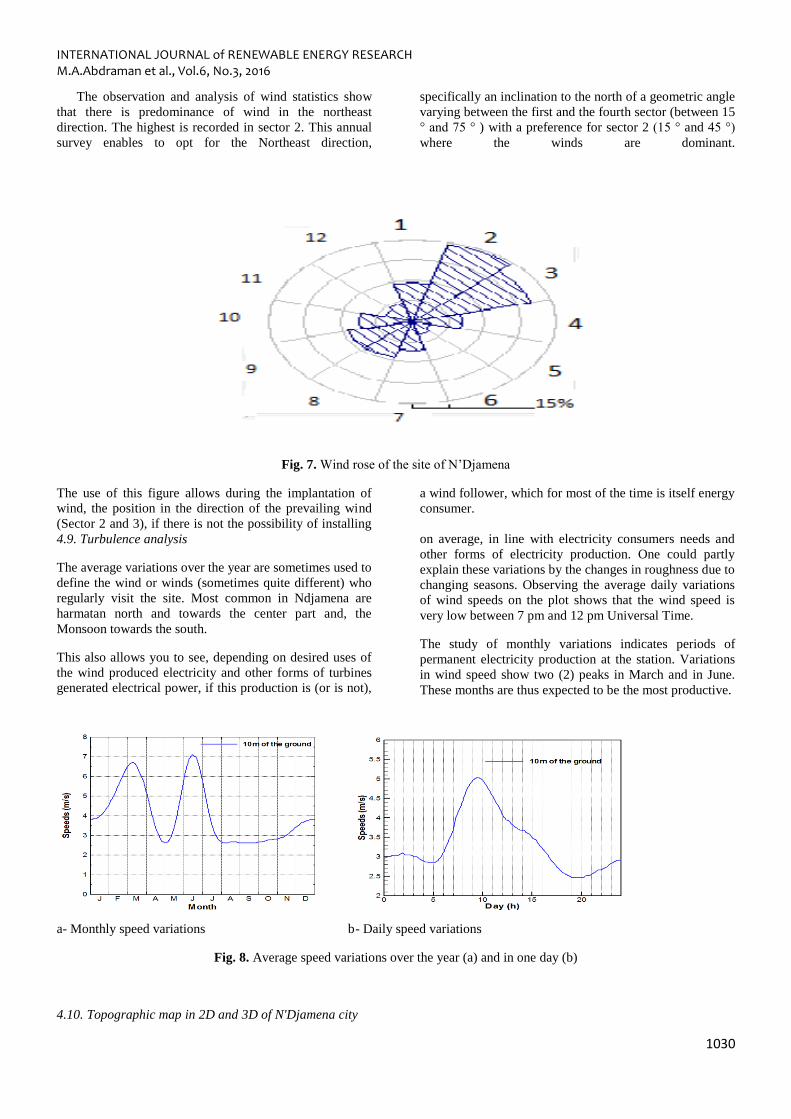
The observation and analysis of wind statistics show
that there is predominance of wind in the northeast
direction. The highest is recorded in sector 2. This annual
survey enables to opt for the Northeast direction,
specifically an inclination to the north of a geometric angle
varying between the first and the fourth sector (between 15
° and 75 ° ) with a preference for sector 2 (15 ° and 45 °)
where the winds are dominant.
Fig. 7. Wind rose of the site of N’Djamena
The use of this figure allows during the implantation of
wind, the position in the direction of the prevailing wind
(Sector 2 and 3), if there is not the possibility of installing
a wind follower, which for most of the time is itself energy
consumer.
4.9. Turbulence analysis
The average variations over the year are sometimes used to
define the wind or winds (sometimes quite different) who
regularly visit the site. Most common in Ndjamena are
harmatan north and towards the center part and, the
Monsoon towards the south.
This also allows you to see, depending on desired uses of
the wind produced electricity and other forms of turbines
generated electrical power, if this production is (or is not),
on average, in line with electricity consumers needs and
other forms of electricity production. One could partly
explain these variations by the changes in roughness due to
changing seasons. Observing the average daily variations
of wind speeds on the plot shows that the wind speed is
very low between 7 pm and 12 pm Universal Time.
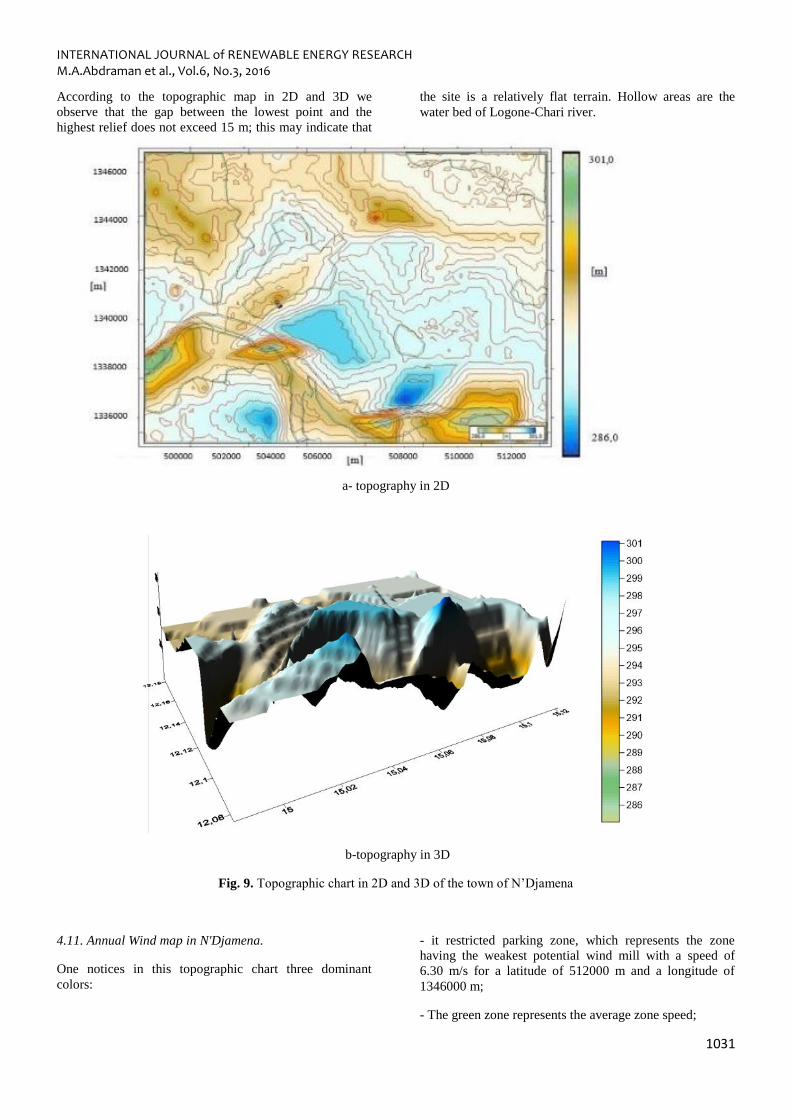
The study of monthly variations indicates periods of
permanent electricity production at the station. Variations
in wind speed show two (2) peaks in March and in June.
These months are thus expected to be the most productive.
a- Monthly speed variations b- Daily speed variations
Fig. 8. Average speed variations over the year (a) and in one day (b)
4.10. Topographic map in 2D and 3D of N'Djamena city
INTERNATIONAL JOURNAL of RENEWABLE ENERGY RESEARCH M.A.Abdraman et al., Vol.6, No.3, 2016
1031
According to the topographic map in 2D and 3D we
observe that the gap between the lowest point and the
highest relief does not exceed 15 m; this may indicate that
the site is a relatively flat terrain. Hollow areas are the
water bed of Logone-Chari river.
a- topography in 2D
b-topography in 3D
Fig. 9. Topographic chart in 2D and 3D of the town of N’Djamena
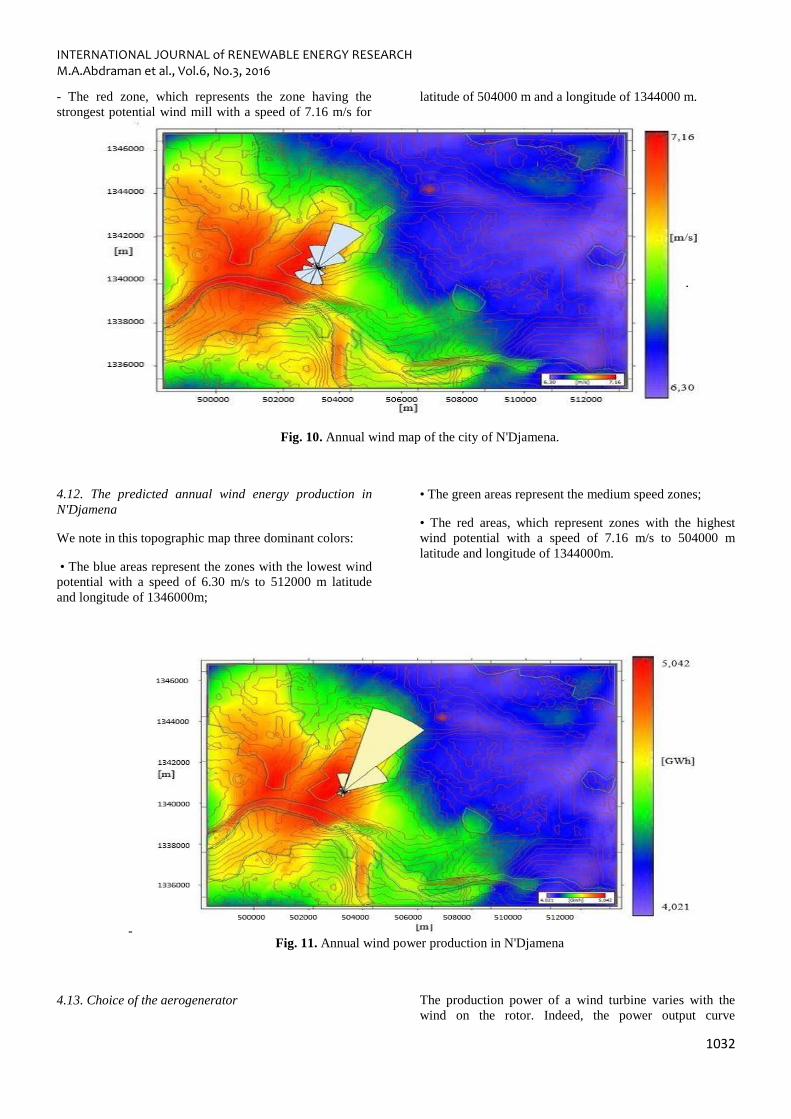
4.11. Annual Wind map in N'Djamena.
One notices in this topographic chart three dominant
colors:
- it restricted parking zone, which represents the zone
having the weakest potential wind mill with a speed of
6.30 m/s for a latitude of 512000 m and a longitude of
1346000 m;
- The green zone represents the average zone speed;
INTERNATIONAL JOURNAL of RENEWABLE ENERGY RESEARCH M.A.Abdraman et al., Vol.6, No.3, 2016
1032
- The red zone, which represents the zone having the
strongest potential wind mill with a speed of 7.16 m/s for
latitude of 504000 m and a longitude of 1344000 m.
Fig. 10. Annual wind map of the city of N'Djamena.
4.12. The predicted annual wind energy production in
N'Djamena
We note in this topographic map three dominant colors:
• The blue areas represent the zones with the lowest wind
potential with a speed of 6.30 m/s to 512000 m latitude
and longitude of 1346000m;
• The green areas represent the medium speed zones;
• The red areas, which represent zones with the highest
wind potential with a speed of 7.16 m/s to 504000 m
latitude and longitude of 1344000m.
- Fig. 11. Annual wind power production in N'Djamena
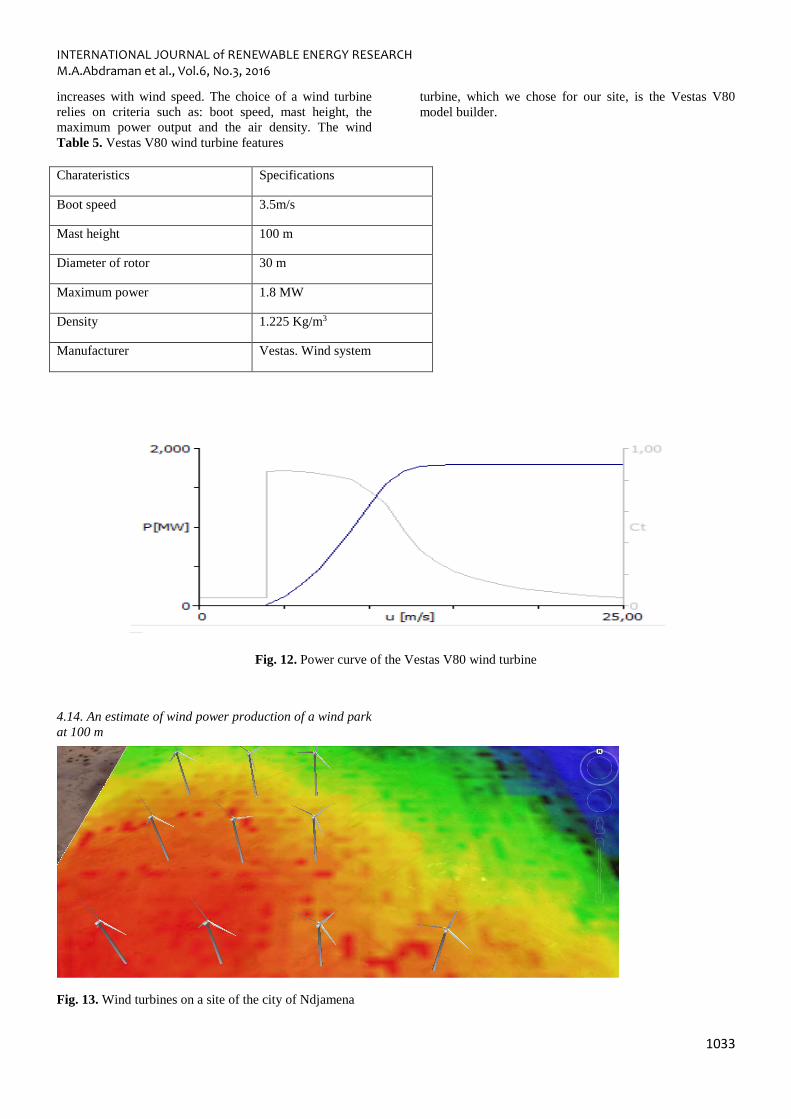
4.13. Choice of the aerogenerator The production power of a wind turbine varies with the
wind on the rotor. Indeed, the power output curve
INTERNATIONAL JOURNAL of RENEWABLE ENERGY RESEARCH M.A.Abdraman et al., Vol.6, No.3, 2016
1033
increases with wind speed. The choice of a wind turbine
relies on criteria such as: boot speed, mast height, the
maximum power output and the air density. The wind
turbine, which we chose for our site, is the Vestas V80
model builder.
Table 5. Vestas V80 wind turbine features
Fig. 12. Power curve of the Vestas V80 wind turbine
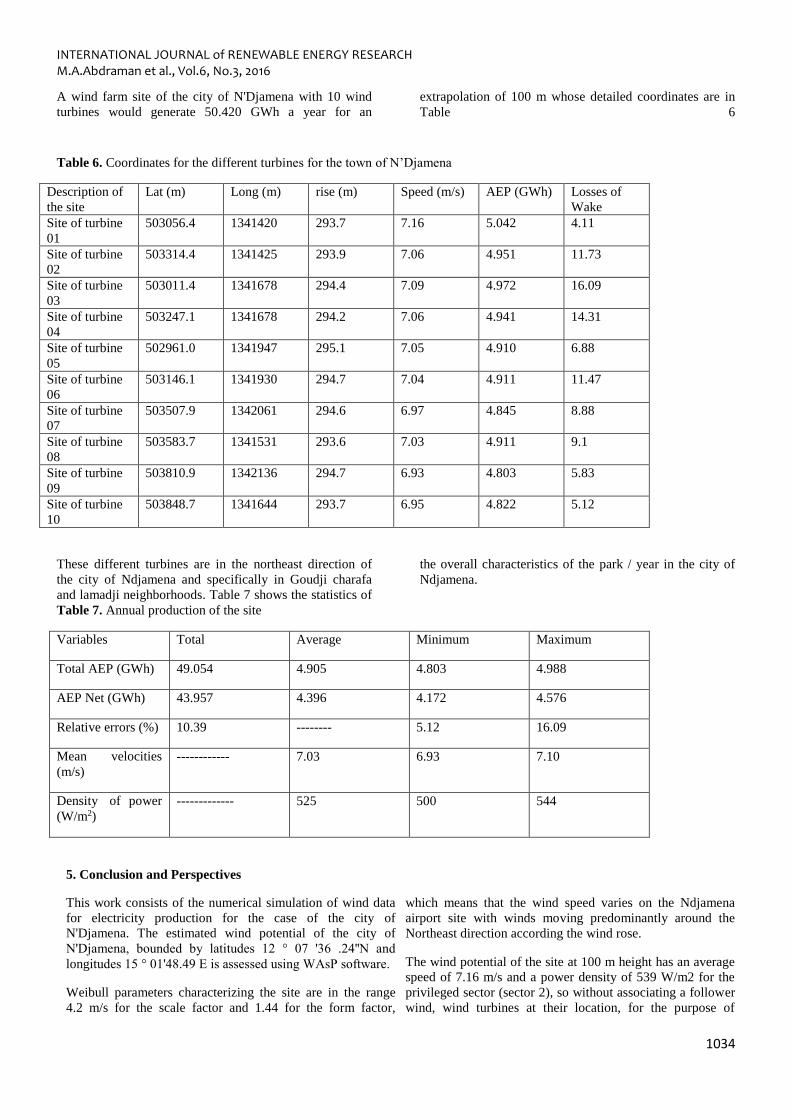
4.14. An estimate of wind power production of a wind park
at 100 m
Fig. 13. Wind turbines on a site of the city of Ndjamena
Charateristics Specifications
Boot speed 3.5m/s
Mast height 100 m
Diameter of rotor 30 m
Maximum power 1.8 MW
Density 1.225 Kg/m3
Manufacturer Vestas. Wind system
INTERNATIONAL JOURNAL of RENEWABLE ENERGY RESEARCH M.A.Abdraman et al., Vol.6, No.3, 2016
1034
A wind farm site of the city of N'Djamena with 10 wind
turbines would generate 50.420 GWh a year for an
extrapolation of 100 m whose detailed coordinates are in
Table 6
Table 6. Coordinates for the different turbines for the town of N’Djamena
Description of
the site
Lat (m) Long (m) rise (m) Speed (m/s) AEP (GWh) Losses of
Wake
Site of turbine
01
503056.4 1341420 293.7 7.16 5.042 4.11
Site of turbine
02
503314.4 1341425 293.9 7.06 4.951 11.73
Site of turbine
03
503011.4 1341678 294.4 7.09 4.972 16.09
Site of turbine
04
503247.1 1341678 294.2 7.06 4.941 14.31
Site of turbine
05
502961.0 1341947 295.1 7.05 4.910 6.88
Site of turbine
06
503146.1 1341930 294.7 7.04 4.911 11.47
Site of turbine
07
503507.9 1342061 294.6 6.97 4.845 8.88
Site of turbine
08
503583.7 1341531 293.6 7.03 4.911 9.1
Site of turbine
09
503810.9 1342136 294.7 6.93 4.803 5.83
Site of turbine
10
503848.7 1341644 293.7 6.95 4.822 5.12
These different turbines are in the northeast direction of
the city of Ndjamena and specifically in Goudji charafa
and lamadji neighborhoods. Table 7 shows the statistics of
the overall characteristics of the park / year in the city of
Ndjamena.
Table 7. Annual production of the site
Variables Total Average Minimum Maximum
Total AEP (GWh) 49.054 4.905 4.803 4.988
AEP Net (GWh) 43.957 4.396 4.172 4.576
Relative errors (%) 10.39 -------- 5.12 16.09
Mean velocities
(m/s)
------------ 7.03 6.93 7.10
Density of power
(W/m2)
------------- 525 500 544
5. Conclusion and Perspectives
This work consists of the numerical simulation of wind data
for electricity production for the case of the city of
N'Djamena. The estimated wind potential of the city of
N'Djamena, bounded by latitudes 12 ° 07 '36 .24''N and
longitudes 15 ° 01'48.49 E is assessed using WAsP software.
Weibull parameters characterizing the site are in the range
4.2 m/s for the scale factor and 1.44 for the form factor,
which means that the wind speed varies on the Ndjamena
airport site with winds moving predominantly around the
Northeast direction according the wind rose.
The wind potential of the site at 100 m height has an average
speed of 7.16 m/s and a power density of 539 W/m2 for the
privileged sector (sector 2), so without associating a follower
wind, wind turbines at their location, for the purpose of
INTERNATIONAL JOURNAL of RENEWABLE ENERGY RESEARCH M.A.Abdraman et al., Vol.6, No.3, 2016
1035
optimizing the energy production, must follow this direction.
Although the data are collected 10 m above the ground, the
installation of a wind farm of 10 Vestas V80 /1.8 MW wind
turbines at 100 meters, would produce 50.420 MWh of
energy.
This demonstrates that the amount of wind produced in this
area is highly suitable for use in aero-generators.
Finally, the measured parameter values and those calculated
statistically are very close approximation of values obtained
from mathematical modeling using Weibull distribution,
which validates the use of this model for purposes of
prediction.
Further and future work would concern the introduction in
our model and numerical simulations of the interactions
between wind turbines also called wake effect and turbulence
of the wind turbine blade in order to provide an accurate
estimate of the energy production of a wind mill park.
Acknowledgements
The authors warmly ASECNA N'Djamena for weather
data and Risø National Laboratory, Department of Wind
Energy, at Technical University of Denmark. The
reviewers are also thanked for their constructive
comments.
.
Nomenclature:
INTERNATIONAL JOURNAL of RENEWABLE ENERGY RESEARCH M.A.Abdraman et al., Vol.6, No.3, 2016
1036
References
[1] Observ’ER, EDF, La Production d’Electricité d’Origine
Renouvelable dans le Monde’, Observatoire des Energies
Renouvelables, 14eme inventaire, Available from
http://www.observ-er.org/observer/html/inventaire/Fr/preface
asp, (2012), [Accessed 13 January 2013].
[2] Omer, A.M., On the Wind energy resources of Sudan
Renewable and Sustainable Energy Reviews 12 (2008), pp.
2117–2139.
[3] Li, M, Li, X., MEP-type distribution function: a better
alternative to Weibull function for Wind speed
distributions, Renewable Energy 30 (2005), pp. 1221–1240.
[4] Sathyajith, M. and Geeta, S.P., Advances in Wind Energy
Conversion Technology, (2011), pp. 74-80. Springer-Verlag
Berlin Heidelberg.
[5] Mouangue M.R., Kazet M.Y., Kuitche A. and Ndjaka, J.M.,
Influence of the Determination Methods of K and C
Parameters on the Ability of Weibull Distribution to Suitably
Estimate Wind Potential and Electric Energy, Int. Journal of
Renewable Energy Development, 3 (2) (2014), pp. 145-154.
[6] Faida H., Saadi J., Khaider M., El Alami S. and Monkade
M., Etude et Analyse des Données du Vent en Vue de
Dimensionner un Système de Production d’Energie
Eolienne- Cas d’un Site au Nord du Maroc, Revue des
Energies Renouvelables, 13 (3) (2010), pp. 477 – 483.
[7] Seguro J.V. and Lambert T.W., Modern Estimation of the
Parameters of the Weibull Wind Speed Distribution for
Wind Energy Analysis, Journal of Wind Energy
Engineering and Industrial Aerodynamics, 85 (1) (2000),
pp. 75 – 84.
[8] Sathyajith, M., Wind Energy Fundamentals, Resource
Analysis and Economics, (2006), pp. 68-83. Springer-
Verlag Berlin Heidelberg.
[9] Dubois C., Le Guide de l’Eolien, Techniques et Pratiques,
Editions Eyrolles, Paris (2009).
[10] Tieleman H.W., Roughness Estimation for Wind-Load
Simulation Experiments, Journal of Wind Energy
Engineering and Industrial Aerodynamics, 91 (9) (2003),
pp. 1163 – 1173
[11] Lettau H., Note on Aerodynamic Roughness - Parameter
Estimation on the Basis of Roughness - Element
Description, Journal of Applied Meteorology, 8 (5) (1969),
pp. 828 –832.
[12] Meishen L. and Xianguo L., MEP-Type Distribution
Function: A Better Alternative to Weibul Function for
Wind Speed Distributions, Renewable Energy, 30 (8)
(2005), pp. 1221 – 1240.
[13] Jamil M., Parsa S., and Majidi M., Wind Power Statistics
and Evaluation of Wind Energy Density, Renewable
Energy, 6 (5-6) (1995), pp. 623 - 628.
[14] Bañuelos-Ruedas, F., Angeles-Camacho, C. and Rios-
Marcuello, S., “Analysis and validation of the methodology
used in the extrapolation of wind speed data at
different heights”, Renewable and Sustainable Energy
Reviews, 14(2010), pp. 2383–2391.
[15] Gualtieri, G. and Secci, S., “Methods to extrapolate wind
resource to the turbine hub height based on power law: a
1-h wind speed vs. Weibull distribution extrapolation
comparison”, Renewable Energy, 43(2012), pp. 183-200.