
MAG-SIP MAG - Structural Insulated Panels. MAG-SIP MAG - Structural Insulated Panels.

WIND-RESISTANCE OF COMPOSITE STRUCTURAL INSULATED PANELS
(CSIPS)
by
LI DONG
NASIM UDDIN, COMMITTEE CHAIR JASON T. KIRBY TALAT SALAMA
A THESIS
Submitted to the graduate faculty of The University of Alabama at Birmingham, In partial fulfillment of the requirements for the degree of
Master of Science in Civil Engineering
BIRMINGHAM, ALABAMA
2012

Copyright by Li Dong
2012

iii
WIND-RESISTANCE OF COMPOSITE STRUCTURAL INSULATED PANELS (CSIPS)
LI DONG
DEGREE: MS PROGRAM: CIVIL ENGINEERING
ABSTRACT
Extreme windstorms are frequent and destructive natural hazards in the United
States. Each wind disaster proves that traditional wood houses are too fragile to withstand
high air pressures. The proposed Composite Structural Insulated Panels (CSIPs) are made
of a low-cost, thermoplastic orthotropic glass/poly-propylene (glass-PP) laminate as the
face sheet and expanded polystyrene (EPS) foam as the core, with a high face sheet/core
moduli ratio.
In order to evaluate the wind-resistance of CSIPs, panels with cores of 16 kg/m3
(1 PCF) and 48 kg/m3 (3 PCF) density were tested at the University of Florida. Stepwise
and dynamic simulated wind pressure was generated by the High Airflow Pressure
Loading Actuator. The connections of the CSIPs were 2”×6” lumbers as used in
traditional constructions. Top and bottom lumbers were fixed to steel plates with bolts. In
stepwise windstorm tests, step-by-step pressure was applied to CSIPs; the highest
pressure was equivalent to a wind speed of 124.44 m/s (280 mph). The CSIPs wall
system demonstrated superior capacity except local debonding between the face sheet
and core; there were connection failures at lumbers in all but one sample. In dynamic
windstorm tests, cyclic pressure was used to simulate actual exposure. Only one sample
failed at the lumber connection, and there were minor cracks in the lumber connections
and local debondings in three of the eight samples. The intact condition of all face sheets
iv
and cores after tests indicate the excellent wind-resistance of CSIPs for structural wall
applications.
Corresponding finite element modeling was developed and initially validated, in a
dynamic windstorm test, within the first second for the 1 PCF core density CSIP. The
modeling was further investigated with longer durations of exposure. The results were
compared, and modifications were projected for future modeling to improve the
precision.
Keywords: Wind resistance, Sandwich composite panel, Wind velocity, Stepwise
windstorm test, Dynamic windstorm test, Probability, Finite element modeling.

v
DEDICATION
This thesis is dedicated to all my family members and my sincere friends.

vi
ACKNOWLEDGMENTS
First, thanks go to my advisor, the project Principal Investigator (PI) and
committee chair, Dr. Nasim Uddin, for all of his time and advice towards my graduate
study. Second, I appreciate the time input and guidance from my committee members,
Dr. Jason T. Kirby and Dr. Talat Salama. Further, I would like to acknowledge the
National Science Foundation for funding this project (NSF Grant #: CMMI-0825938).
Gratitude also goes to the project Co-PI, Dr. Forrest J. Masters, and his graduate
student, George Fernandez, from the University of Florida, who led and performed the
stepwise and dynamic wind storm tests described in the thesis.
To Xiaoxiao Song and all my sincere friends whose names have not been
mentioned here, your help and support are acknowledged as well.
Last and most importantly, I would like to thank my family for their continuous
and unconditional love and support, without which I could not have succeeded.

vii
TABLE OF CONTENTS
Page
ABSTRACT ……………………………………………………………………………..iii
DEDICATION…………………………………………………………………………....v
ACKNOWLEDGMENTS...……………………………………………………………vi
LIST OF TABLES……………………………………………………………………...x
LIST OF FIGURES……………………………………………………………………xii
CHAPTER
1 INTRODUCTION ........................................................................................................... 1
1.1 Background ......................................................................................................... 1 1.2 Literature Review................................................................................................ 2
1.2.1 Traditional Wood House ................................................................................. 2 1.2.2 Panelized Construction with Structural Insulated Panel (SIP) ....................... 2 1.2.3 Composite Structural Insulated Panel (CSIP) ................................................. 3
1.3 Research Objectives & Outline ........................................................................... 8
2 EXPERIMENT CONFIGURATION .............................................................................. 9
2.1 Test Panels .......................................................................................................... 9 2.2 The testing apparatus: High Airflow Pressure Loading Actuator (HAPLA) .... 10 2.3 Boundary Conditions ........................................................................................ 14 2.4 Instrumentation Setup ....................................................................................... 17
3 STEPWISE WINDSTORM TEST ................................................................................ 20
3.1 Target Load ....................................................................................................... 20 3.2 Panel S-0511-1 .................................................................................................. 22

viii
TABLE OF CONTENTS (Continued)
Page 3.3 Panel S-0506-3 .................................................................................................. 27 3.4 Panel S-0511-3 .................................................................................................. 32 3.5 Panel S-0512-3 .................................................................................................. 37 3.6 Panel S-0513-3 .................................................................................................. 42 3.7 Results ............................................................................................................... 46 3.8 Discussion ......................................................................................................... 47 3.9 Summary ........................................................................................................... 48
4 DYNAMIC WINDSTORM TEST ................................................................................ 50
4.1 Target Load ....................................................................................................... 50 4.2 Validation for Exposure Time of Fatigue Load ................................................ 52 4.3 Panel D-0926-1 ................................................................................................. 54 4.4 Panel D-1003-1 ................................................................................................. 59 4.5 Panel D-0912-3 ................................................................................................. 64 4.6 Panel D-0921-3 ................................................................................................. 68 4.7 Panel D-1025-3 ................................................................................................. 72 4.8 Panel D-1101-3 ................................................................................................. 77 4.9 Panel D-1102-3 ................................................................................................. 81 4.10 Panel D-1103-3 ................................................................................................. 86 4.11 Results ............................................................................................................... 90 4.12 Discussion ......................................................................................................... 93 4.13 Summary ........................................................................................................... 94
5 AS-BUILT CONDITIONS ............................................................................................ 96
6 FINITE ELEMENT MODELING ................................................................................. 98
6.1 Initial Modeling Validation ............................................................................... 98 6.1.1 Simulation Details ......................................................................................... 98
6.2 Further FE modeling and Experimental Results ............................................. 107 6.2.1 Stepwise Windstorm Test ........................................................................... 108 6.2.2 Dynamic Windstorm Test ........................................................................... 110
6.3 Summary ......................................................................................................... 114
7 SUMMARY AND CONCLUSION ............................................................................ 115
7.1 Summary ......................................................................................................... 115 7.2 Conclusion ...................................................................................................... 117

ix
TABLE OF CONTENTS (Continued)
Page
LIST OF REFRENCES ………………………………………………………………119

x
LIST OF TABLES
Table Page
Table 1 Mechanical properties of the face sheet ................................................................. 4
Table 2 Mechanical properties of the core .......................................................................... 4
Table 3 Test samples ........................................................................................................... 9
Table 4 Pressure to velocity conversion ........................................................................... 21
Table 5 S-0511-1 pressure to wind velocity conversion ................................................... 23
Table 6 S-0506-3 pressure to wind velocity conversion ................................................... 28
Table 7 S-0511-3 pressure to wind velocity conversion ................................................... 33
Table 8 S-0512-3 pressure to wind velocity conversion ................................................... 38
Table 9 S-0513-3 pressure to wind velocity conversion ................................................... 43
Table 10 Failure details of stepwise windstorm test ......................................................... 46
Table 11 Pressure to velocity conversion ......................................................................... 51
Table 12 Rayleigh probability of exposure at or above given wind speed ....................... 54
Table 13 D-0926-1 pressure to velocity conversion ......................................................... 55
Table 14 D-0926-1 exposure at or above given wind speed ............................................. 55
Table 15 D-1003-1 pressure to velocity conversion ......................................................... 60
Table 16 D-1003-1 exposure at or above given wind speed ............................................. 60
Table 17 D-0912-3 pressure to velocity conversion ......................................................... 65

xi
LIST OF TABLES (Continued)
Page Table 18 D-0912-3 exposure at or above given wind speed ............................................. 65
Table 19 D-0921-3 pressure to velocity conversion ......................................................... 69
Table 20 D-0921-3 exposure at or above given wind speed ............................................. 69
Table 21 D-1025-3 pressure to velocity conversion ......................................................... 73
Table 22 D-1025-3 exposure at or above given wind speed ............................................. 73
Table 23 D-1101-3 pressure to velocity conversion ......................................................... 77
Table 24 D-1101-3 exposure at or above given wind speed ............................................. 78
Table 25 D-1102-3 pressure to velocity conversion ......................................................... 82
Table 26 D-1102-3 exposure at or above given wind speed ............................................. 82
Table 27 D-1103-3 pressure to velocity conversion ......................................................... 87
Table 28 D-1103-3 exposure at or above given wind speed ............................................. 87
Table 29 Failure details of dynamic windstorm test ......................................................... 91
Table 30 Material properties of face sheet ........................................................................ 99
Table 31 Material properties of core ................................................................................. 99

xii
LIST OF FIGURES
Figure Page
Figure 1 Panoramic view of CSIP sample ........................................................................ 10
Figure 2 High airflow pressure loading actuator [35] ....................................................... 12
Figure 3 Front view of HAPLA ........................................................................................ 13
Figure 4 HAPLA with sample ready ................................................................................ 13
Figure 5 Pressure Transducer ............................................................................................ 14
Figure 6 Panel installation ................................................................................................ 15
Figure 7 Connection detail sketch..................................................................................... 15
Figure 8 Disbonding ......................................................................................................... 15
Figure 9 Connection details .............................................................................................. 16
Figure 10 Connection details side view ............................................................................ 16
Figure 11 Fastener details ................................................................................................. 17
Figure 12 Strain gauges deployment ................................................................................. 18
Figure 13 Instruments setup .............................................................................................. 19
Figure 14 Pressure history of stepwise windstorm test ..................................................... 20
Figure 15 S-0511-1 pressure history ................................................................................. 23
Figure 16 S-0511-1 deflection plot ................................................................................... 24
Figure 17 S-0511-1 curvature ........................................................................................... 25

xiii
LIST OF FIGURES (Continued)
Page Figure 18 S-0511-1 top connection................................................................................... 26
Figure 19 S-0511-1 bottom connection ............................................................................ 26
Figure 20 S-0511-1 debonding sketch .............................................................................. 27
Figure 21 S-0511-1 strain plot .......................................................................................... 27
Figure 22 S-0506-3 pressure history ................................................................................. 29
Figure 23 S-0506-3 deflection plot ................................................................................... 29
Figure 24 S-0506-3 curvature ........................................................................................... 30
Figure 25 S-0506-3 top connection................................................................................... 31
Figure 26 S-0506-3 bottom connection ............................................................................ 31
Figure 27 S-0506-3 debonding sketch .............................................................................. 32
Figure 28 S-0506-3 strain plot .......................................................................................... 32
Figure 29 S-0511-3 pressure history ................................................................................. 34
Figure 30 S-0511-3 deflection plot ................................................................................... 34
Figure 31 S-0511-3 curvature ........................................................................................... 35
Figure 32 S-0511-3 top connection................................................................................... 36
Figure 33 S-0511-3 bottom connection ............................................................................ 36
Figure 34 S-0511-3 debonding sketch .............................................................................. 37
Figure 35 S-0511-3 strain plot .......................................................................................... 37
Figure 36 S-0512-3 pressure history ................................................................................. 39
Figure 37 S-0512-3 deflection plot ................................................................................... 39
Figure 38 S-0512-3 curvature ........................................................................................... 40

xiv
LIST OF FIGURES (Continued)
Page Figure 39 S-0512-3 top connection................................................................................... 41
Figure 40 S-0512-3 bottom connection ............................................................................ 41
Figure 41 S-0512-3 debonding sketch .............................................................................. 42
Figure 42 S-0512-3 strain plot .......................................................................................... 42
Figure 43 S-0513-3 pressure history ................................................................................. 44
Figure 44 S-0513-3 deflection plot ................................................................................... 44
Figure 45 S-0513-3 curvature ........................................................................................... 45
Figure 46 S-0513-3 strain plot .......................................................................................... 46
Figure 47 Deflection plots of stepwise windstorm test ..................................................... 47
Figure 48 Pressure history of dynamic windstorm test ..................................................... 51
Figure 49 Model estimated 500-year return period 3 sec gust wind speeds at a height of
10 m in open terrain including wind modeling uncertainty [39] ...................................... 53
Figure 50 D-0926-1 pressure history ................................................................................ 56
Figure 51 D-0926-1 100 second excerpt ........................................................................... 56
Figure 52 D-0926-1deflection plot ................................................................................... 57
Figure 53 D-0926-1 curvature .......................................................................................... 58
Figure 54 D-0926-1 debonding sketch ............................................................................. 59
Figure 55 D-1003-1 pressure history ................................................................................ 61
Figure 56 D-1003-1 100 second excerpt ........................................................................... 61
Figure 57 D-1003-1deflection plot ................................................................................... 62
Figure 58 D-1003-1curvature ........................................................................................... 63

xv
LIST OF FIGURES (Continued)
Page Figure 59 D-1003-1 debonding sketch ............................................................................. 64
Figure 60 D-0912-3 pressure history ................................................................................ 65
Figure 61 D-0912-3 100 second excerpt ........................................................................... 66
Figure 62 D-0912-3 deflection plot .................................................................................. 66
Figure 63 D-0912-3 curvature .......................................................................................... 67
Figure 64 D-0912-3 debonding sketch ............................................................................. 68
Figure 65 D-0921-3 pressure history ................................................................................ 69
Figure 66 D-0921-3 100 second excerpt ........................................................................... 70
Figure 67 D-0921-3 deflection plot .................................................................................. 70
Figure 68 D-0921-3 curvature .......................................................................................... 71
Figure 69 D-0921-3 debonding sketch ............................................................................. 72
Figure 70 D-1025-3 deflection plot .................................................................................. 73
Figure 71 D-1025-3 100 second excerpt ........................................................................... 74
Figure 72 D-1025-3 deflection plot .................................................................................. 74
Figure 73 D-1025-3 curvature .......................................................................................... 75
Figure 74 D-1025-3 bottom connection ............................................................................ 76
Figure 75 D-1025-3 debonding sketch ............................................................................. 76
Figure 76 D-1101-3 pressure history ................................................................................ 78
Figure 77 D-1101-3 100 second excerpt ........................................................................... 79
Figure 78 D-1101-3 deflection plot .................................................................................. 79
Figure 79 D-1101-3 curvature .......................................................................................... 80

xvi
LIST OF FIGURES (Continued)
Page Figure 80 D-1101-3 debonding sketch ............................................................................. 81
Figure 81 D-1102-3 pressure history ................................................................................ 82
Figure 82 D-1102-3 100 second excerpt ........................................................................... 83
Figure 83 D-1102-3 deflection plot .................................................................................. 83
Figure 84 D-1102-3 curvature .......................................................................................... 84
Figure 85 D-1102-3 top connection .................................................................................. 85
Figure 86 D-1102-3 bottom connection ............................................................................ 85
Figure 87 D-1102-3 debonding sketch ............................................................................. 86
Figure 88 D-1103-3 pressure history ................................................................................ 87
Figure 89 D-1103-3 100 second excerpt ........................................................................... 88
Figure 90 D-1103-3 deflection plot .................................................................................. 88
Figure 91 D-1103-3 curvature .......................................................................................... 89
Figure 92 D-1103-3 debonding sketch ............................................................................. 90
Figure 93 Deflection plots of dynamic windstorm test ..................................................... 92
Figure 94 Corner disbonding ............................................................................................ 96
Figure 95 Simpson strong tie ............................................................................................ 97
Figure 96 Connection dimensions .................................................................................... 99
Figure 97 Panel dimensions ............................................................................................ 100
Figure 98 Load history: Pressure - Time ........................................................................ 101
Figure 99 Geometry ........................................................................................................ 101
Figure 100 Deflection - Time curves for different materials .......................................... 102

xvii
LIST OF FIGURES (Continued)
Page Figure 101 Deflection – Time curve of explicit and implicit methods ........................... 104
Figure 102 Deflection – Time curve of different element numbers ............................... 105
Figure 103 Comparison between experiment and FE modeling ..................................... 106
Figure 104 Deflection contour ........................................................................................ 107
Figure 105 Deflection comparisons of 1 PCF core density CSIPs in stepwise windstorm
test ................................................................................................................................... 108
Figure 106 Deflection comparisons of 3 PCF core density CSIPs in stepwise windstorm
test ................................................................................................................................... 109
Figure 107 Deflection comparisons of 1 PCF core density CSIPs in dynamic windstorm
test ................................................................................................................................... 112
Figure 108 Deflection comparisons of 3 PCF core density CSIPs in dynamic windstorm
test ................................................................................................................................... 113

1
CHAPTER 1
INTRODUCTION
1.1 Background
In the United States (U.S.) from 1991 to 2010, the insured losses caused by w
indstorms such as hurricanes and tornadoes amounted for $258.6 billion (2010 dollars),
which accounts for 74% of all catastrophic losses, including those caused by winter
storms, terrorism, geologic events, wind, hail, flood, fires, etc. Eight of the ten most
costly catastrophes were hurricanes; the other two were the terrorist attacks on the World
Trade Center and the Pentagon and the California Northridge earthquake, which ranked
second and fourth, respectively. The top disaster, Hurricane Katrina in 2005, caused $41
billion in overall losses and 1320 fatalities [1]. Although windstorm shelters are
considered the safest structures in windstorm prone areas, such shelters may not be
available and there may be limited time to evacuate, preventing people from being secure
during windstorms. Since people tend to stay in houses during hazardous conditions,
building damage is closely associated with fatalities. Although the population along
coastal areas continues to increase, the residential structures in these areas are generally
not prepared for hurricanes [2]. From 2000 to 2011, tornadoes caused 1155 fatalities,
among which 37% of the people were killed in permanent houses [3]. This information
indicates that traditional wooden residential houses are not capable of resisting strong

2
windstorms. According to in-field investigations, building envelope failures are the most
common windstorm damages [4-7].
1.2 Literature Review
1.2.1 Traditional Wood House
Due to their low initial cost, relatively fast construction, and durability with
regular maintenance, most homes in the U.S. are traditional wood houses. However,
wood, a widely used material, has weaknesses. As an organic material, wood attracts
termites and can accumulate mold buildup in environments of high humidity.
Furthermore, wood can lose strength after it is immersed in water, which is common
during floods. The deficient performance of wood during windstorms makes it less
desirable as a construction material. In tornadoes, 37% of fatalities are for people in their
own houses. Investigations after hurricanes and tornadoes show that, in windstorms,
wooden structures have poor resistance to aerial debris and to high air pressure.
1.2.2 Panelized Construction with Structural Insulated Panel (SIP)
Residential home building is an essential component of the U.S. economic
system. Stick-built homes were formerly popular in traditional building. As advances
have been made in modular manufacturing, however, panelized construction has been
introduced. Factory-built modules are assembled onsite, which decreases the construction
time and the total cost. Structural Insulated Panel (SIP) is commonly used in such
construction. A typical example of SIP is the sandwich structure with an oriented strand
board (OSB) face sheet and a foam core, made of expanded polystyrene (EPS), extruded
polystyrene (XPS), or urethane, which have plasticity and low cost and provide insulation
for sound and temperature. Although extensive research has been accomplished on the

3
structural behavior of SIP [8], there has not been an analytical model accurate enough
and convenient enough to apply in its design [9]. Further, the OSB face sheet retains
problems similar to those found for traditional wood houses, such as low wind resistance,
termite attack, mold buildup, and loss of strength after exposure to water.
1.2.3 Composite Structural Insulated Panel (CSIP)
Extensive research on CSIP has been conducted at the University of Alabama at
Birmingham. As investigations progressed, the focus of research shifted from “hard” core
sandwich panels [10-14] to “soft” core sandwich panels [9, 15-16]. The CSIP discussed
in this report is limited to the sandwich panel made of a thermoplastic E-glass fiber and
polypropylene (glass-PP) laminate face sheet and an expanded polystyrene foam core.
The characteristics of a high strength to weight ratio, low cost, and fewer required in-field
techniques make CSIP an ideal material for residential buildings.
1.2.3.1 Materials
Produced by the hot-melt impregnation process named DRIFT [17], the face sheet
consists of 60% (by weight) bi-directional E-glass fiber with a polypropylene matrix.
Expanded polystyrene (EPS) foam is used as the core because of its relatively low cost.
For the present research, the face sheet and core materials were ordered from U.S. Liner
[18] and Universal Foam Products [19], respectively, and were bonded by a hot-melt
thermoplastic spray adhesive on a casting and molding facility with quality control. The
mechanical properties of the face sheet and core are listed in Table 1 and Table 2.

4
Table 1 Mechanical properties of the face sheet
Property Value Fiber Reinforcement 60% Bi-Directional E-glass Fibers
Matrix Polypropylene Material Designation Orthotropic Nominal Thickness 3.04 mm (0.12 in)
Tensile Strength 290 MPa (42,061 psi) Tensile Modulus 12,414 MPa (1,800,498 psi) Flexural Strength 276 MPa (40,030 psi) Flexural Modulus 11,035 MPa (1,600,491 psi)
Table 2 Mechanical properties of the core
1.2.3.2 Laboratory Tests on CSIPs
Extensive research has been performed on CSIPs by Vaidya et al. [9] at the
University of Alabama at Birmingham. The results are summarized as follows.
Reduced Scale Flexural Test. The flexural test was conducted according to ASTM C-393
[20]. The traditional SIP with an OSB face sheet and the innovative CSIP with an E-
glass/PP face sheet were compared. SIPs failed by rupture of face sheets and shear
cracking of the core. CSIPs failed only in shear cracking of the core; the face sheets
Property Value
Foam Density 16 kg/m3 (1 pcf) 48 kg/m3 (3 pcf)
Elastic Modulus (Ec) 1.2-1.5 MPa (180-220 psi) 5.4-5.7 MPa (780-820 psi)
Flexural Strength 0.1-0.2 MPa (25-30 psi) 0.55-0.59 MPa (80-85 psi)
Shear Modulus (Gc) 1.9-2.2 MPa (280-320 psi) 5.65-5.93 MPa (820-860 psi)
Shear Strength 0.1-0.15 MPa (18-22 psi) 0.31-0.34 MPa (45-50 psi)
Tensile Strength 0.11-0.14 MPa (16-20 psi) 0.19-0.21 MPa(26-30 psi)
Compressive Strength 0.07-0.1 MPa (10-14 psi) 0.28-0.34 MPa (40-50 psi)
Poisson’s Ratio 0.25 0.25

5
remained intact. The results indicated that CSIPs had a greater strength-to-weight ratio
and more ductility than SIPs [9].
Reduced Scale Low Velocity Impact (LVI) Test. An Instron Model 8250 drop-weight
impact machine was used in the test. 20 J, 50 J, and 68 J of impact energy were evaluated
on SIP and CSIP samples. Under 68 J of impact energy, the top face sheet and the foam
core of SIP were pierced through, but there was only a minor dent on the top face of the
CSIP. Thus, CSIP absorbed more energy; there was only a slight indentation on the
impact surface [9, 21].
Full Scale High Velocity Impact (HVI) Test. A gas gun facility was used to shoot an
aluminum bullet toward a full-scale CSIP. Two impacts were conducted in order to
comply with standards established by the Federal Emergency Management Agency.
Although the front face was damaged severely, the back face was intact, demonstrating
that CSIP is capable of bearing the equivalent impact energy of 66.7 N of a 5.1 cm × 10.2
cm wind missile traveling at a speed of 44.7 m/s [9, 22].
Full Scale Wall Buckling Test. A full-scale wall CSIP was constructed according to
ASTM E-72 05 [23]. The damage modes were linear elastic range, initial delamination
near supports, and delamination between the core and obvious face sheet at failure load.
The concentric and eccentric buckling load and the wrinkling stress of the face sheet were
determined by the formula of Mousa and Uddin [24, 25]. The test proved that CSIP bears
6.25% more than the design load according to the APA design guide and meets the mid-
height deflection criteria in ACI 318-05 [9,16.22].
Full Scale Floor Flexural Test. As per ASTM E-72 05, a four-point load was used in the
test. The design load of CSIP is 0.0024 N/mm2 (50 psf), which is 25% higher than the

6
value in ASCE 7-05 [26]. The typical failure was localized delamination between the face
sheet and the core near the loading point. The test also revealed that the compressive
strains on the top face sheet were higher than the tensile strains at the bottom [9]. The
mid-span deflection, flexural strength, facing stress, and wrinkling stress were validated
[16, 27].
Full Scale Panel Flood Test. Four groups of CSIPs were tested in a flood experiment. Per
ASTM C 393, a flexural test was used to evaluate CSIPs after exposure to water. The
first group of samples were the control group and were tested as they were; the second
group of samples were submerged in water for three days and tested in dry condition; the
third group of samples were submerged in water for seven days and tested in dry
condition; the fourth group of samples were submerged in water for seven days and tested
in wet condition. The results showed that the largest degradation was 16% for panels
submerged in water for seven days and tested wet; there was only a 6% decrease for
panels in water for three days and tested dry. Therefore, the results proved that the
strength of CSIPs does not decrease substantially after exposure to water for several days.
Fire Resistance. CSIPs were evaluated for their flame retardant properties by two
approaches. The first involved use of FRTM Surmat Veil [28] impregnated with TSWBTM
[29] as the face sheet surface coating; the second involved use of a modified matrix
additive, Fyrebloc 400 [30]. Both approaches have passed ASTM E-162 [31] and E-662
[32], and the first approach has passed the recent ASTM E-84 [33] as well [29]. The first
coating material apparently does not affect the properties of CSIPs, but the second
additive increases the bending stiffness of CSIPs and is likely to decrease its impact
resistance [34].

7
1.2.3.3 Finite Element Analysis on CSIPs
In addition to the tests conducted on CSIPs, there was also finite element
modeling performed by ANSYS as described below. No debonding or slipping was
considered in the modeling.
Floor Flexural Modeling. A finite element modeling of CSIP floor was created by
Vaidya [9] using ANSYS 10.0. The E-glass fiber face sheet was modeled with SHELL
99, and the EPS foam core was SOLID 186. The orthotropic face sheet was modeled by
defining local coordinates and assigning different values in different directions; the core
was regarded as isotropic. The model was validated using results of full-scale panel
flexural tests, the results of which were within acceptable variance. After validation, a
uniformly distributed load of 0.0024 N/mm2 (50 psf) was evaluated. Later, Mousa [16]
created similar finite element modeling for CSIP floor with ANSYS 12.0; the mid-span
strains from finite element analysis matched well with experiment values. In this
modeling, SOLID 45 was used for both the face sheet and the core. The span-to-depth
ratio was evaluated in a parametric study to give a design guide.
Wall Buckling Modeling. CSIP wall finite element modeling was created by Mousa [16]
with ANSYS 12.0 and was validated with results from a full-scale wall buckling test.
SOLID 45 was used for both the face sheet and the core. A comparison of mid-height
strains showed agreement between experimental results and modeling.
Windstorm Shelter Modeling. A windstorm shelter made of CSIP was modeled with
ANSYS 11.0 by Nguyen [15]. Unlike previous modeling, a layer stacking approach was
used to model the face sheet. Two layers were displayed bi-directionally to model the
orthotropic material. Element SOLID 191 for the face sheet and SOLID 95 for the core

8
were used. After analysis by Computational Fluid Dynamics, wind pressure was applied
to the shelter. The connection design was also evaluated. This modeling showed that
CSIP is an excellent material to resist extreme wind pressure.
1.3 Research Objectives & Outline
The research objectives of this study were to find the resistance capacity of CSIPs
under simulated stepwise and dynamic wind pressure tests, and to validate the finite
element modeling with the test results. The research outline was as follows.
• Summarize and analyze the stepwise and dynamic windstorm tests by converting
air pressure to wind velocity by ASCE 7-10, using appropriate probability
methods to determine exposure time for various designs.
• Validate the finite element modeling using the first second of the 1 PCF core
density CSIP in a dynamic windstorm test, and use the modeling to investigate
panel behaviors during long durations of stepwise and dynamic windstorm tests.

9
CHAPTER 2
EXPERIMENT CONFIGURATION
2.1 Test Panels
Five CSIPs were tested in a stepwise test and eight in a dynamic windstorm test, as
displayed in Table 3. Due to the limits of the test instrument, only one panel dimension of
145.8mm × 1219.2mm × 2438.4mm (5.74’’ × 4’ × 8’) was investigated. The thickness of
the face sheet was 3.04mm (0.12’’), and that of core was 139.7mm (5.5’’). Core densities
of 16.0 Kg/m3 (1 PCF) and 48.0Kg/m3 (3 PCF) were variables for the samples. Figure 1
shows the CSIP before being installed in the instrument. A hot knife was used to cut
sections of the foam, 50.8 mm (2’’) deep, out on both ends in order to nail in the wood
connection.
Table 3 Test samples
Panel Dimension Test TypeCore
Density Panel Type
Test Date
145.8mm × 1219.2mm × 2438.4mm (5.74” × 4’ × 8’)
Stepwise
16.0 Kg/m3
(1 PCF) S-0511-1 05/11/11
48.0Kg/m3 (3 PCF)
S-0506-3 05/06/11S-0511-3 05/11/11S-0512-3 05/12/11S-0513-3 05/13/11
Dynamic
16.0 Kg/m3 (1 PCF)
D-0926-1 09/26/11D-1003-1 10/03/11
48.0Kg/m3 (3 PCF)
D-0912-3 09/12/11D-0921-3 09/21/11D-1025-3 10/25/11D-1101-3 11/01/11D-1102-3 11/02/11D-1103-3 11/03/11

10
Figure 1 Panoramic view of CSIP sample
2.2 The testing apparatus: High Airflow Pressure Loading Actuator (HAPLA)
HAPLA, developed at the University of Florida, was used to generate simulated air
pressure. As shown in Figure 2, the HAPLA system was comprised of two 75-HP
Centrifugal Backward Inclined Class IV Single Width Single Inlet (SWSI) fans that could
be configured to operate in series or in parallel. Minimal air leakage was achieved by
operating them in series. The ducting and the air valve connected with each other at five
ports: supply (from fan), return (to fan), exhaust (open atmosphere), intake (open
atmosphere), and service (connecting to the test chamber). The amount of air traveling
from the test chamber to the exhaust (intake) port was modulated by the air valve. The air
leakage through the specimen was equivalent to the difference between the exhaust rate
and intake rate. The air valve was connected to a rotary actuation system, which consists

11
of a Metronix ARS2340 servo-positioning controller, a Sumimoto Drive Technologies
CHF 6135 Y-11 11:1 drive reduction, and a Metronix SBL-T6-2900 brushless servo
motor. A two-pole resolver in the motor provided positioning feedback. The pressure in
the chamber was controlled by a customized Labview 8.5 on a National Instruments PXI
system through a 100 Hz PID controller that received feedback from a pressure
transducer attached to the “airbox.” The test chamber was a stiff 2.4 m × 2.4 m × 0.3 m (8
ft x× 8 ft × 1 ft) hollow steel frame box lined with 14-gauge galvanized sheet steel on
five sides. The test specimen was placed on the sixth side, as shown in Figure 3 and
Figure 4. The CSIP was vertically installed, and the air inside the chamber was increased
slowly, creating horizontally distributed air pressure on the panel. A transparent plastic
membrane covering the sixth side of the airbox and a red rubber pipe along the edge of
the box were used to seal the chamber to prevent leaking. As indicated in Figure 5, the air
pressure in the chamber was measured through the small hole by use of a thin pipe
connecting to the data acquisition and control system [35].

12
Figure 2 High airflow pressure loading actuator [35]
Note: From “Water penetration resistance of residential window and wall systems subjected to steady and unsteady wind loading” by Lopez C., Masters, F. J., Bolton S., 2011, Building and Environment,46, p. 1333. Copyright 2011 by Elsevier Ltd. Reprinted with permission.

13
Figure 3 Front view of HAPLA
Figure 4 HAPLA with sample ready

14
Figure 5 Pressure Transducer
2.3 Boundary Conditions
Due to the limits of the HAPLA testing system, both the top and bottom
connections used the same assembly. Figure 6 and Figure 7 show the joint configuration
in detail. A hot knife was used to remove foam at the ends.
When cutting the foam with hot knife, the CSIP could be placed only horizontally.
The foam melted down due to gravity, which could produce an unsymmetrical bonding
between the two face sheets and the core. As shown in Figure 8, one side of the face sheet
disbonded slightly before the tests. It is possible that, during tests, this disbonding caused
earlier debonding failures. More details are presented in Chapter 5. Disbonding is due to
defects in manufacture and debonding is developed during loading.

15
Figure 6 Panel installation
Figure 7 Connection detail sketch
Figure 8 Disbonding

16
As stated previously, the foam core of the CSIP was 139.7 mm (5.5’’). In order to
fit it into the gap, 2” × 6” southern yellow pine lumber was used. As shown in Figure 9
and Figure 10, the wood connection was similar to the traditional wood wall assembly,
which can speed up construction because no new techniques are needed.
Figure 9 Connection details
Figure 10 Connection details side view

17
At both ends, the face sheet and the lumber were nailed together with a gas gun,
as shown in Figure 11.
Figure 11 Fastener details
2.4 Instrumentation Setup
Six strain gauges were attached at quarter points of both sides, as shown in Figure
13. The laser deflection measurement system on the black tripod monitored the mid-span
and provided a precision of 0.0001 inch. The lumber on the tripod made a perfect
horizontal angle for the laser. Figure 13 is a front view of all the instruments immediately
before a test. The yellow straps were used to keep the panel from crashing out when there
was a sudden connection failure at a high pressure; it did not touch the panel during tests.

18
To achieve minimal air leakage, several C-clamps were used to fix the sample onto the
chamber. All the stepwise and dynamic windstorm tests described in the thesis were led
and performed by the Co-PI of this project Dr. Forrest J. Masters, and his graduate
student, George Fernandez, from the University of Florida.
Figure 12 Strain gauges deployment

19
Figure 13 Instruments setup
20
CHAPTER 3
STEPWISE WINDSTORM TEST
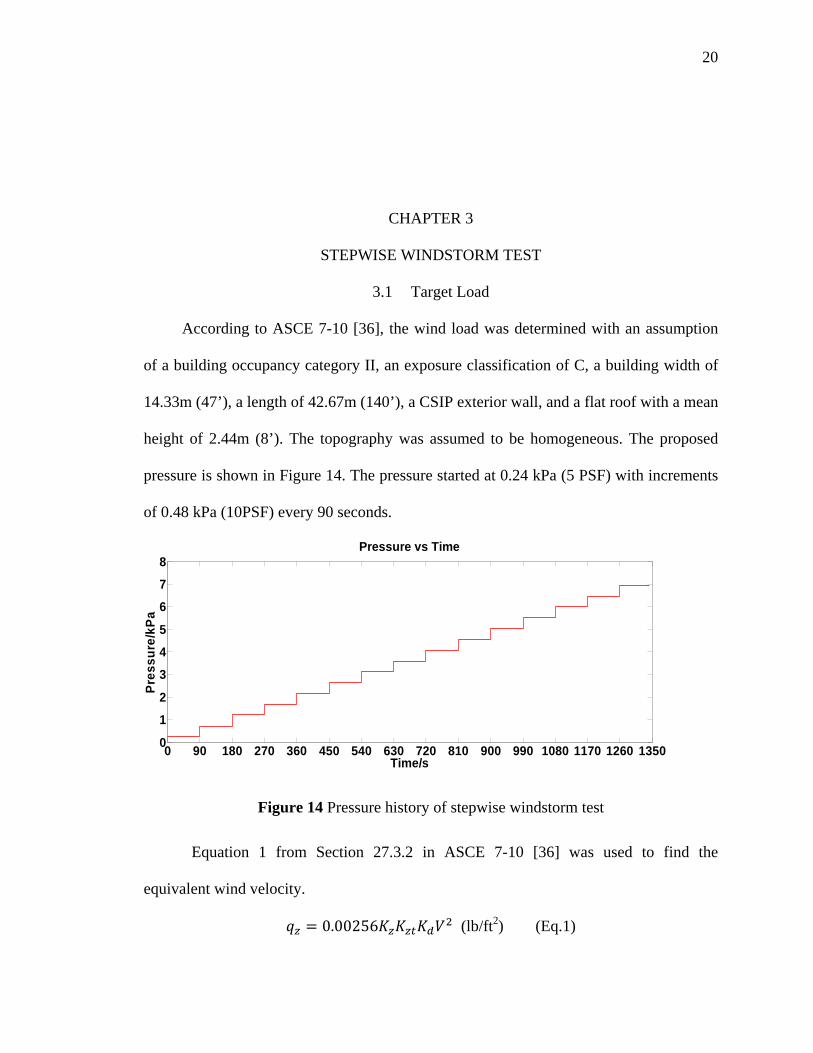
3.1 Target Load
According to ASCE 7-10 [36], the wind load was determined with an assumption
of a building occupancy category II, an exposure classification of C, a building width of
14.33m (47’), a length of 42.67m (140’), a CSIP exterior wall, and a flat roof with a mean
height of 2.44m (8’). The topography was assumed to be homogeneous. The proposed
pressure is shown in Figure 14. The pressure started at 0.24 kPa (5 PSF) with increments
of 0.48 kPa (10PSF) every 90 seconds.
Figure 14 Pressure history of stepwise windstorm test
Equation 1 from Section 27.3.2 in ASCE 7-10 [36] was used to find the
equivalent wind velocity. = 0.00256 (lb/ft2) (Eq.1)
0 90 180 270 360 450 540 630 720 810 900 990 1080 1170 1260 13500
1
2
3
4
5
6
7
8Pressure vs Time
Time/s
Pre
ss
ure
/kP
a

21
where
qz = velocity pressure from Figure 14
Kz = 0.85, velocity pressure exposure coefficient, see Section 26.6 in ASCE 7-10
Kzt = 1.0, topographic factor, see Section 26.8.2 in ASCE 7-10
Kd = 0.85, wind directionality factor, see Section 26.6 in ASCE 7-10
As determined by Equation 1, the highest wind velocity was 124.44 m/s (280
mph), at which point the pressure reached 6.94 kPa (145 PSF). 124.44 m/s (280 mph)
wind speed is considered to be an extreme wind load, which occurs in hurricanes and
tornadoes. Table 4 displays the corresponding wind velocity for the pressure of each step.
Compared to the highest basic wind speed of 80 m/s (180 mph) for inland US indicated
by Figure 26.5-1A in ASCE 7-10, the samples of this test bore greater pressure.
Table 4 Pressure to velocity conversion
Step # Pressure Wind Velocity 1 0.24 kPa (5 PSF) 23.24 m/s (52 mph) 2 0.72 kPa (15 PSF) 40.23 m/s (90 mph) 3 1.20 kPa (25 PSF) 51.85 m/s (116 mph) 4 1.68 kPa (35 PSF) 61.69 m/s (138 mph) 5 2.16 kPa (45 PSF) 69.73 m/s (156 mph) 6 2.64 kPa (55 PSF) 76.88 m/s (172 mph) 7 3.12 kPa (65 PSF) 83.59 m/s (187 mph) 8 3.60 kPa (75 PSF) 89.85 m/s (201 mph) 9 4.08 kPa (85 PSF) 95.66 m/s (214 mph) 10 4.56 kPa (95 PSF) 101.47 m/s (227 mph) 11 5.04 kPa (105 PSF) 106.39 m/s (238 mph) 12 5.52 kPa (115 PSF) 111.75 m/s (250 mph) 13 6.00 kPa (125 PSF) 116.22 m/s (260 mph) 14 6.48 kPa (135 PSF) 120.69 m/s (270 mph) 15 6.96 kPa (145 PSF) 124.44 m/s (280 mph)

22
3.2 Panel S-0511-1
As shown in Table 5, panel S-0511-1 was loaded up to 5.04 kPa (105 PSF), which
is equivalent to a wind velocity of 106.39 m/s (238 mph). The pressure was not in proper
control and fluctuating at the beginning, as seen in Figure 15. As indicated in Figure 16,
the sudden large deflection increase at the end of the test indicated that the bottom lumber
broke. The deflection at the failure moment was 9.63 cm. The approximate curvature of
the panel, depicted in Figure 17, refers to the recorded mid-span deflection. The intact top
plate and the cracked bottom plate are displayed in Figure 18 and Figure 19, respectively.
There was no damage to the EPS foam core. The interior face of the panel, which is the
compression side, showed considerable debonding at the bottom (Figure 20). Figure 21
shows all six strains at quarter points of both sides. The program recorded feedbacks,
including pressures, deflections, and strains at a frequency of 100 Hz.
Large volumes of data were generated in the test, including strain-related plots that
can hardly be seen without proper filtering because the strains did not vary appreciably
while pressure built up. The raw data overlaid each other and hid useful information.
There was a pressure increment every 90 seconds, and it took about 2 seconds for the
pressure to reach the next level, which means the pressure stayed “static” for 88 seconds
each period. Based on the periodic increment, a MatLab subroutine was used to process
the strain data collected directly from the experiment. As stated before, the irregular data
at the beginning reflects the corresponding poorly-controlled pressure. The strain gauge
at the exterior middle (SGEM) showed the largest tension before 3.60 kPa (75 PSF); the
strain gauges of exterior top (SGET) and bottom (SGEB) surpassed SGEM’s tension at
higher pressures. The strain gauge at the interior middle (SGIM) shows the largest

23
compression before 2.64 kPa (55 PSF); at higher pressures, the strain gauges at the
interior top (SGIT) and SGIM began to show decreasing compression and ended with
positive tension strain. The strain at SGIM ended a little higher than that at SGIT.
Throughout the test, the trace of the strain gauge at the interior bottom (SGIB) did not
change appreciably. The steady trace for SGIB after 3.60 kPa (75 PSF) reflects a large
deflection that broke the wire of that gauge; no more data were received after that point.
Table 5 S-0511-1 pressure to wind velocity conversion
Step # Pressure Wind Velocity 1 0.24 kPa (5 PSF) 23.24 m/s (52 mph) 2 0.72 kPa (15 PSF) 40.23 m/s (90 mph) 3 1.20 kPa (25 PSF) 51.85 m/s (116 mph) 4 1.68 kPa (35 PSF) 61.69 m/s (138 mph) 5 2.16 kPa (45 PSF) 69.73 m/s (156 mph) 6 2.64 kPa (55 PSF) 76.88 m/s (172 mph) 7 3.12 kPa (65 PSF) 83.59 m/s (187 mph) 8 3.60 kPa (75 PSF) 89.85 m/s (201 mph) 9 4.08 kPa (85 PSF) 95.66 m/s (214 mph) 10 4.56 kPa (95 PSF) 101.47 m/s (227 mph) 11 5.04 kPa (105 PSF) 106.39 m/s (238 mph)
Figure 15 S-0511-1 pressure history
0 90 180 270 360 450 540 630 720 810 900 990-2
-1
0
1
2
3
4
5
6Pressure vs Time
Time/s
Pre
ss
ure
/kP
a
TargetMeasured

24
Figure 16 S-0511-1 deflection plot
0 90 180 270 360 450 540 630 720 810 900 990-10
4
8
12
16
20
24Deflection vs Time
Time/s
Defl
ecti
on
/cm

25
Figure 17 S-0511-1 curvature

26
Figure 18 S-0511-1 top connection
Figure 19 S-0511-1 bottom connection

27
Figure 20 S-0511-1 debonding sketch
Figure 21 S-0511-1 strain plot
3.3 Panel S-0506-3
As shown in Table 6, the lateral distributed load for panel S-0506-3 increased to
6.48 kPa (135 PSF), which simulated a 120.69 m/s (270 mph) wind speed. As displayed
in Figure 22, there was poor control in the later periods; the last period dropped instead of
increasing. The inadequate control caused the coarse deflection curve shown in Figure
0 0.5 1 1.5 2 2.5 3 3.5 4 4.5 5-200
0
200
400
600
800
Pressure/kPa
Str
ain
/1E
-6
Strain vs Pressure
SGITSGIMSGIBSGETSGEMSGEB

28
23; the failure deflection was 10.03 cm. Figure 24 illustrates the panel deflection at each
pressure stage. For this panel, the top plate cracked through (Figure 25). There was only a
small, short crevice at the bottom plate (Figure 26). Debonding occurred at all corners on
both sides (Figure 27). As shown by the strain pressure plot (Figure 28), the values for
SGEM were consistently higher, with increasing tension relative to those for SGET and
SGEB, which show matched strains at each stage. The SGIM also had the largest
compression strain among the interior three strain gauges until 3.12 kPa (65 PSF) was
reached. The wires of SGIM and SIGB broke at that point, and the wire of SGIT broke at
5.04 kPa (105 PSF). The SGIT showed an increasing trend after 3.12 kPa (65 PSF) and
ended up tension.
Table 6 S-0506-3 pressure to wind velocity conversion
Step # Pressure Wind Velocity 1 0.24 kPa (5 PSF) 23.24 m/s (52 mph) 2 0.72 kPa (15 PSF) 40.23 m/s (90 mph) 3 1.20 kPa (25 PSF) 51.85 m/s (116 mph) 4 1.68 kPa (35 PSF) 61.69 m/s (138 mph) 5 2.16 kPa (45 PSF) 69.73 m/s (156 mph) 6 2.64 kPa (55 PSF) 76.88 m/s (172 mph) 7 3.12 kPa (65 PSF) 83.59 m/s (187 mph) 8 3.60 kPa (75 PSF) 89.85 m/s (201 mph) 9 4.08 kPa (85 PSF) 95.66 m/s (214 mph) 10 4.56 kPa (95 PSF) 101.47 m/s (227 mph) 11 5.04 kPa (105 PSF) 106.39 m/s (238 mph) 12 5.52 kPa (115 PSF) 111.75 m/s (250 mph) 13 6.00 kPa (125 PSF) 116.22 m/s (260 mph) 14 6.48 kPa (135 PSF) 120.69 m/s (270 mph)

29
Figure 22 S-0506-3 pressure history
Figure 23 S-0506-3 deflection plot
0 90 180 270 360 450 540 630 720 810 900 990 1080 1170 1260 13500
1
2
3
4
5
6
7
8Pressure vs Time
Time/s
Pre
ss
ure
/kP
a
TargetMeasured
0 90 180 270 360 450 540 630 720 810 900 990 1080 1170 1260 13500
4
8
12
16
20
24Deflection vs Time
Time/s
De
fle
cti
on
/cm

30
Figure 24 S-0506-3 curvature

31
Figure 25 S-0506-3 top connection
Figure 26 S-0506-3 bottom connection

32
Figure 27 S-0506-3 debonding sketch
Figure 28 S-0506-3 strain plot
3.4 Panel S-0511-3
As shown in Table 7, panel S-0511-3 experienced failure at a pressure of 4.56 kPa
(95 PSF), which is equivalent to a 101.47 m/s (227 mph) wind speed. As determined
from the pressure trace (Figure 29), it was in relatively good control. The deflection plot
0 1 2 3 4 5 6 7-400
-200
0
200
400
600
800
1000
Pressure/kPa
Str
ain
/1E
-6
Strain vs Pressure
SGITSGIMSGIBSGETSGEMSGEB

33
(Figure 30) is smooth; the panel achieved a deflection of 6.27 cm before failure. The
deflection curvature of the panel at all ten pressure stages is plotted in Figure 31. As seen
in Figure 32 and Figure 33, the top plate was in good condition, but the bottom plate
cracked through. Large debondings were evident in three corners of the interior side
(Figure 34). As shown in Figure 35, SGEM consistently had the largest tension strain,
although the values for SGEB increased at pressures greater than 2.64 kPa (55 PSF). At
this point, values for SGET decreased below those for the other exterior strain gauges.
Values for the three interior gauges began to increase at 2.16 kPa (45 PSF) and showed
tension at the end. The SGIM consistently displayed the largest compression strain.
Table 7 S-0511-3 pressure to wind velocity conversion
Step # Pressure Wind Velocity 1 0.24 kPa (5 PSF) 23.24 m/s (52 mph) 2 0.72 kPa (15 PSF) 40.23 m/s (90 mph) 3 1.20 kPa (25 PSF) 51.85 m/s (116 mph) 4 1.68 kPa (35 PSF) 61.69 m/s (138 mph) 5 2.16 kPa (45 PSF) 69.73 m/s (156 mph) 6 2.64 kPa (55 PSF) 76.88 m/s (172 mph) 7 3.12 kPa (65 PSF) 83.59 m/s (187 mph) 8 3.60 kPa (75 PSF) 89.85 m/s (201 mph) 9 4.08 kPa (85 PSF) 95.66 m/s (214 mph) 10 4.56 kPa (95 PSF) 101.47 m/s (227 mph)

34
Figure 29 S-0511-3 pressure history
Figure 30 S-0511-3 deflection plot
0 90 180 270 360 450 540 630 720 810 9000
1
2
3
4
5Pressure vs Time
Time/s
Pre
ss
ure
/kP
a
TargetMeasured
0 90 180 270 360 450 540 630 720 810 9000
3
6
9
12
15
18
21Deflection vs Time
Time/s
De
fle
cti
on
/cm

35
Figure 31 S-0511-3 curvature

36
Figure 32 S-0511-3 top connection
Figure 33 S-0511-3 bottom connection

37
Figure 34 S-0511-3 debonding sketch
Figure 35 S-0511-3 strain plot
3.5 Panel S-0512-3
Throughout all 15 pressure stages, no failure occurred in panel S-0512-3, as shown
in Table 8. The panel held its position at the highest pressure of 6.96 kPa (145 PSF),
which is equivalent to a wind speed of 124.44 m/s (280 mph). Figure 36 and Figure 37
show the pressure and deflection plots. The deflection curve is smooth for the first
0 0.5 1 1.5 2 2.5 3 3.5 4 4.5 5-300
-200
-100
0
100
200
300
400
500
600
700
Pressure/kPa
Str
ain
/1E
-6
Strain vs Pressure
SGITSGIMSGIBSGETSGEMSGEB

38
several periods. The curve spiked as the pressure increased, but the values showed good
control, and the variation was not substantial. The largest deflection reached by the panel
was 11.38 cm. Figure 38 plots the curvature of the panel at each pressure stage. As shown
in Figure 39 and Figure 40, both the top and bottom plates are intact after the test, but
debonding was evident at three corners of both sides (Figure 41). As demonstrated by the
strain plots (Figure 42), SGEM had the largest tension strain throughout the test, and
values for SGEB were somewhat higher than those for SGET. SGIM showed the largest
compression strain, which was slightly higher than for SGIT. Instead of compression,
SGIB showed an increasing tension strain almost from the beginning. Plots for the
interior strain gauges began to move upward after 2.64 kPa (55 PSF). The changes for
SGIT and SGIM were more obvious. At higher pressures, interior stains increased at a
slower rate. Exterior strains were also decreased at pressures higher than 4.08 kPa (85
PSF).
Table 8 S-0512-3 pressure to wind velocity conversion
Step # Pressure Wind Velocity 1 0.24 kPa (5 PSF) 23.24 m/s (52 mph) 2 0.72 kPa (15 PSF) 40.23 m/s (90 mph) 3 1.20 kPa (25 PSF) 51.85 m/s (116 mph) 4 1.68 kPa (35 PSF) 61.69 m/s (138 mph) 5 2.16 kPa (45 PSF) 69.73 m/s (156 mph) 6 2.64 kPa (55 PSF) 76.88 m/s (172 mph) 7 3.12 kPa (65 PSF) 83.59 m/s (187 mph) 8 3.60 kPa (75 PSF) 89.85 m/s (201 mph) 9 4.08 kPa (85 PSF) 95.66 m/s (214 mph) 10 4.56 kPa (95 PSF) 101.47 m/s (227 mph) 11 5.04 kPa (105 PSF) 106.39 m/s (238 mph) 12 5.52 kPa (115 PSF) 111.75 m/s (250 mph) 13 6.00 kPa (125 PSF) 116.22 m/s (260 mph) 14 6.48 kPa (135 PSF) 120.69 m/s (270 mph) 15 6.96 kPa (145 PSF) 124.44 m/s (280 mph)

39
Figure 36 S-0512-3 pressure history
Figure 37 S-0512-3 deflection plot
0 90 180 270 360 450 540 630 720 810 900 990 1080 1170 1260 13500
1
2
3
4
5
6
7
8Pressure vs Time
Time/s
Pre
ss
ure
/kP
a
TargetMeasured
0 90 180 270 360 450 540 630 720 810 900 990 1080 1170 1260 13500
2
4
6
8
10
12
14Deflection vs Time
Time/s
De
fle
cti
on
/cm

40
Figure 38 S-0512-3 curvature

41
Figure 39 S-0512-3 top connection
Figure 40 S-0512-3 bottom connection

42
Figure 41 S-0512-3 debonding sketch
Figure 42 S-0512-3 strain plot
3.6 Panel S-0513-3
Panel S-0513-3 experienced the same pressure stages until, as shown in Table 9, it
failed at 5.04 kPa (105 PSF), which is equivalent to a 106.39 m/s (238 mph) wind speed.
Figure 43 shows the effective control of pressure, as does Figure 44, which displays a
smooth deflection curve. The panel failed at a mid-span deflection of 8.18 cm. The panel
0 1 2 3 4 5 6 7-200
0
200
400
600
800
Pressure/kPa
Str
ain
/1E
-6
Strain vs Pressure
SGITSGIMSGIBSGETSGEMSGEB

43
curvature at each stage is illustrated in Figure 45. As demonstrated in Figure 46, value for
SGEM was larger than those for other strain gauges. Its tension strain increased at a
constant speed, while values for SGET and SGEB matched each other, and the tension
strains increased at the same speed. There were three paths for each of the interior strain
gauges. SGIM had the largest tension strain from beginning to end. The compression
strain value was lower for SGIT, and there was only slight compression for SGIB. At
pressures greater than 1.20 kPa (25 PSF), all three interior strain gauges showed
decreases in compression, which reflected increases in tension at a low speed. In regard
to the failure of this panel, the bottom plate cracked through at the end of the test. After
failure, the panel was stuck in the steel frame, requiring force to remove it. Thus, no
pictures were taken, and no debonding lengths were measured after unloading.
Table 9 S-0513-3 pressure to wind velocity conversion
Step # Pressure Wind Velocity 1 0.24 kPa (5 PSF) 23.24 m/s (52 mph) 2 0.72 kPa (15 PSF) 40.23 m/s (90 mph) 3 1.20 kPa (25 PSF) 51.85 m/s (116 mph) 4 1.68 kPa (35 PSF) 61.69 m/s (138 mph) 5 2.16 kPa (45 PSF) 69.73 m/s (156 mph) 6 2.64 kPa (55 PSF) 76.88 m/s (172 mph) 7 3.12 kPa (65 PSF) 83.59 m/s (187 mph) 8 3.60 kPa (75 PSF) 89.85 m/s (201 mph) 9 4.08 kPa (85 PSF) 95.66 m/s (214 mph) 10 4.56 kPa (95 PSF) 101.47 m/s (227 mph) 11 5.04 kPa (105 PSF) 106.39 m/s (238 mph)

44
Figure 43 S-0513-3 pressure history
Figure 44 S-0513-3 deflection plot
0 90 180 270 360 450 540 630 720 810 900 9900
1
2
3
4
5
6Pressure vs Time
Time/s
Pre
ssu
re/k
Pa
TargetMeasured
0 90 180 270 360 450 540 630 720 810 900 9900
3
6
9
12
15
18Deflection vs Time
Time/s
De
fle
cti
on
/cm

45
Figure 45 S-0513-3 curvature

46
Figure 46 S-0513-3 strain plot
3.7 Results
For the panels, Table 10 contains a summary of failure details, including panel
number, failure mode, failure pressure, failure wind velocity, and failure deflection. The
failure deflections were chosen from the end of each 90-second period. A view of these
deflections at the end of every period is in Figure 47.
Table 10 Details of stepwise windstorm test
Panel # Damage Mode Final
Pressure Final Wind
Velocity Final
Deflection
S-0511-1 Bottom lumber failure,
interior bottom debonding 5.04 kPa
(105 PSF) 106.39 m/s (238 mph)
9.63 cm
S-0506-3
Top lumber failure, bottom lumber partial cracking,
debonding on 4 corners of both sides
6.48 kPa (135 PSF)
120.69 m/s (270 mph)
10.03 cm
S-0511-3 Bottom lumber failure,
debonding on 3 corners of interior side
4.56 kPa (95 PSF)
101.47 m/s (227 mph)
6.27 cm
S-0512-3 Debonding on 3 corners of
both sides 6.96 kPa
(145 PSF) 124.44 m/s (280 mph)
11.38 cm
S-0513-3 Bottom lumber failure 5.04 kPa
(105 PSF) 106.39 m/s (238 mph)
8.18 cm
0 0.5 1 1.5 2 2.5 3 3.5 4 4.5 5-400
-200
0
200
400
600
Pressure/kPa
Str
ain
/1E
-6
Strain vs Pressure
SGITSGIMSGIBSGETSGEMSGEB

47
Figure 47 Deflection plots of stepwise windstorm test
3.8 Discussion
• Because the curve slope is consistent and no evident permanent deformation was
found after removing the CSIPs from the frame, the materials work within elastic
range.
• As seen in Table 10, S-0511-1, S-0511-3, and S-0513-3 have the same failure
mode of bottom lumber failure. Both S-0511-1 and S-0511-3 have large
debonding at the interior bottom side. It is obvious that plate failure can cause
debonding at the moment of cracking, but there is not enough evidence to show
the reverse process. Although the failure details of S-0513-3, such as debonding
lengths, are not available, there is a good probability that at least the interior
bottom debonds considerably.

48
• S-0506-3 suffered the most serious damage, where its top lumber failed, the
bottom one cracked partially, and all corners of both sides debonded. The
deflection drop at 85 PSF reflects the poor pressure control corresponding to
Figure 25. On the other hand, the fluctuating control may explain the extensive
damage.
• In the stepwise windstorm tests, S-0512-3 was the strongest sample. It remained
intact through all fifteen pressure steps. Neither of the plates was damaged,
although three corners of both sides debonded appreciably. As Figure 50 shows,
its deflection slope changed slightly after 45 PSF, which may indicate developing
damages such as debonding. The consistent deflection slope suggests the potential
of the panel to deflect more.
• Nearly all strain gauges on the compression side showed decreasing compression
after reaching pressures of 2 to 3 kPa. A reasonable assumption is that the face
sheet wrinkled at the location of strain gauge on the compression side [37], but
this assumption cannot be confirmed at present because the compression side is
inside the chamber and is difficult to observe during tests.
3.9 Summary
• The materials in CSIPs were strong enough that everything worked within the
elastic range in all stepwise tests.
• On the average, the CSIP with 1 PCF core density deflected more than those with
3 PCF core densities at each pressure step.
• From the test results, conclusions are that the proposed CSIPs are able to
withstand equivalent wind velocities at least as high as 101.47 m/s (227 mph), and

49
that it is reasonable to expect more potential from the performance of the panel of
S-0512-3.
• The bonding strength between the face sheet and core was set to equal to the
tensile strength of the core. However, the test proves the link is weaker than the
tensile strength, because there was no damage to the core.
• Although debonding was evident in every test, it did not significantly influence
the deflection.
• The CSIP is strong and ductile enough to bear large surface pressures, but the
wood connection is probably the weakest part of the structure. An improved
connection is expected to be found in future research.
• Due to the limited quantity of 1 PCF core density panel for this test, more 1 PCF
core density panels are expected to be tested in order to produce more convincing
results.
• In order to prove the assumption about the decreasing compression, measures will
be taken in future tests, such as placing more strain gauges on the compression
side to see if they have consistent results or using an infrared camera to capture
the wrinkling during tests.

50
CHAPTER 4
DYNAMIC WINDSTORM TEST
4.1 Target Load
In real life, the pressure produced by windstorms changes continuously. Fast-
changing pressure sometimes is more destructive to structures than a small-variation,
long-term load. In a hurricane or tornado, under repetitive pressure, the buildings are
susceptible to fatigue failure. From the Aerodynamic Database of National Institute of
Standards and Technology (NIST), the load histories were obtained. These are from
boundary layer wind-tunnel tests on scale building models. The load not only acts as
wind pressure to simulate the real scenario, but also tests the fatigue-resistance of CSIP.
The pressure history obtained from the database is shown in Figure 48. There were
sixteen peak loads. Each peak load was considered as one stage, and the duration of each
stage varied from approximately 500 seconds to 800 seconds. The higher the peak
pressure, the shorter the stage duration, which is realistic. Except for the first stage, which
had no trough pressure, each later stage contained one trough pressure, one minor peak
pressure, and one major peak pressure. The minor peak was smaller than the two major
peaks beside it. The last six stages were repeated high pressure periods, during which the
same pressure was applied six times. Due to the limit of the HAPLA system, an instant
high pressure after stage 7 was not available, which means the repeated high pressure
period was seven to sixteen in the field tests and that the trough pressure was not reached

51
in any of the stages. Using Equation 1, the equivalent wind velocity for corresponding
major peak pressure was converted (Table 11). All panels with 3 PCF core densities were
supposed to go through all sixteen stages, and the first eight stages were enough for
panels with 1 PCF core.
Figure 48 Pressure history of dynamic windstorm test
Table 11 Pressure to velocity conversion
Step # Pressure Wind Velocity 1 1.50 kPa (31.25 PSF) 58.10 m/s (130 mph) 2 1.83 kPa (38.12 PSF) 64.18 m/s (144 mph) 3 2.17 kPa (45.21 PSF) 69.88 m/s (156 mph) 4 2.55 kPa (53.12 PSF) 75.76 m/s (169 mph) 5 2.96 kPa (61.67 PSF) 81.62 m/s (183 mph) 6 3.38 kPa (70.42 PSF) 87.22 m/s (195 mph) 7 3.83 kPa (79.79 PSF) 92.84 m/s (208 mph) 8 4.28 kPa (89.17 PSF) 98.15 m/s (220 mph) 9 4.75 kPa 98.96 PSF) 103.39 m/s (231 mph) 10 5.24 kPa (109.17 PSF) 108.60 m/s (243 mph)
11-16 5.74 kPa (119.58 PSF) 113.66m/s (254 mph)
0 1000 2000 3000 4000 5000 6000 7000 8000 9000 10000 110000
1
2
3
4
5
6Pressure vs Time
Time/s
Pre
ss
ure
/kP
a

52
4.2 Validation for Exposure Time of Fatigue Load
As stated above, the load data were collected from the aerial dynamic database in
NIST. In order to quantitatively prove the capability of the dynamic windstorm test, the
Rayleigh distribution was employed to provide the theoretical exposure time of the
dynamic load, which means fatigue load as well, in a 500-year return period [38]. The
Rayleigh probability distribution function is displayed here. ( ) = 1 − exp − ( ) (Eq.2)
Where:
P (V) = the probability of a wind gust of a given speed or less occurring at a given
moment
V = the wind speed under consideration V = the average mean wind speed for the location under consideration
Thus:
[1-P (V)]*Lifetime = Probable exposure time at or above a given wind velocity
The Rayleigh distribution is a special form of the Weibull probability distribution,
which is typically used to model the probability of occurrence for certain wind velocities,
with a shape factor of 2.0 and constant ratio of standard deviation to mean value. In this
case, a 500-year return period, a 170 mph design wind speed, and a mean annual wind
speed of 13.7 mph were used to determine the probable exposure time. The 170 mph
wind speed is the largest value in Figure 49. The predicted exposure times are displayed
in Table 12.

53
Figure 49 Model estimated 500-year return period 3 sec gust wind speeds at a height of 10 m in open terrain including wind modeling uncertainty [39]
Note: From “U.S. hurricane wind speed risk and uncertainty” by Vickery, P. J., Wadhera, D., Twisdale, L. A., Lavelle, F. M., 2009, Journal of Structural Engineering, 135, 3, p. 318. Copyright 2009 by ASCE Reprinted with permission.

54
Table 12 Rayleigh probability of exposure at or above given wind speed
Percent of 170 mph Design Wind Speed
Given Wind Speed / mph
Probability Probable Exposure
Time / s
30% 51 0.0018756% 295739 35% 60 0.0000287% 4523 40% 68 0.0000004% 62 50% 85 0.0000000% 0 60% 102 0.0000000% 0 70% 119 0.0000000% 0 80% 136 0.0000000% 0 90% 153 0.0000000% 0 100% 170 0.0000000% 0 110% 187 0.0000000% 0 122% 208 0.0000000% 0
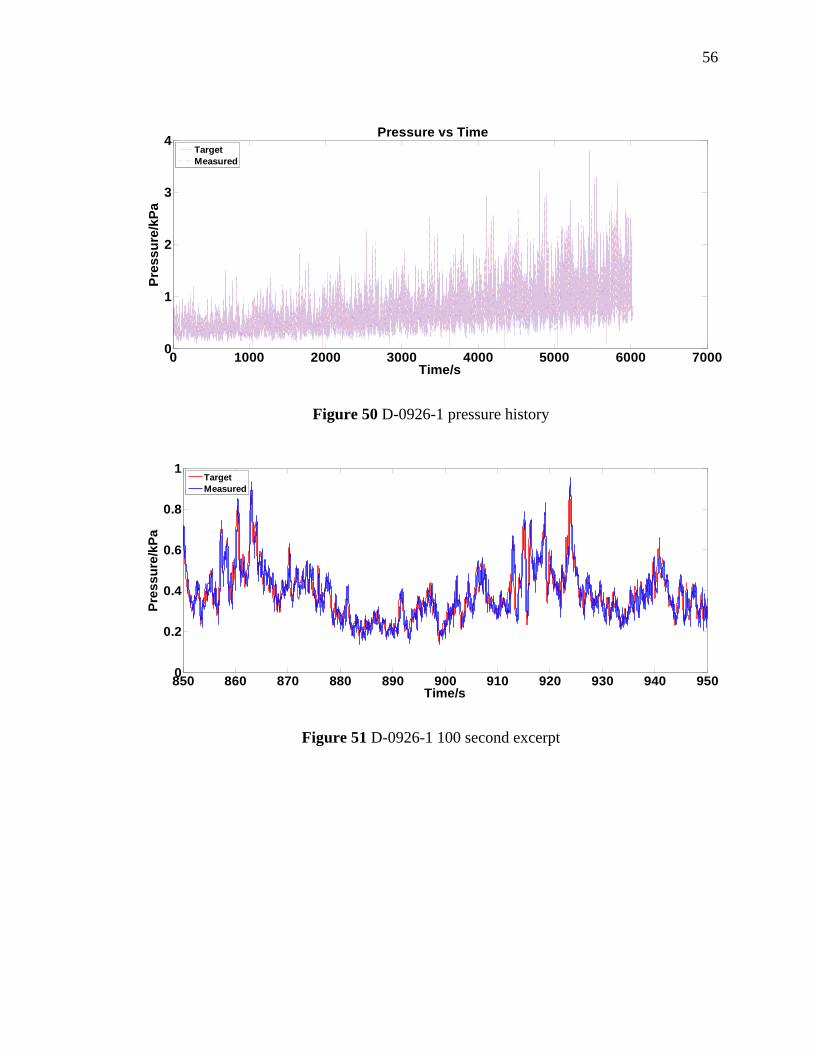
4.3 Panel D-0926-1
Panel D-0926-1 experienced seven whole stages and part of the eighth stage. As
Table 13 displays, this panel withstood an equivalent wind velocity as high as 92.84 m/s
(208 mph). Table 14 shows the actual exposure time at or above different percentages of
design wind speed. The eighth stage did not finish because a major peak pressure was
omitted. The duration of pressure (Figure 50) was slightly more than 6000 seconds. The
data for Figure 51 was excerpted from 850 seconds to 950 seconds in order to show the
controlled load path. The mid-span deflection reached 12 cm at the end the test (Figure
52). The first deflection jump, at about 5500 seconds was caused by the seventh peak
pressure of about 3.8 kPa at the corresponding point in Figure 50. Before the end of the
test, the deflection curve continually reached 12 cm, which may reflect a developing
failure. To provide a clearer view of the panel deflection, the deflection value at the end

55
of each stage was used to plot Figure 53, which gives a more apparent side view of the
panel curvature. The debonding lengths are illustrated in Figure 54.
Table 13 D-0926-1 pressure to velocity conversion
Step # Pressure Wind Velocity 1 1.50 kPa (31.25 PSF) 58.10 m/s (130 mph) 2 1.83 kPa (38.12 PSF) 64.18 m/s (144 mph) 3 2.17 kPa (45.21 PSF) 69.88 m/s (156 mph) 4 2.55 kPa (53.12 PSF) 75.76 m/s (169 mph) 5 2.96 kPa (61.67 PSF) 81.62 m/s (183 mph) 6 3.38 kPa (70.42 PSF) 87.22 m/s (195 mph) 7 3.83 kPa (79.79 PSF) 92.84 m/s (208 mph)
Table 14 D-0926-1 exposure at or above given wind speed
Percent of 170 mph Design Wind Speed
Given Wind Speed / mph
Predicted Probable Exposure Time / s
Actual Exposure Time / s
35% 60 4523 5572.91 40% 68 62 4882.26 50% 85 0 2955.99 60% 102 0 1362.49 70% 119 0 460.01 80% 136 0 116.20 90% 153 0 23.05 100% 170 0 3.84 110% 187 0 0.72 122% 208 0 0.01
56
Figure 50 D-0926-1 pressure history
Figure 51 D-0926-1 100 second excerpt
0 1000 2000 3000 4000 5000 6000 70000
1
2
3
4Pressure vs Time
Time/s
Pre
ss
ure
/kP
a
TargetMeasured
850 860 870 880 890 900 910 920 930 940 9500
0.2
0.4
0.6
0.8
1
Time/s
Pre
ss
ure
/kP
a
TargetMeasured

57
Figure 52 D-0926-1deflection plot
0 1000 2000 3000 4000 5000 6000 70000
2
4
6
8
10
12
14Deflection vs Time
Time/s
De
fle
cti
on
/cm

58
Figure 53 D-0926-1 curvature

59
Figure 54 D-0926-1 debonding sketch
4.4 Panel D-1003-1
Panel D-1003-1 went through eight entire stages (Table 15). Table 16 shows the
actual exposure time at or above different percentages of design wind speed. As shown in
Figure 55, and, as stated before, the peak pressure of the eighth stage was not reached,
but a same load track as stage seven was accomplished instead, which means the repeated
high pressure period started from stage seven instead of theoretical stage eleven. Figure
56 shows an excerpt between 850 seconds and 950 seconds; the pressure path was
consistent in comparison to Figure 51. The difference between target pressure and
measured pressure was within tolerance. Figure 57 and Figure 58 show a deflection
increase from 12 cm to more than 20 cm at the end of the test. The deflection jump
corresponded to a severe connection failure. The bottom plate broke into two pieces
longitudinally, and there was a partial crack in the top plate. Debonding was large at the
interior bottom and exterior top corners, as shown in Figure 59. The 355.6-mm (14

60
inches) debonding at the top exterior was not a typical failure pattern, because it was not
observed in any other tests.
Table 15 D-1003-1 pressure to velocity conversion
Step # Pressure Wind Velocity 1 1.50 kPa (31.25 PSF) 58.10 m/s (130 mph) 2 1.83 kPa (38.12 PSF) 64.18 m/s (144 mph) 3 2.17 kPa (45.21 PSF) 69.88 m/s (156 mph) 4 2.55 kPa (53.12 PSF) 75.76 m/s (169 mph) 5 2.96 kPa (61.67 PSF) 81.62 m/s (183 mph) 6 3.38 kPa (70.42 PSF) 87.22 m/s (195 mph)
7-8 3.83 kPa (79.79 PSF) 92.84 m/s (208 mph)
Table 16 D-1003-1 exposure at or above given wind speed
Percent of 170 mph Design Wind Speed
Given Wind Speed / mph
Predicted Probable Exposure Time / s
Actual Exposure Time / s
35% 60 4523 5668.06 40% 68 62 4979.42 50% 85 0 3073.76 60% 102 0 1481.60 70% 119 0 538.01 80% 136 0 144.16 90% 153 0 31.96 100% 170 0 5.60 110% 187 0 1.62 122% 208 0 0.03

61
Figure 55 D-1003-1 pressure history
Figure 56 D-1003-1 100 second excerpt
0 1000 2000 3000 4000 5000 6000 70000
1
2
3
4
5Pressure vs Time
Time/s
Pre
ss
ure
/kP
a
TargetMeasured
850 860 870 880 890 900 910 920 930 940 9500
0.2
0.4
0.6
0.8
1Pressure vs Time
Time/s
Pre
ss
ure
/kP
a
TargetMeasured

62
Figure 57 D-1003-1deflection plot
0 1000 2000 3000 4000 5000 6000 70000
4
8
12
16
20
24Deflection vs Time
Time/s
De
fle
cti
on
/cm

63
Figure 58 D-1003-1curvature

64
Figure 59 D-1003-1 debonding sketch
4.5 Panel D-0912-3
The 3-PCF core density panel D-0912-3 was structurally intact after all sixteen
stages, among which are the first six increasing stages and the ten repeated high-pressure
stages as shown in Table 17 and Figure 60. Table 18 shows the exposure time at or above
different percentages of design wind speed. Figure 61 shows the consistency of the load
track in the 100-second period. There was a deflection jump at about 7500 seconds
(Figure 62), which is at the end of the tenth pressure stage and in the middle of the
repeated high-pressure period. The deflection trace was almost flat before and after the
sudden increase. The deflections were the same for stages eleven to fourteen, which made
the curvature plots overlay each other. The mid-span point of the last panel curvature
(Figure 63) was 10 cm. Because both end lumbers showed no damage, and there was no
debonding (Figure 64), some bubbling and/or wrinkling may have occurred in the middle
of the panel, where it could not be seen.

65
Table 17 D-0912-3 pressure to velocity conversion
Step # Pressure Wind Velocity 1 1.50 kPa (31.25 PSF) 58.10 m/s (130 mph) 2 1.83 kPa (38.12 PSF) 64.18 m/s (144 mph) 3 2.17 kPa (45.21 PSF) 69.88 m/s (156 mph) 4 2.55 kPa (53.12 PSF) 75.76 m/s (169 mph) 5 2.96 kPa (61.67 PSF) 81.62 m/s (183 mph) 6 3.38 kPa (70.42 PSF) 87.22 m/s (195 mph)
7-16 3.83 kPa (79.79 PSF) 92.84 m/s (208 mph)
Table 18 D-0912-3 exposure at or above given wind speed
Percent of 170 mph Design Wind Speed
Given Wind Speed / mph
Predicted Probable Exposure Time / s
Actual Exposure Time / s
35% 60 4523 9948.69 40% 68 62 9261.30 50% 85 0 7292.79 60% 102 0 5384.29 70% 119 0 3538.02 80% 136 0 1859.83 90% 153 0 730.45 100% 170 0 229.49 110% 187 0 73.81 122% 208 0 9.77
Figure 60 D-0912-3 pressure history
0 1000 2000 3000 4000 5000 6000 7000 8000 9000 10000 110000
1
2
3
4
5
6Pressure vs Time
Time/s
Pre
ss
ure
/kP
a
TargetMeasured

66
Figure 61 D-0912-3 100 second excerpt
Figure 62 D-0912-3 deflection plot
850 860 870 880 890 900 910 920 930 940 9500
0.2
0.4
0.6
0.8
1
Time/s
Pre
ss
ure
/kP
a
TargetMeasured
0 1000 2000 3000 4000 5000 6000 7000 8000 9000 10000 110000
2
4
6
8
10
12Deflection vs Time
Time/s
Defl
ecti
on
/cm

67
Figure 63 D-0912-3 curvature
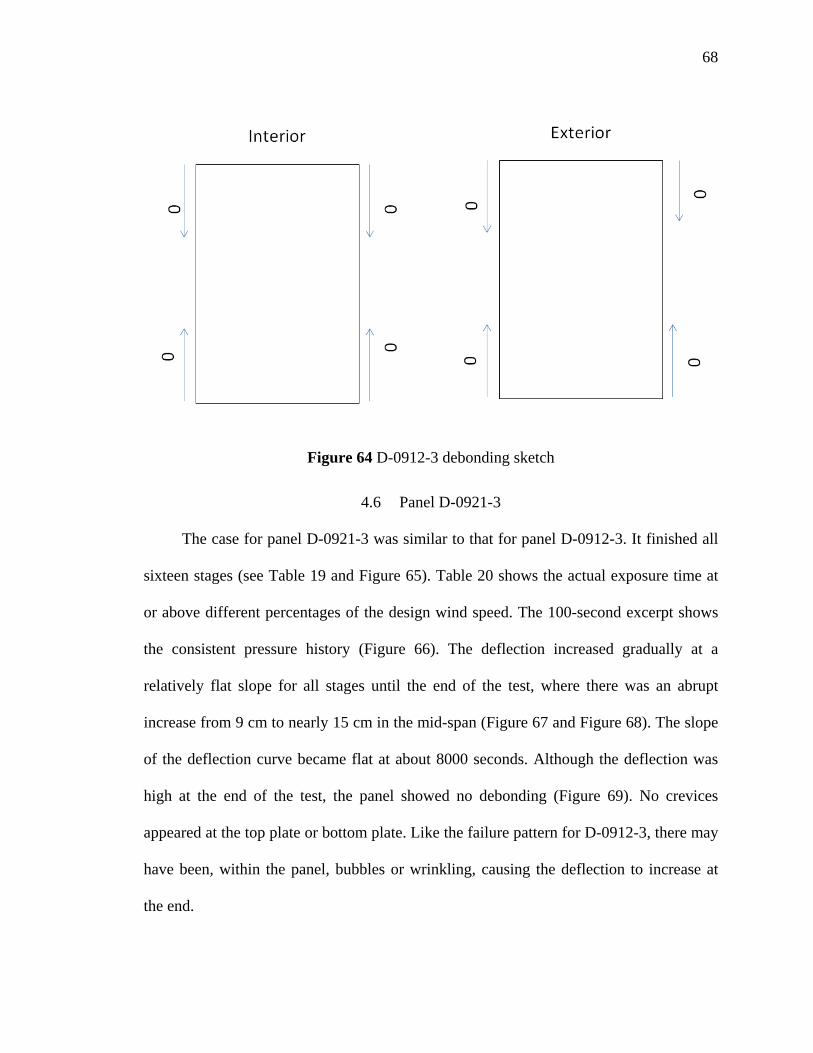
68
Figure 64 D-0912-3 debonding sketch
4.6 Panel D-0921-3
The case for panel D-0921-3 was similar to that for panel D-0912-3. It finished all
sixteen stages (see Table 19 and Figure 65). Table 20 shows the actual exposure time at
or above different percentages of the design wind speed. The 100-second excerpt shows
the consistent pressure history (Figure 66). The deflection increased gradually at a
relatively flat slope for all stages until the end of the test, where there was an abrupt
increase from 9 cm to nearly 15 cm in the mid-span (Figure 67 and Figure 68). The slope
of the deflection curve became flat at about 8000 seconds. Although the deflection was
high at the end of the test, the panel showed no debonding (Figure 69). No crevices
appeared at the top plate or bottom plate. Like the failure pattern for D-0912-3, there may
have been, within the panel, bubbles or wrinkling, causing the deflection to increase at
the end.

69
Table 19 D-0921-3 pressure to velocity conversion
Step # Pressure Wind Velocity 1 1.50 kPa (31.25 PSF) 58.10 m/s (130 mph) 2 1.83 kPa (38.12 PSF) 64.18 m/s (144 mph) 3 2.17 kPa (45.21 PSF) 69.88 m/s (156 mph) 4 2.55 kPa (53.12 PSF) 75.76 m/s (169 mph) 5 2.96 kPa (61.67 PSF) 81.62 m/s (183 mph) 6 3.38 kPa (70.42 PSF) 87.22 m/s (195 mph)
7-16 3.83 kPa (79.79 PSF) 92.84 m/s (208 mph)
Table 20 D-0921-3 exposure at or above given wind speed
Percent of 170 mph Design Wind Speed
Given Wind Speed / mph
Predicted Probable Exposure Time / s
Actual Exposure Time / s
35% 60 4523 9911.65 40% 68 62 9221.34 50% 85 0 7269.71 60% 102 0 5345.11 70% 119 0 3540.75 80% 136 0 1876.56 90% 153 0 763.96 100% 170 0 246.00 110% 187 0 77.40 122% 208 0 11.77
Figure 65 D-0921-3 pressure history
0 1000 2000 3000 4000 5000 6000 7000 8000 9000 10000 110000
1
2
3
4
5
6Pressure vs Time
Time/s
Pre
ss
ure
/kP
a
TargetMeasured

70
Figure 66 D-0921-3 100 second excerpt
Figure 67 D-0921-3 deflection plot
850 860 870 880 890 900 910 920 930 940 9500
0.2
0.4
0.6
0.8
1
Time/s
Pre
ss
ure
/kP
a
TargetMeasured
0 1000 2000 3000 4000 5000 6000 7000 8000 9000 10000 110000
3
6
9
12
15Deflection vs Time
Time/s
De
fle
cti
on
/cm

71
Figure 68 D-0921-3 curvature

72
Figure 69 D-0921-3 debonding sketch
4.7 Panel D-1025-3
Panel D-1025-3 experienced all sixteen stages, as shown in Table 21 and Figure 70;
the pressure path of the 100-second excerpt is shown in Figure 71. Table 22 shows the
actual exposure time at or above different percentages of the design wind speed. Figure
72 shows a relatively smooth mid-span deflection curve, with the slope increasing
slightly after 5000 seconds, corresponding to the start of the seventh stage. The slope
dropped at about 8000 seconds, which was during twelfth stage. There was a small drop
before 10000 seconds and a sudden increase at the end of the test. The largest mid-span
displacement was 8.5 cm. The speed for developing a deflection is apparent in Figure 73.
The slim crevice in the bottom plate shown in Figure 74 was the failure pattern for this
panel. All sides and corners showed no debonding (Figure 75). The debonding within the
panel was likely to have happened during the test.

73
Table 21 D-1025-3 pressure to velocity conversion
Step # Pressure Wind Velocity 1 1.50 kPa (31.25 PSF) 58.10 m/s (130 mph) 2 1.83 kPa (38.12 PSF) 64.18 m/s (144 mph) 3 2.17 kPa (45.21 PSF) 69.88 m/s (156 mph) 4 2.55 kPa (53.12 PSF) 75.76 m/s (169 mph) 5 2.96 kPa (61.67 PSF) 81.62 m/s (183 mph) 6 3.38 kPa (70.42 PSF) 87.22 m/s (195 mph)
7-16 3.83 kPa (79.79 PSF) 92.84 m/s (208 mph)
Table 22 D-1025-3 exposure at or above given wind speed
Percent of 170 mph Design Wind Speed
Given Wind Speed / mph
Predicted Probable Exposure Time / s
Actual Exposure Time / s
35% 60 4523 9938.32 40% 68 62 9251.95 50% 85 0 7295.75 60% 102 0 5382.15 70% 119 0 3545.92 80% 136 0 1857.78 90% 153 0 730.46 100% 170 0 236.22 110% 187 0 76.91 122% 208 0 6.38
Figure 70 D-1025-3 deflection plot
0 1000 2000 3000 4000 5000 6000 7000 8000 9000 10000 110000
1
2
3
4
5
6Pressure vs Time
Time/s
Pre
ssu
re/k
Pa
TargetMeasured

74
Figure 71 D-1025-3 100 second excerpt
Figure 72 D-1025-3 deflection plot
850 860 870 880 890 900 910 920 930 940 9500
0.2
0.4
0.6
0.8
1
Time/s
Pre
ssu
re/k
Pa
TargetMeasured
0 1000 2000 3000 4000 5000 6000 7000 8000 9000 10000 110000
2
4
6
8
10Deflection vs Time
Time/s
Defl
ecti
on
/cm

75
Figure 73 D-1025-3 curvature

76
Figure 74 D-1025-3 bottom connection
Figure 75 D-1025-3 debonding sketch

77
4.8 Panel D-1101-3
Panel D-1101-3 experienced all sixteen pressure stages (see Table 23 and Figure
76). Table 24 shows the actual exposure time at or above different percentages of the
design wind speed, and Figure 77 shows the 100-second measured tract and the target
pressure tracks, which were well-matched. As shown in Figure 78, the deflection plot of
D-1101-3 was different from the plots of the other panels. First, the deflection
corresponding to a peak pressure in each stage was not obvious. Second, the slope of the
deflection curve for the first 500 seconds was steep, and it became almost flat until 1000
seconds. After a short and steep increase, the deflection continued upward at a constant
but slow rate until about 8000 seconds, at which point the deflection essentially stopped
increasing. This panel had the least deflection, slightly more than 4 cm. The panel
curvature plotted in Figure 79 shows a slowly developing mid-span displacement. The
top plate has a partial crack, but there was no debonding, as shown in Figure 80.
Table 23 D-1101-3 pressure to velocity conversion
Step # Pressure Wind Velocity 1 1.50 kPa (31.25 PSF) 58.10 m/s (130 mph) 2 1.83 kPa (38.12 PSF) 64.18 m/s (144 mph) 3 2.17 kPa (45.21 PSF) 69.88 m/s (156 mph) 4 2.55 kPa (53.12 PSF) 75.76 m/s (169 mph) 5 2.96 kPa (61.67 PSF) 81.62 m/s (183 mph) 6 3.38 kPa (70.42 PSF) 87.22 m/s (195 mph)
7-16 3.83 kPa (79.79 PSF) 92.84 m/s (208 mph)

78
Table 24 D-1101-3 exposure at or above given wind speed
Percent of 170 mph Design Wind Speed
Given Wind Speed / mph
Predicted Probable Exposure Time / s
Actual Exposure Time / s
35% 60 4523 9953.80 40% 68 62 9273.96 50% 85 0 7312.69 60% 102 0 5393.89 70% 119 0 3558.06 80% 136 0 1850.86 90% 153 0 717.45 100% 170 0 235.92 110% 187 0 61.24 122% 208 0 0.05
Figure 76 D-1101-3 pressure history
0 1000 2000 3000 4000 5000 6000 7000 8000 9000 10000 110000
1
2
3
4
5
6Pressure vs Time
Time/s
Pre
ss
ure
/kP
a
TargetMeasured

79
Figure 77 D-1101-3 100 second excerpt
Figure 78 D-1101-3 deflection plot
850 860 870 880 890 900 910 920 930 940 9500
0.2
0.4
0.6
0.8
1
Time/s
Pre
ss
ure
/kP
a
TargetMeasured
0 1000 2000 3000 4000 5000 6000 7000 8000 9000 10000 110000
1
2
3
4
5Deflection vs Time
Time/s
Defl
ecti
on
/cm

80
Figure 79 D-1101-3 curvature

81
Figure 80 D-1101-3 debonding sketch
4.9 Panel D-1102-3
Panel D-1102-3 experienced thirteen pressure stages, as shown in Table 25 and
Figure 81. Table 26 shows the actual exposure time at or above different percentages of
the design wind speed. The 100-second excerpt is shown in Figure 82. From the different
slopes (Figure 83), the response can be divided to four periods. From 0 to about 30
seconds, the deflection increased; from about 30 seconds to about 4000 seconds, it was
almost flat; and from about 4000 seconds to about 7500 seconds, it had a sharp slope;
afterwards, the response was nearly flat and ended at 7 cm. The curvature of this panel is
plotted in Figure 84. Figure 85, Figure 86, and Figure 87 show the intact condition of the
connections and the bonding.

82
Table 25 D-1102-3 pressure to velocity conversion
Step # Pressure Wind Velocity 1 1.50 kPa (31.25 PSF) 58.10 m/s (130 mph) 2 1.83 kPa (38.12 PSF) 64.18 m/s (144 mph) 3 2.17 kPa (45.21 PSF) 69.88 m/s (156 mph) 4 2.55 kPa (53.12 PSF) 75.76 m/s (169 mph) 5 2.96 kPa (61.67 PSF) 81.62 m/s (183 mph) 6 3.38 kPa (70.42 PSF) 87.22 m/s (195 mph)
7-13 3.83 kPa (79.79 PSF) 92.84 m/s (208 mph)
Table 26 D-1102-3 exposure at or above given wind speed
Percent of 170 mph Design Wind Speed
Given Wind Speed / mph
Predicted Probable Exposure Time / s
Actual Exposure Time / s
35% 60 4523 8550.94 40% 68 62 7862.55 50% 85 0 5907.47 60% 102 0 4056.97 70% 119 0 2471.14 80% 136 0 1209.80 90% 153 0 449.19 100% 170 0 139.81 110% 187 0 43.78 122% 208 0 4.42
Figure 81 D-1102-3 pressure history
0 1000 2000 3000 4000 5000 6000 7000 8000 90000
1
2
3
4
5
6Pressure vs Time
Time/s
Pre
ss
ure
/kP
a
TargetMeasured

83
Figure 82 D-1102-3 100 second excerpt
Figure 83 D-1102-3 deflection plot
850 860 870 880 890 900 910 920 930 940 9500
0.2
0.4
0.6
0.8
1
Time/s
Pre
ss
ure
/kP
a
TargetMeasured
0 1000 2000 3000 4000 5000 6000 7000 8000 90000
2
4
6
8Deflection vs Time
Time/s
De
fle
cti
on
/cm

84
Figure 84 D-1102-3 curvature

85
Figure 85 D-1102-3 top connection
Figure 86 D-1102-3 bottom connection

86
Figure 87 D-1102-3 debonding sketch
4.10 Panel D-1103-3
Panel D-1103-3 experienced all sixteen stages (see Table 27 and Figure 88). Table
28 shows the actual exposure time at or above different percentages of the design wind
speed. Figure 89 shows a 100-second excerpt from the test. The deflection increased
during the entire test, but there was a lower rate of increase between 7500 seconds and
9000 seconds (Figure 90), which corresponds to the first three repeated high-pressure
stages. During the repeated high-pressure period, the panel fluctuated more than other
panels, although there was no difference in the application of pressure. This panel may
have had some unusual configuration involving bonding, connection installation, nailing
pattern, or bolt fastening, which led the frequency of the panel to near the frequency of
the high repeated pressure. The final deflection was more than 10 cm (Figure 91). The
top interior face sheet debonded almost to the mid-span (Figure 92), which may have
caused the partial crack in the top lumber.

87
Table 27 D-1103-3 pressure to velocity conversion
Step # Pressure Wind Velocity 1 1.50 kPa (31.25 PSF) 58.10 m/s (130 mph) 2 1.83 kPa (38.12 PSF) 64.18 m/s (144 mph) 3 2.17 kPa (45.21 PSF) 69.88 m/s (156 mph) 4 2.55 kPa (53.12 PSF) 75.76 m/s (169 mph) 5 2.96 kPa (61.67 PSF) 81.62 m/s (183 mph) 6 3.38 kPa (70.42 PSF) 87.22 m/s (195 mph)
7-16 3.83 kPa (79.79 PSF) 92.84 m/s (208 mph)
Table 28 D-1103-3 exposure at or above given wind speed
Percent of 170 mph Design Wind Speed
Given Wind Speed / mph
Predicted Probable Exposure Time / s
Actual Exposure Time / s
35% 60 4523 9942.79 40% 68 62 9266.98 50% 85 0 7310.56 60% 102 0 5390.19 70% 119 0 3561.59 80% 136 0 1868.47 90% 153 0 716.62 100% 170 0 227.07 110% 187 0 70.06 122% 208 0 0.95
Figure 88 D-1103-3 pressure history
0 1000 2000 3000 4000 5000 6000 7000 8000 9000 10000 110000
1
2
3
4
5
6Pressure vs Time
Time/s
Pre
ss
ure
/kP
a
TargetMeasured

88
Figure 89 D-1103-3 100 second excerpt
Figure 90 D-1103-3 deflection plot
850 860 870 880 890 900 910 920 930 940 9500
0.2
0.4
0.6
0.8
1Pressure vs Time
Time/s
Pre
ss
ure
/kP
a
TargetMeasured
0 1000 2000 3000 4000 5000 6000 7000 8000 9000 10000 110000
2
4
6
8
10
12Deflection vs Time
Time/s
De
fle
cti
on
/cm

89
Figure 91 D-1103-3 curvature

90
Figure 92 D-1103-3 debonding sketch
4.11 Results
The test results of the entire dynamic windstorm test are given in Table 29, and
deflection plots for all eight tests are summarized in Figure 93. The table contains sample
designations, pressure stages, corresponding pressure, wind speed, final mid-span
deflections, and damage modes for each test.

91
Table 29 Failure details of dynamic windstorm test
Panel # Final Stages
Final Pressure
Final Wind
Velocity
Final Deflection Damage Mode
D-0926-1 8
3.83 kPa (79.79 PSF)
92.84 m/s (208 mph)
12.2 cm Interior bottom and one corner of top exterior
debonding
D-1003-1 8 12 cm
Interior bottom and exterior top debonding, bottom plate failure, and partial crack on top plate
D-0912-3 16 10 cm No debonding, intact connections
D-0921-3 16 14.8 cm No debonding, intact connections
D-1025-3 16 8.6 cm No debonding, partial crack on bottom plate
D-1101-3 16 4.2 cm No debonding, partial crack on top plate
D-1102-3 13 7 cm No debonding, intact connections
D-1103-3 16 10.3 cm Interior top debonding, and partial crack on top
plate

92
Figure 93 Deflection plots of dynamic windstorm test
0 1000 2000 3000 4000 5000 6000 7000 8000 9000 10000 110000
3
6
9
12
15
18
21Deflection vs Time
Time/s
De
fle
cti
on
/cm
D-0926-1D-1003-1D-0912-3D-0921-3D-1005-3D-1101-3D-1102-3D-1103-3

93
4.12 Discussion
• Because no evident permanent deformation was found after removing the CSIPs
from the frame, the materials work within elastic range.
• Except for a control problem with panel D-1102-3, which caused it experience
only thirteen stages of the dynamic windstorm tests, all of the panels completed
the pre-programmed pressure stages.
• Only one panel, D-1003-1, experienced a connection failure. The bottom lumber
cracked through longitudinally. Before the final increase, indicating plate failure,
the mid-span deflection was about 12 cm.
• Debonding was observed in the tests for both panels with 1 PCF core density and
one 3 PCF core density panel, D-1103-3. Although the bonding of CSIP with the
rigid core showed no defects on its sides and corners, and both connection
lumbers of some panels remained intact during the tests, the slope changes in the
deflection plot indicate there are debondings in the middle of the panel, which
were not visible.
• Panels D-0912-3, D-0921-3 and D-1102-3 were completely intact. No debonding
was evident on the sides and corners, and there was no crevice on the wood
plates.
• D-1025-3 and D-1101-3 had partial cracks on the bottom and top lumbers,
respectively, but neither had debondings.
• The mid-span deflection was similar for the two 1 PCF core density CSIPs, but it
varied considerably for the 3 PCF core density CSIPs, ranging from 4.2 cm to
14.8 cm. Some samples showing similar conditions after the tests had different

94
deflections. D-0921-3 and D-1102-3 had no obvious damage, but the former panel
had a mid-span deflection of 14.8 cm; the deflection for the latter was only 7 cm.
A reasonable explanation for the inconsistency is that more debondings in the
middle of the panel, which were not visible, developed in D-0921-3 than in D-
1102-3.
• Typically, the dynamic windstorm tests lasted for about 100 min for 1 PCF core
density panels and about 175 min for 3 PCF core density panels. The repeated
load cycles, especially stage 7 to stage 16, make this experiment an effective
check for fatigue load.
4.13 Summary
• Although the HAPLA system did not match the high-peak pressures in later
stages from 8 to 16 and the trough pressure in each stage, the control system
worked well in most load traces, as shown in figures of 100-second excerpts.
• In the dynamic windstorm tests, all materials of the CSIPs were strong and ductile
enough to function in the elastic range.
• The CSIPs with 1 PCF core density deflected more and were more prone to face
sheet debonding and connection failures; only slight damage occurred in a few of
the 3 PCF core density CSIPs.
• All CSIPs were able to bear an equivalent wind velocity as high as 92.84 m/s (208
mph). They have the potential to bear even higher wind loads and remain
structurally intact.
• Under repeated pressures as high as 3.83 kPa (79.97 PSF), the CSIPs
demonstrated effective fatigue resistance.

95
• In the dynamic windstorm tests, face sheet debonding was not a substantial
problem for 3 PCF core density CSIPs. Nevertheless, in future research,
nondestructive techniques may be used to determine debondings in the middle of
the panels.
• Debonding in the middle of the panels may account for the discrete mid-span
deflections.
• The connections performed well in the dynamic windstorm tests. Only one
connection failure occurred in CSIPs, D-1003-1.
• The deflection plots (Figure 96) proved the repeatability of the test.

96
CHAPTER 5
AS-BUILT CONDITIONS
During the tests, debonding between the face sheet and the core is caused
primarily by wrinkling of the face sheet in compression. But “disbonding,” a preexisting
condition due to defects in manufacture, will be covered in this chapter.
For an instance, Figure 94 shows one of four disbonding corners of CSIP S-0513-
3 before the stepwise test. Such disbonding is large enough to be considered. The
disbonding probably contributed considerably to the deflection, and may account for the
fact that curve S-0513-3 (Figure 50) is different from the other 3 PCF core density CISPs.
Figure 94 Corner disbonding
The connection is expected to model the realistic fixed condition in order to find
the wind resistance of the CSIPs. The ideal fixed boundary condition with no rotations

97
can hardly be achieved. Figure 95 shows the fixtures, including ½’’ Simpson strong ties
and bolts after a test. The warpage is insignificant, which means the fixed boundary
condition was essentially achieved.
Figure 95 Simpson strong tie

98
CHAPTER 6
FINITE ELEMENT MODELING
The commercial software package LS-DYNA was used to perform the finite
element analysis for CSIPs.
6.1 Initial Modeling Validation
Because the relatively long test duration and the time-sensitive calculation
characteristics of LS-DYNA, only the first one second of the dynamic windstorm test on
CSIP with 1 PCF core density was selected to validate the finite element modeling in
order to perform modeling efficiently.
6.1.1 Simulation Details
The dimensions of the CSIP are in Figure 96 and Figure 97. Through the finite
element modeling, material models, explicit and implicit methods, and element quantity
were investigated in order to find the model that generated the best matched deflection-
time curve. Because the debonding stress between the face sheet and the core was
unknown, it was assumed that the two components were bonded well through the test,
thus CONTACT_TIED_SURFACE_TO_SURFACE was used. The load was modeled as
a uniformly distributed surface load, and LOAD_SEGMENT_SET and SET_SEGMENT
were used to produce the time-changing pressure, which varied every 0.01 second. The
load history is seen in Figure 98. For simplicity, the wood connection was not considered
in the modeling, and the edge nodes were constrained for all six degrees of freedom

99
(Figure 99). The material properties used in the model are in Table 30 and Table 31. Due
to the long time of the experiment and the computation characteristics of LS-DYNA, only
data for the first second were used for the validation.
Table 30 Material properties of face sheet RHO EX EY EZ PRXY PRYZ PRXZ GXY GYZ GXZ
16 kg/m3
11035 MPa
11035 MPa
1030 MPa
0.11 0.22 0.22 1800 MPa
750 MPa
750 MPa
Table 31 Material properties of core
RHO EX PRXY
1783 kg/m3 1.2 - 1.5 MPa 0.25
Figure 96 Connection dimensions

100
Figure 97 Panel dimensions

101
Figure 98 Load history: Pressure - Time
Figure 99 Geometry

102
6.1.1.1 Material Models
MAT161 and MAT54 were evaluated for the 3.04-mm glass fiber / PP face sheet,
and MAT003, MAT012, and MAT063 were evaluated for the EPS foam core. The stress-
strain curve for MAT012 was obtained from Croop et al. [40]. The baseline material
models for the core and face sheet are MAT003 and MAT054, which, after several trials,
were determined to be the optimum types (see Figure 100).
Figure 100 Deflection - Time curves for different materials
Shell element was used instead of solid element because the element with an
aspect ratio closer to unity yields better results [41] and considering the cost of central
processing units (CPU). Although MAT161 was considered as a great fit for fiber
polymer materials, it did not show appropriate behavior in this modeling. MAT161 may
be better for modeling fiber failure, but the relatively low pressure did not cause any
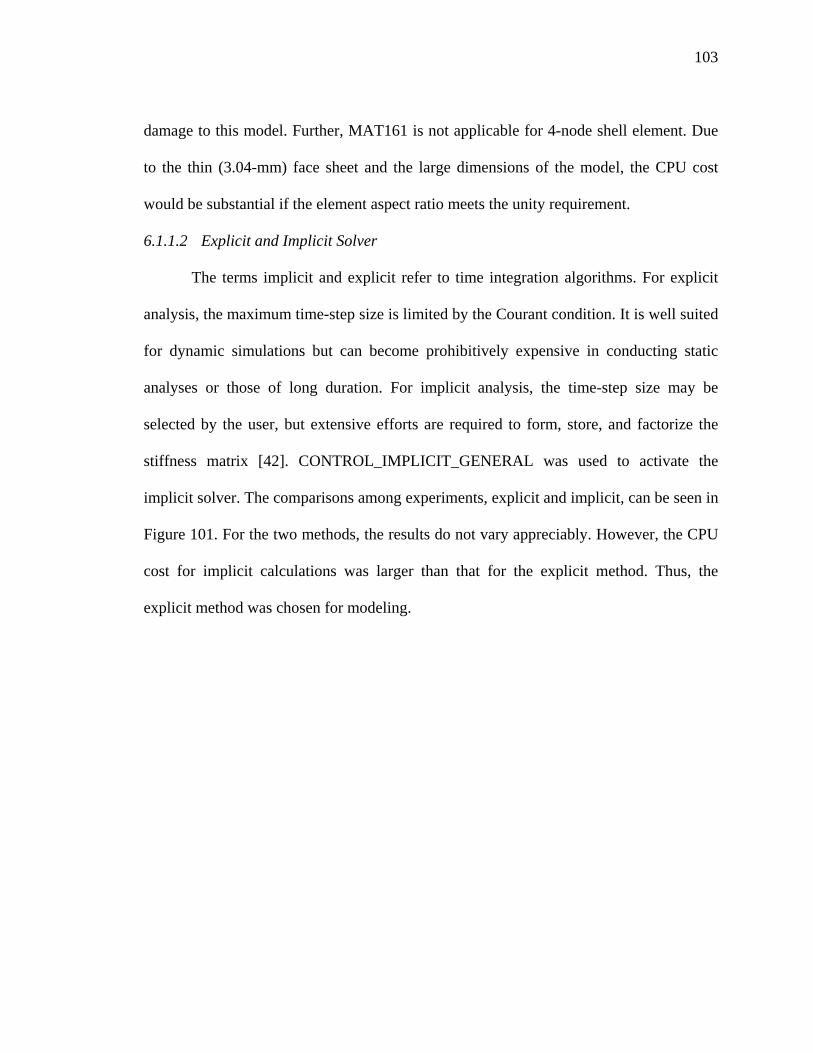
103
damage to this model. Further, MAT161 is not applicable for 4-node shell element. Due
to the thin (3.04-mm) face sheet and the large dimensions of the model, the CPU cost
would be substantial if the element aspect ratio meets the unity requirement.
6.1.1.2 Explicit and Implicit Solver
The terms implicit and explicit refer to time integration algorithms. For explicit
analysis, the maximum time-step size is limited by the Courant condition. It is well suited
for dynamic simulations but can become prohibitively expensive in conducting static
analyses or those of long duration. For implicit analysis, the time-step size may be
selected by the user, but extensive efforts are required to form, store, and factorize the
stiffness matrix [42]. CONTROL_IMPLICIT_GENERAL was used to activate the
implicit solver. The comparisons among experiments, explicit and implicit, can be seen in
Figure 101. For the two methods, the results do not vary appreciably. However, the CPU
cost for implicit calculations was larger than that for the explicit method. Thus, the
explicit method was chosen for modeling.

104
Figure 101 Deflection – Time curve of explicit and implicit methods
For the implicit solver, the default iterative nonlinear solver used is the BFGS
method that employs a ‘Quasi-Newton’ method, in which the global stiffness matrix is
reformed only at each ILIMIT step. This default method often fails to converge when the
non-linearity of the problem grows or when there is substantial contact involved [43].
This specific modeling has a substantial amount of contact between the face sheet and the
core. In this case, as Suri Bala [43] recommends, a more expensive Full-Newton method
is used by setting ILIMIT = 1 to force LS-DYNA to reform the stiffness matrix at every
iterative step and to yield a more accurate estimation of stiffness. Further, the MAXREF
was set to 50 to allow a sufficient number of stiffness reformations before terminating or
reducing the solution time step.

105
6.1.1.3 Element Quantity
To balance the relationship between CPU cost and consistency of results, different
element numbers were investigated for this model. With different mesh sizes, 32
elements, 96 elements, 1128 elements, and 64843 elements were evaluated. Results for
the four modeling did not differ appreciably, and were consistent with the experiment
curve (Figure 102). Also the computation time for the modeling with 32 elements, 96
elements and 1128 elements were similar. Thus, it was appropriate to use the model with
1128 elements.
Figure 102 Deflection – Time curve of different element numbers
Although the model had dimensions of 2.4 m × 1.2 m × 0.14 m (8 ft × 4 ft × 5.5
in), the results were consistent with mesh size of 100 mm and element number of 1128.

106
The reason why this model is not sensitive to the element size may be due to its simple
geometry and load pattern.
Results
As all the validation modeling shows, a finite model with MAT054 for face sheet,
MAT063 for core, CONTACT_TIED_SURFACE_TO_SURFACE between face sheet
and core, and a mesh size of 100 mm with element number of 1128 were consistent with
the experiment using explicit solver. The variance is within an acceptable range (Figure
103). The deflection contour can be seen in Figure 104.
Figure 103 Comparison between experiment and FE modeling

107
Figure 104 Deflection contour
6.2 Further FE modeling and Experimental Results
After validation of the first one second of the CSIP with 1 PCF core density, the
modeling was further developed in stepwise and dynamic windstorm tests of longer
duration. In the following, fixed and simply supported conditions and material models
MAT003 and MAT063 were evaluated in a parametric study of 1 PCF core density
CSIPs in stepwise tests; only boundary conditions were investigated for 3 PCF core
density CSIPs in stepwise tests. In dynamic windstorm tests, all models were in fixed
condition, and different material models were investigated only for 1 PCF core density

108
CSIPs. Due to the lack of debonding-related data, debonding was not considered in
modeling.
6.2.1 Stepwise Windstorm Test
The pressure history in Figure 105 was the input to the load-modeling file. The
deflections from experiment and finite element modeling for all fifteen stages of CSIPs
with 1 PCF core density can be seen in Figure 10. There was little difference between
different boundary conditions, and MAT003 gave a slightly better result than MAT063.
Nevertheless, after the first three stages, there were large divergences between deflections
from the experiment and the finite element analysis.
Figure 105 Deflection comparisons of 1 PCF core density CSIPs in stepwise windstorm
test

109
With the load input described in Figure 14, the deflections of experiment and
modeling for 3 PCF core density CSIPs were obtained (Figure 106). Again, fixed and
simply supported conditions were investigated. From this plot, it can be seen that the
modeling matches well with the experiment for only the first two stages; the difference
between them is greater at later stages.
Figure 106 Deflection comparisons of 3 PCF core density CSIPs in stepwise windstorm
test
The total deflection of the mid-span is the sum of bending deflection and shear
deflection, which are described by the first and second terms, respectively, of the
following formula.
U
PLk
D
PLk sb +=Δ3
(Eq. 3)

110
In the formula, P is total load acting perpendicular to neural axis, L is span, D and
U are bending and shear stiffness, and bk and sk are bending and shear constants
depending on loading, boundary conditions, and points of interest. For example, if mid-
span is the point of interest, the boundary condition changes from fixed to simply-
supported, and other conditions stay the same. In this case, bk changes from 1/384 to
5/384. In Figure 105 and Figure 106, the difference between fixed and simply supported
boundary conditions was not substantial, indicating that the deflection due to bending
was small enough to be ignored.
6.2.2 Dynamic Windstorm Test
Because the load file of LS-DYNA had an input limit and also considering the
expensive CPU cost and large volume of result files, only the first 300 seconds were used
as load input for the modeling (Figure 48).
The deflections of experiment and modeling of dynamic windstorm test of 1 PCF
core density CSIPs are illustrated in Figure 107. The deflections of experiment and
modeling followed a similar up-and-down pattern, and the FE63 modeling curve on top,
which used MAT063, gave a less noisy curve. The peak values of experiment and FE
modeling, which used MAT003 as core material (as evaluated previously in initial
validation), were within an acceptable difference; the mean values of the two varied
considerably, especially after 100 seconds.
Figure 108 shows the deflections of experiment and modeling for CSIPs with 3
PCF core densities. The deflection of modeling is at the bottom of all curves. The

111
modeling matched well with D-1101-3 before 150 seconds; thereafter it may not be a
validated model due to the relatively large variance.

112
Figure 107 Deflection comparisons of 1 PCF core density CSIPs in dynamic windstorm test
0 50 100 150 200 250 3000
0.5
1
1.5
2
2.5
3Deflection vs Time
Time/s
De
fle
cti
on
/cm
FEEX0926EX1003FE63

113
Figure 108 Deflection comparisons of 3 PCF core density CSIPs in dynamic windstorm test
0 50 100 150 200 250 3000
0.5
1
1.5
2
2.5Deflection vs Time
Time/s
De
fle
cti
on
/cm
FEEX0912EX0921EX1005EX1101EX1102EX1103

114
6.3 Summary
Although the modeling did not match well with the experimental work, there are still
points that can be made:
• MAT003 gave smaller deflections than experiments. Consequently, MAT063 was
tried because of its realistic behavior in other engineering modeling [40], and
more importantly it gave a larger deflection than MAT003.
• In stepwise windstorm tests, the small differences between different boundary
conditions may indicate that the deflection due to bending is small enough to be
ignored and that the deflection due to shear dominates. This is reasonable because
the foam is weak in shear resistance, and debonding between the face sheet and
the core also contributes.
• In dynamic windstorm tests, the modeling with MAT003 as core matched well
with the experiment for 1 PCF CSIPs, although the modeling with MAT063 was
less noisy. More closely matched results with MAT063 may be achieved with
stress-strain data from the mechanical test of the foam.
• The modeling will be more realistic when debonding-related data are obtained
from future tests and included in the analyses.

115
CHAPTER 7
SUMMARY & CONCLUSION
7.1 Summary
Composite Structural Insulated Panels (CSIPs) are proposed as a substitute for
traditional wood-made structural insulated panels (SIPs), which are typically used for
building envelopes. Made of composite materials, the CSIPs possess various structural
merits, most of which have been established by laboratory tests that have been described
in previous statements. By addressing the increasing loss due to wind hazards in recent
years, this thesis concentrated on the wind resistance of CSIPs. Simulated wind pressure
was applied, in stepwise and dynamic ways, to full-scale CSIPs using the High Air
Pressure Load Actuator (HAPLA) system developed at the University of Florida. The
commercial finite element software, LS-DYNA, was used to evaluate the modeling
validation of the experiments.
In stepwise windstorm tests, the HAPLA system produced simulated air pressure
starting from 5 PSF with increments of 10 PSF up to 145 PSF with 90 seconds for each
pressure period. During tests, CSIPs ended with equivalent wind velocities ranging from
227 mph to 280 mph. This stepwise test was considered conservative because it is an
extremely rare case that a structure is subject to a large wind load for 90 seconds.
Although four of five specimens failed at their connections, one CSIP experiencing the
largest velocity of 280 mph showed no cracks at the connections, which demonstrates the

116
wind resistance potential of CSIPs. For all specimens, debonding was observed at most
corners. The mid-span deflections were significant in tests, and CSIPs with thicker or
denser cores should solve that problem. An assumption of wrinkling of the face sheet on
the compression side was made due to the decreasing compression strain values. Future
tests can evaluate this possibility.
In dynamic windstorm tests, the HAPLA system generated fluctuating wind
pressure. The input data were obtained from the Aerodynamic Database of National
Institute of Standards and Technology (NIST). The peak equivalent wind velocity ranged
from 130 mph to 208 mph, which is 22% greater than the largest wind speed in the 500-
year hurricane map based on uncertainty calculations. The Rayleigh distribution was used
to predict the probable exposure time during the 500-year period. This dynamic
windstorm test was considered conservative because the actual exposure time during
dynamic windstorm tests was larger than the predicted time from the Rayleigh
distribution. In dynamic windstorm tests, four of eight CSIPs experienced connection
failures. Three of the four were 3 PCF core density samples that had minor cracks; the
other was a 1 PCF core density sample, which had a crack through the lumber. Three of
eight samples experienced corner debondings, two of the three were in 1 PCF core
density panels. Because the deflection plots for the 3 PCF core density panels were not
consistent, an assumption was made that debondings appeared in the middle of the face
sheet during tests, which would not be noticed but could be evaluated by nondestructive
techniques.
The stepwise and dynamic windstorm tests validate the wind resistance of the
CSIPs as a single full-scale wall panel. The connection details, construction problems,

117
and the performance of CSIPs after the cut for the windows, doors, wire line, plumbing
etc. will be the focus of this project in the next phase.
The commercial finite element software LS-DYNA was used to perform finite
element analysis. Due to the expensive CPU cost and computing time, initial modeling
validation was performed for the first second of the dynamic windstorm tests of 1 PCF
core density CSIP. After several trials, a 4-node shell element and MAT054 for face
sheet, 8-node solid element and MAT003 for core,
CONTACT_TIED_SURFACE_TO_SURFACE, element size of 100 mm, and explicit
solver were considered to be a good fit. With the load input from stepwise windstorm
tests and the first 300 seconds of dynamic windstorm tests, further modeling validation
was performed. Due to the uncertain stress-strain curve of the foam core and the
unknown debonding stress between the face sheet and the core, the modeling merely
developed a similar plot pattern. The results from stepwise windstorm test modeling led
to an assumption that the deflection due to shear dominates the total deflection and that
the weak shear-resistance foam core and the weak bonding between the face sheet and the
core justified the assumption.
7.2 Conclusion
• The results of stepwise and dynamic windstorm tests prove that the full-scale
CSIPs are capable of resisting an equivalent wind velocity of more than 200 mph
without showing substantial structural damage.
• In the tests, debonding was a typical damage mode for CSIPs, but the wind-
resistance capacity of CSIPs did not decrease appreciably after debonding.

118
• CSIPs with 1 PCF core density deflected more at the mid-height of panels than
the ones with 3 PCF core density. Denser or thicker foam cores are expected to
decrease the mid-height deflection to more comfortable criteria.
• For future tests, nondestructive techniques are recommended to determine if any
debondings fall away from the edges of the panels. At present, this cannot be
visually observed.
• The finite element modeling indicates that the deflection due to shear is a primary
factor in the structural behavior of CSIPs.
• The finite element modeling gave similar patterns in deflection plots. More
mechanical properties of foam cores, which are expected to be found in future
tests, will likely make the modeling more consistent with experiments.

119
LIST OF REFERENCES
1. Insurance Information Institute. Available at, http://www.iii.org/facts_statistics/catastrophes-us.html/
2. Storm Prediction Center, National Weather Services, National Oceanic and Atmospheric Administration. Available at, http://www.spc.noaa.gov/climo/torn/fataltorn.html
3. Blake, E.S., Landsea, C.W., and Gibney, E.J. (2011): The Deadliest, costliest, and most intense United States Tropical Cyclones from 1851 to 2010 (and Other Frequently Requested Hurricane Facts). NOAA, Technical Memorandum NWS NHC-6.
4. Gurley, K, Masters, F. (2011) Post 2004 hurricane field survey of residential building performance. Natural Hazards Review, 12(4), 177-183.
5. Mehta K. C., Minor J. E., Reinhold T. A. (1983) Wind speed-damage correlation in Hurricane Frederic. Journal of Structural Engineering 1, 37-49.
6. Kareem, A. (1985) Structural performance and wind speed-damage correlation in Hurricane Alicia. Journal of Structural Engineering, 111(12), 2596-2610.
7. Guillermo F., Green R., Khazai B., Smyth A., Deodatis G. (2010) Field damage survey of New Orleans homes in the aftermath of Hurricane Katrina. Natural Hazards Review, 11, 7-18.
8. Alwin, H. Z. (2002) Development of a method to analyze structural insulated panels under transverse loading. Master Thesis, Washington State University.
9. Vaidya, A. S. (2009) Lightweight composites for modular panelized construction. Ph.D. Dissertation, University of Alabama at Birmingham.
10. Mousa, M. (2007), Optimization of Structural Panels for Cost-Effective Panelized Construction. MS Thesis, CCEE Department, University of Alabama at Birmingham.

120
11. Khotpal, A. (2004) Structural Characterization of Hybrid Fiber Reinforced Polymer (FRP)-Autoclaved Aerated Concrete (AAC) Panels. MS Thesis, CCEE, Department, University of Alabama at Birmingham.
12. Shelar, K. (2006) Manufacturing and Design Methodology of Hybrid Fiber Reinforced Polymer (FRP)-Autoclaved Aerated Concrete (AAC) Panels and its Response under Low Velocity Impact. MS Thesis, CCEE Department, University of Alabama at Birmingham.
13. Uddin, N., and Fouad, H. (2007).Structural Behavior of FRP Reinforced Polymer-Autoclaved Aerated Concrete Panels. ACI Structural Journal, 104(6), 722-730.
14. Mousa, M., Uddin, N. (2009) Experimental and Analytical Study of Carbon Fiber-Reinforced Polymer (FRP) /Autoclaved Aerated Concrete (AAC) Sandwich Panels. Journal of Engineering Structures, 31, 2337-2344.
15. Nguyen, T. T. (2009) Analysis and design of innovative composite storm shelter against wind hazards. M.S. Thesis, University of Alabama at Birmingham.
16. Mousa, M. (2011) Composite structural insulated panels (CSIPs) for hazards resistant structures. Ph.D. Dissertation, University of Alabama at Birmingham.
17. Hartness, T., Husman, G., Koenig, J., Dyksterhouse, J. (2001) The
characterization of low cost fiber reinforced thermoplastic composites produced by the DRIFT process. Composites - Part A: Applied Science and Manufacturing, 2(8), 1155-1160.
18. Company literature: U.S. Liner Company – A Division of American Made, LLC, 19 Leonberg Road Cranberry Township, PA 16066 U.S.A.
19. Company literature: Universal Foam Products 16 Stenersen Lane, Suite 4B Hunt
Valley, MD 21030 U.S.A.
20. Annual book of ASTM standards C393-00 (2000), standard test method for flexural properties of sandwich construction, 100 Barr Harbor Drive, West Conshohocken, PA 19428-2959, United States
21. Vaidya, A. (2007) Thermoplastic composite structural insulated panels (CSIPS)
for building construction. Proceedings of Asia-Pacific Conference on FRP in Structures (APFIS 2007), 2007 International Institute for FRP in Construction
22. Vaidya, A., Uddin, N., Vaidya, U. (2010) Structural characterization of composite structural insulated panels for exterior wall applications. Journal of Composites for Construction, 14(4), 464-469.

23. AnnuaconduDrive
24. Mousinsula
25. MouspanelsNovem
26. MinimAmer
27. Mousinsula
28. Comp43782
29. Comp01749
30. CompBoule
31. Cente2003.
32. AnnuaSurfacHarbo
33. AnnuaSurfacWest
34. AnnuaSpecifHarbo
35. Lopezresideloadin
al book of ucting streng, West Cons
a, M. A., ated wall pan
a, M., Uddis. Journal mber 2010
mum Desigican Society
a, M., Uddinated floor pan
pany literatur2 U.S.A.
pany literatu9 U.S.A.
pany literatuevard, P.O. B
r for Comp1.
al book of ce Flammabor Drive, We
al book of ce Burning Conshohock
al book of fic Optical or Drive, We
z, C., Masteential windong. Building
ASTM stangth tests of shohocken, P
Uddin, N. nels. 32(2), 7
in, N. Deboof Reinforc
gn Loads fy of Civil En
n, N. (2011)nels. Advanc
re: Hollinee
ure: Avtec I
ure: Great Box 2200, W
posites Manu
ASTM stanility of Mate
est Conshoho
ASTM stanCharacterist
ken, PA 1942
ASTM stanDensity of
est Conshoho
ers, F. J., Bow and wal
and Environ
ndards E-72panels for b
PA 19428-29
(2011) Gl766-772.
onding of coced Plastics
for Buildingngineers.
) Flexural beced Compos
Glass Fiber
Industries, 9
Lakes CheWest Lafayett
ufacturing F
ndards E-162erials Using ocken, PA 1
ndards E-84tics of Build28-2959, Un
ndards E-662f Smoke Geocken, PA 1
Bolton, S. (l systems snment, 46(7)
2-05 (2005)building con959, United
obal buckli
omposites ss and Comp
g and Othe
ehavior of fusite Material
rs, 9702 Iron
9 Kane Ind
emical Corpte, Indiana 4
Final Report
2-95 (1995)a Radiant H9428-2959,
4-10 (2010),ding Materinited States.
2-95 (1995)enerated by9428-2959,
(2011) Watsubjected to), 1329-1342
). “Standardnstruction” States
ing of com
tructural insposites, 29(
er Structure
ull-scale comls, 20(6), 547
n Point Rd S
dustrial Driv
poration, O47906-0200
t. (2003) FT
), Standard Heat Energy
United State
, Standard Tals, 100 Ba
), Standard y Solid Mat
United State
ter penetratio steady and2.
d test metho100 Barr H
mposite struc
sulated sand(22), 3380-3
es. ASCE
mposite struc7-567.
SE Shawnee
ve, Hudson,
ne Great L
TA-AL-26-7
Test MethoSource, 100es.
Test Methoarr Harbor D
Test Methoterials, 100 es.
ion resistancd unsteady
121
od of Harbor
ctural
dwich 3391,
7-05,
ctural
e, OH
MA
Lakes
7001-
od for 0 Barr
d for Drive,
od for Barr
ce of wind

122
36. Minimum Design Loads for Building and Other Structures. ASCE 7-10, American Society of Civil Engineers.
37. Sharaf, T., Shawkat, W., Fam, A. (2010) Structural performance of sandwich wall panels with different foam core densities in one-way bending. Journal of Composite Materials, 44(19), 2249-2263.
38. Frankl, B. A. Structural behavior of insulated precast prestressed concrete sandwich panels reinforced with CFRP grid. Ph.D. Dissertation, North Carolina State University, 2008.
39. Vickery, P. J., Wadhera, D., Twisdale, L. A., Lavelle, F. M., (2009) U.S.
Hurricane Wind Speed Risk and Uncertainty, Journal of Structural Engineering, 135(3), 301-320.
40. Croop, B., Lobo, H. (2009) Selecting Material Models for the Simulation of Foams in LS-DYNA. 7th European LS-DYNA Conference Proceedings.
41. Bhavikati, S.S. (2005), Finite Element Analysis. New Age International (P) Ltd., Publishers, New Delhi, India.
42. LS-DYNA Version 971 Keyword User’s Manual, 2006.
43. http://blog2.d3view.com/ Website visited on Dec 15, 2011.