WinCC Professional Getting Started
144
Create the Project You can create the project from the Portal View with “Create new project”. Also by selecting “New” from the Project menu. Also by selecting the “New Project” icon in the project view. Then fill in the particulars: 1
Transcript of WinCC Professional Getting Started
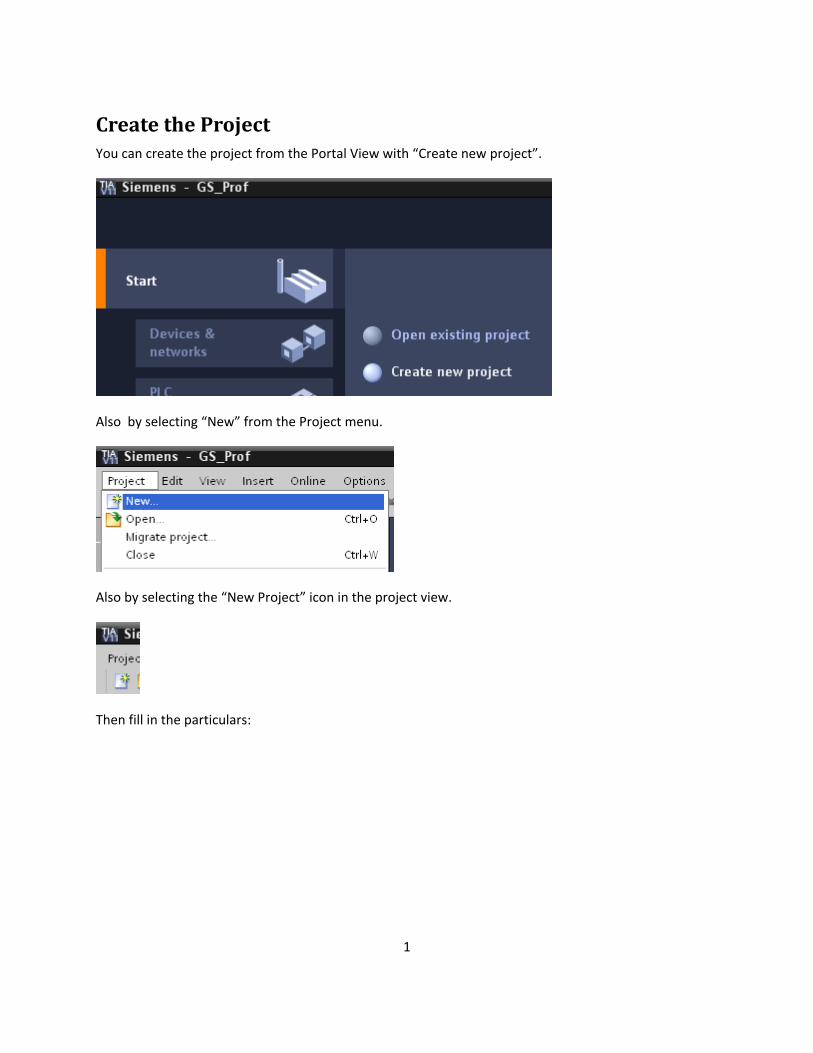
Create the Project You can create the project from the Portal View with “Create new project”.
Also by selecting “New” from the Project menu.
Also by selecting the “New Project” icon in the project view.
Then fill in the particulars:
1
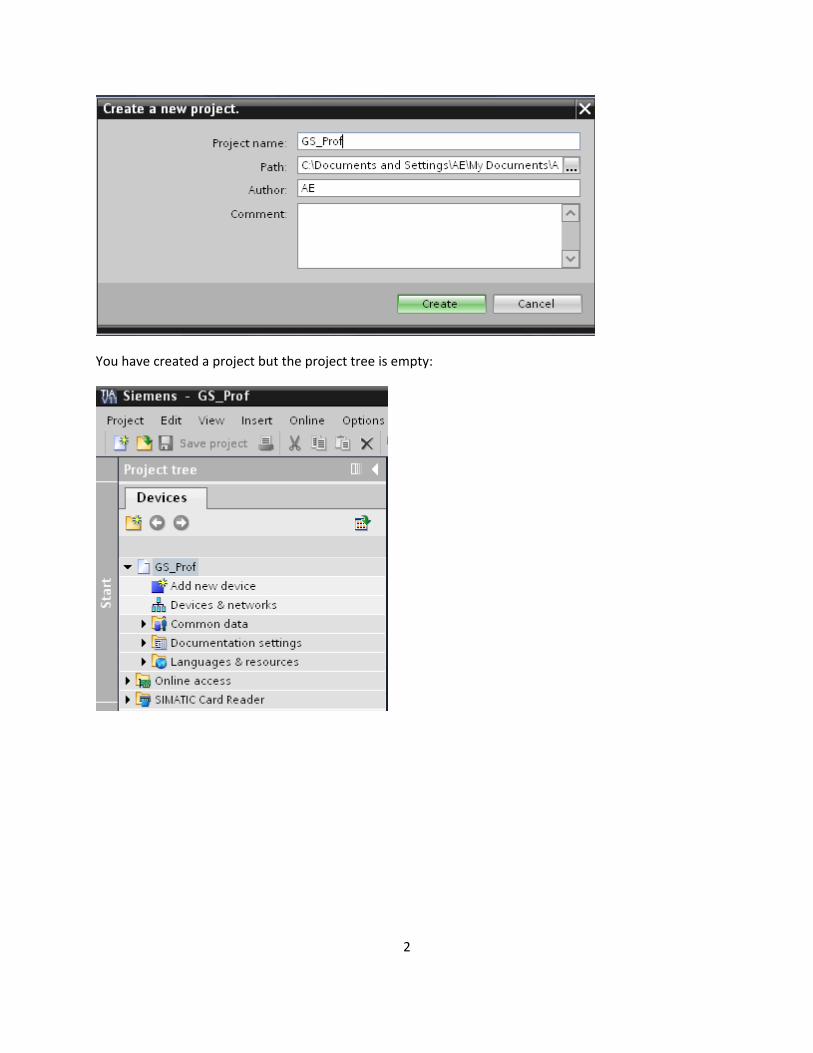
You have created a project but the project tree is empty:
2
Add the PLC and the WinCC Professional Runtime
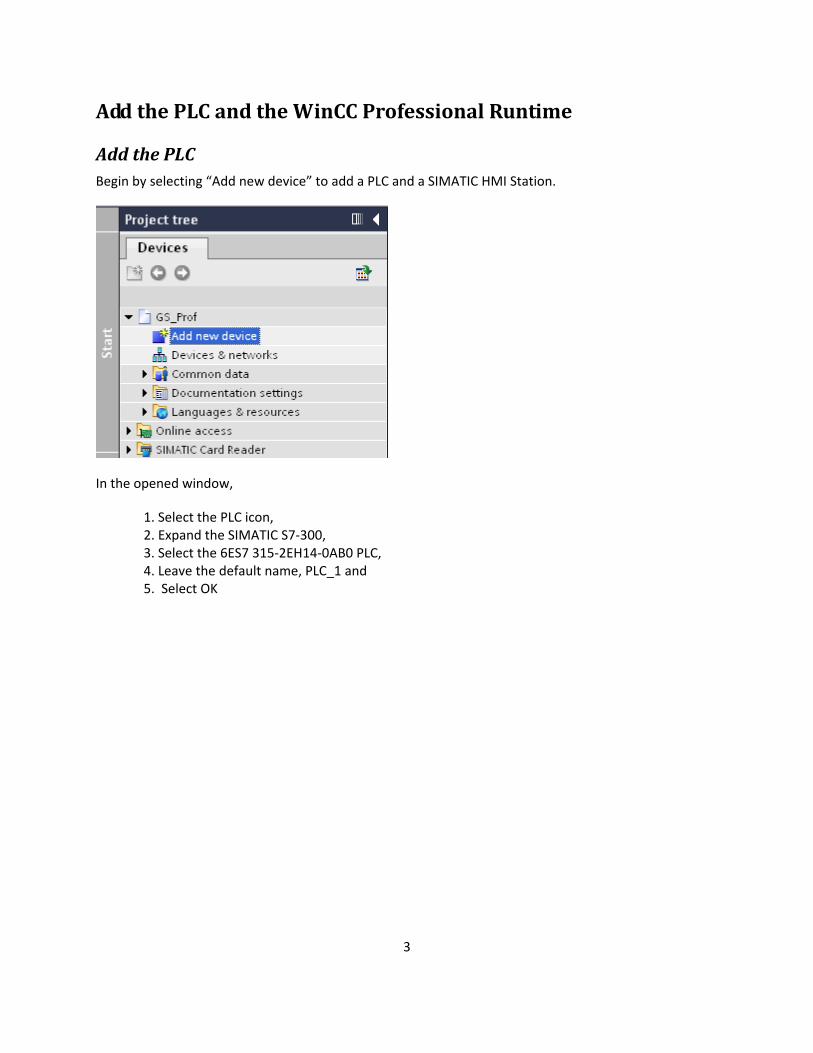
Add the PLC Begin by selecting “Add new device” to add a PLC and a SIMATIC HMI Station.
In the opened window,
1. Select the PLC icon, 2. Expand the SIMATIC S7-300, 3. Select the 6ES7 315-2EH14-0AB0 PLC, 4. Leave the default name, PLC_1 and 5. Select OK
3
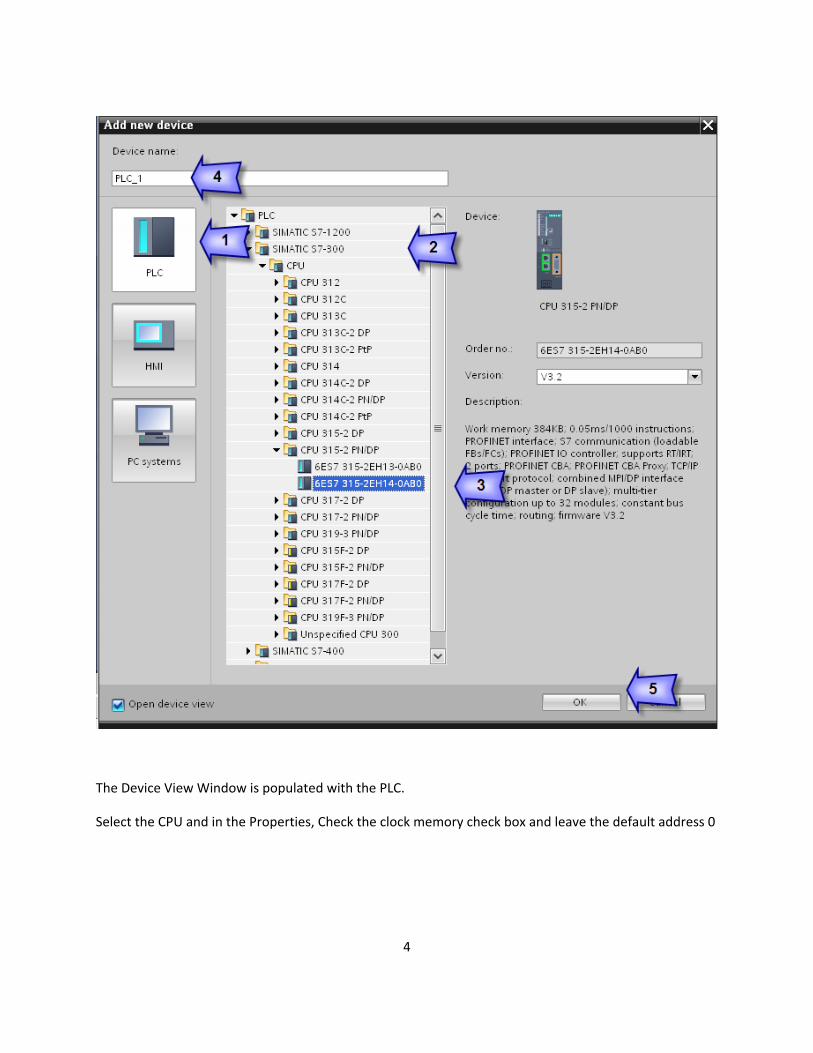
The Device View Window is populated with the PLC.
Select the CPU and in the Properties, Check the clock memory check box and leave the default address 0
4
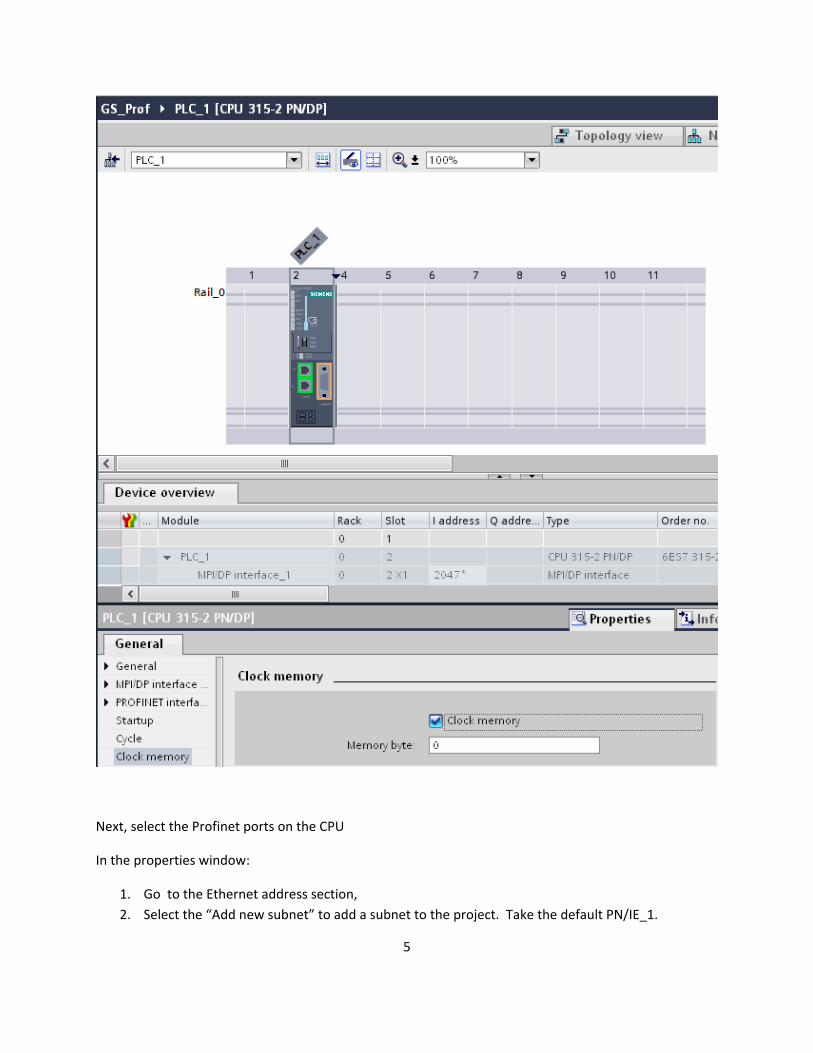
Next, select the Profinet ports on the CPU
In the properties window:
1. Go to the Ethernet address section, 2. Select the “Add new subnet” to add a subnet to the project. Take the default PN/IE_1.
5
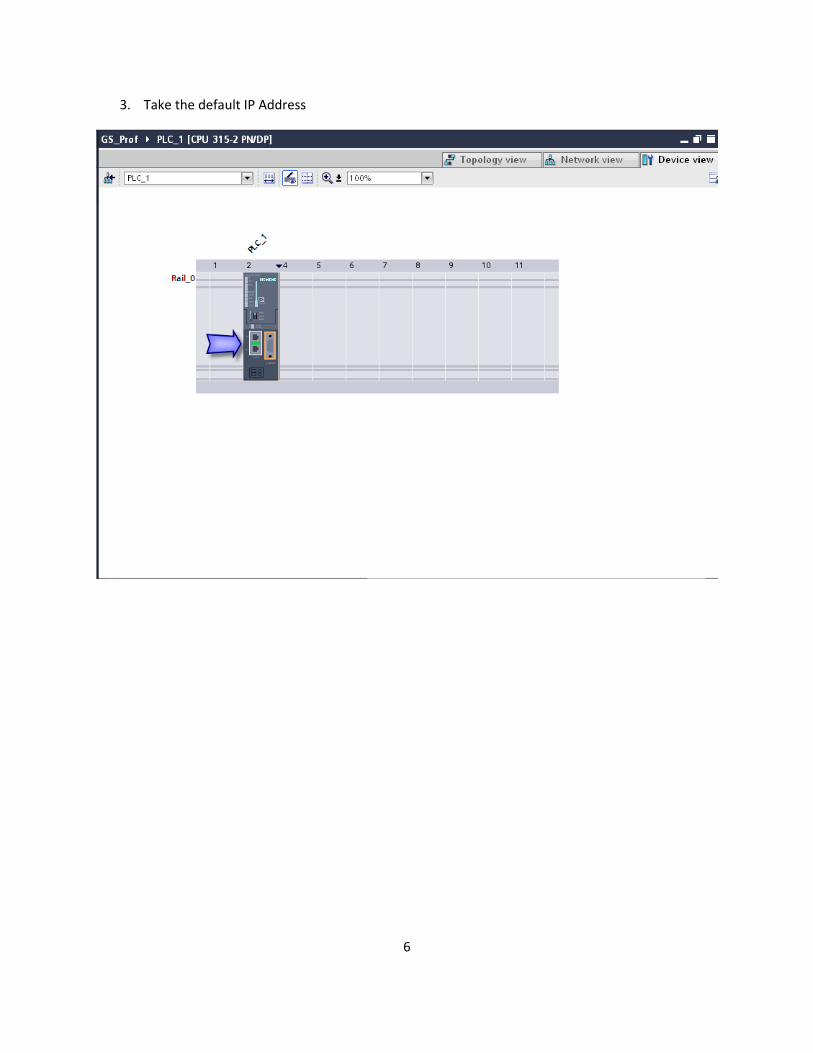
3. Take the default IP Address
6
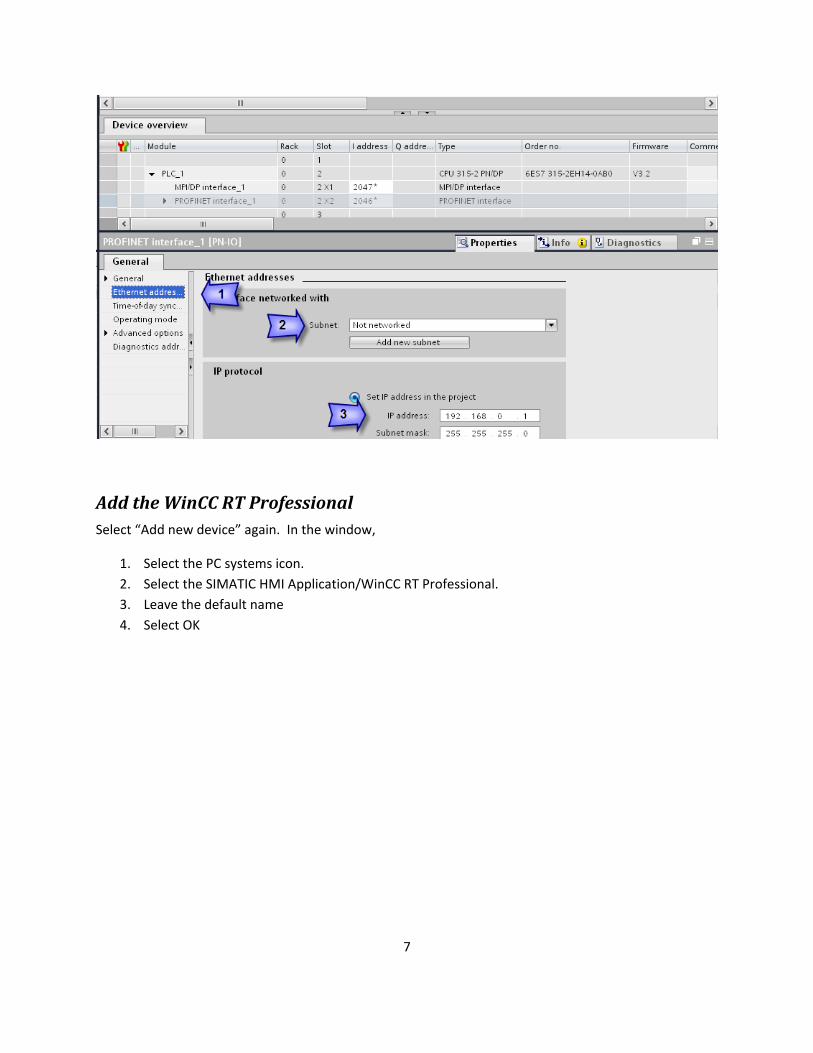
Add the WinCC RT Professional Select “Add new device” again. In the window,
1. Select the PC systems icon. 2. Select the SIMATIC HMI Application/WinCC RT Professional. 3. Leave the default name 4. Select OK
7
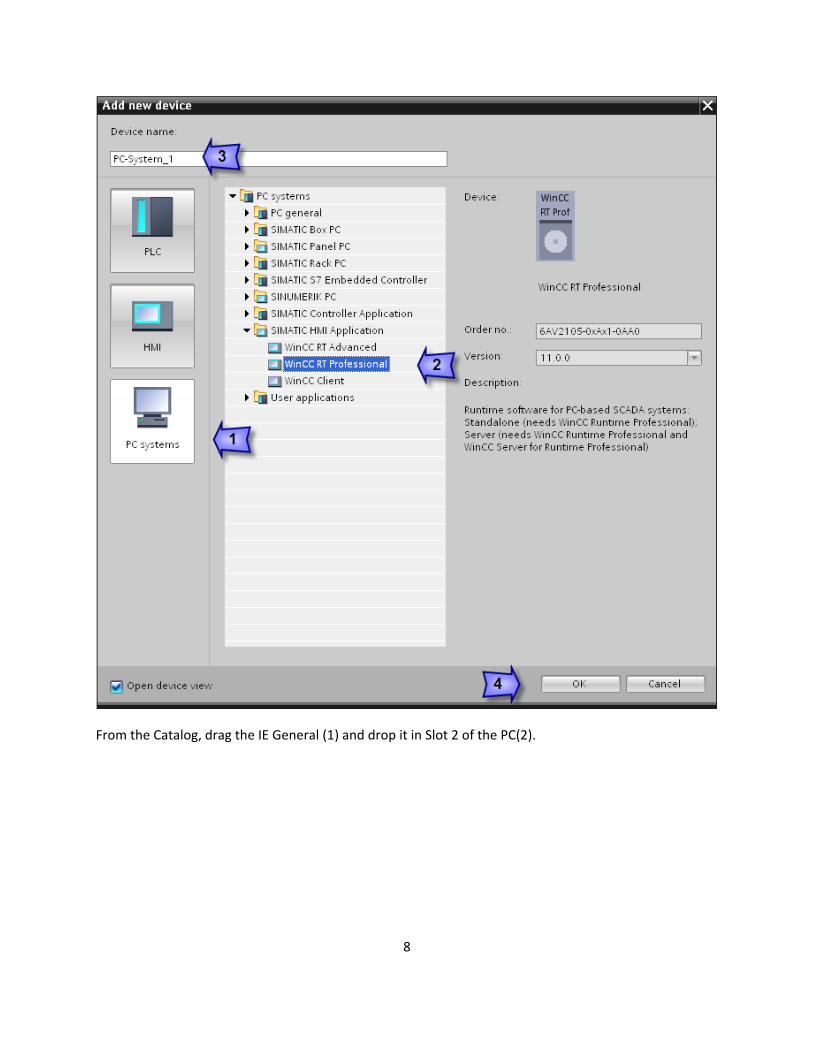
From the Catalog, drag the IE General (1) and drop it in Slot 2 of the PC(2).
8
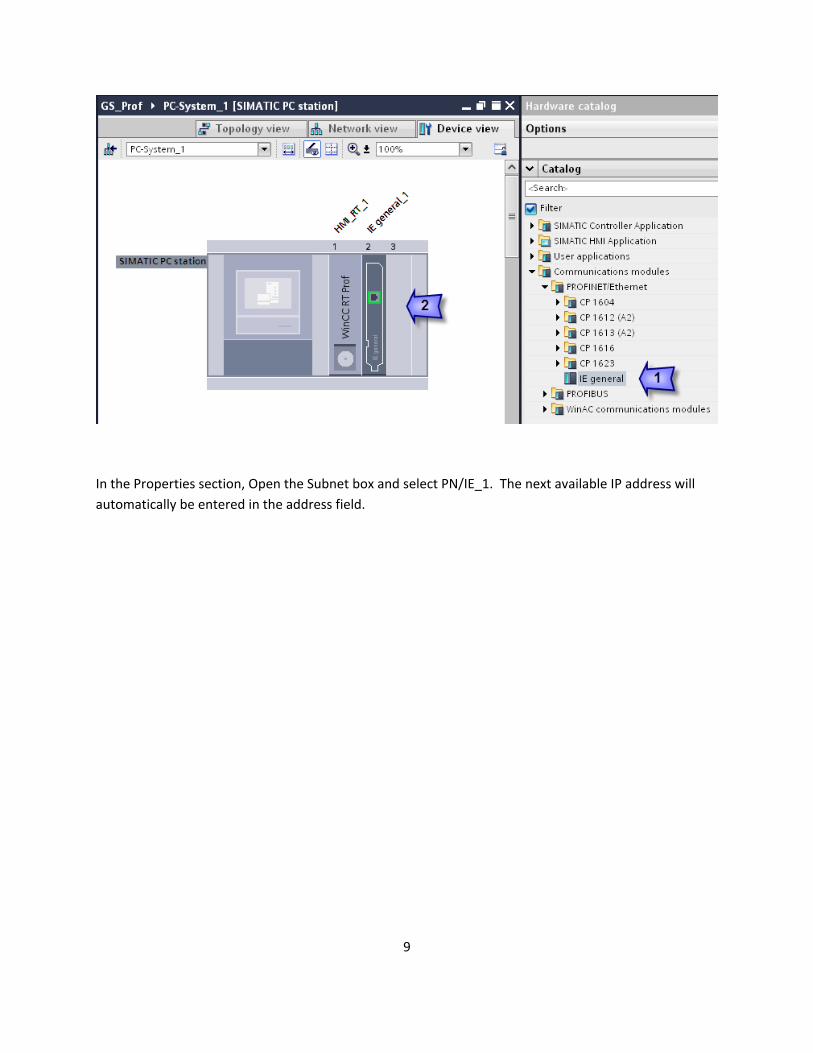
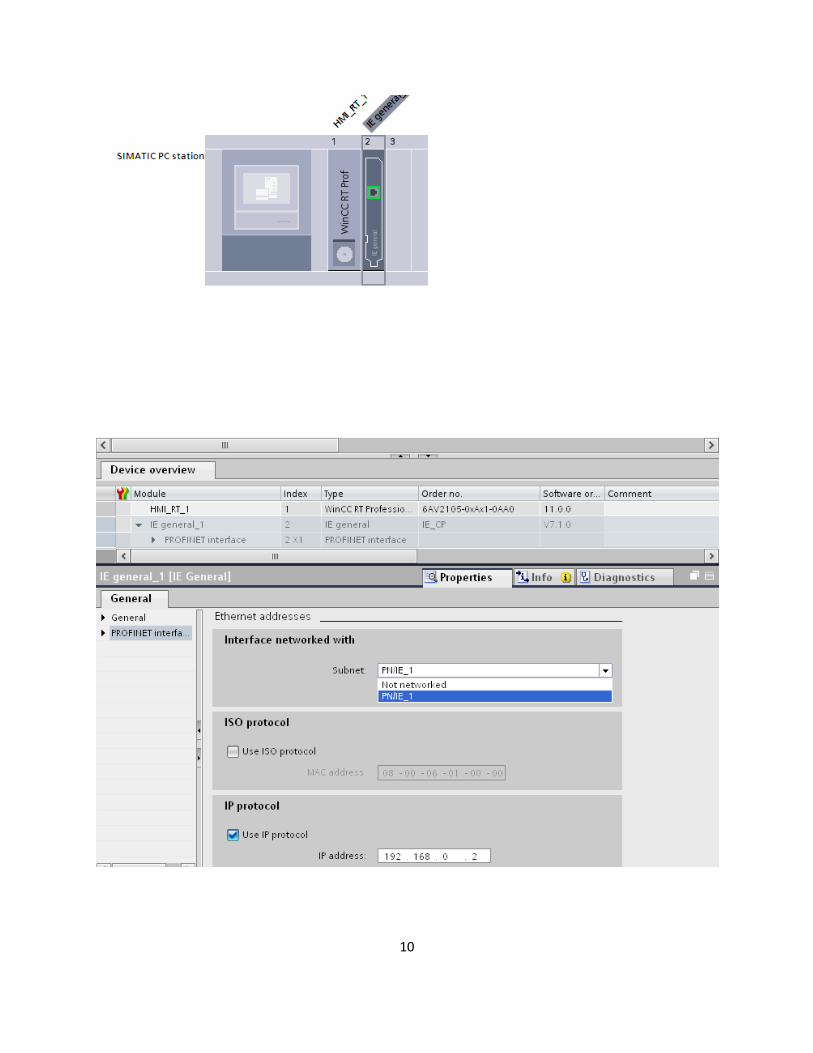
In the Properties section, Open the Subnet box and select PN/IE_1. The next available IP address will automatically be entered in the address field.
9
10
11
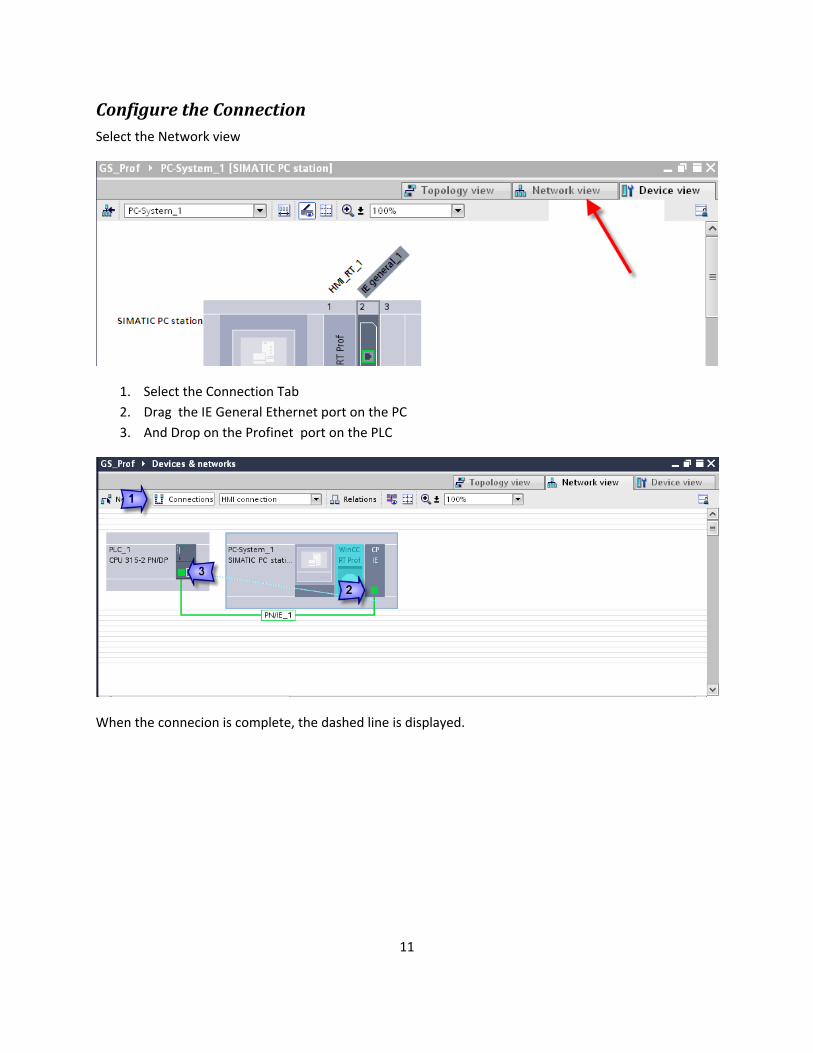
Configure the Connection Select the Network view
1. Select the Connection Tab 2. Drag the IE General Ethernet port on the PC 3. And Drop on the Profinet port on the PLC
When the connecion is complete, the dashed line is displayed.
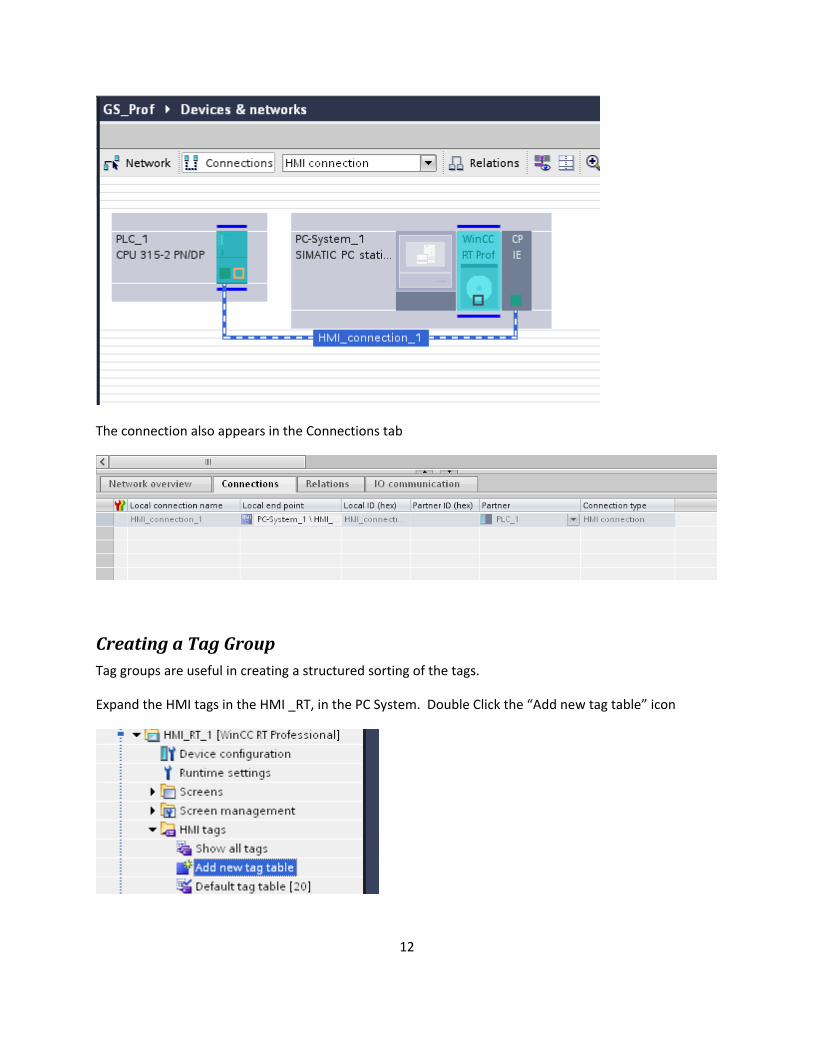
The connection also appears in the Connections tab
Creating a Tag Group Tag groups are useful in creating a structured sorting of the tags.
Expand the HMI tags in the HMI _RT, in the PC System. Double Click the “Add new tag table” icon
12
13
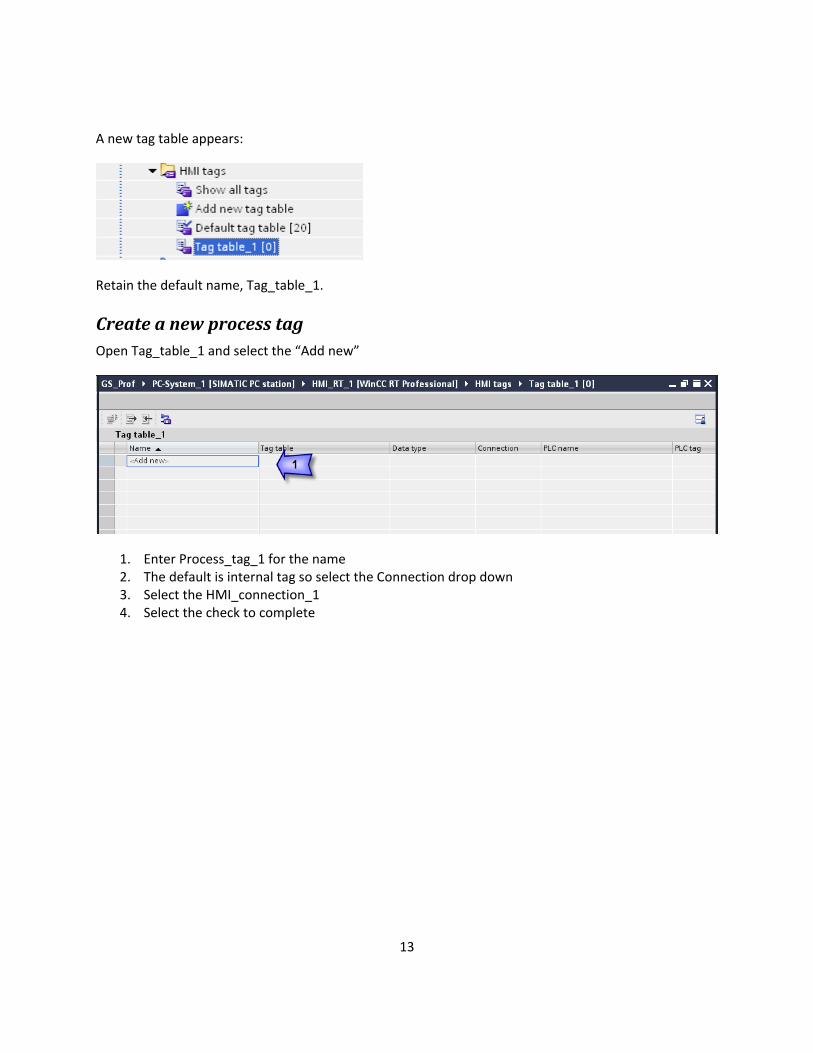
A new tag table appears:
Retain the default name, Tag_table_1.
Create a new process tag Open Tag_table_1 and select the “Add new”
1. Enter Process_tag_1 for the name 2. The default is internal tag so select the Connection drop down 3. Select the HMI_connection_1 4. Select the check to complete
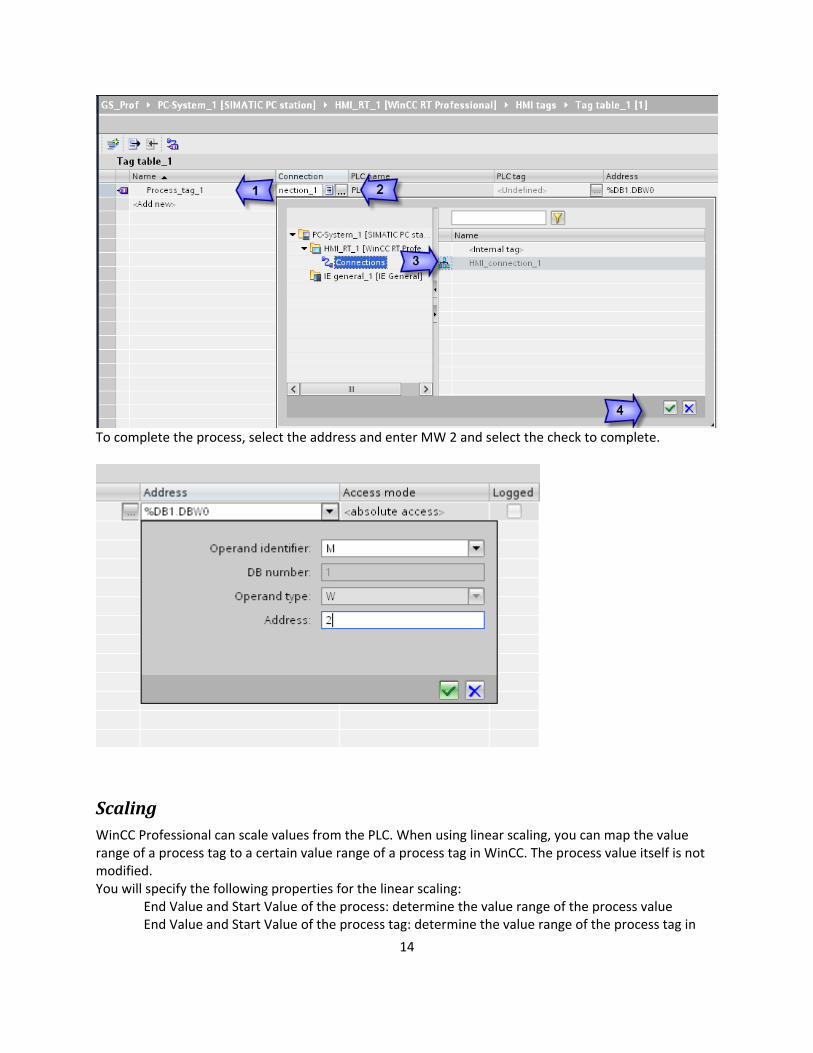
To complete the process, select the address and enter MW 2 and select the check to complete.
Scaling Wrange of a
inCC Professional can scale values from the PLC. When using linear scaling, you can map the value process tag to a certain value range of a process tag in WinCC. The process value itself is not
modified. You will specify the following properties for the linear scaling:
End Value and Start Value of the process: determine the value range of the process value End Value and Start Value of the process tag: determine the value range of the process tag in
14
15
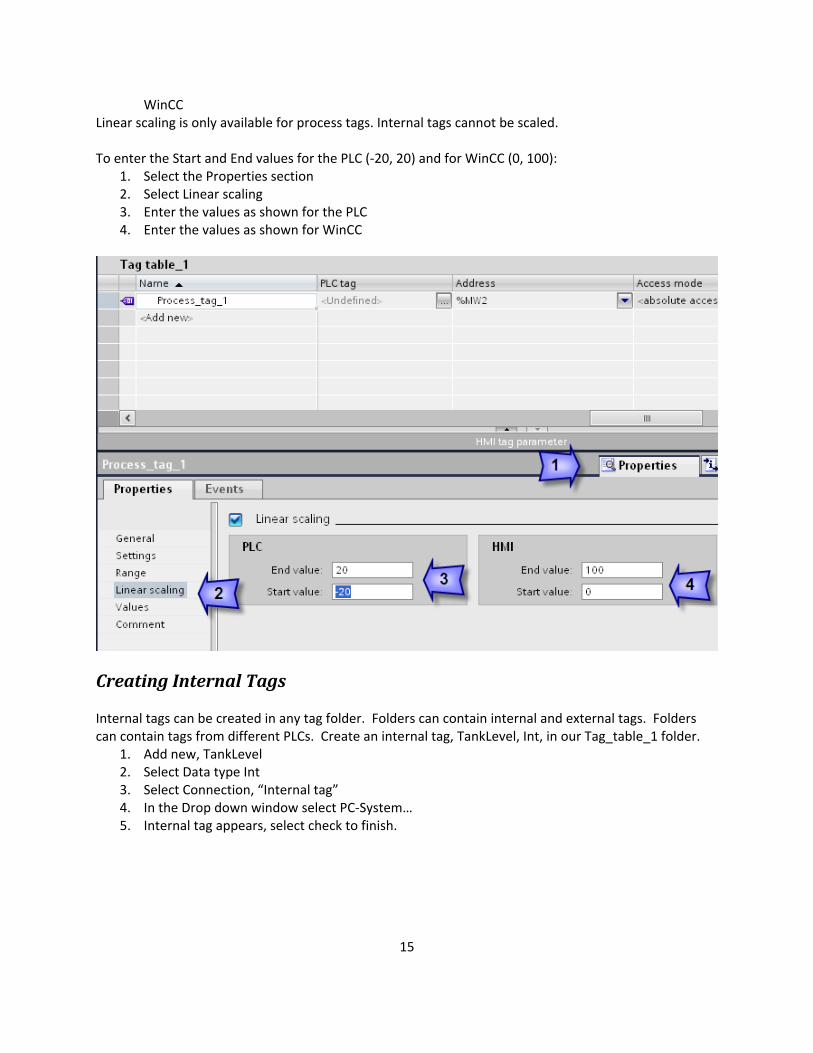
WinCC Linear scaling is only available for process tags. Internal tags cannot be scaled. To enter the Start and End values for the PLC (-20, 20) and for WinCC (0, 100):
1. Select the Properties section 2. Select Linear scaling 3. Enter the values as shown for the PLC 4. Enter the values as shown for WinCC
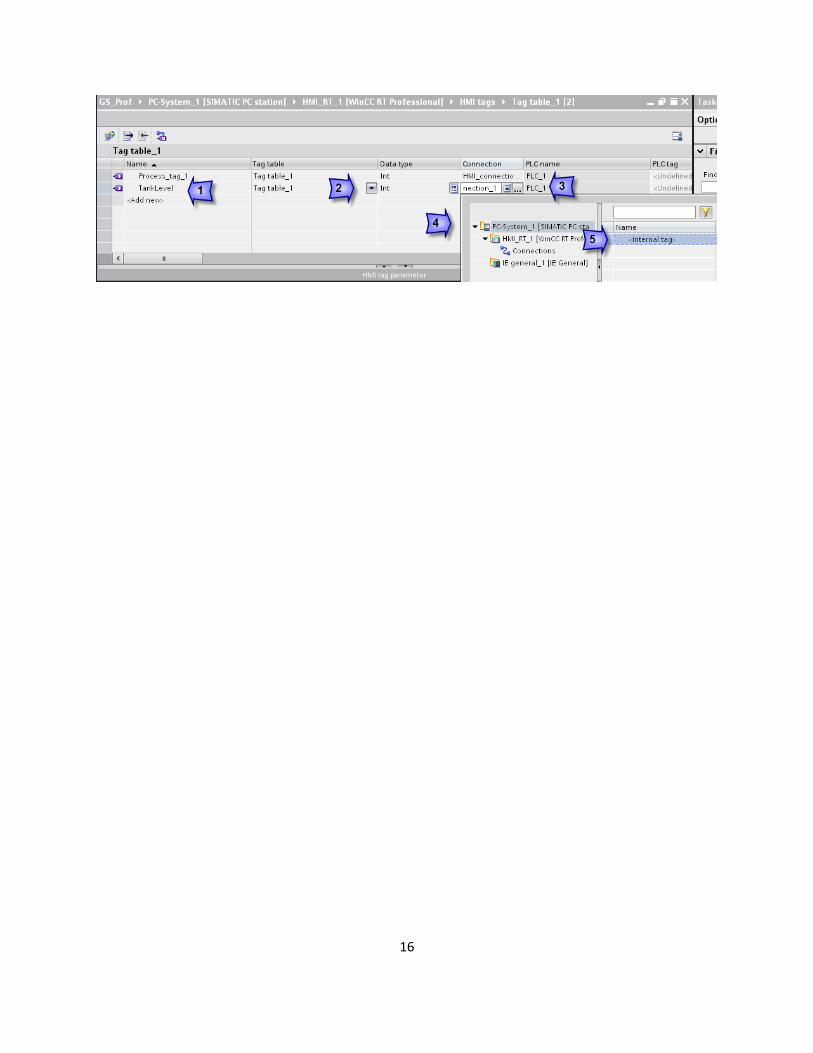
Creating Internal Tags Internal tags can be created in any tag folder. Folders can contain internal and external tags. Folders can contain tags from different PLCs. Create an internal tag, TankLevel, Int, in our Tag_table_1 folder.
1. Add new, TankLevel 2. Select Data type Int 3. Select Connection, “Internal tag” 4. In the Drop down window select PC-System… 5. Internal tag appears, select check to finish.
16
17
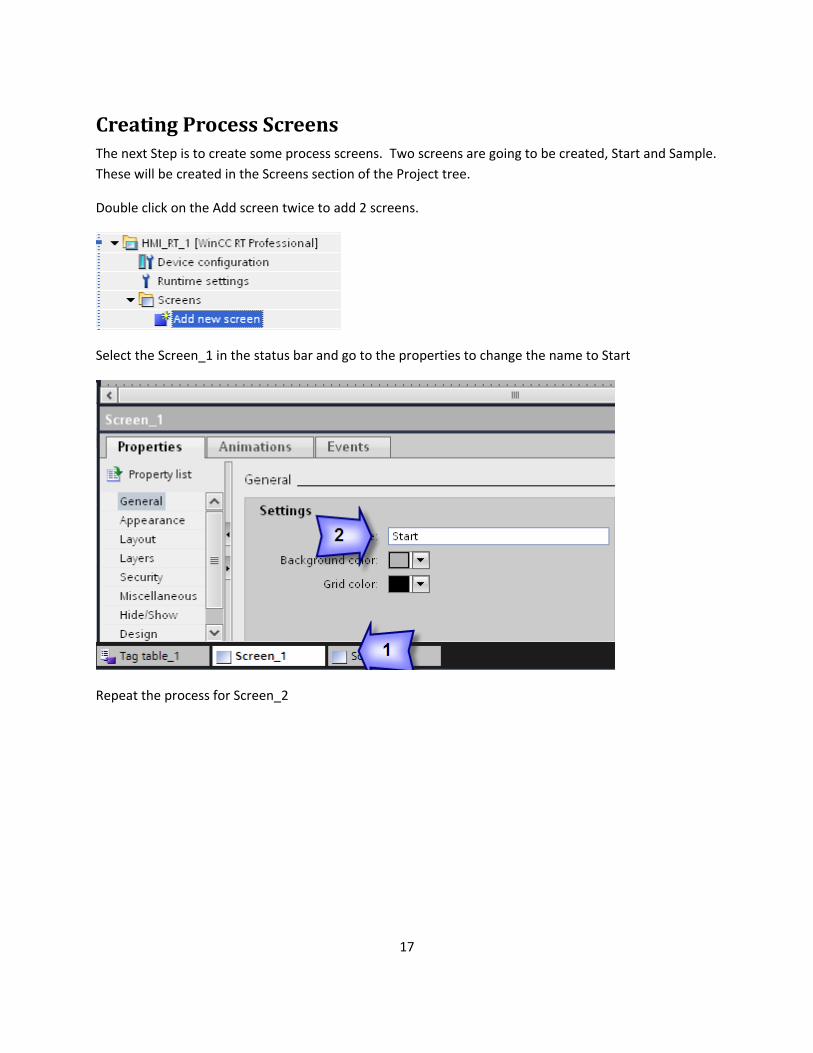
Creating Process Screens The next Step is to create some process screens. Two screens are going to be created, Start and Sample. These will be created in the Screens section of the Project tree.
Double click on the Add screen twice to add 2 screens.
Select the Screen_1 in the status bar and go to the properties to change the name to Start
Repeat the process for Screen_2
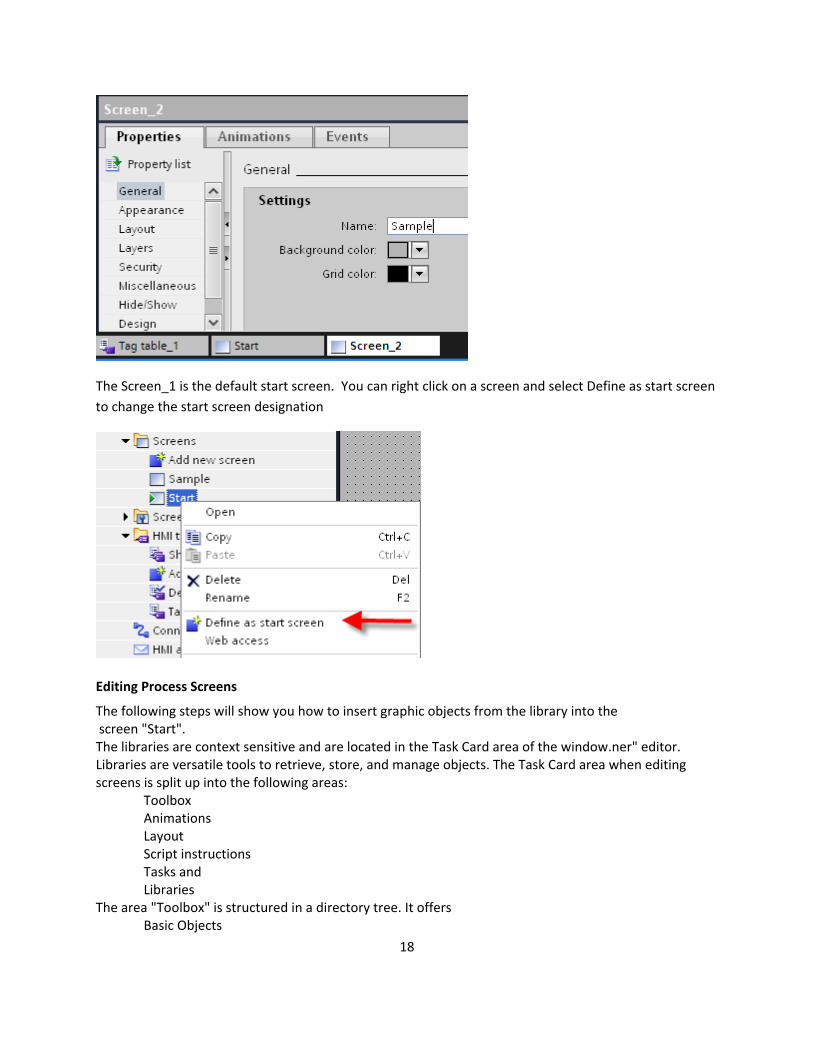
The Screen_1 is the default start screen. You can right click on a screen and select Define as start screen to change the start screen designation
Editing Process Screens
The following steps will show you how to insert graphic objects from the library into the screen "Start". The libraries are context sensitive and are located in the Task Card area of the window.ner" editor. Libraries are versatile tools to retrieve, store, and manage objects. The Task Card area when editing screens is split up into the following areas:
Toolbox Animations Layout Script instructions Tasks and Libraries
The area "Toolbox" is structured in a directory tree. It offers Basic Objects
18
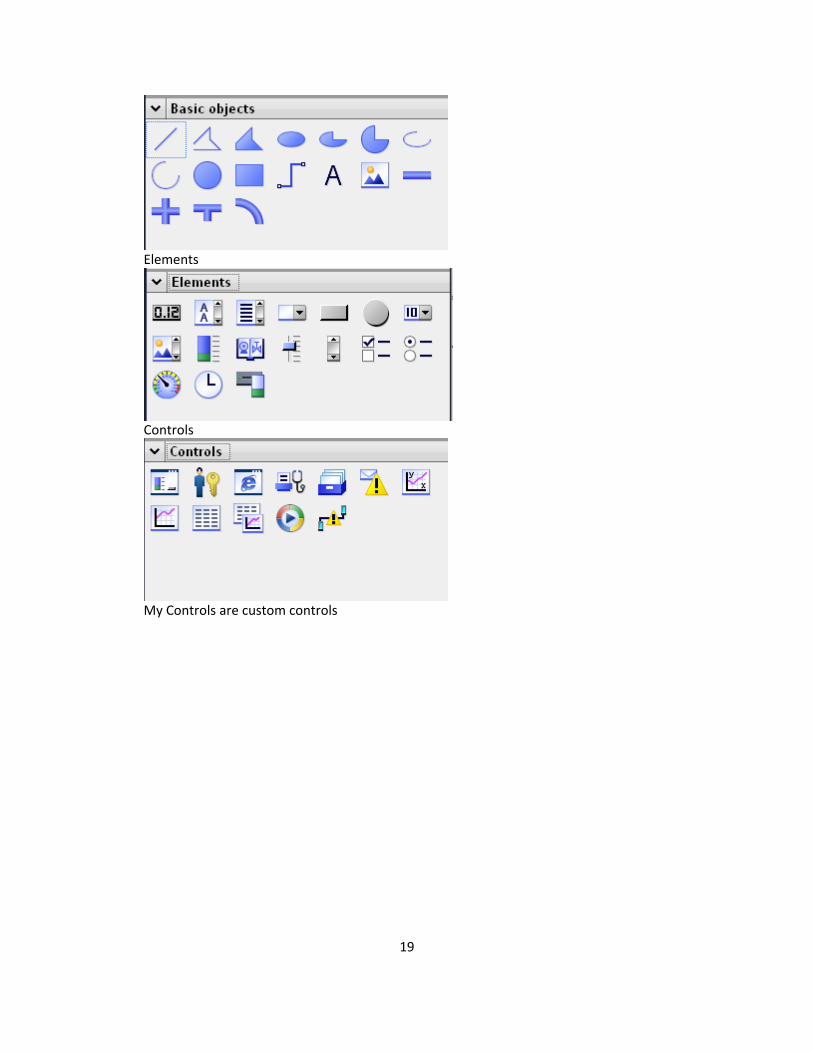
Elements
Controls
My Controls are custom controls
19
20
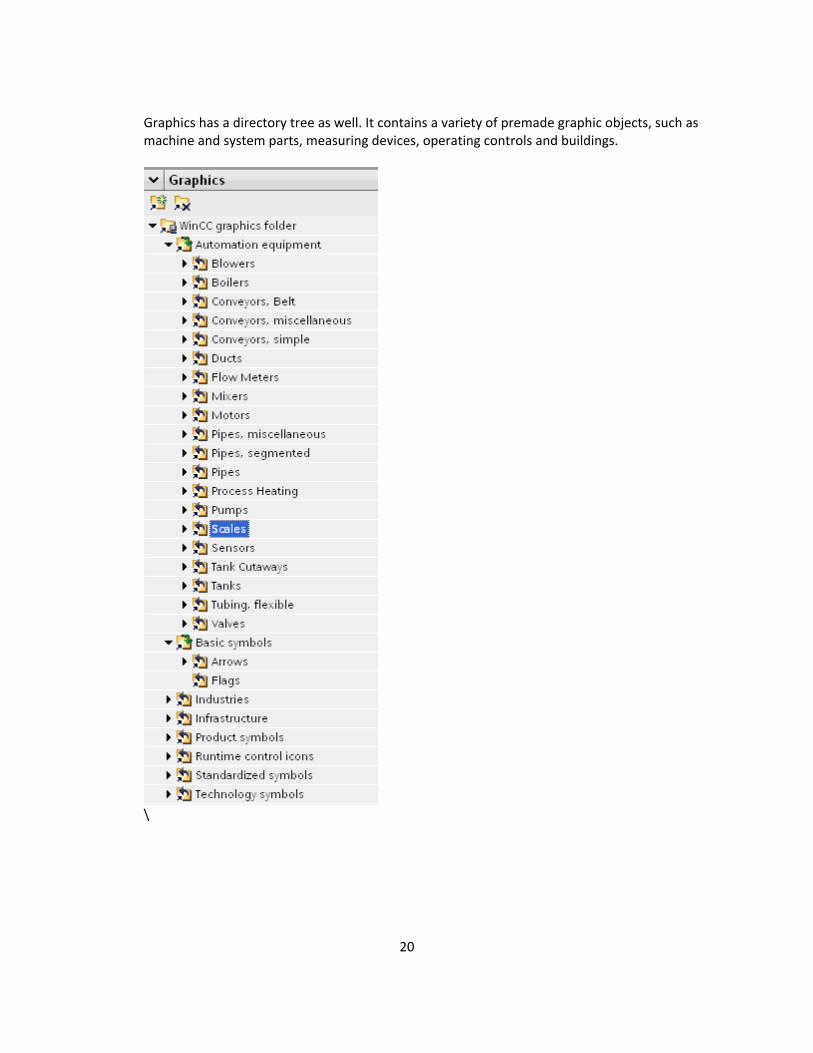
bjects, such as machine and system parts, measuring devices, operating controls and buildings.
Graphics has a directory tree as well. It contains a variety of premade graphic o
\
21
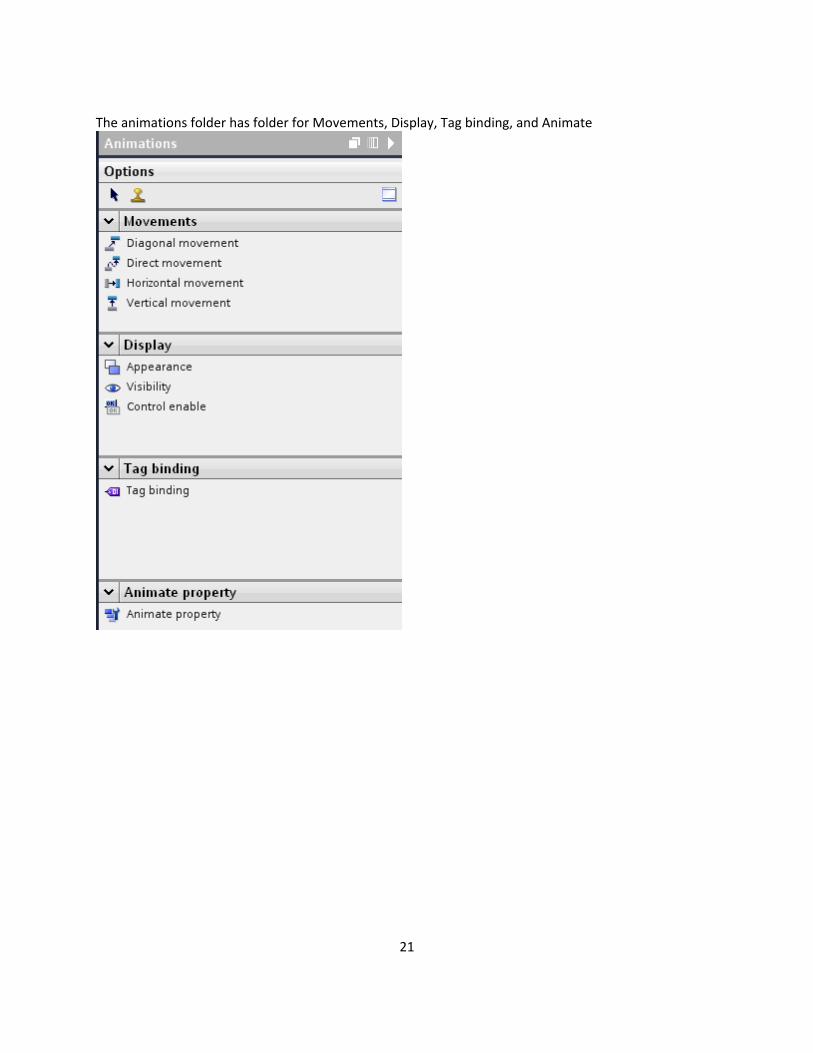
The animations folder has folder for Movements, Display, Tag binding, and Animate
22
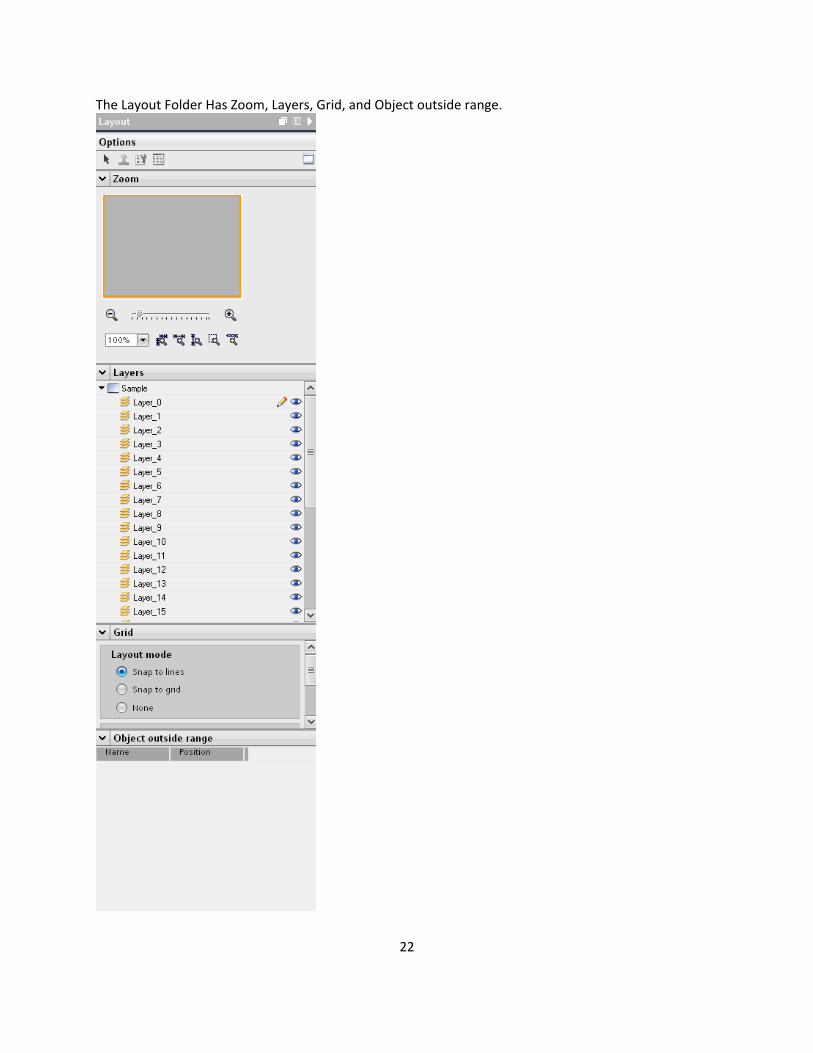
The Layout Folder Has Zoom, Layers, Grid, and Object outside range.
23
If you assign objects to positions that are outside the configurable area, these objects will be hidden. The functions of the "Objects outside the visible area" palette in the "Layout" task card are used to move these objects back into the screen.
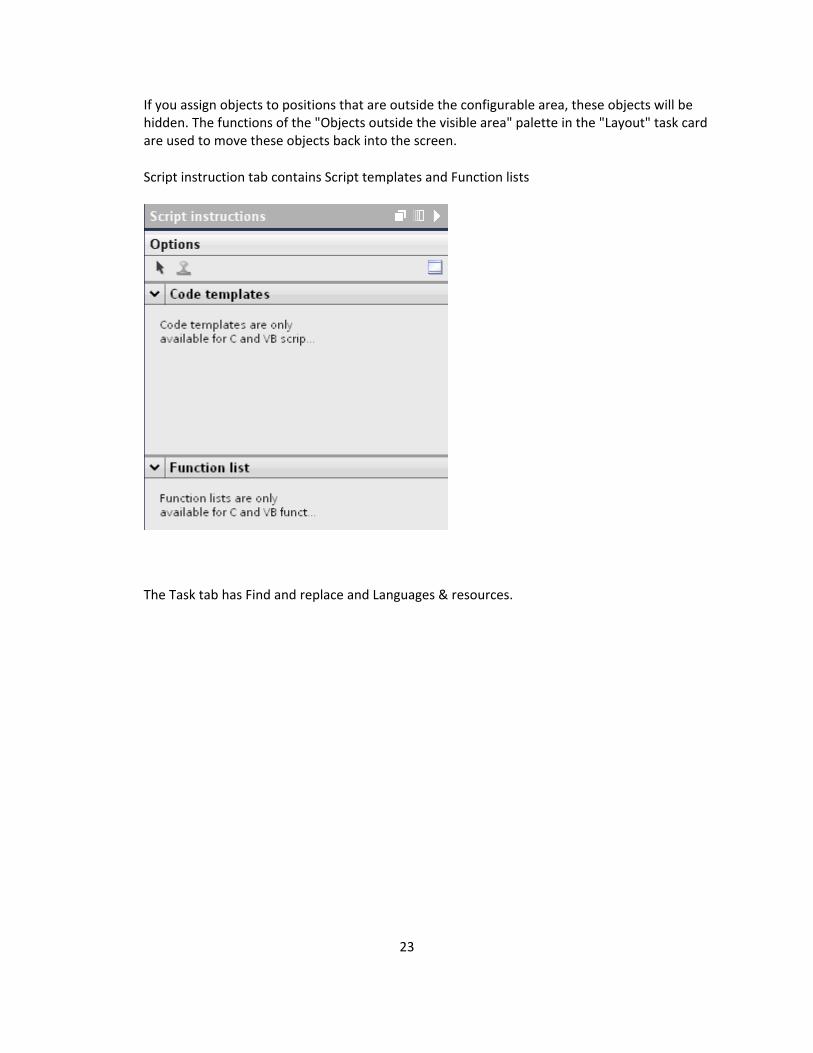
Script instruction tab contains Script templates and Function lists
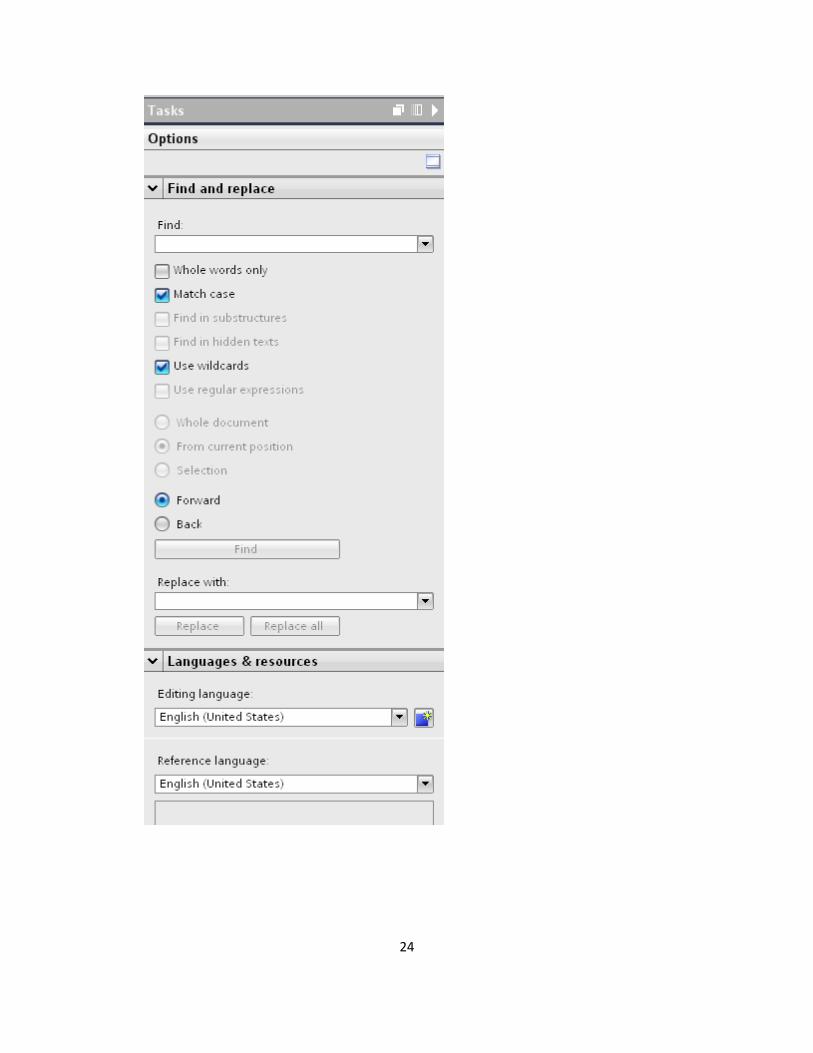
The Task tab has Find and replace and Languages & resources.
24
25
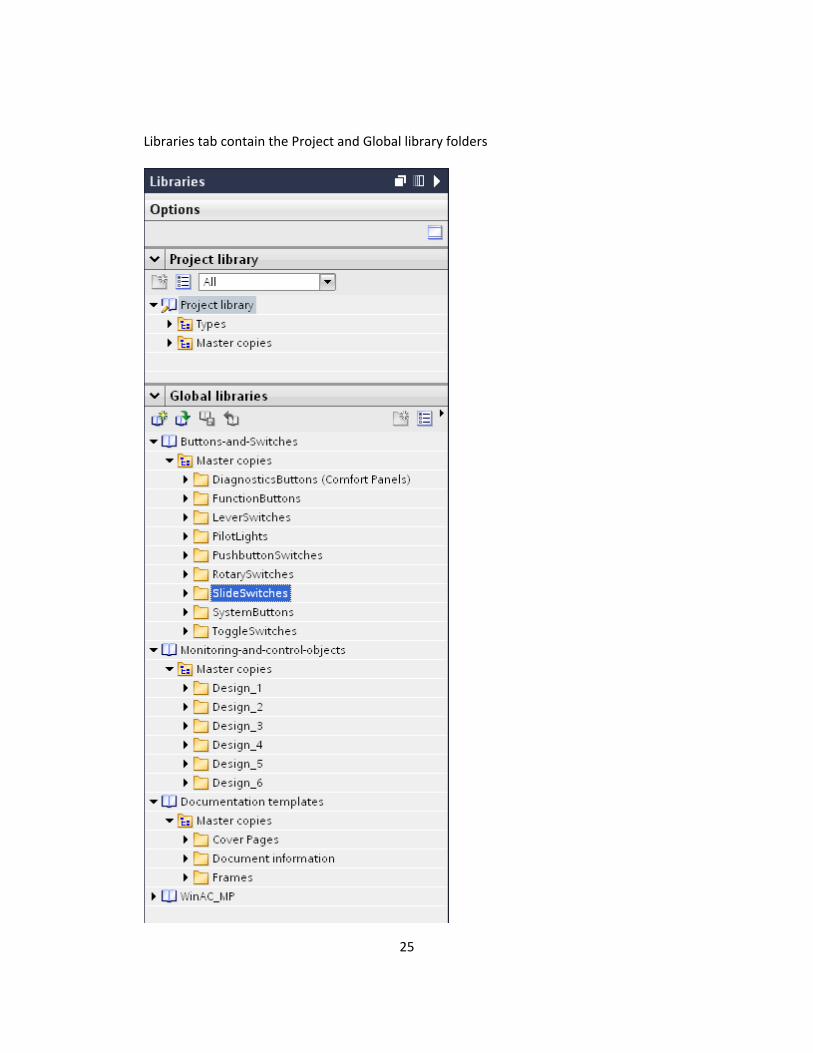
d Global library folders Libraries tab contain the Project an
26
In the area "Project library" you can store self-made objects. These objects can be copied to the global library or you can create global libraries.
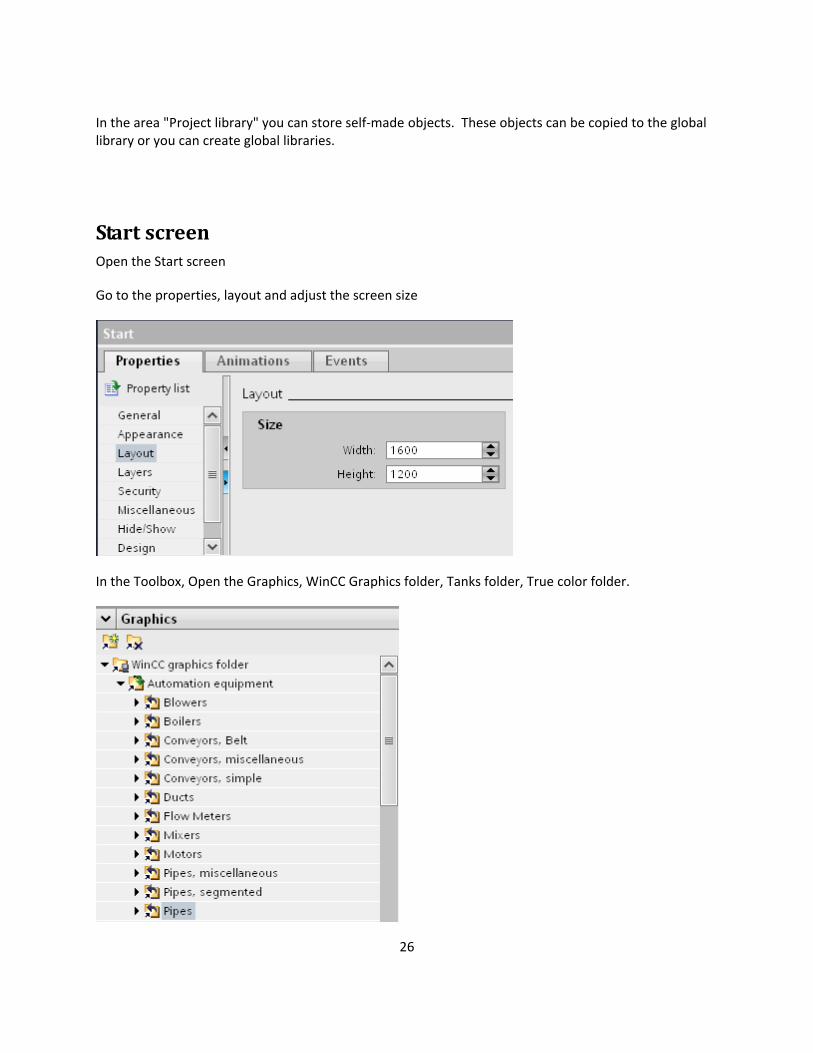
Open the Start screen
Go to the properties, layout and adjust the screen size
Start screen
In the Toolbox, Open the Graphics, WinCC Graphics folder, Tanks folder, True color folder.
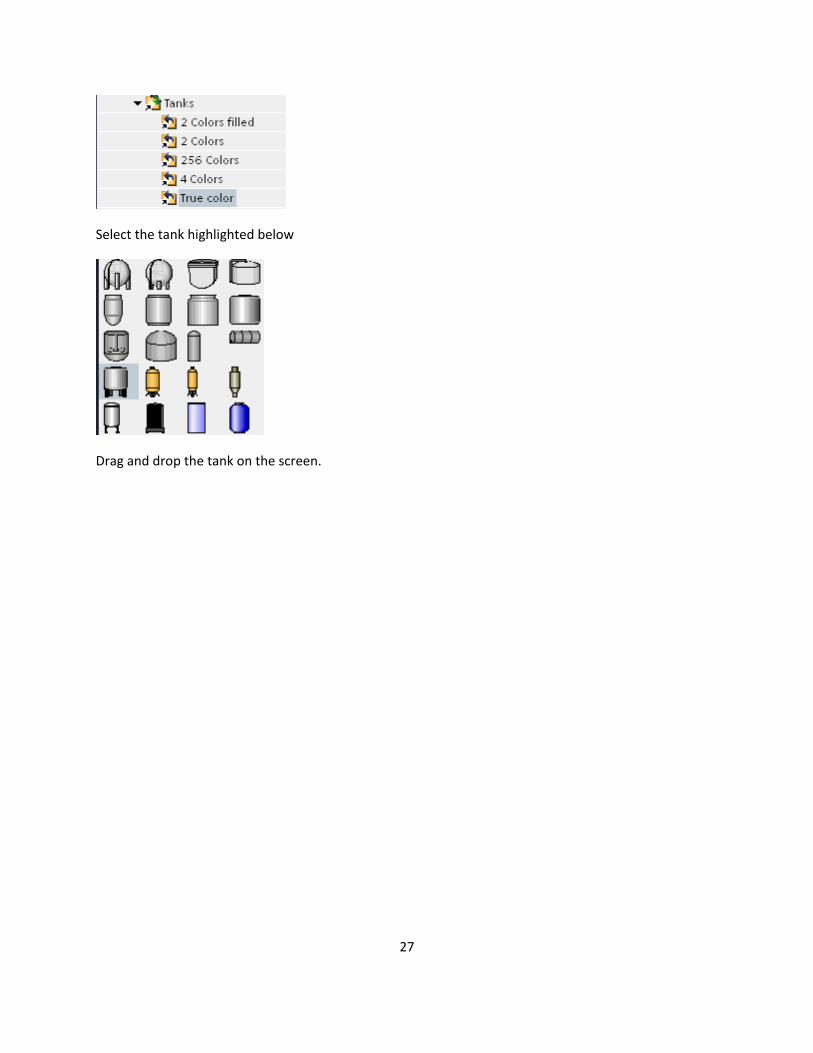
Select the tank highlighted below
Drag and drop the tank on the screen.
27
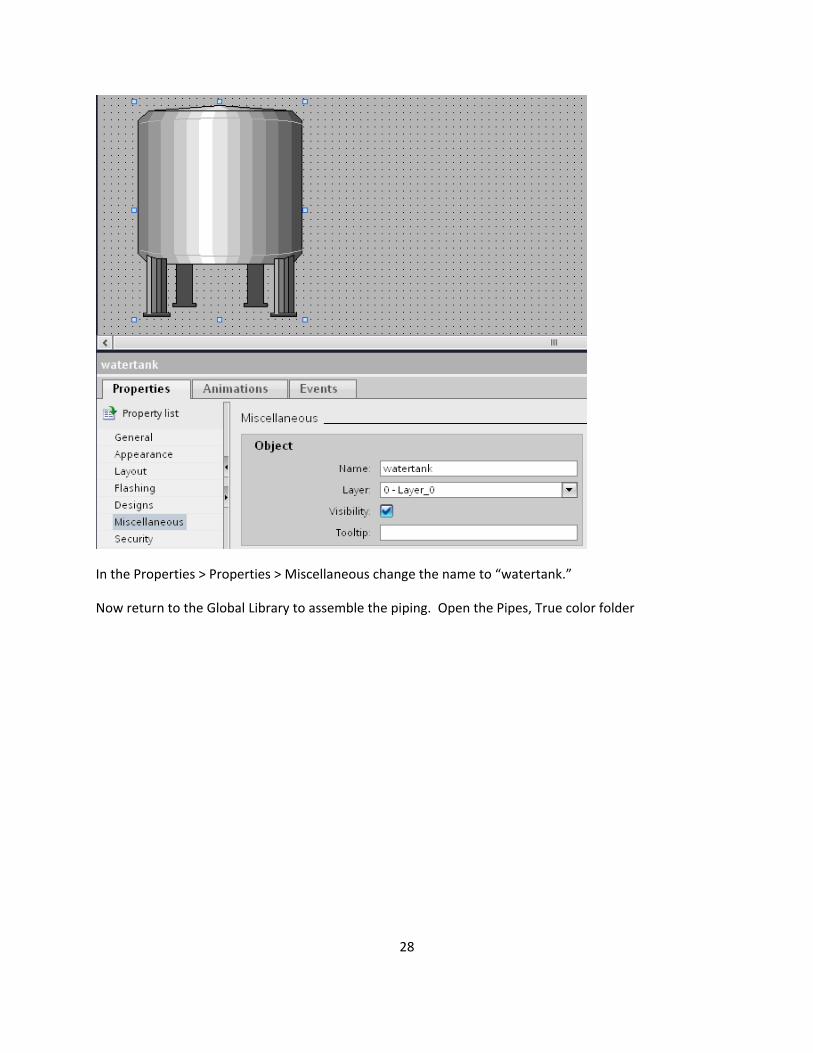
In the Properties > Properties > Miscellaneous change the name to “watertank.”
Now return to the Global Library to assemble the piping. Open the Pipes, True color folder
28
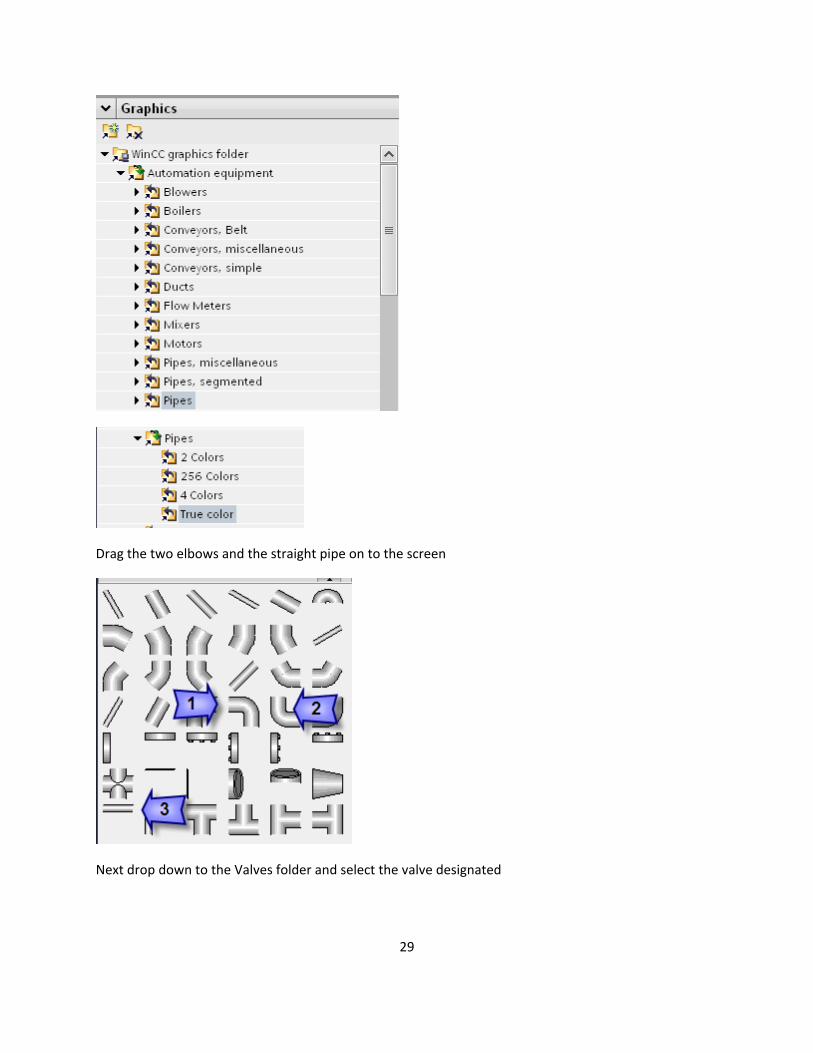
Drag the two elbows and the straight pipe on to the screen
Next drop down to the Valves folder and select the valve designated
29
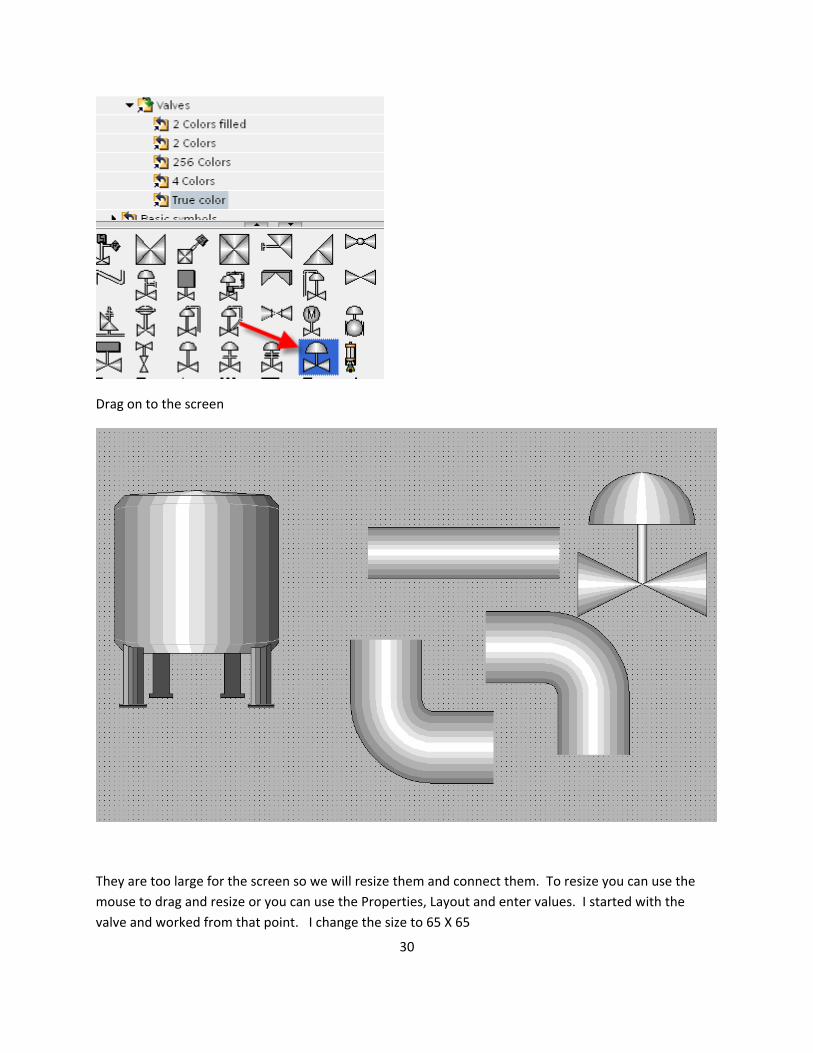
Drag on to the screen
They are too large for the screen so we will resize them and connect them. To resize you can use the mouse to drag and resize or you can use the Properties, Layout and enter values. I started with the valve and worked from that point. I change the size to 65 X 65
30
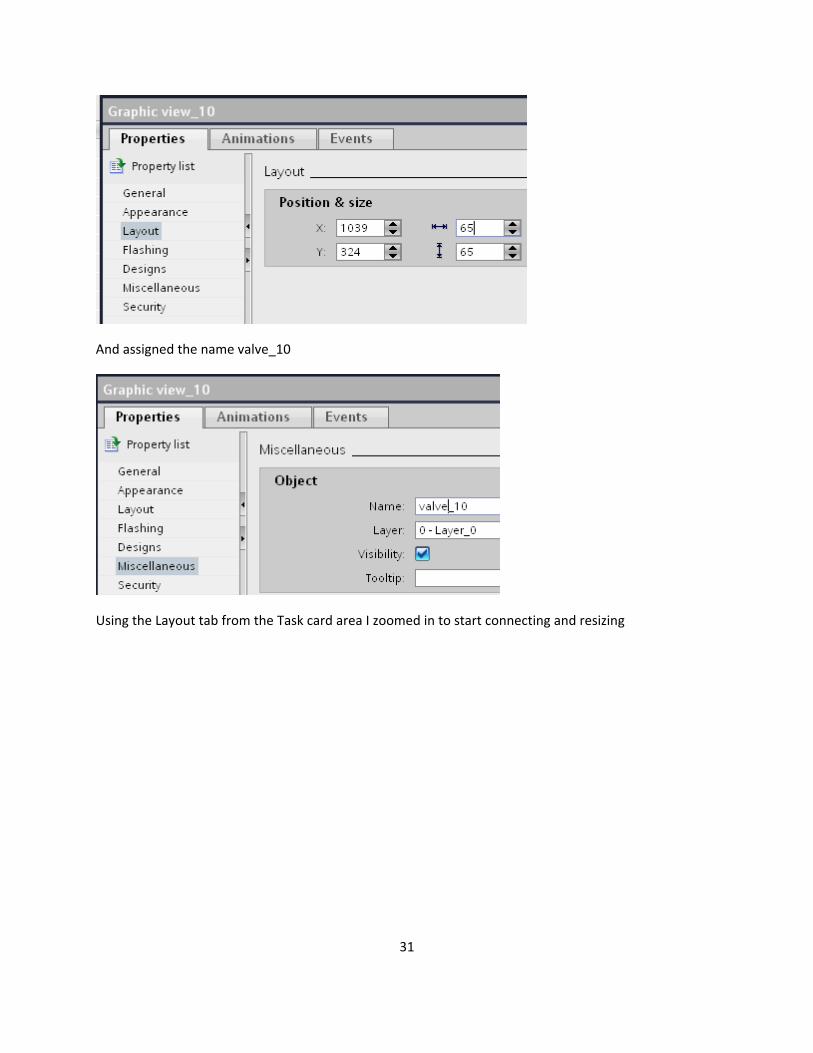
And assigned the name valve_10
Using the Layout tab from the Task card area I zoomed in to start connecting and resizing
31
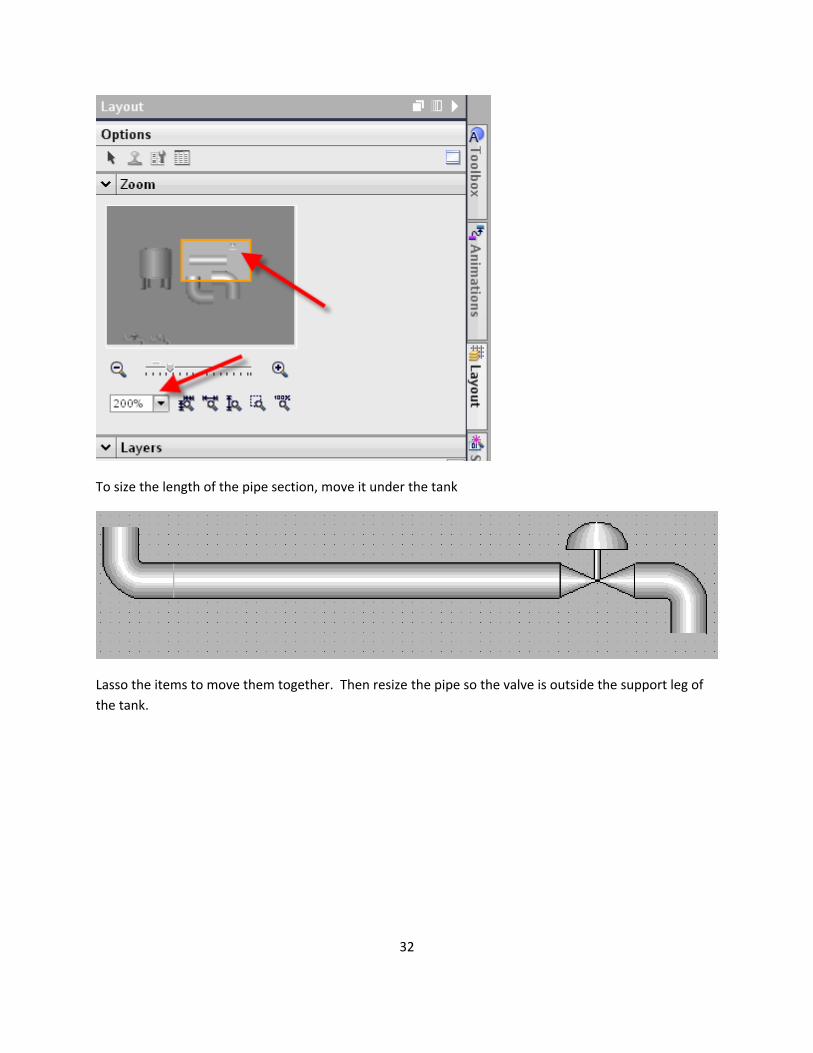
To size the length of the pipe section, move it under the tank
Lasso the items to move them together. Then resize the pipe so the valve is outside the support leg of the tank.
32

Lasso the drain pipe pieces, right click and select Group to group the objects
Rename the group DrainGroup. Copy the DrainGroup and make it the InletGroup
33
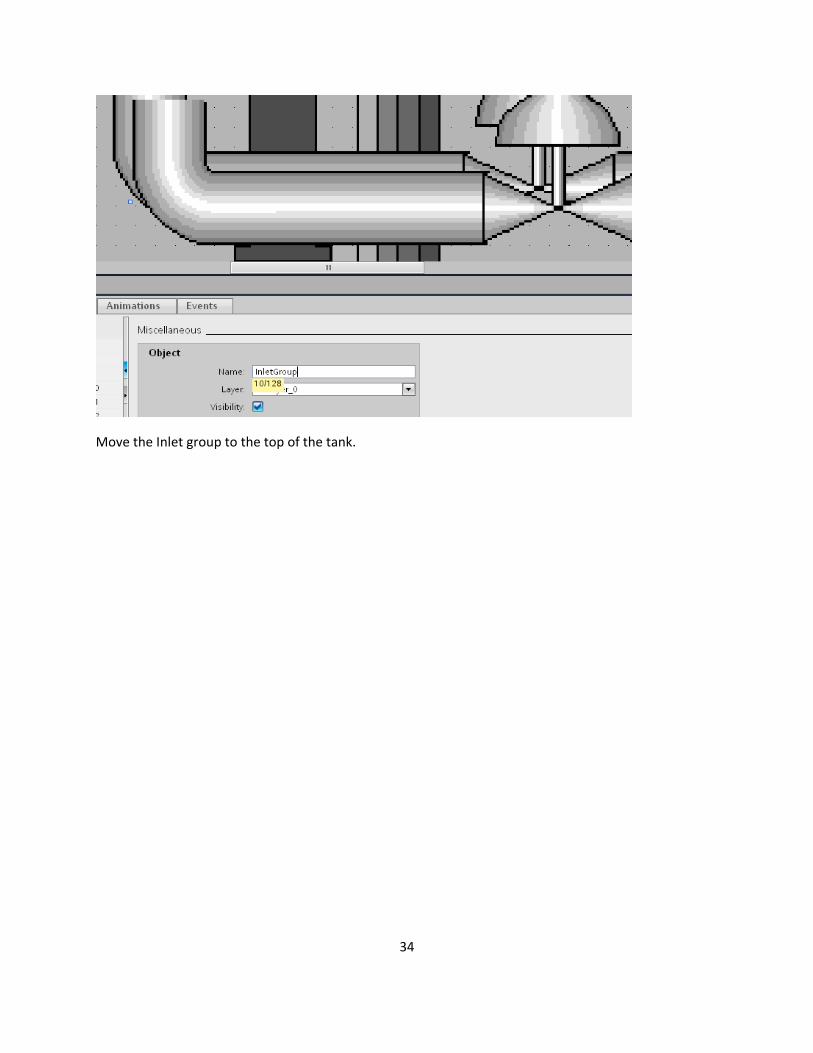
Move the Inlet group to the top of the tank.
34
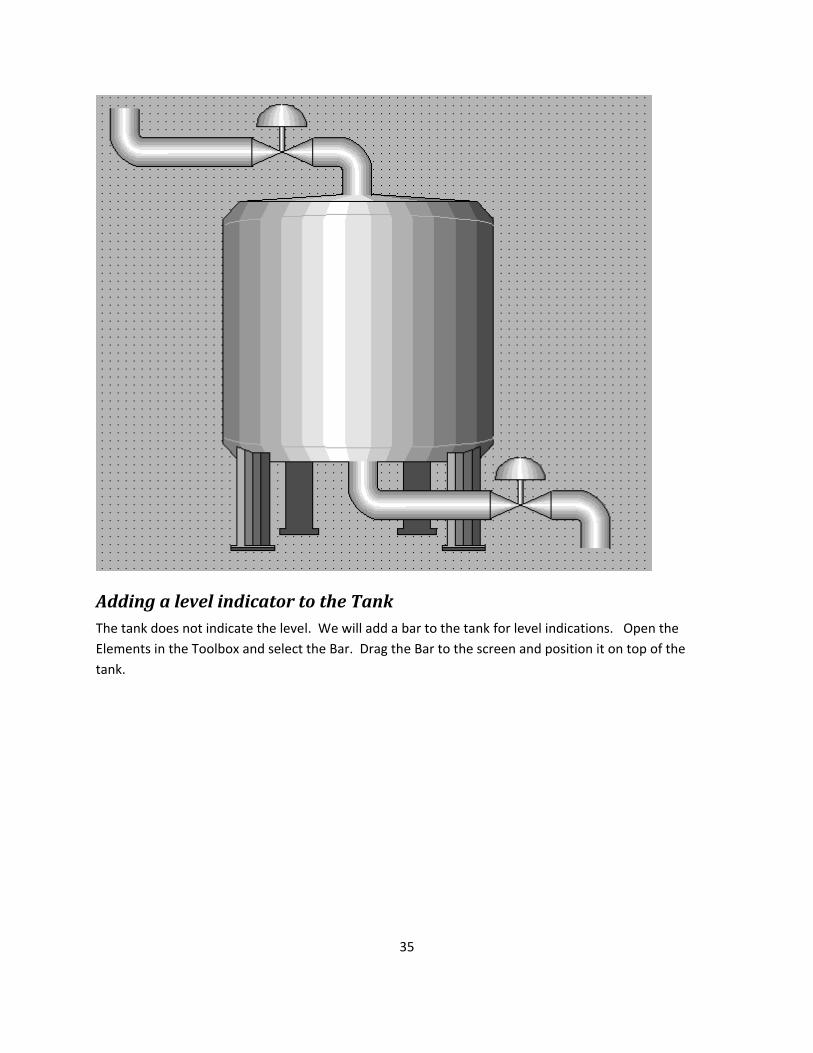
Adding a level indicator to the Tank The tank does not indicate the level. We will add a bar to the tank for level indications. Open the Elements in the Toolbox and select the Bar. Drag the Bar to the screen and position it on top of the tank.
35
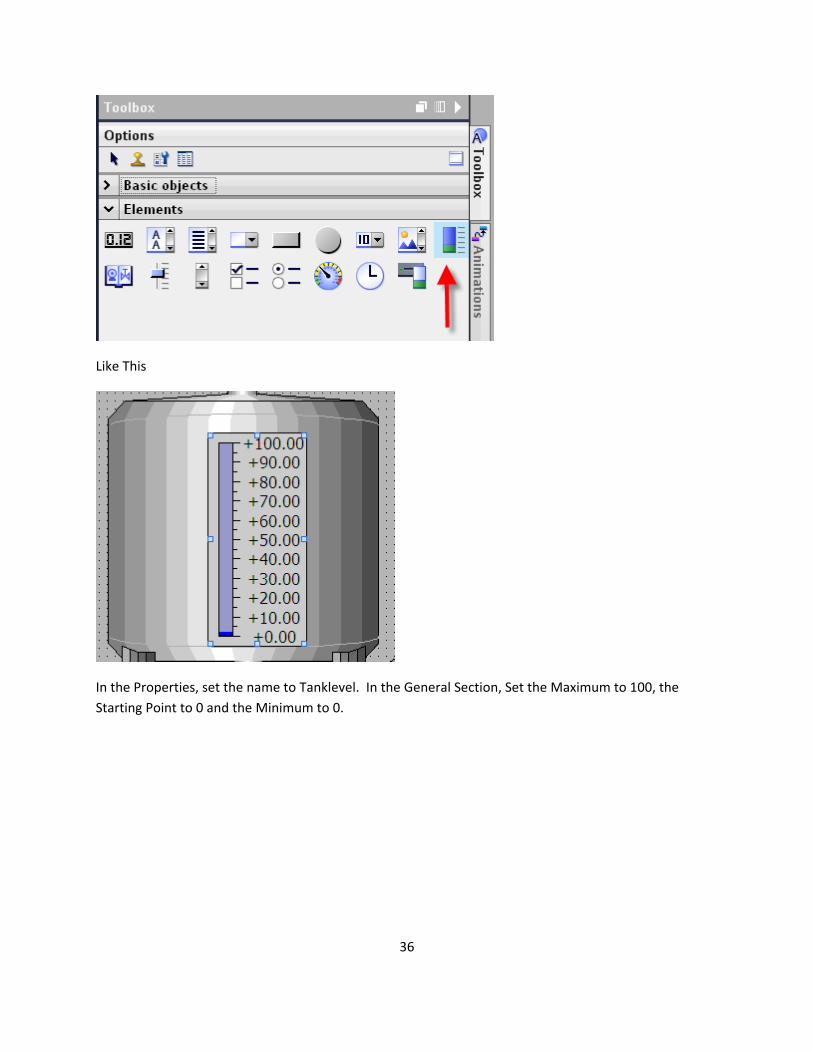
Like This
In the Properties, set the name to Tanklevel. In the General Section, Set the Maximum to 100, the Starting Point to 0 and the Minimum to 0.
36
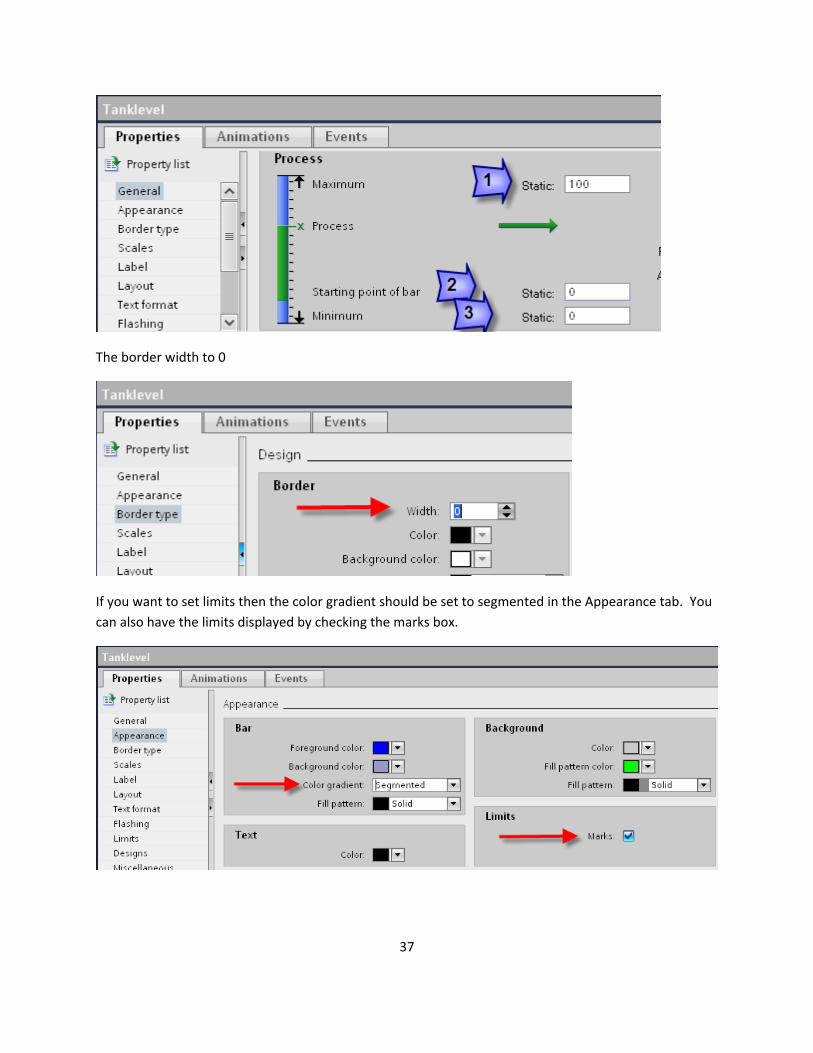
The border width to 0
If you want to set limits then the color gradient should be set to segmented in the Appearance tab. You can also have the limits displayed by checking the marks box.
37
38
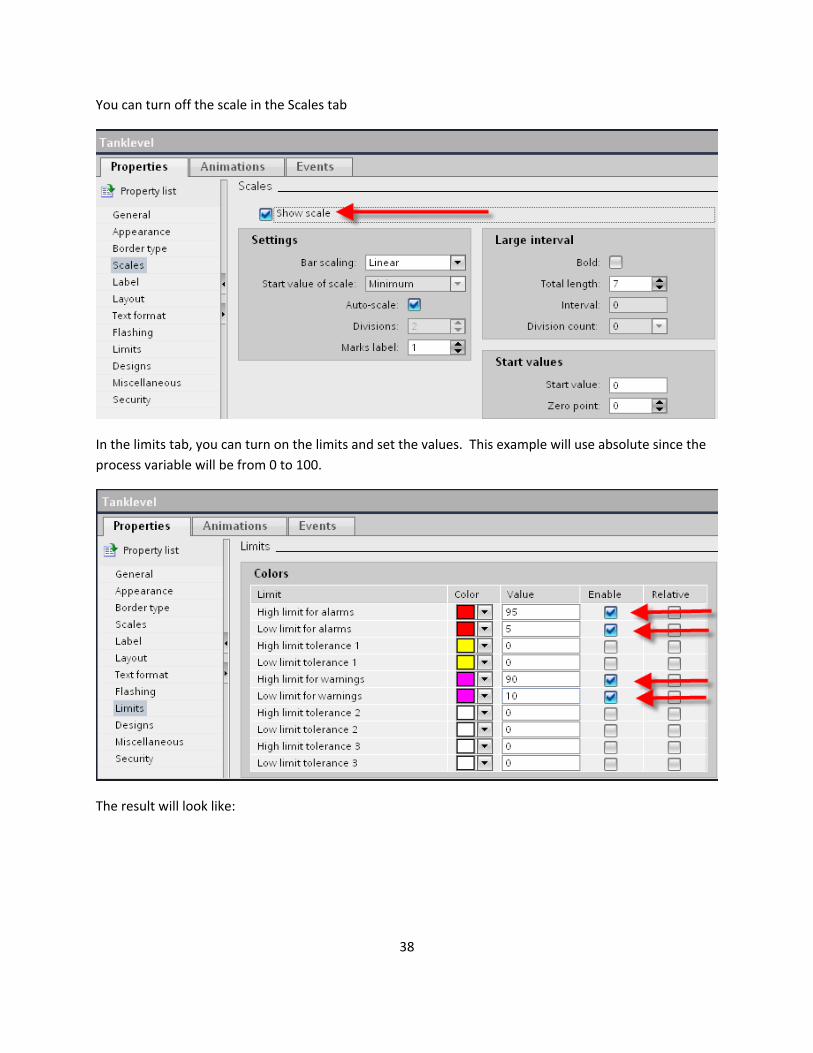
You can turn off the scale in the Scales tab
In the limits tab, you can turn on the limits and set the values. This example will use absolute since the process variable will be from 0 to 100.
The result will look like:
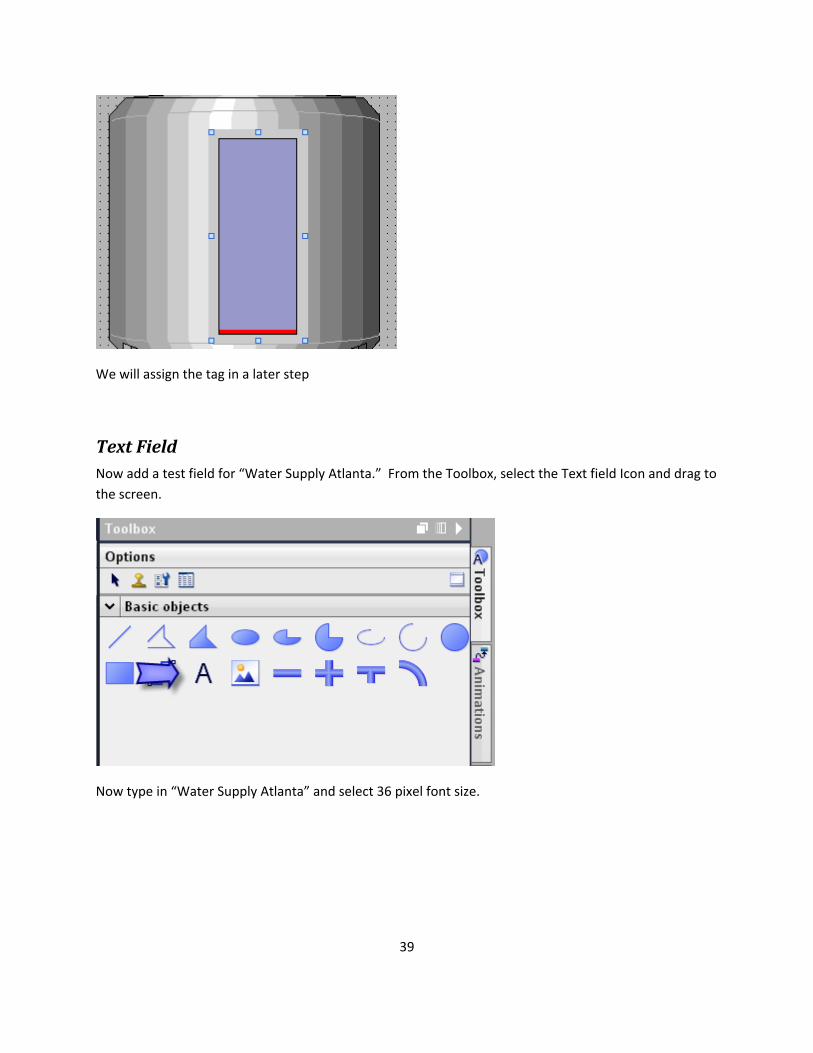
We will assign the tag in a later step
Now add a test field for “Water Supply Atlanta.” From the Toolbox, select the Text field Icon and drag to
Text Field
the screen.
Now type in “Water Supply Atlanta” and select 36 pixel font size.
39
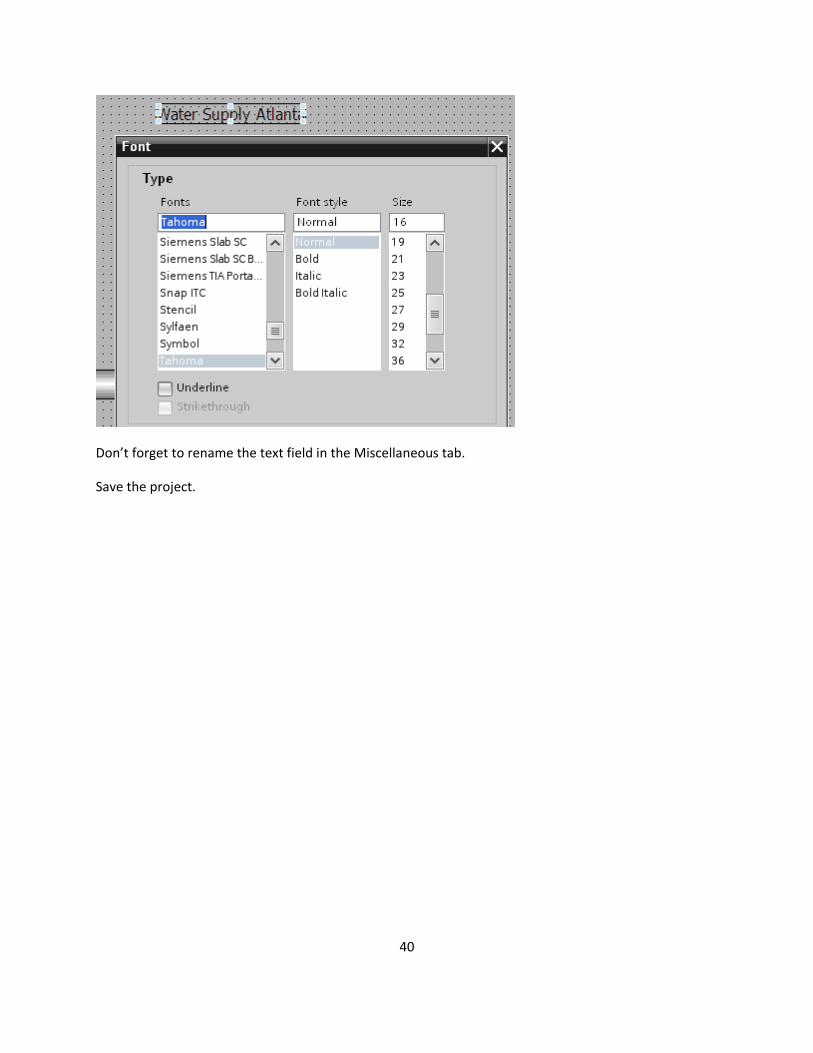
Don’t forget to rename the text field in the Miscellaneous tab.
Save the project.
40
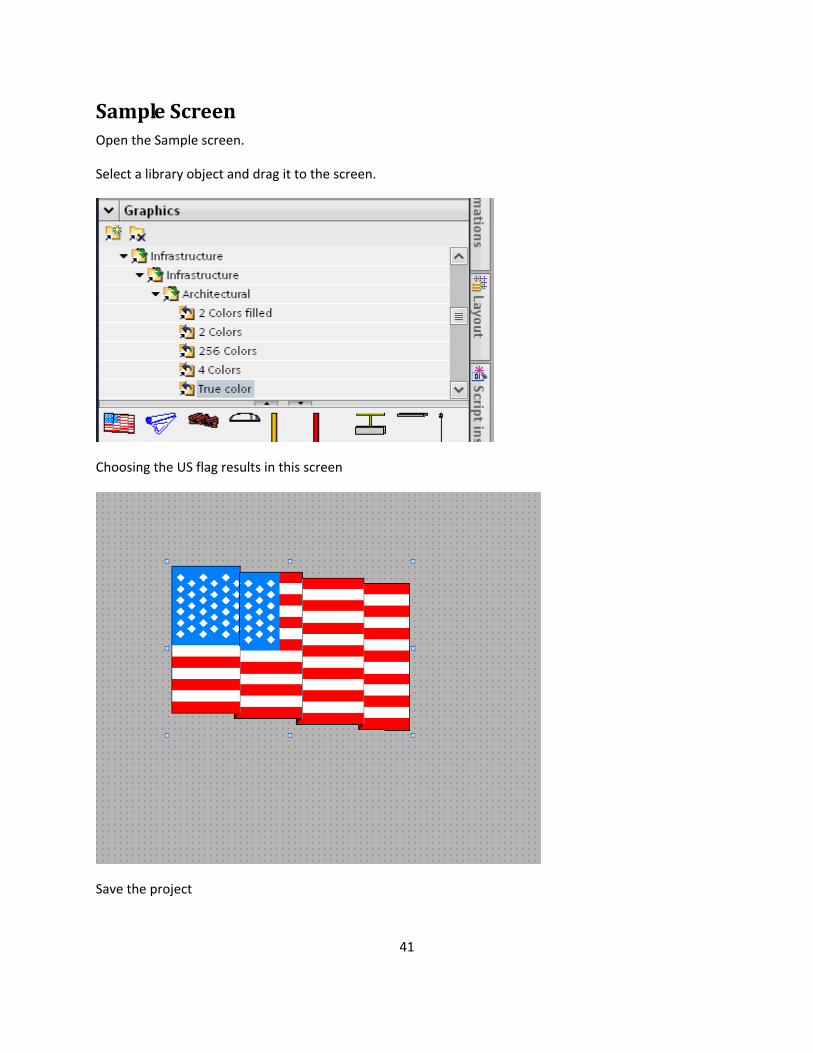
Sample Screen
41
Open the Sample screen.
Select a library object and drag it to the screen.
Choosing the US flag results in this screen
Save the project
42
ed Menus and Toolbars
switch from one screen to another in Runtime:
Assign buttons to screen changes Configuring screen changes with Menus and Toolbars
Use the "Menus and Toolbars" editor to configure customized menus and toolbars. The customized menus and toolbars are displayed in all screens of a project and in the screen windows. You connect the menu commands and icons with the local scripts.
A menu is placed at the top margin of each screen beginning on the left. In a configuration file you specify which menu and toolbars are created with this file in screens or screen windows. You can configure one menu line for each configuration file.
Menu structure
d on the position where the menu is located in the menu structure.
You create the following components for a menu:
Main menu command o Is displayed in the screen. o Opens a submenu.
Menu item
o Executes a defined procedure when clicked. o You can enter a parameter (for example a screen name) that is to be passed to the
procedure under "Properties > Events." o Opens a submenu, if it exists.
Submenu command o Is displayed in the screen when the higher-level menu item is open.
Separator lines between the menu entries
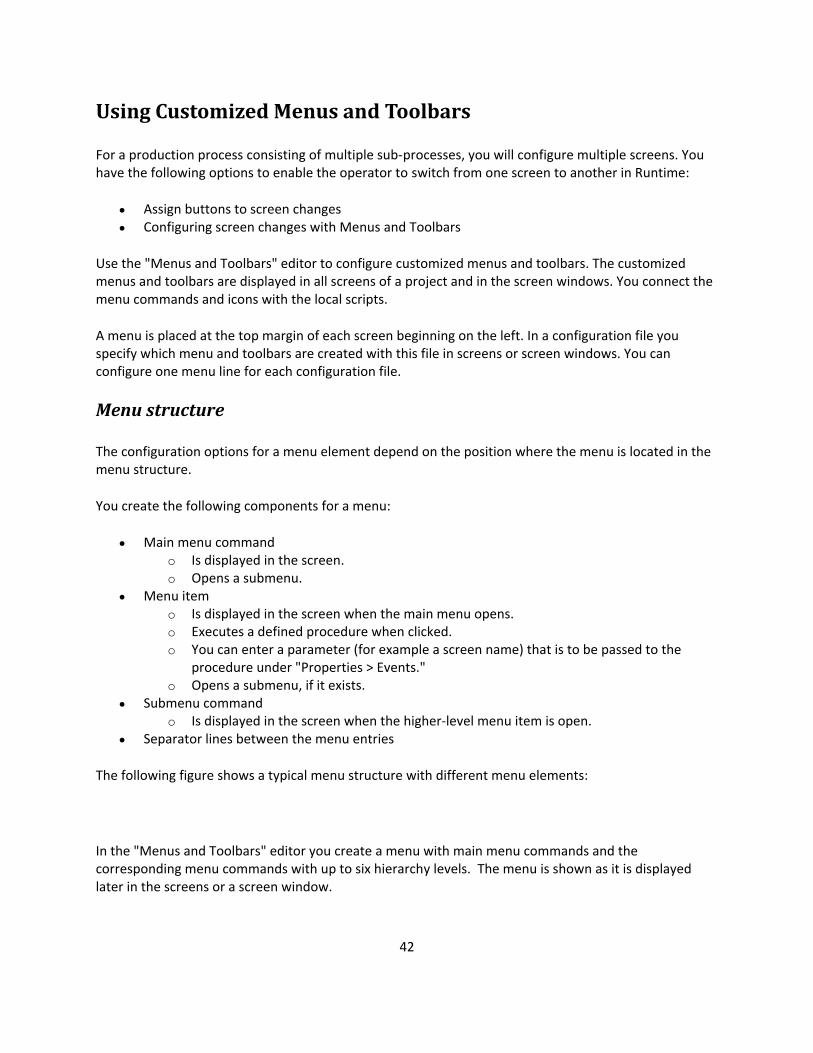
The following figure shows a typical menu structure with different menu elements:
In the "Menus and Toolbars" editor you create a menu with main menu commands and the corresponding menu commands with up to six hierarchy levels. The menu is shown as it is displayed later in the screens or a screen window.
Using Customiz
For a production process consisting of multiple sub-processes, you will configure multiple screens. You have the following options to enable the operator to
The configuration options for a menu element depen
o Is displayed in the screen when the main menu opens.
43
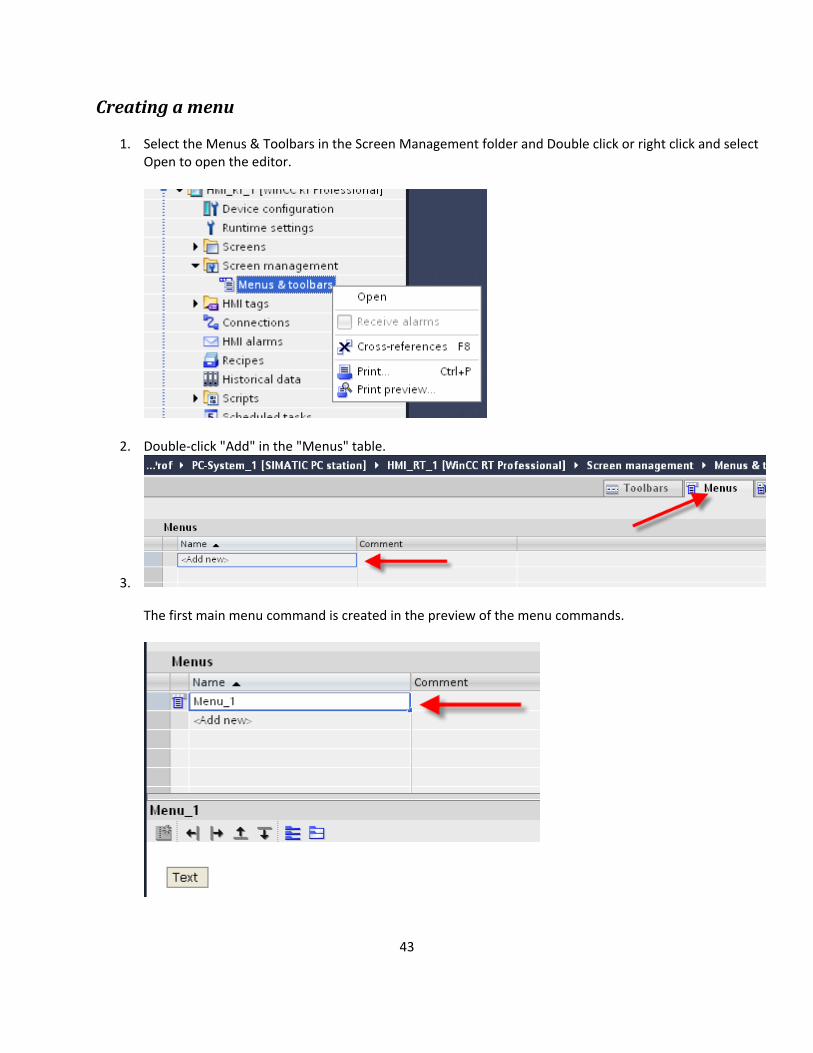
1. Select the Menus & Toolbars in the Screen Management folder and Double click or right click and select Open to open the editor.
Creating a menu
2. Double-click "Add" in the "Menus" table.
3.
The first main menu command is created in the preview of the menu commands.
44
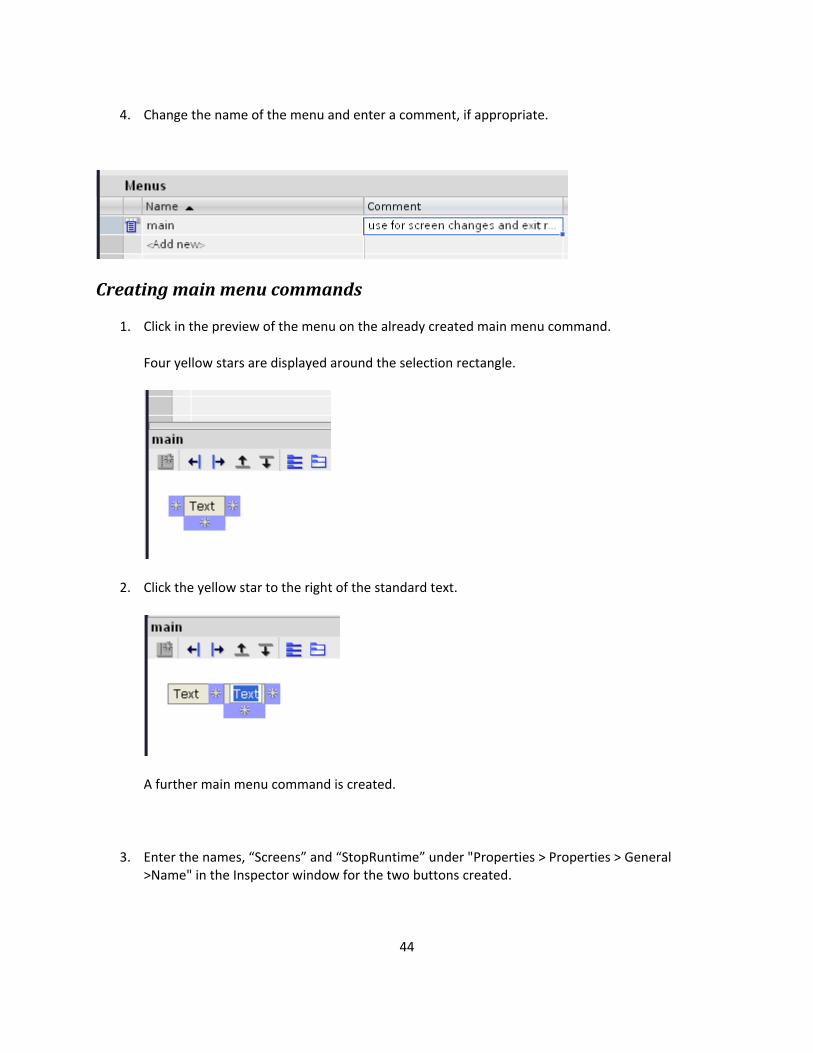
4. Change the name of the menu and enter a comment, if appropriate.
Creating main menu commands
1. Click in the preview of the menu on the already created main menu command.
Four yellow stars are displayed around the selection rectangle.
2. Click the yellow star to the right of the standard text.
A further main menu command is created.
3. Enter the names, “Screens” and “StopRuntime” under "Properties > Properties > General >Name" in the Inspector window for the two buttons created.
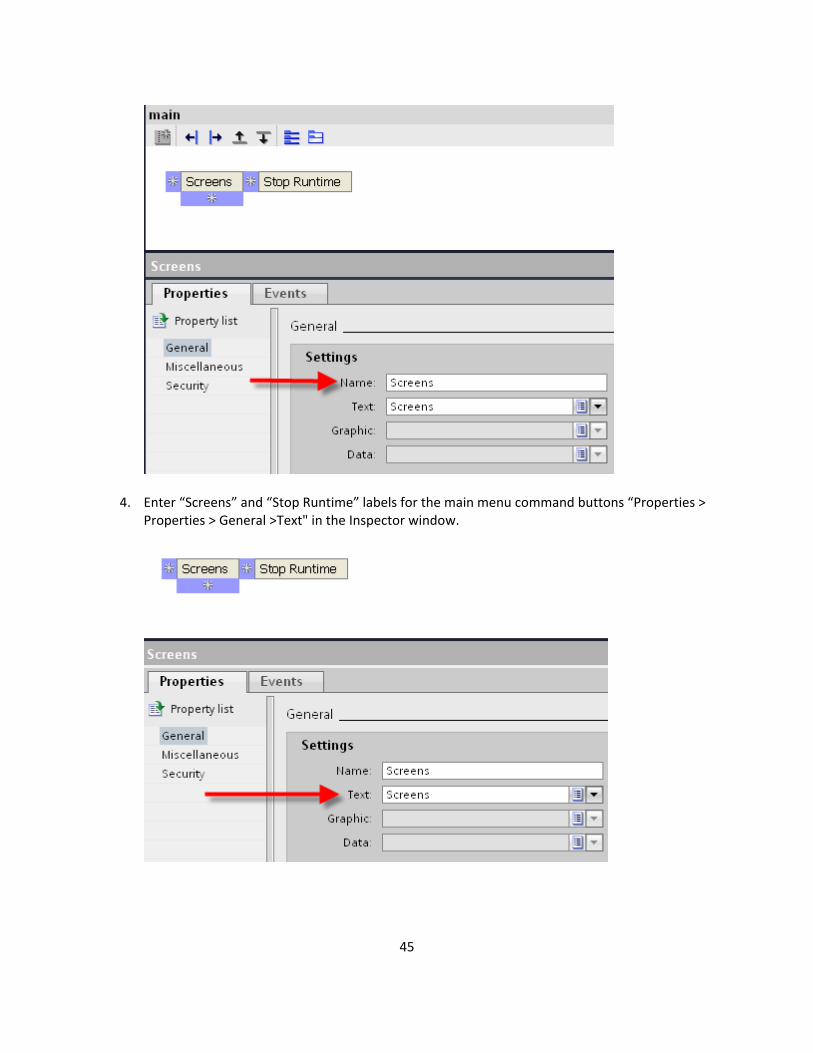
4. Enter “Screens” and “Stop Runtime” labels for the main menu command buttons “Properties >Properties
> General >Text" in the Inspector window.
45
46
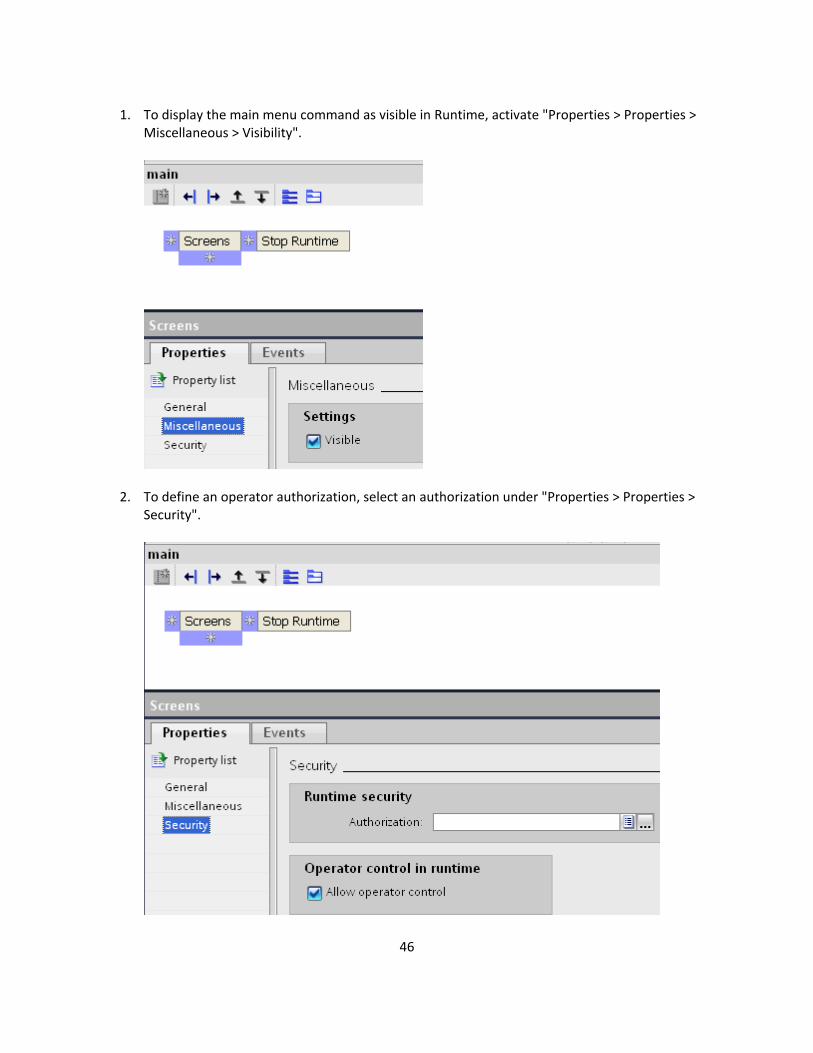
menu command as visible in Runtime, activate "Properties > Properties > Miscellaneous > Visibility".
1. To display the main
2. To define an operator authorization, select an authorization under "Properties > Properties > Security".
47
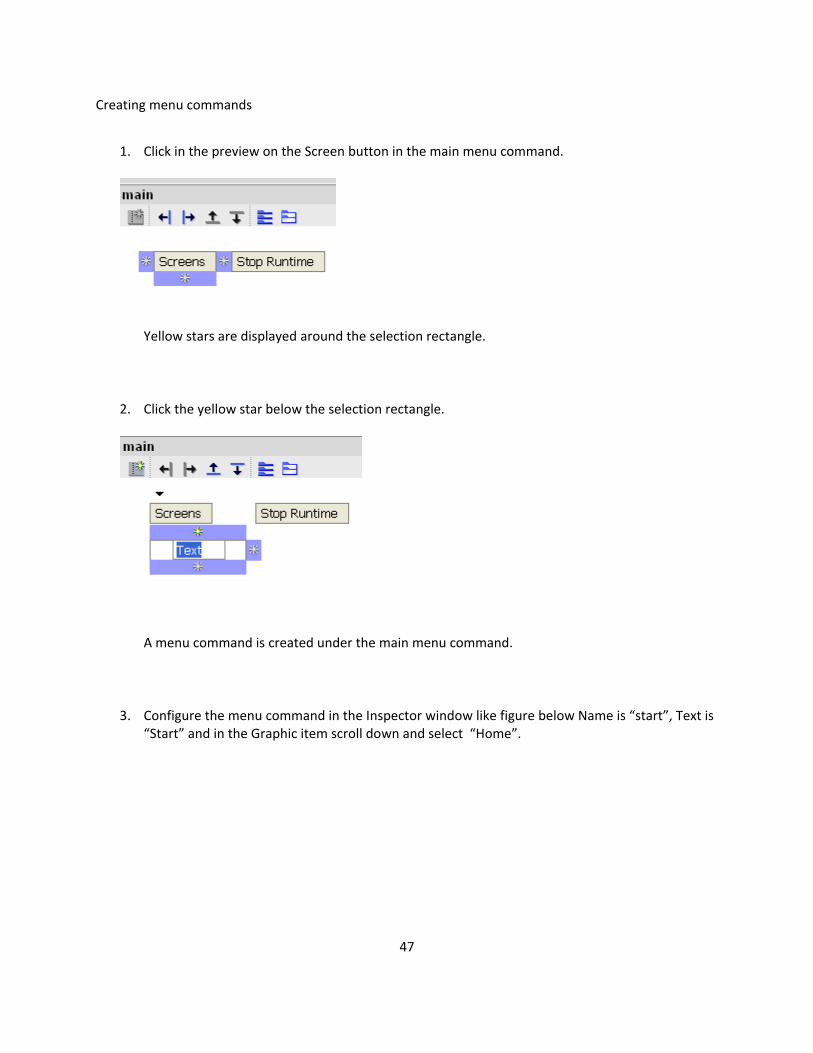
Creating menu commands
1. Click in the preview on the Screen button in the main menu command.
Yellow stars are displayed around the selection rectangle.
2. Click the yellow star below the selection rectangle.
A menu command is created under the main menu command.
3. Configure the menu command in the Inspector window like figure below Name is “start”, Text is “Start” and in the Graphic item scroll down and select “Home”.
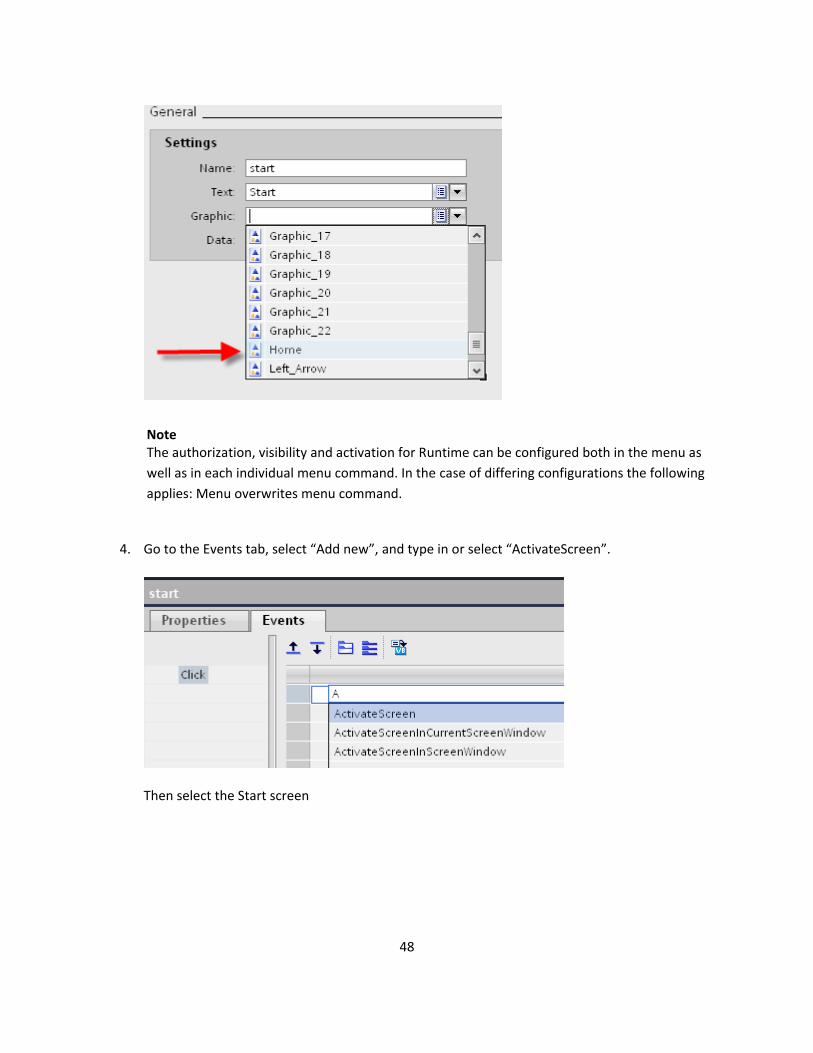
Note The authorization, visibility and activation for Runtime can be configured both in the menu as well as in each individual menu command. In the case of differing configurations the following applies: Menu overwrites menu command.
4. Go to the Events tab, select “Add new”, and type in or select “ActivateScreen”.
Then select the Start screen
48
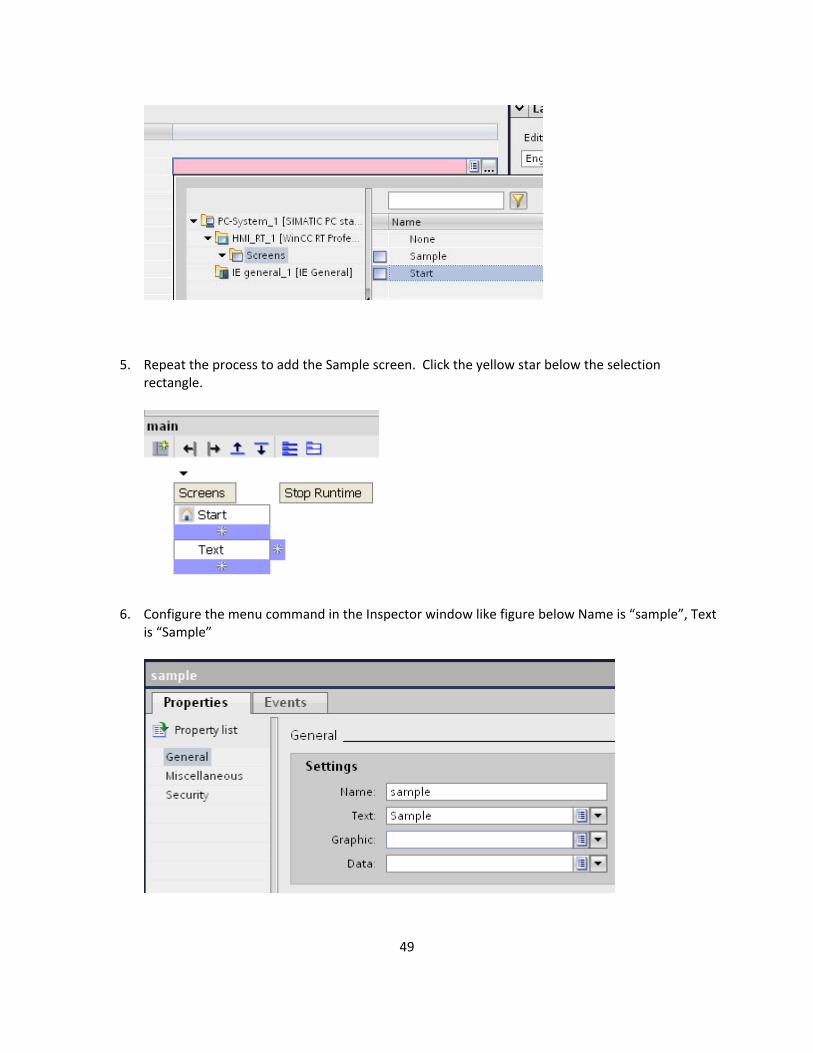
5. Repeat the process to add the Sample screen. Click the yellow star below the selection rectangle.
6. Configure the menu command in the Inspector window like figure below Name is “sample”, Text is “Sample”
49
50
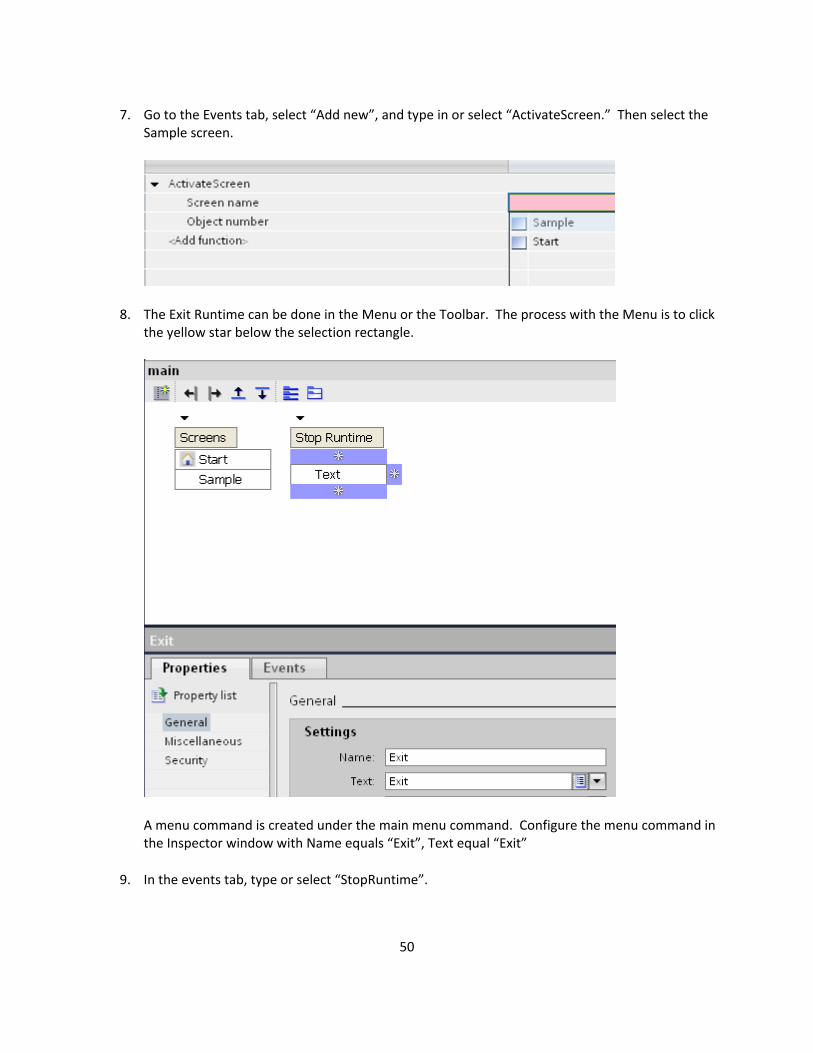
7. Go to the Events tab, select “Add new”, and type in or select “ActivateScreen.” Then select the Sample screen.
8. The the y
Exit Runtime can be done in the Menu or the Toolbar. The process with the Menu is to click ellow star below the selection rectangle.
A menu command is created under the main menu command. Configure the menu command in the Inspector window wi h Name equals “Exit”, Text equal “Exit”
In the events tab, type or select “StopRuntime”.
t
9.
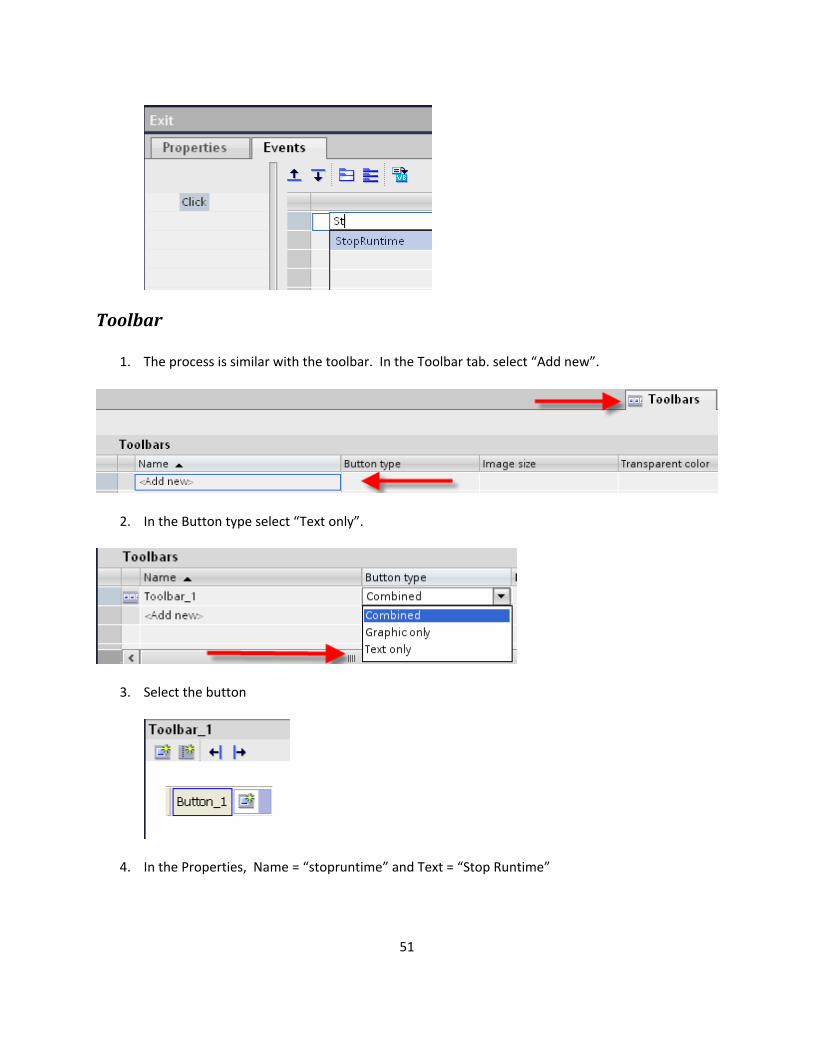
Toolbar
1. The process is similar with the toolbar. In the Toolbar tab. select “Add new”.
2. In the Button type select “Text only”.
3. Select the button
4. In the Properties, Name = “stopruntime” and Text = “Stop Runtime”
51
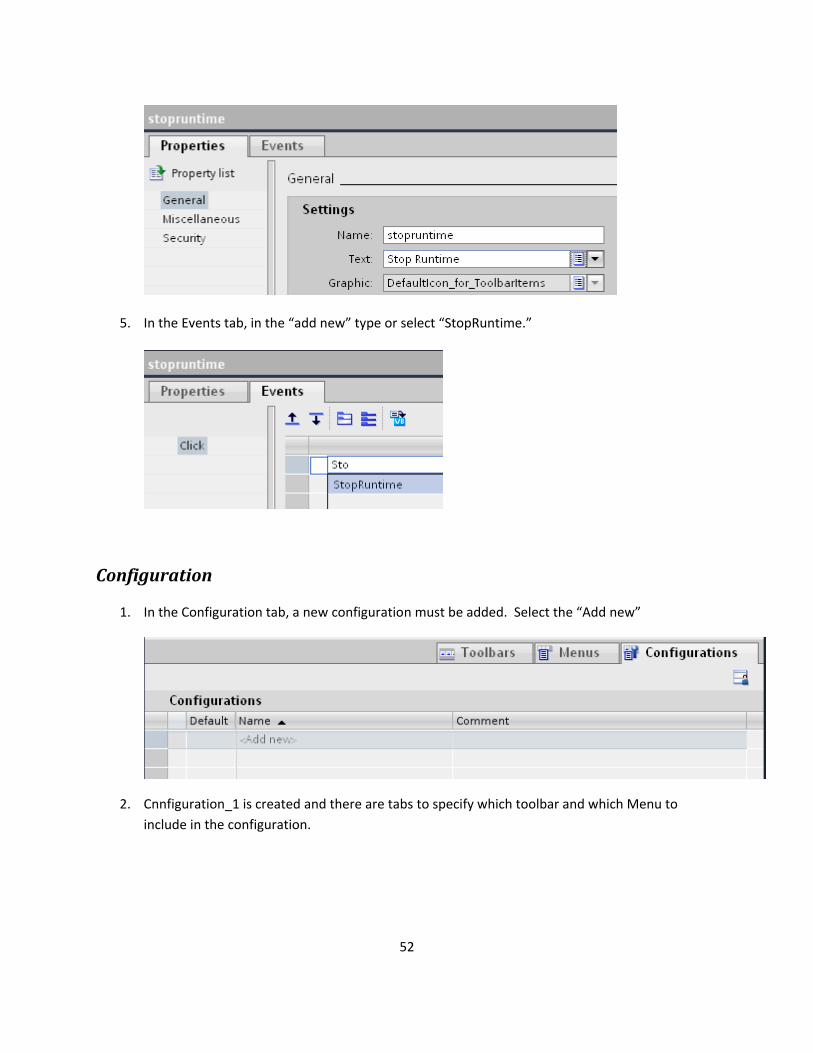
5. In the Events tab, in the “add new” type or select “StopRuntime.”
Configuration
1. In the Configuration tab, a new configuration must be added. Select the “Add new”
2. Cnnfiguration_1 is crinclude in the configu
eated and there are tabs to specify which toolbar and which Menu to ration.
52
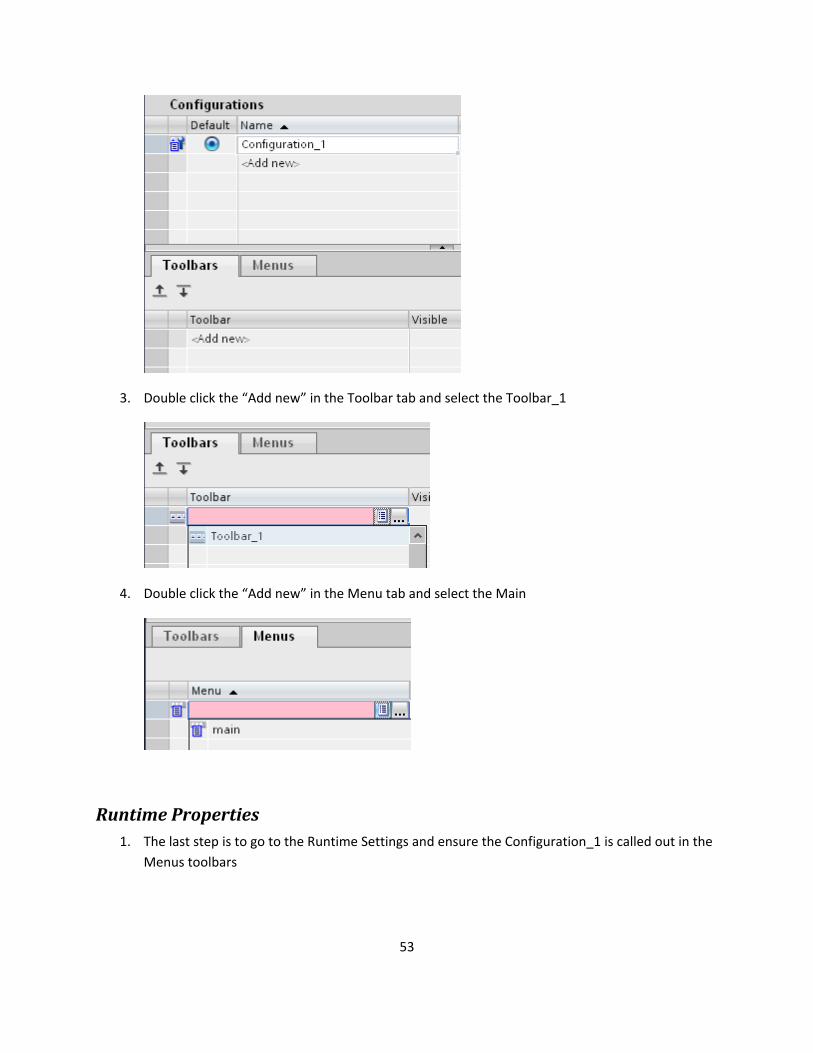
3. Double click the “Add new” in the Toolbar tab and select the Toolbar_1
4. Double click the “Add new” in the Menu tab and select the Main
Runtime Properties Runtime Settings and ensure the Configuration_1 is called out in the 1. The last step is to go to the
Menus toolbars
53
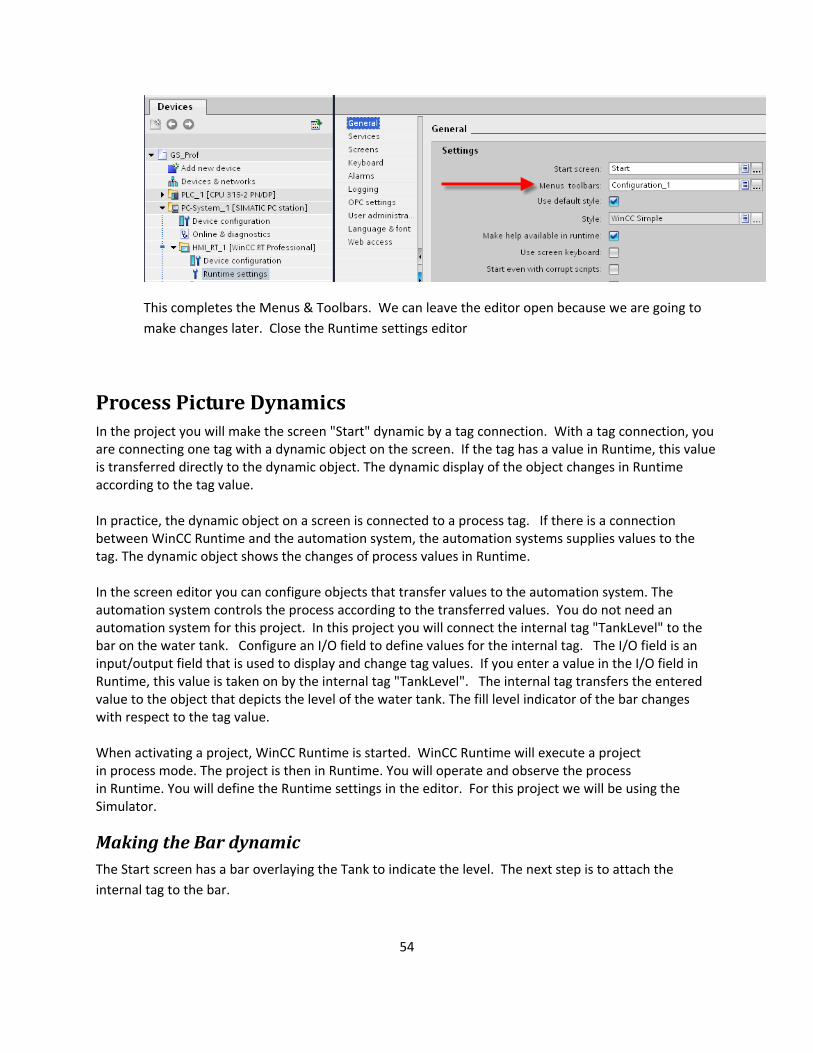
This completes the Menus & Toolbars. We can leave the editor open because we are going to make changes later. Close the Runtime settings editor
Process Picture Dynamics In the project you will make the screen "Start" dynamic by a tag connection. With a tag connection, you are connecting one tag with a dynamic object on the screen. If the tag has a value in Runtime, this value is transferred directly to the dynamic object. The dynamic display of the object changes in Runtime according to the tag value.
between WinCC Runtime and the automation system, the automation systems supplies values to the tag. The dynamic object shows the changes of process values in Runtime. In the screen editor you can configure objects that transfer values to the automation system. The automation system controls the process according to the transferred values. You do not need an automation system for this project. In this project you will connect the internal tag "TankLevel" to the bar on the water tank. Configure an I/O field to define values for the internal tag. The I/O field is an input/output field that is used to display and change tag values. If you enter a value in the I/O field in Runtime, this value is taken on by the internal tag "TankLevel". The internal tag transfers the entered value to the object that depicts the level of the water tank. The fill level indicator of the bar changes with respect to the tag value. When activating a project, WinCC Runtime is started. WinCC Runtime will execute a project in process mode. The project is then in Runtime. You will operate and observe the process in Runtime. You will define the Runtime settings in the editor. For this project we will be using the Simulator.
overlaying the Tank to indicate the level. The next step is to attach the internal tag to the bar.
In practice, the dynamic object on a screen is connected to a process tag. If there is a connection
Making the Bar dynamic The Start screen has a bar
54
55
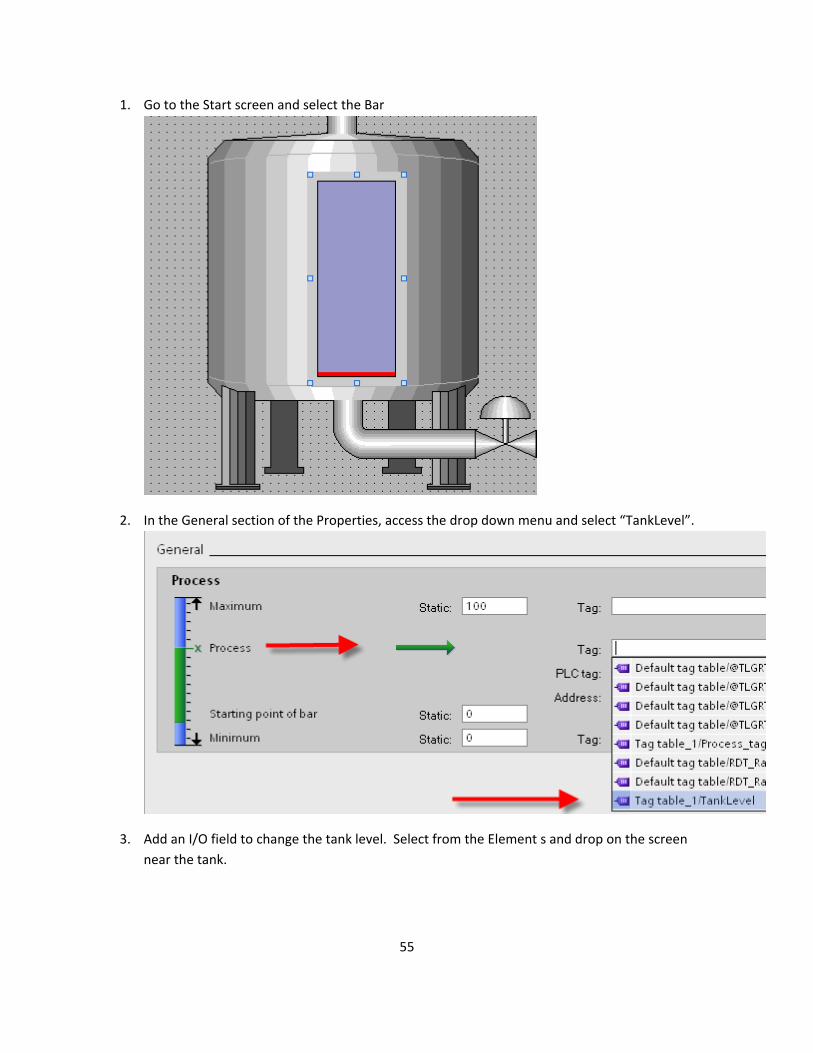
1. Go to the Start screen and select the Bar
2. In the General section of the Properties, access the drop down menu and select “TankLevel”.
3. Add an I/O field to change the tank level. Select from the Element s and drop on the screen near the tank.
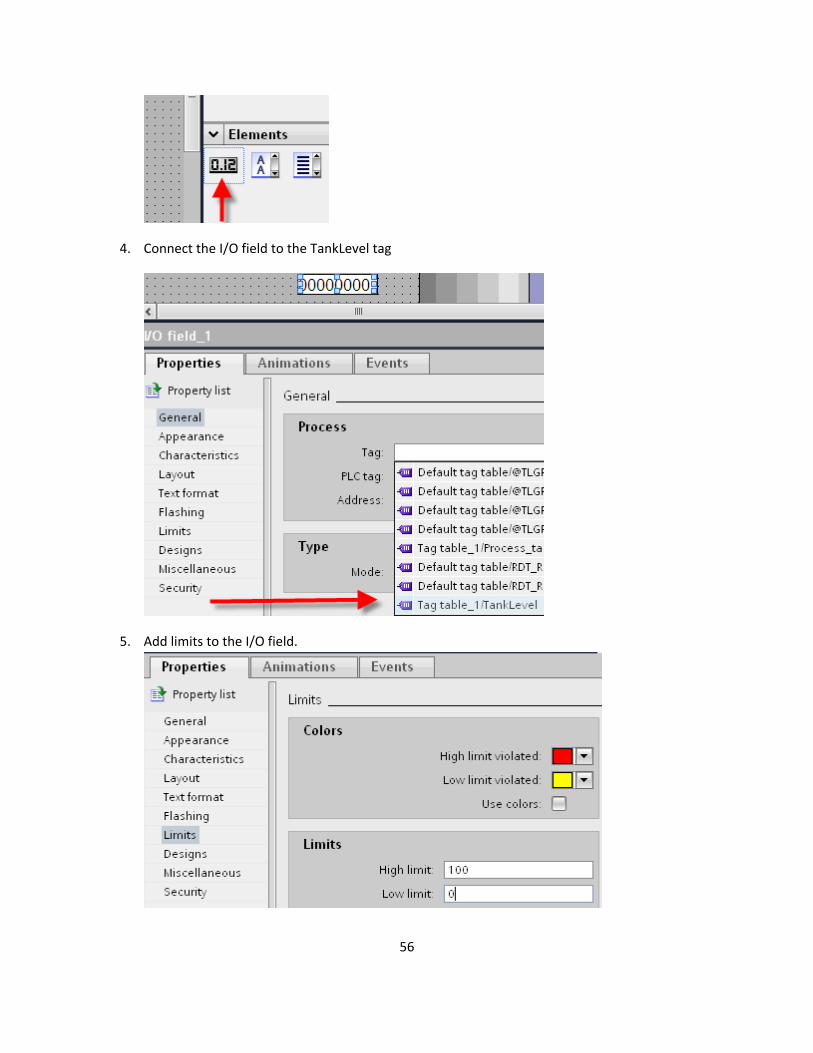
4. Connect the I/O field to the TankLevel tag
5. Add limits to the I/O field.
56
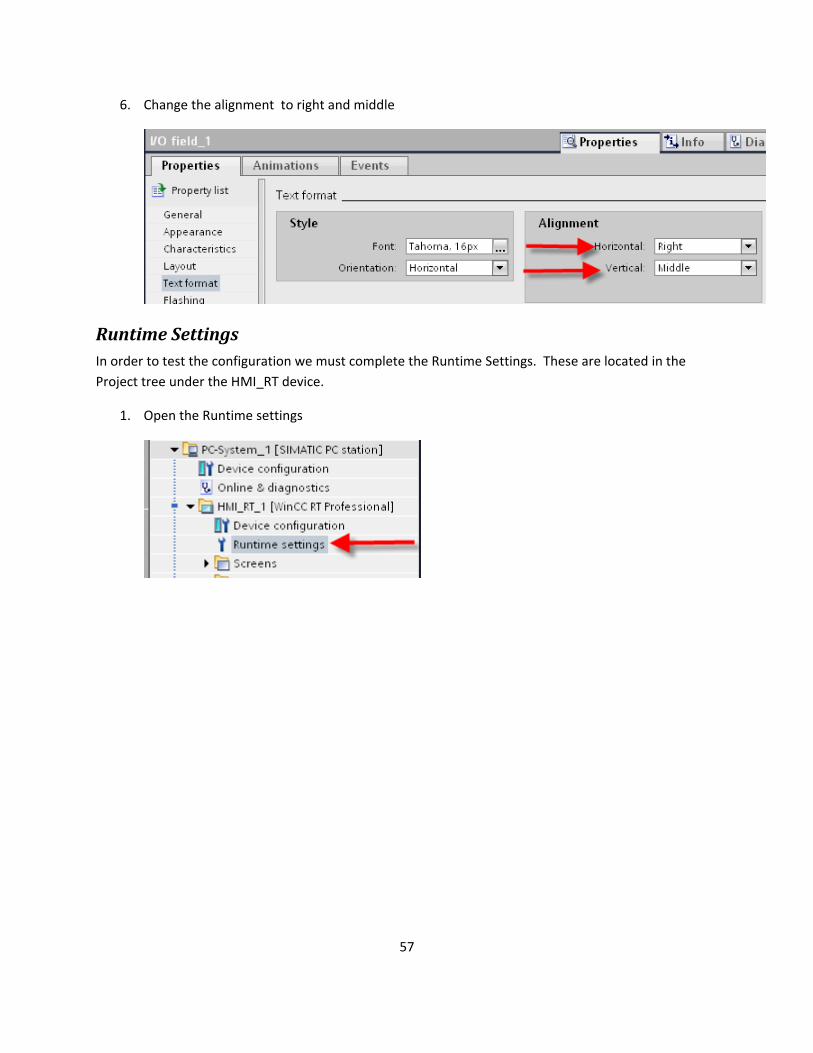
6. Change the alignment to right and middle
Runtime Settings In order to test the configuration we must complete the Runtime Settings. These are located in the Project tree under the HMI_RT device.
1. Open the Runtime settings
57
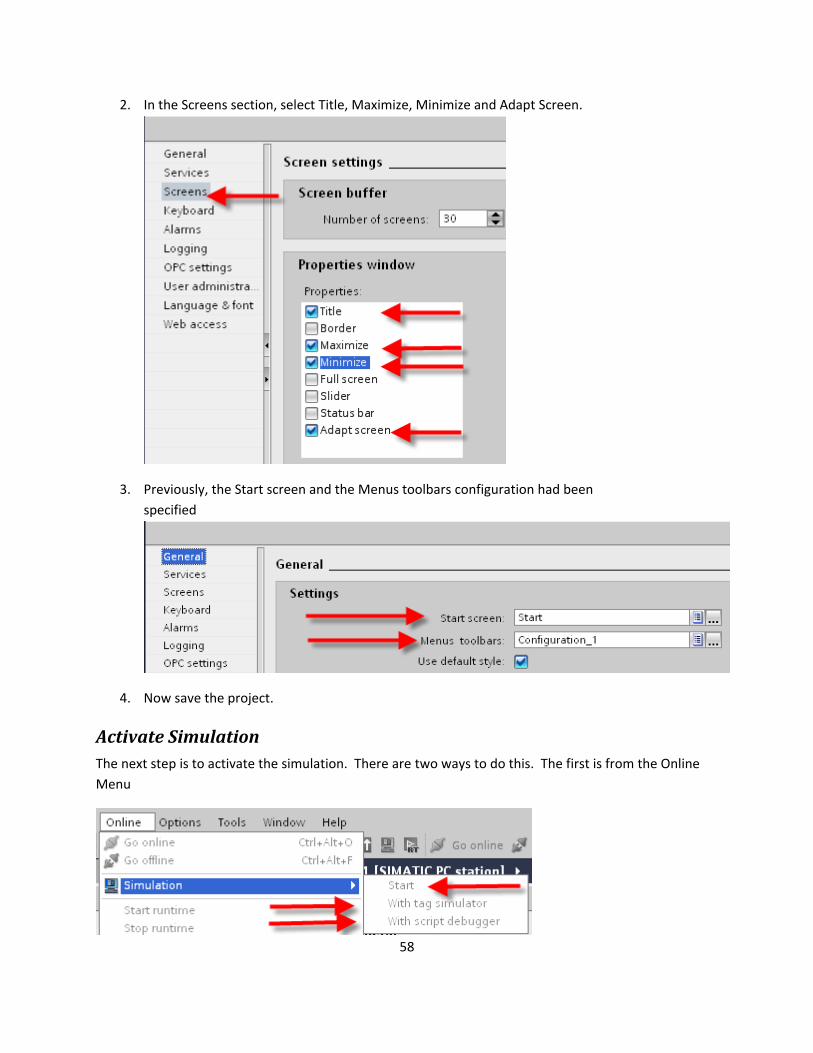
2. In the Screens section, select Title, Maximize, Minimize and Adapt Screen.
3. Previously, the Start screen an configuration had been specified
d the Menus toolbars
4. Now save the project.
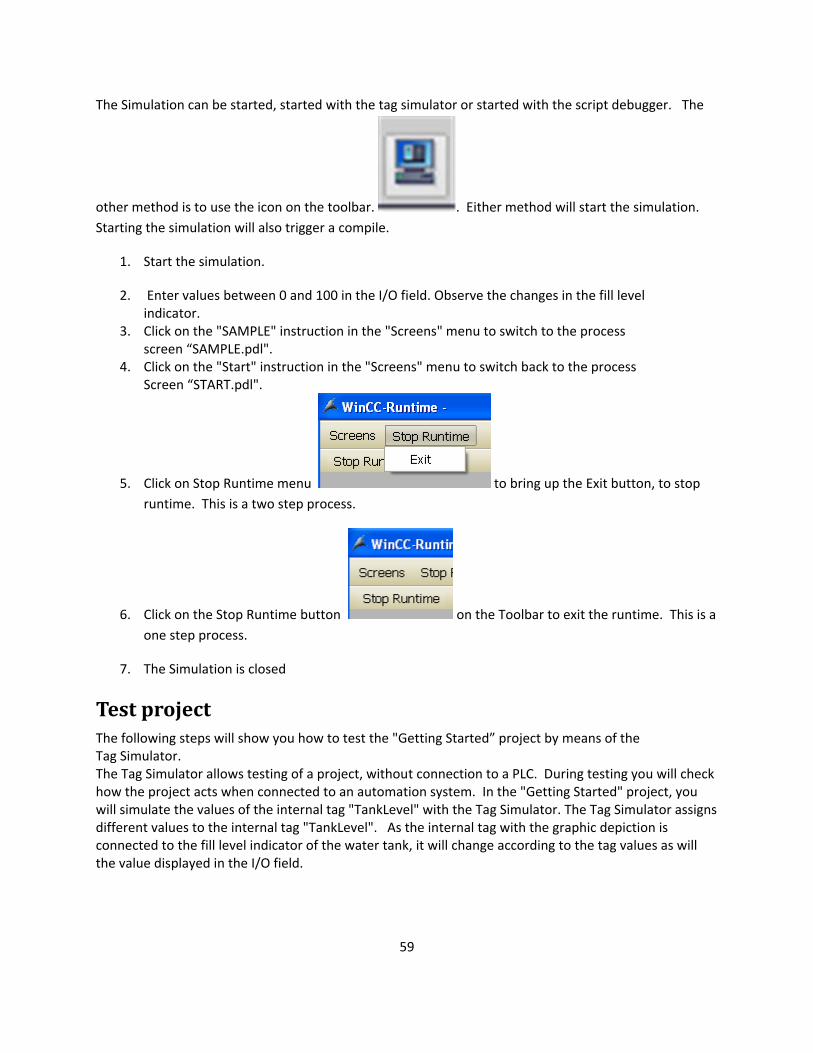
Activate Simulation The next step is to activate the simulation. There are two ways to do this. The first is from the Online Menu
58
59
other method is to use the icon on the toolbar.
The Simulation can be started, started with the tag simulator or started with the script debugger. The
. Either method will start the simulation. Starting the simulation will also trigger a compile.
1. Start the simulation.
2. Enter values between 0 and 100 in the I/O field. Observe the changes in the fill level indicator.
3. Click on the "SAMPLE" instruction in the "Screens" menu to switch to the process screen “SAMPLE.pdl".
4. Click on the "Start" instruction in the "Screens" menu to switch back to the process Screen “START.pdl".
5. Click on Stop Runtime menu to bring up the Exit button, to stop runtime. This is a two step process.
6. Click on the Stop Runtime button on r to exit the runtime. This is a one step process.
7. The Simulation is closed
Test project The following steps will show you how to test the "Getting Started” project by means of the Tag Simulator. The Tag Simulator allows testing of a project, without connection to a PLC. During testing you will check how the project acts when connected to an automation system. In the "Getting Started" project, you will simulate the values of the internal tag "TankLevel" with the Tag Simulator. The Tag Simulator assigns different values to the internal tag "TankLevel". As the internal tag with the graphic depiction is connected to the fill level indicator of the water tank, it will change according to the tag values as will the value displayed in the I/O field.
the Toolba
60
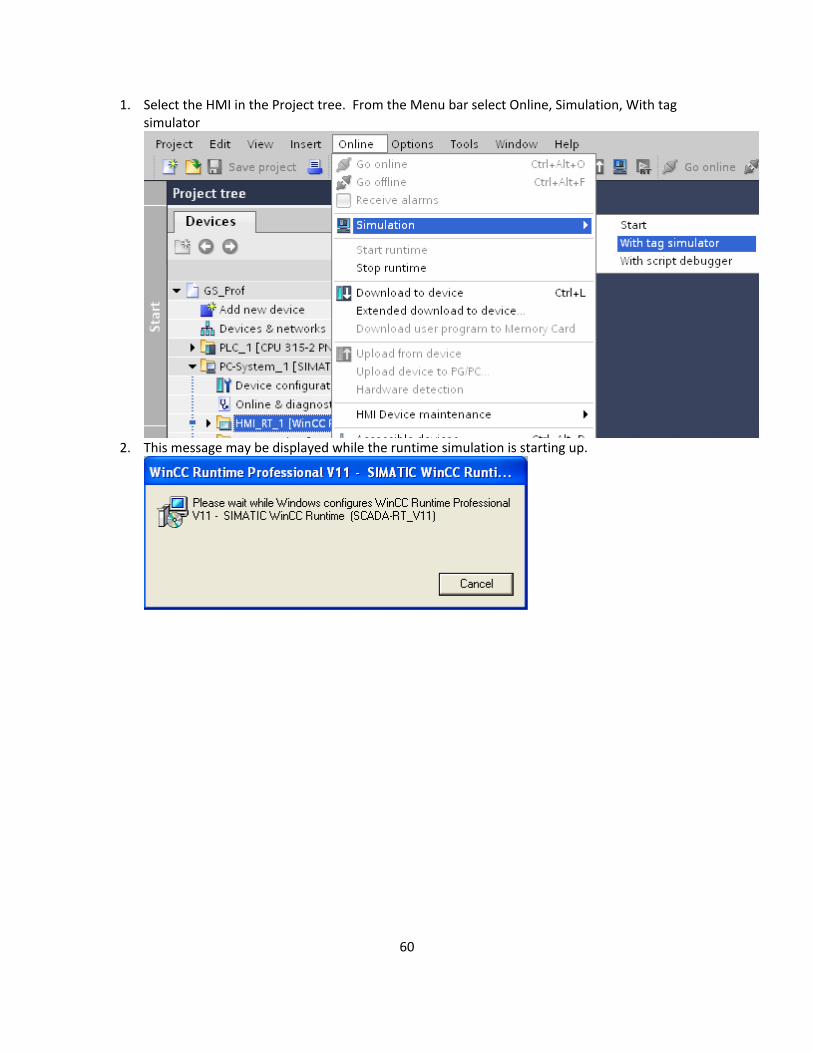
nu bar select Online, Simulation, With tag simulator
1. Select the HMI in the Project tree. From the Me
2. This message may be displayed while the runtime simulation is starting up.
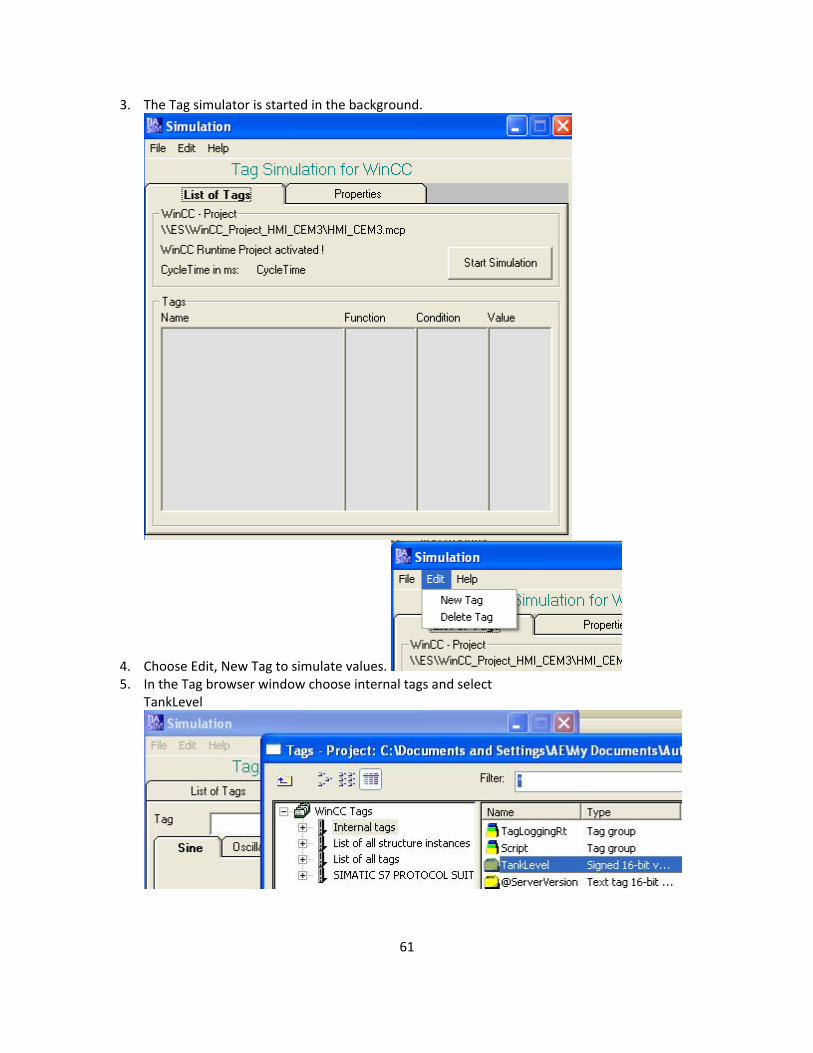
3. The Tag simulator is started in the background.
4. Choose Edit, New Tag to simulate values. 5. In the Tag browser window choose internal tags and select
TankLevel
61
62
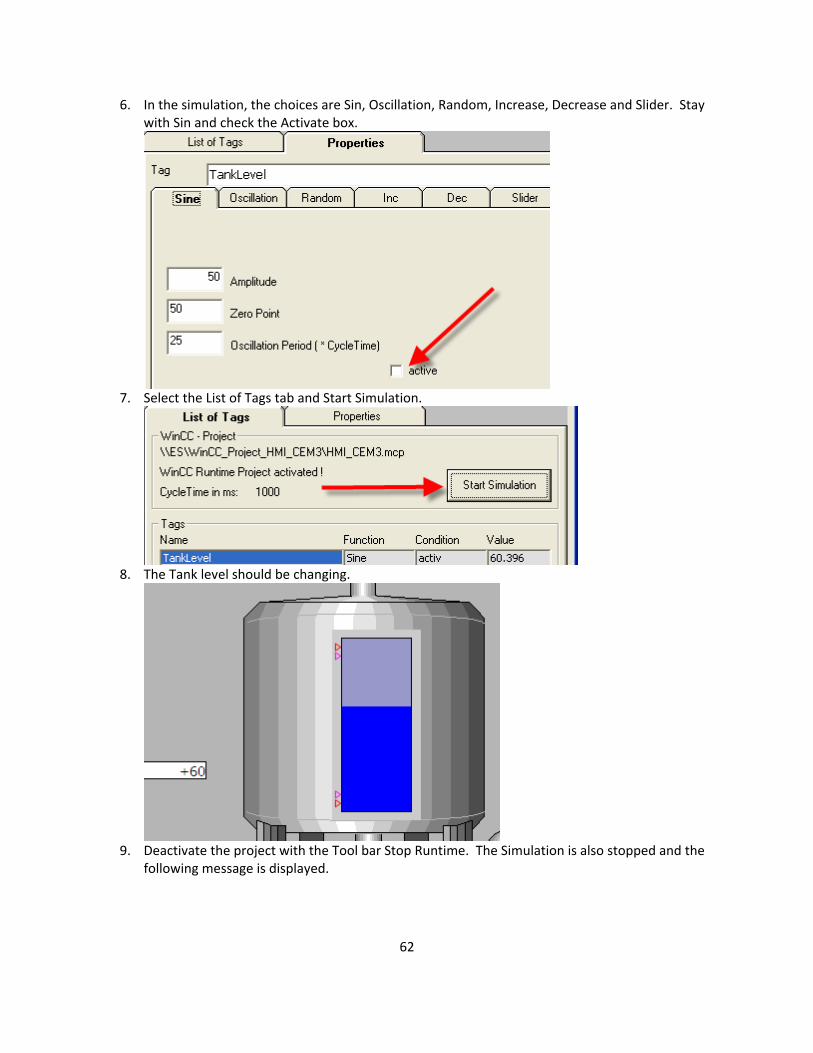
6. In the simulation, the choices are Sin, Oscillation, Random, Increase, Decrease and Slider. Stay with Sin and check the Activate box.
7. Select the List of Tags tab and Start Simulation.
8. The Tank level should be changing.
9. Deactivate the project with the Tool bar Stop Runtime. The Simulation is also stopped and the
following message is displayed.
10. Select OK
Archiving and displaying values
nt as they allow problems to be recognized very early to individual historic process values is another use of the process value archives.
This application can, for example, help to determine how high certain values were at a time when production problems were experienced. You do not need process values for the "Getting Started" project. Select the internal tag "TankLevel" in this project. You will simulate the values of these tags by means of the TAG Simulator. The simulated tag values are saved in a process value archive. The sequence of the saved values will be entered into a process screen as a trend diagram and as a table. For this you will use the controls in the object palette of the "Graphics Designer" editor. Observe the changes in the simulation values in the configured controls in Runtime.
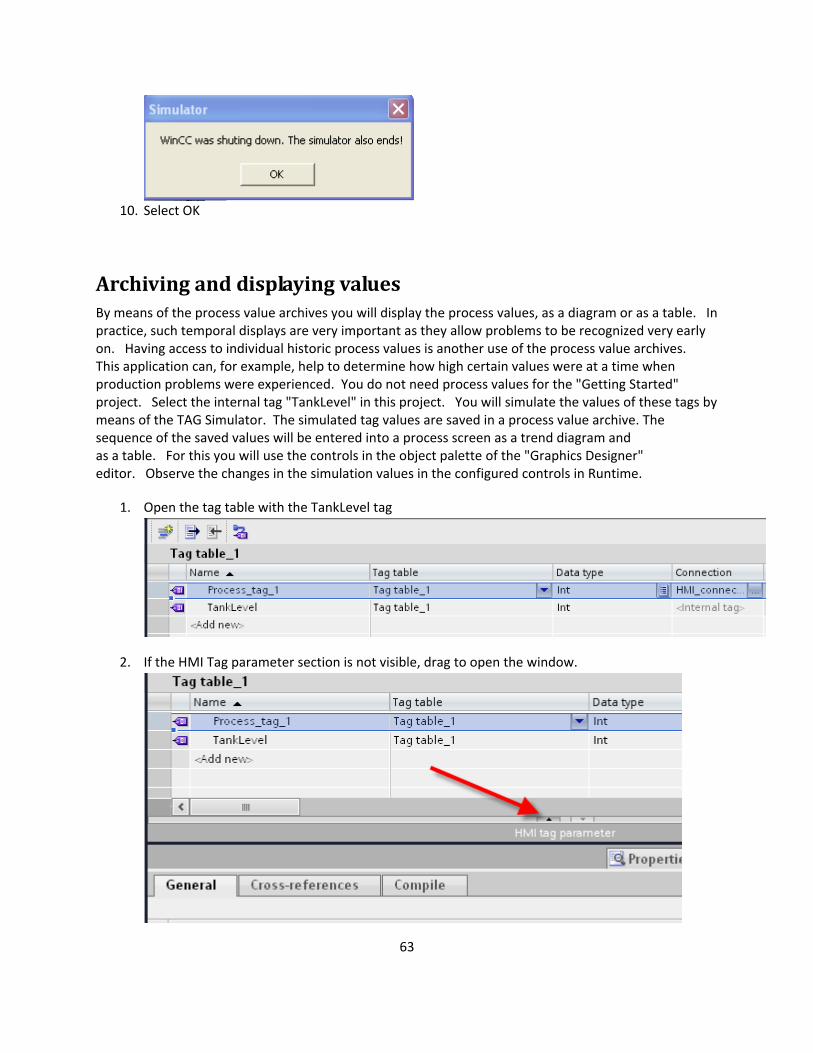
1. Open the tag table with the TankLevel tag
By means of the process value archives you will display the process values, as a diagram or as a table. In practice, such temporal displays are very importaon. Having access
2. If the HMI Tag parameter section is not visible, drag to open the window.
63
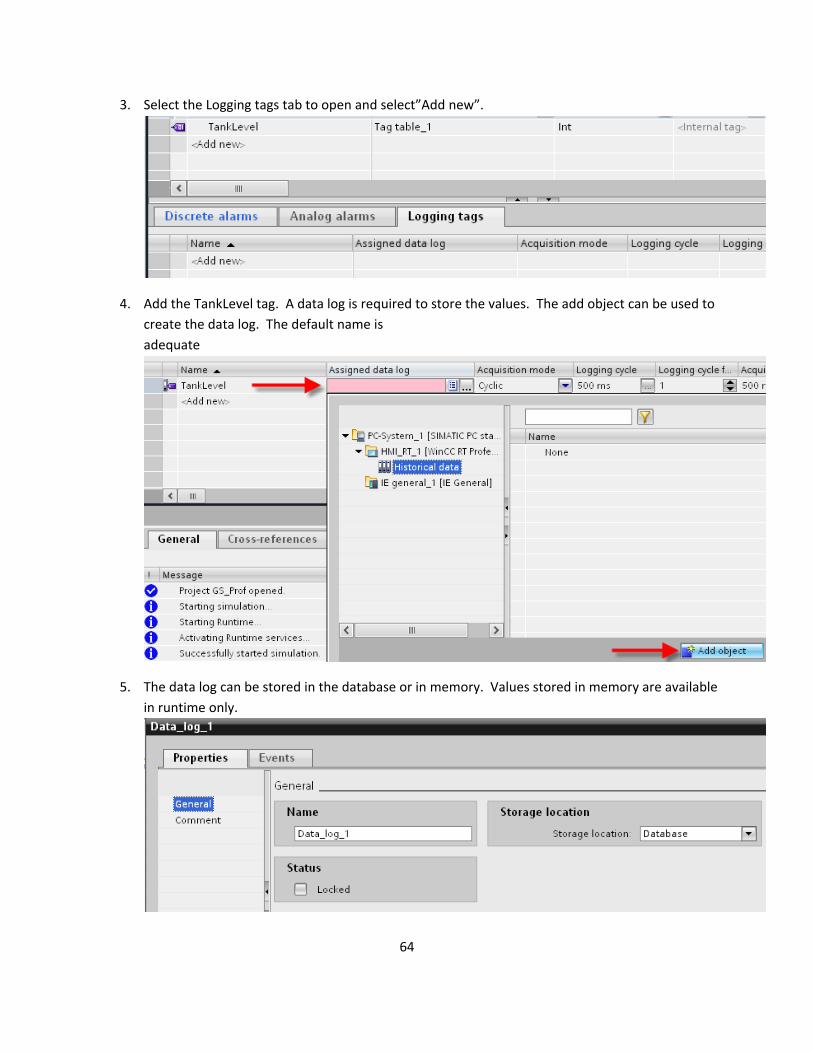
3. Select the Logging tags tab to open and select”Add new”.
4. e TankLevel tag. A data log is required to store the values. The add object can be used to create the data log. The default name is adequate
Add th
5. e The data log can be stored in the database or in memory. Values stored in memory are availablin runtime only.
64
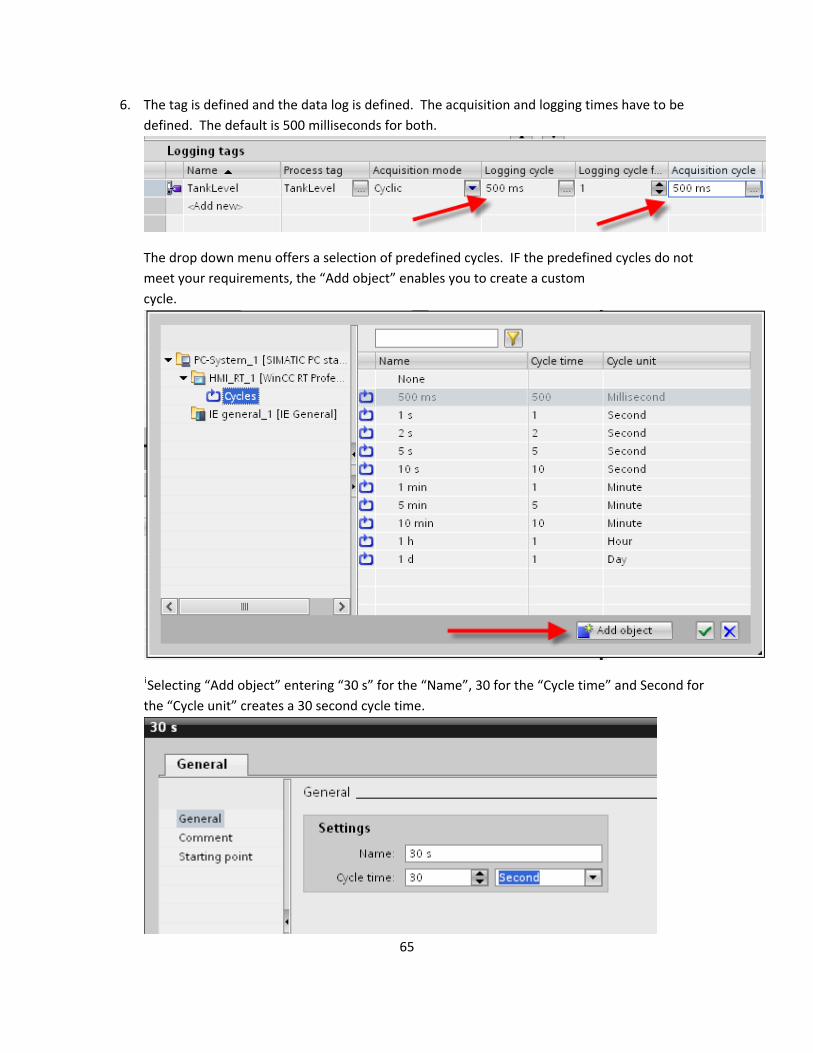
6. The tag is defined and the data log is defined. The acquisition and logging times have to be defined. The default is 500 milliseconds for both.
The drop down menu offers a selection of predefined cycles. IF the predefined cycles do not meet your requirements, the “Add object” enables you to create a custom cycle.
iSelecting “Add object” entering “30 s” for the “Name”, 30 for the “Cycle time” and Second for the “Cycle unit” creates a 30 second cycle time.
65
66
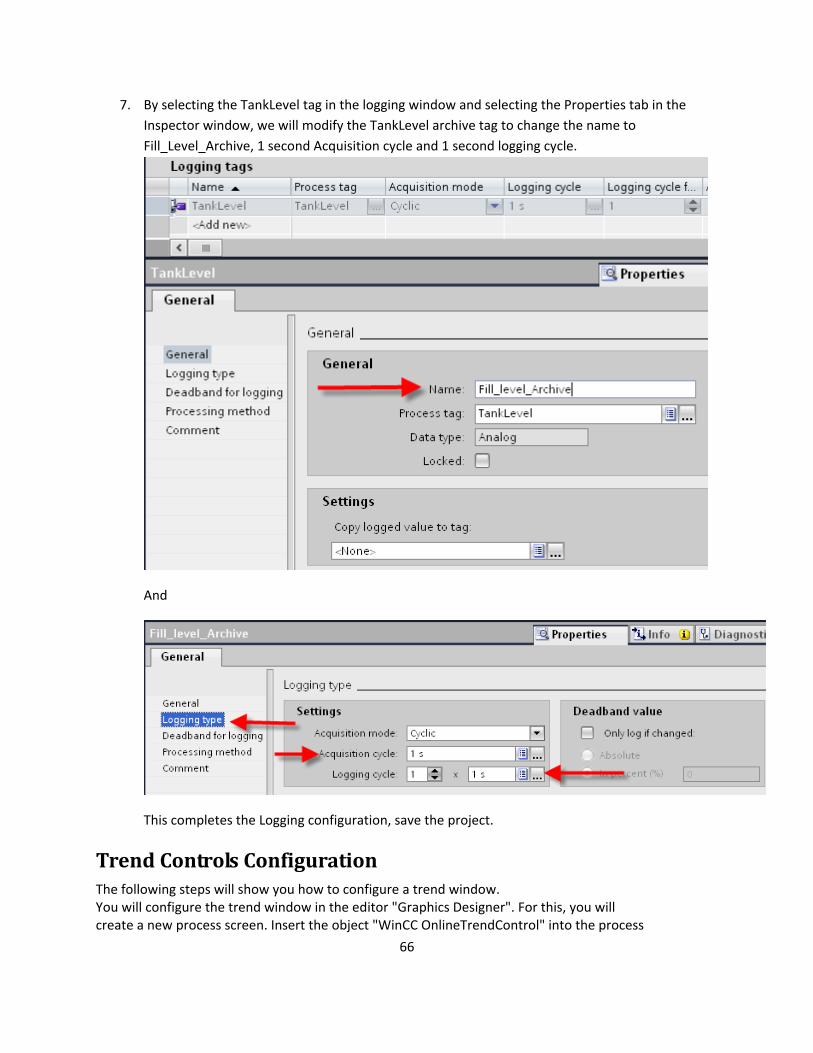
ting the Properties tab in the
Fill_Level_Archive, 1 second Acquisition cycle and 1 second logging cycle.
7. By selecting the TankLevel tag in the logging window and selecInspector window, we will modify the TankLevel archive tag to change the name to
And
This completes the Logging configuration, save the project.
Trend Controls Configuration The following steps will show you how to configure a trend window. You will configure the trend window in the editor "Graphics Designer". For this, you will create a new process screen. Insert the object "WinCC OnlineTrendControl" into the process
67
screen. In the project you will connect this object with the archive tag "Fill_Level_Archive". Hence, the values saved in the archive tag in Runtime are output as a trend.
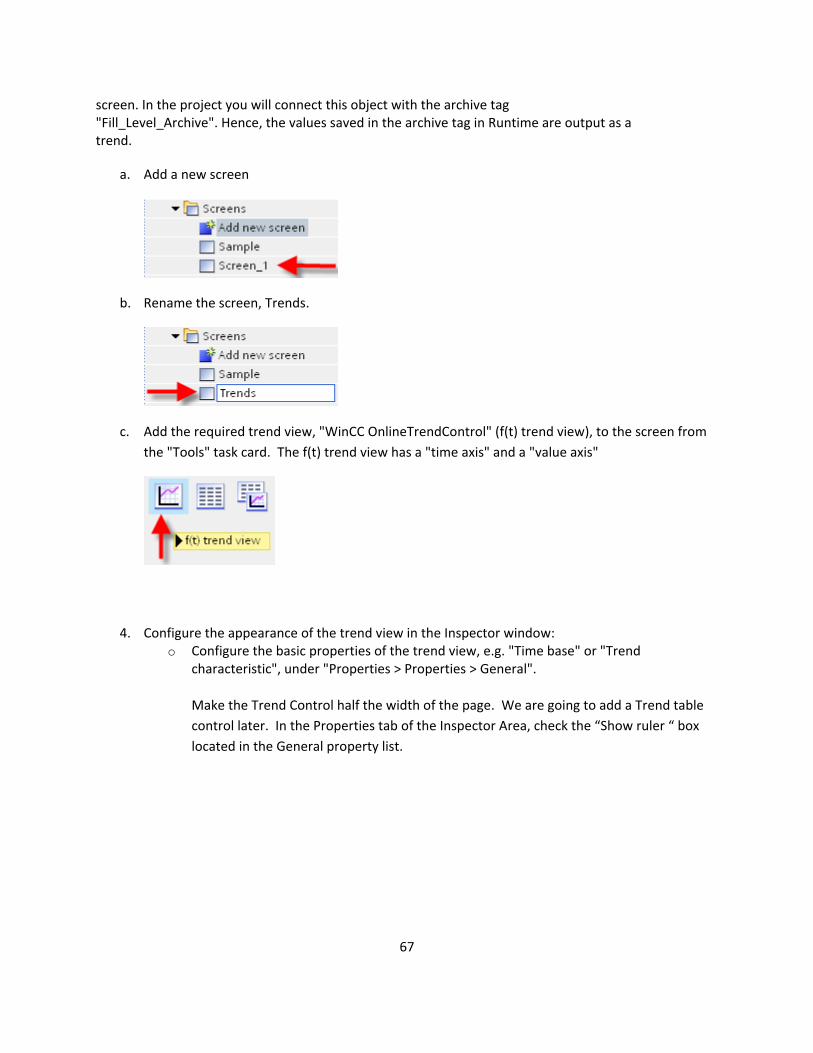
a. Add a new screen
b. Rename the screen, Trends.
c. Add the required trend view, "WinCC OnlineTrendControl" (f(t) trend view), to the screen from the "Tools" task card. The f(t) trend view has a "time axis" and a "value axis"
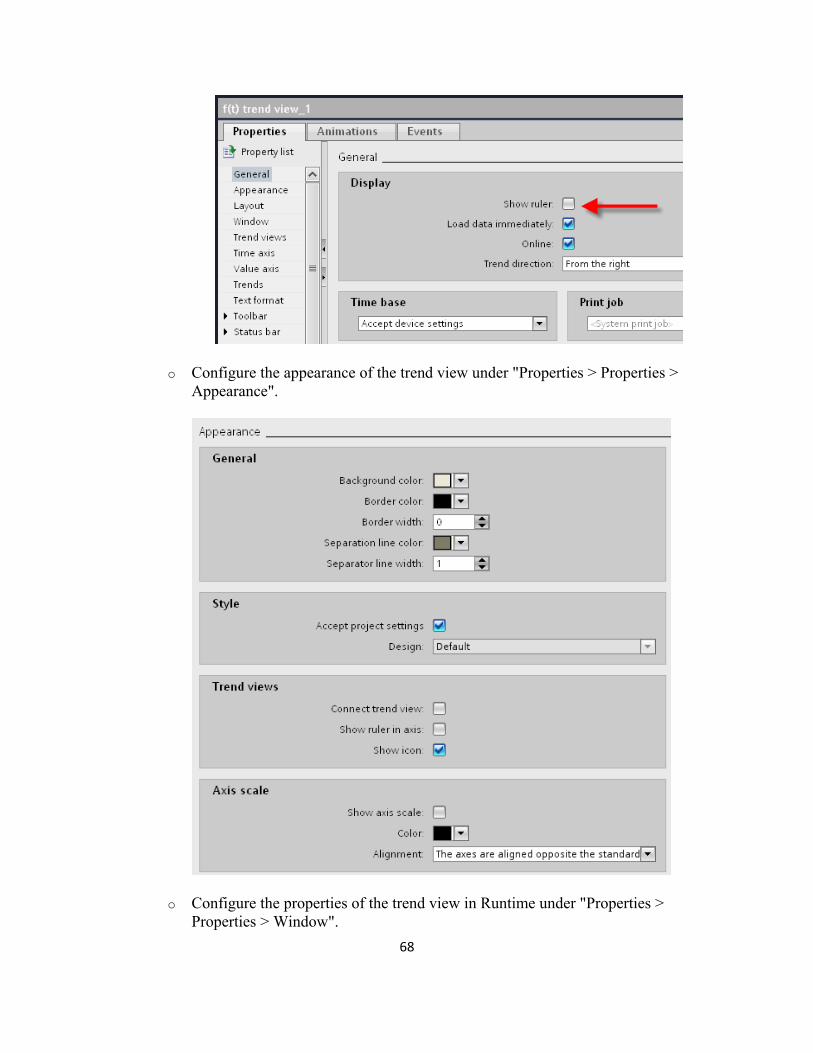
4. Configure the appearance of the trend view in the Inspector window: o Configure the basic properties of the trend view, e.g. "Time base" or "Trend
characteristic", under "Properties > Properties > General".
Make the Trend Control half the width of the page. We are going to add a Trend table control later. In the Properties tab of the Inspector Area, check the “Show ruler “ box located in the General property list.
oA
Configure the appearance of the trend view under "Properties > Properties > ppearance".
o Configure the properties of the trend view in Runtime under "Properties > Properties > Window".
68
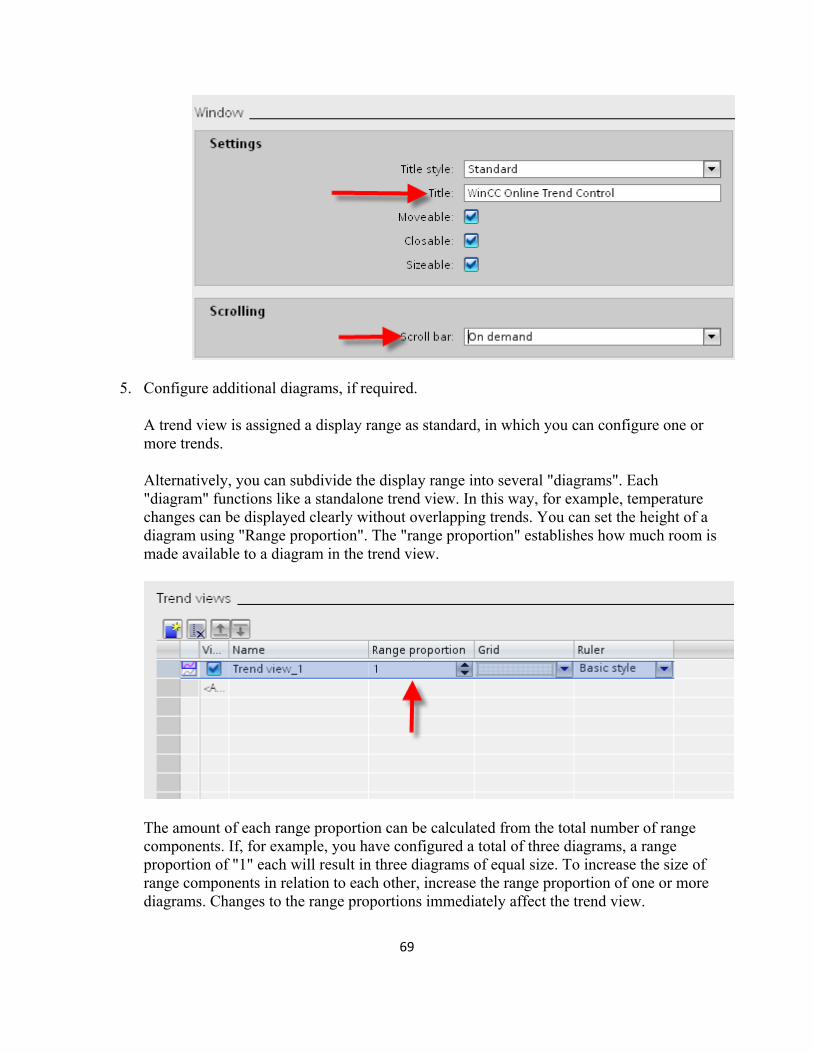
5. Configure additional diagrams, if required.
A trend view is assigned a display range as standard, in which you can configure one or more trends.
Alternatively, you can subdivide the display range into several "diagrams". Each "diagramch diagram roportion" establishes how much room is made available
" functions like a standalone trend view. In this way, for example, temperature anges can be displayed clearly without overlapping trends. You can set the height of a
using "Range proportion". The "range p to a diagram in the trend view.
The amount of each rangcomponents. Ifproportion of " n three diagrams of equal size. To increase the size of range components in relation to each other, increase the range proportion of one or more
ew.
e proportion can be calculated from the total number of range , for example, you have configured a total of three diagrams, a range 1" each will result i
diagrams. Changes to the range proportions immediately affect the trend vi
69
70
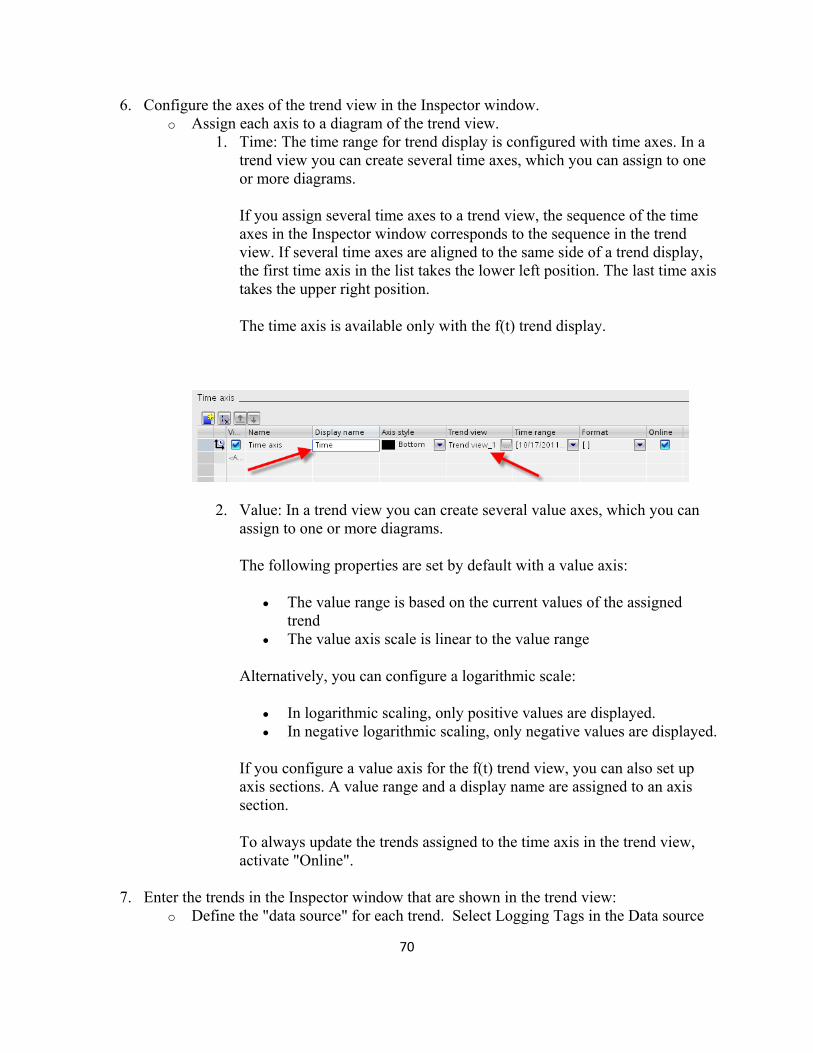
6. Configure the axes of the trend view in the Inspector window. o Assign each axis to a diagram of the trend view.
1. Time: The time range for trend display is configured with time axes. In a trend view you can create several time axes, which you can assign to one
If you assign several time axes to a trend view, the sequence of the time axes in the Inspector window corresponds to the sequence in the trend view. If several time axes are aligned to the same side of a trend display, the first time axis in the list takes the lower left position. The last time axis takes the upper right position.
The time axis is available only with the f(t) trend display.
or more diagrams.
2. Value: In a trend view you can create several value axes, which you can
trend he value range
In logarithmic scaling, only positive values are displayed. In negative logarithmic scaling, only negative values are displayed.
If you configure a value axis for the f(t) trend view, you can also set up axis sections. A value range and a display name are assigned to an axis section.
To always update the trends assigned to the time axis in the trend view, activate "Online".
7. Enter the trends in the Inspector window that are shown in the trend view: o Define the "data source" for each trend. Select Logging Tags in the Data source
assign to one or more diagrams.
The following properties are set by default with a value axis:
The value range is based on the current values of the assigned
The value axis scale is linear to t
Alternatively, you can configure a logarithmic scale:
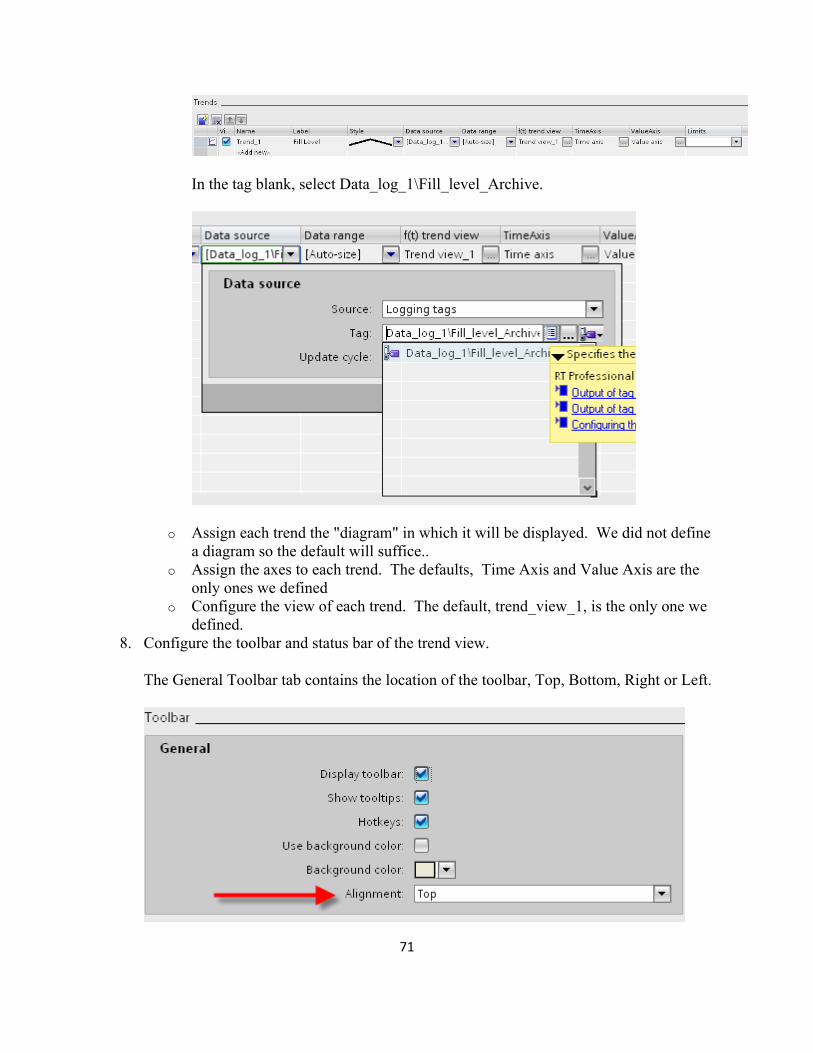
In the tag blank, select Data_log_1\Fill_level_Archive.
o Assign each trend the "diagram" in which it will be displayed. We did not define a diagram so the default will suffice..
o Assign the axes to each trend. The defaults, Time Axis and Value Axis are the only ones we defined
o Configure the view of each trend. The default, trend_view_1, is the only one we defined.
8. Configure the toolbar and status bar of the trend view.
The General Toolbar tab contains the location of the toolbar, Top, Bottom, Right or Left.
71
72
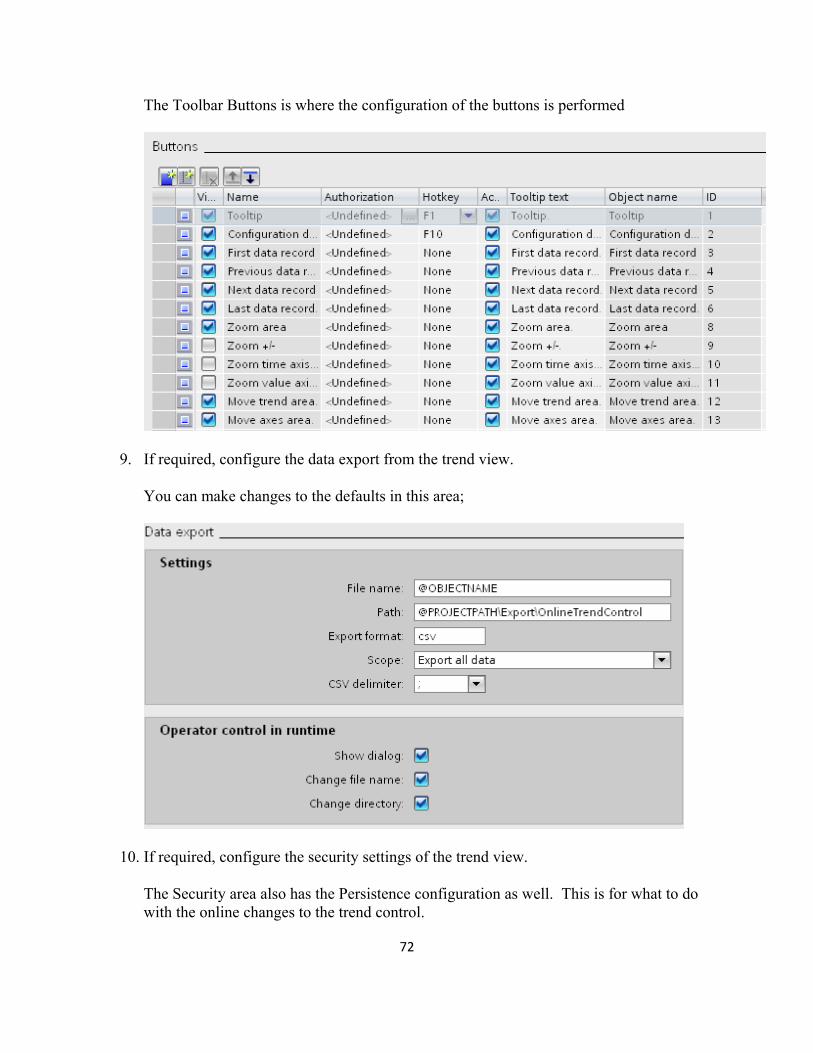
The Toolbar Buttons is where the configuration of the buttons is performed
9. If required, configure the data export from the trend view.
You can make changes to the defaults in this area;
10. If required, configure the security settings of the trend view.
The Security area also has the Persistence configuration as well. This is for what to do with the online changes to the trend control.
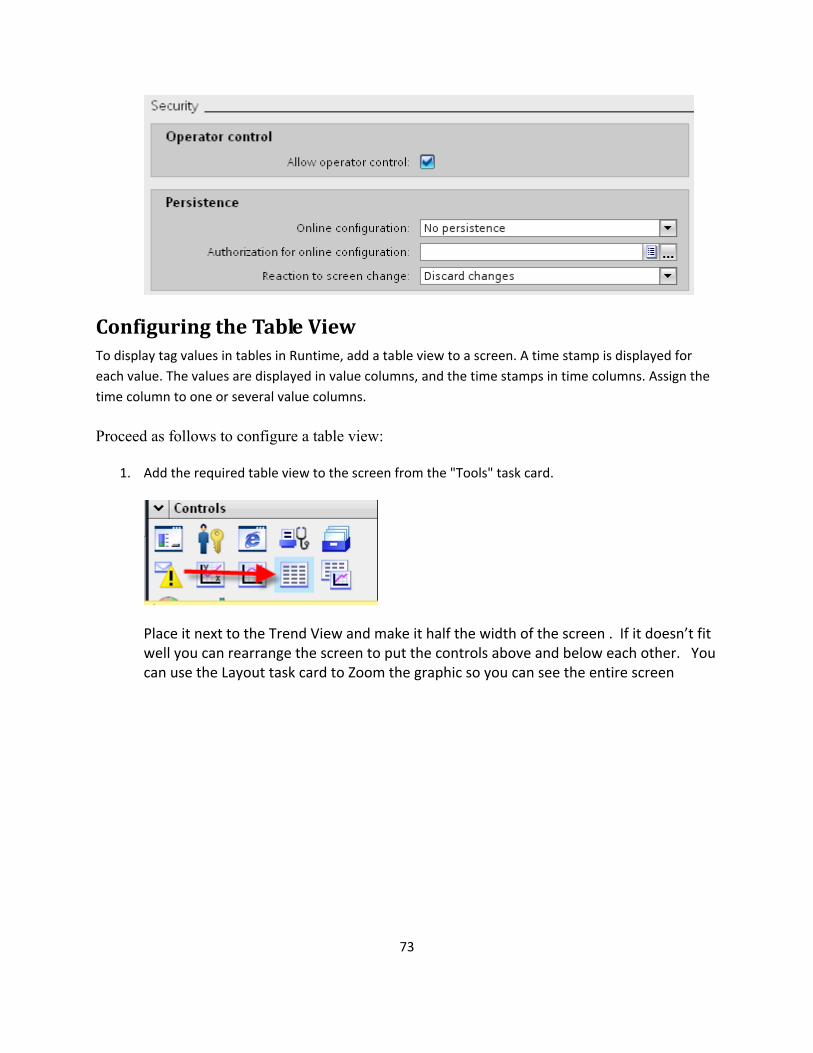
Configuring the Table View To display tag values in tables in Runtime, add a table view to a screen. A time stamp is displayed for each value. The values are displayed in value columns, and the time stamps in time columns. Assign the time column to one or several value columns.
Proceed as follows to configure a table view:
1. the "Tools" task card. Add the required table view to the screen from
Place it next to the Trend View and make it half the width of the screen . If it doesn’t fit well you can rearrange the screen to put the controls above and below each other. You can use the Layout task card to Zoom the graphic so you can see the entire screen
73
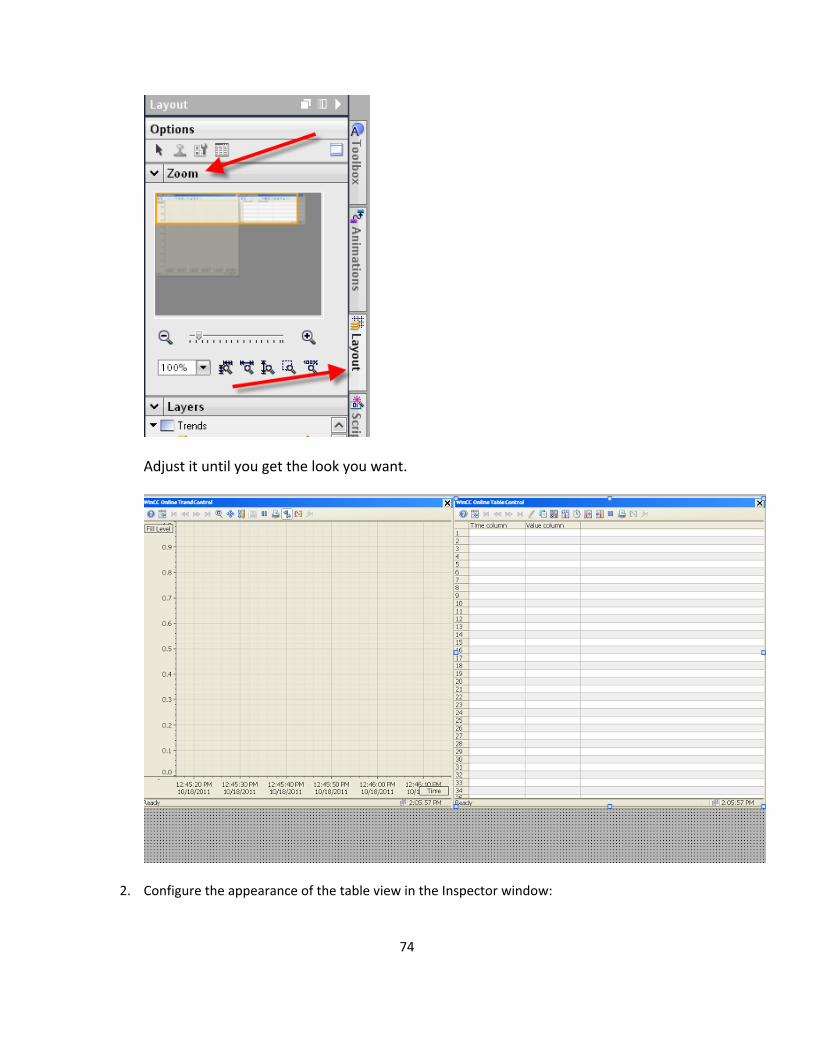
Adjust it until you get the look you want.
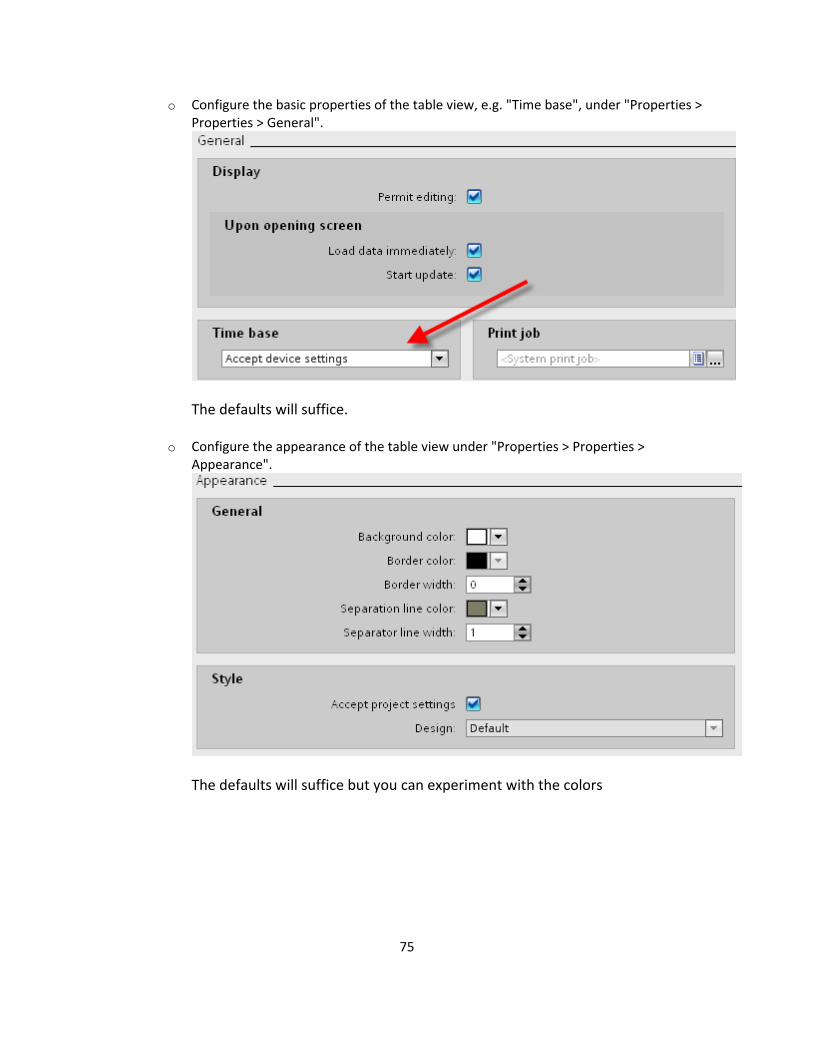
2. Configure the appearance of the table view in the Inspector window:
74
75
General". o Configure the basic properties of the table view, e.g. "Time base", under "Properties >
Properties >
The defaults will suffice.
o Configure the appearance of the table view under "Properties > Properties > Appearance".
The defaults will suffice but you can experiment with the colors
76
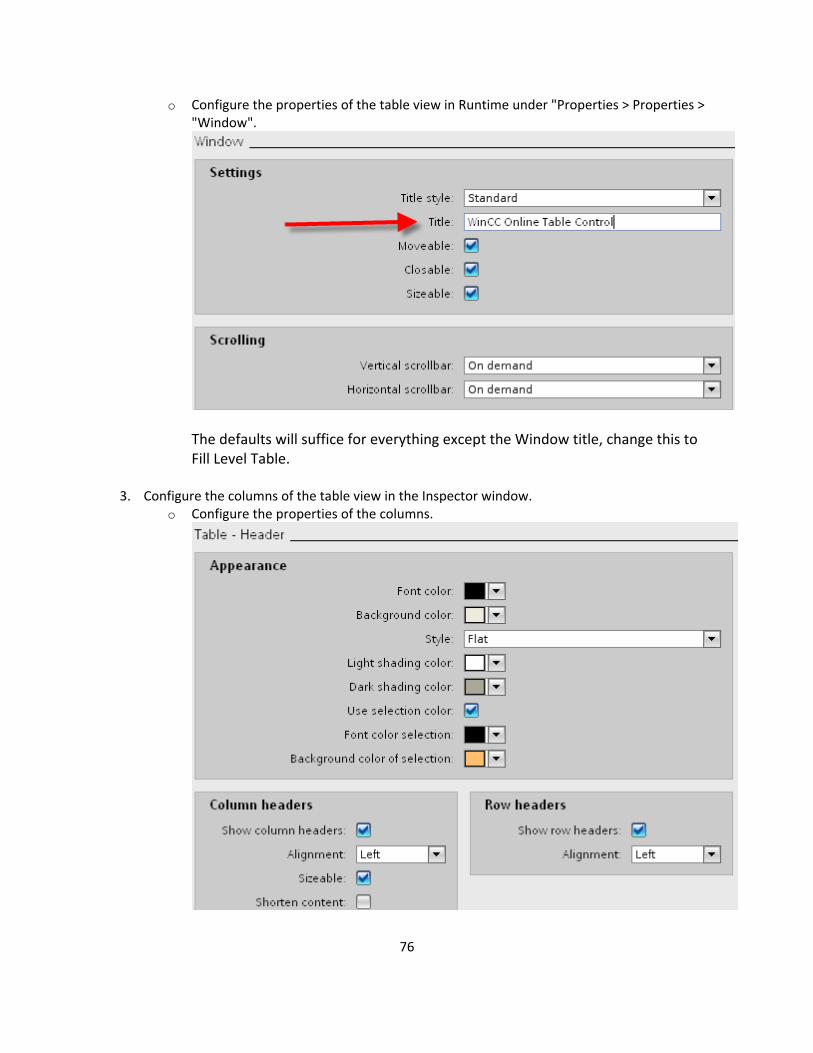
> o Configure the properties of the table view in Runtime under "Properties > Properties"Window".
The defaults will suffice for everything except the Window title, change this to
3. Configure the columns of the table view in the Inspector window. o Configure the properties of the columns.
Fill Level Table.
77
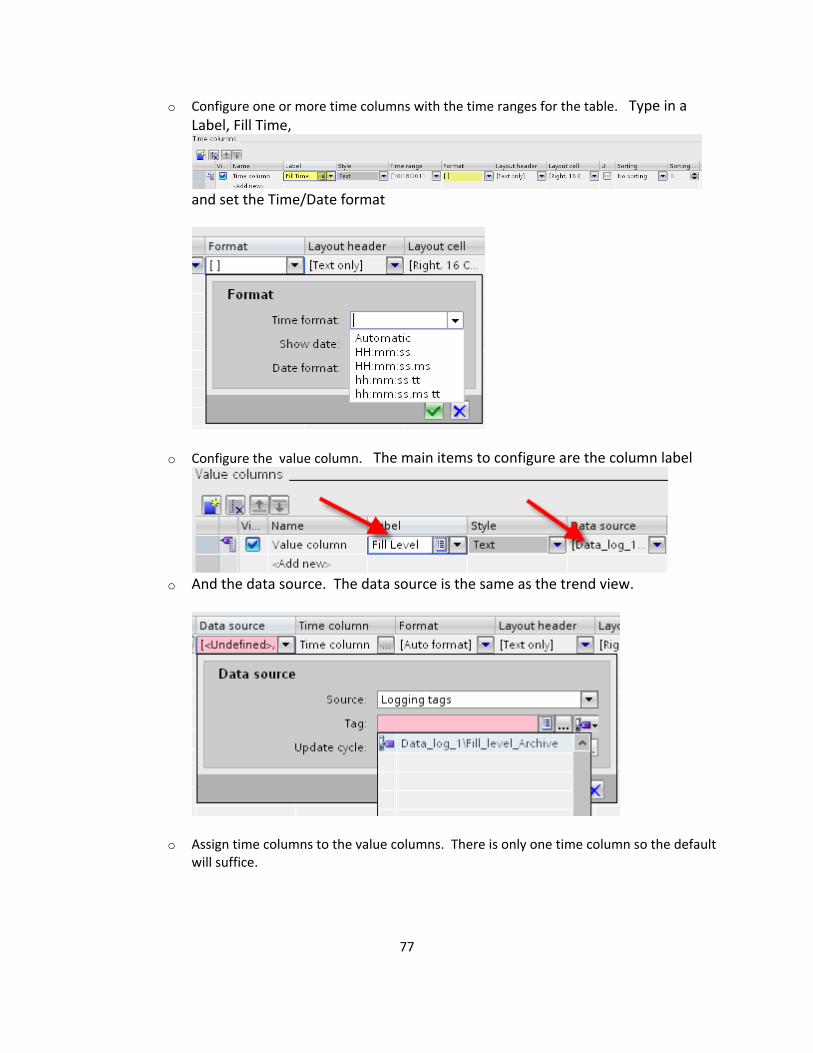
ns with the time ranges for the table. Type in a o Configure one or more time columLabel, Fill Time,
and set the Time/Date format
o Configure the value column. The main items to configure are the column label
And the data source. The data source is the same as the trend view.
o
o Assign time columns to the value columns. There is only one time column so the default will suffice.
78
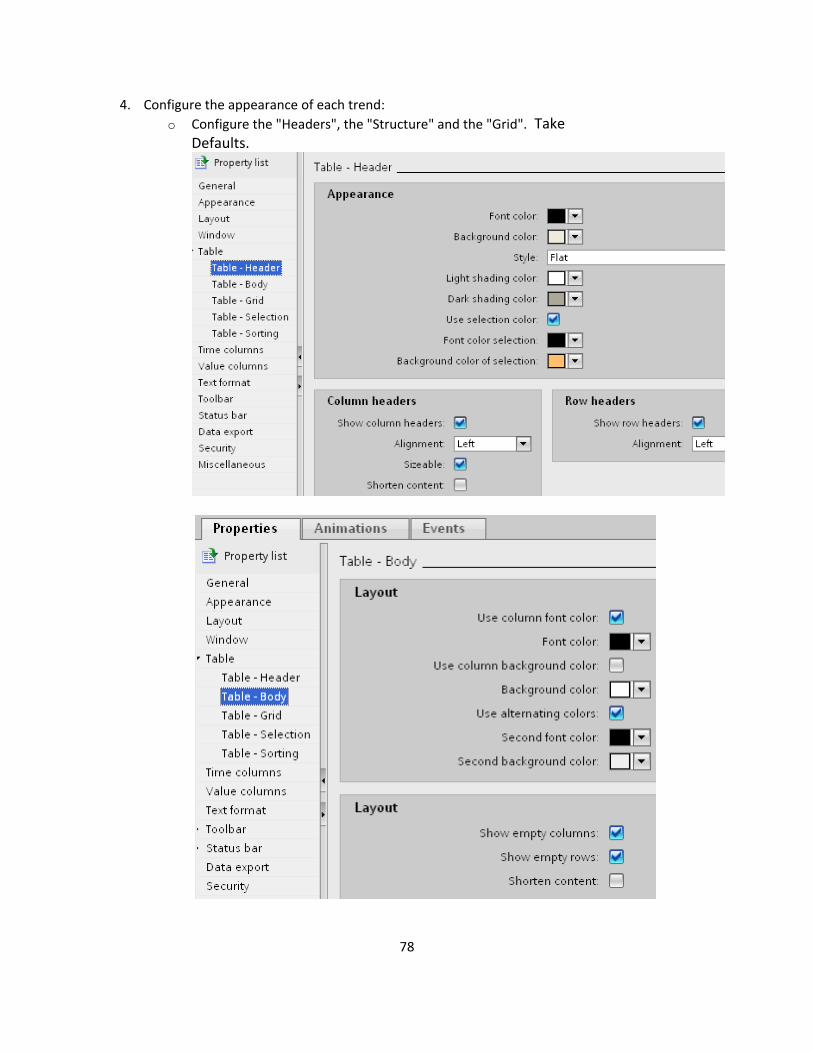
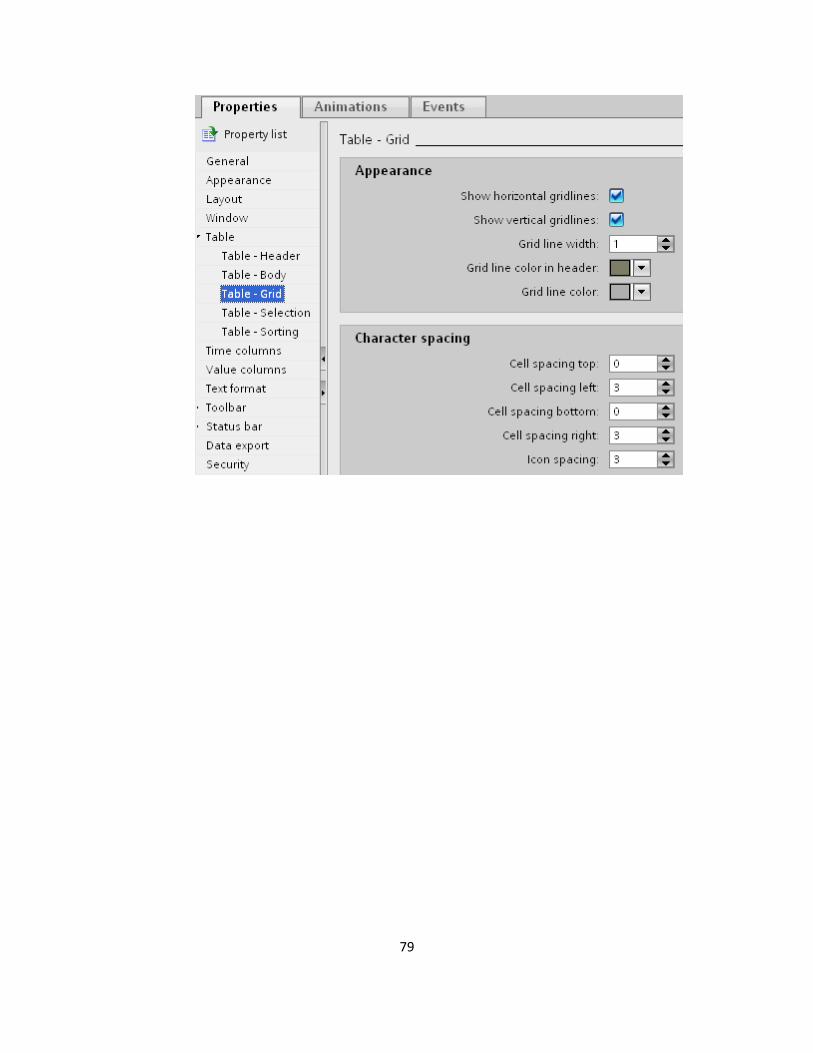
4. Configure the appearance of each trend: o Configure the "Headers", the "Structure" and the "Grid". Take
Defaults.
79
80
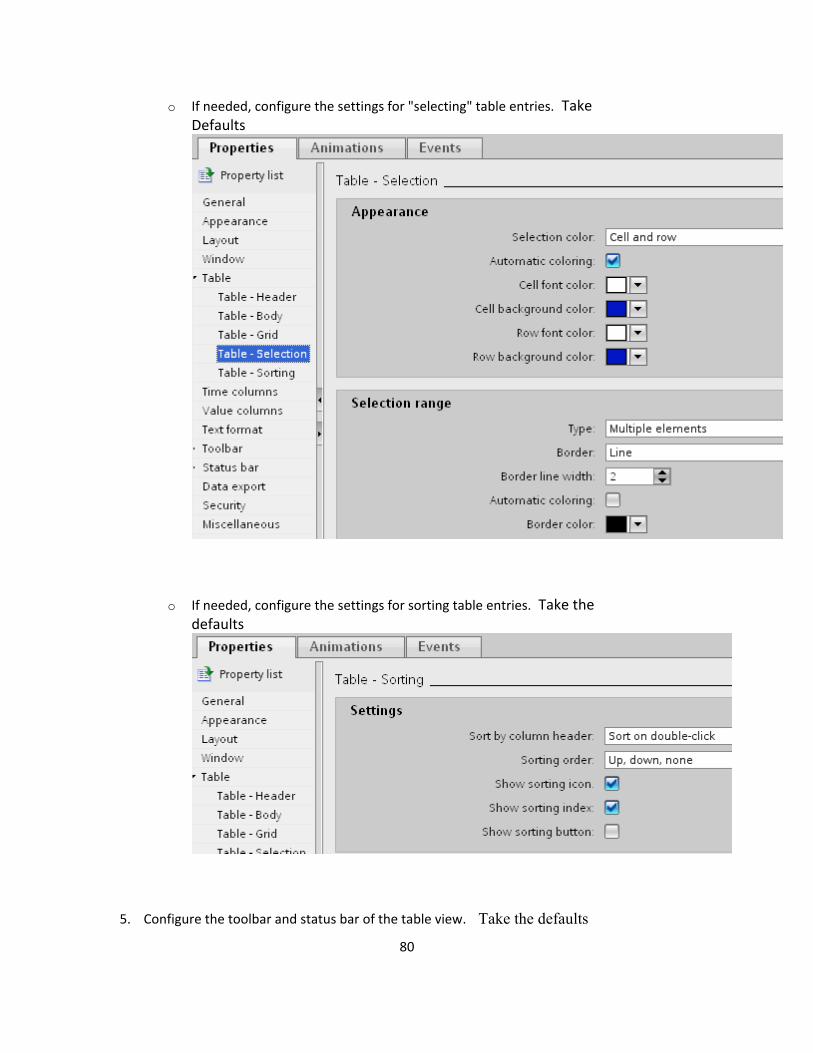
o If needed, configure the settings for "selecting" table entries. Take Defaults
o If needed, configure the settings for sorting table entries. Take the defaults
5. Configure the toolbar and status bar of the table view. Take the defaults
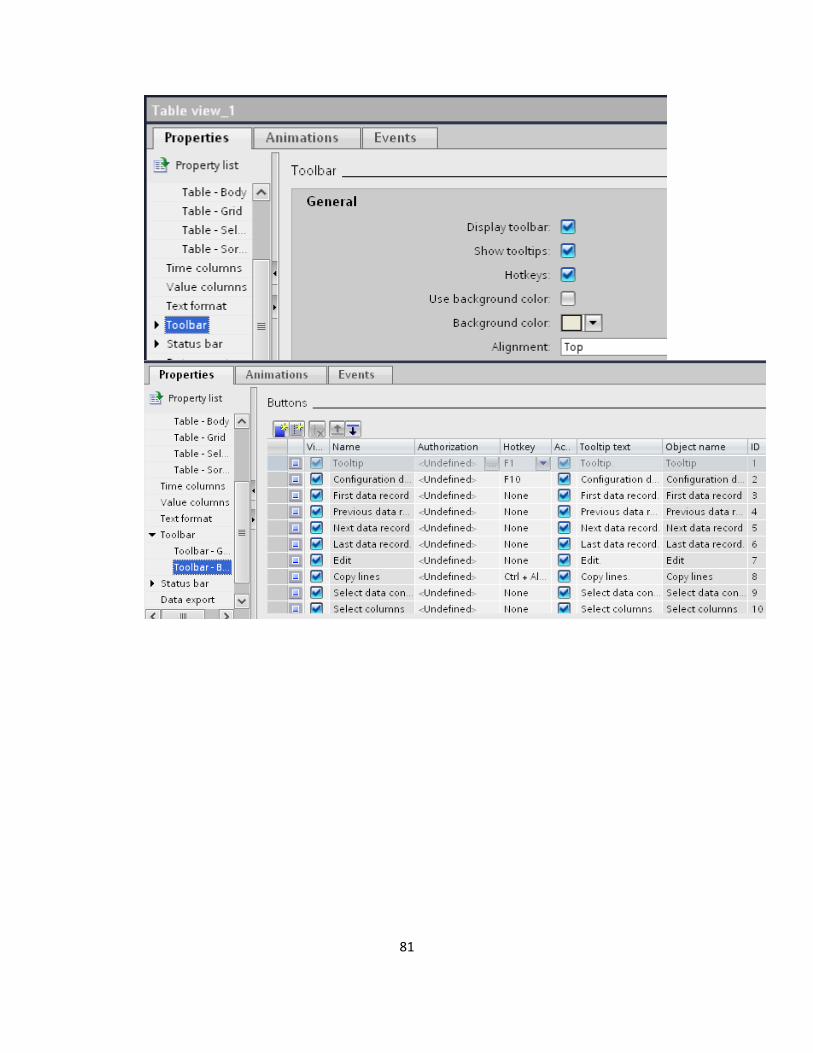
81
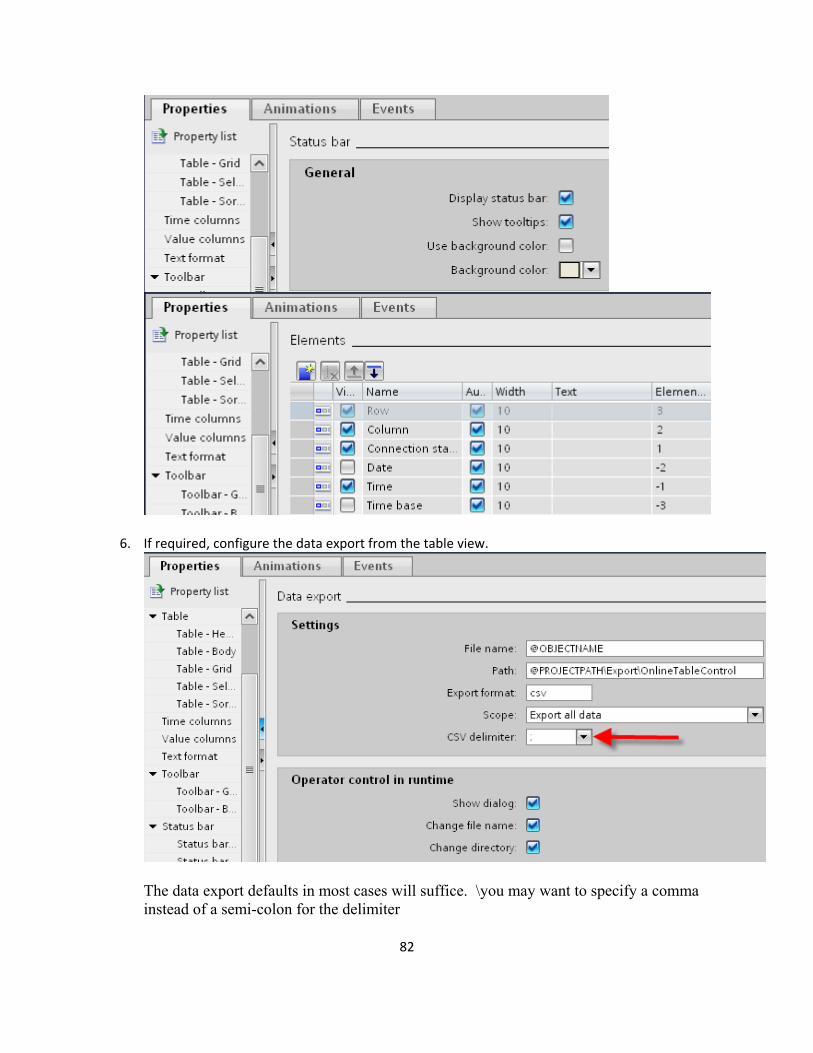
If required, configure the data export from the table view. 6.
The data export defaults in most cases will suffice. \you may want to specify a comma instead of a semi-colon for the delimiter
82
83
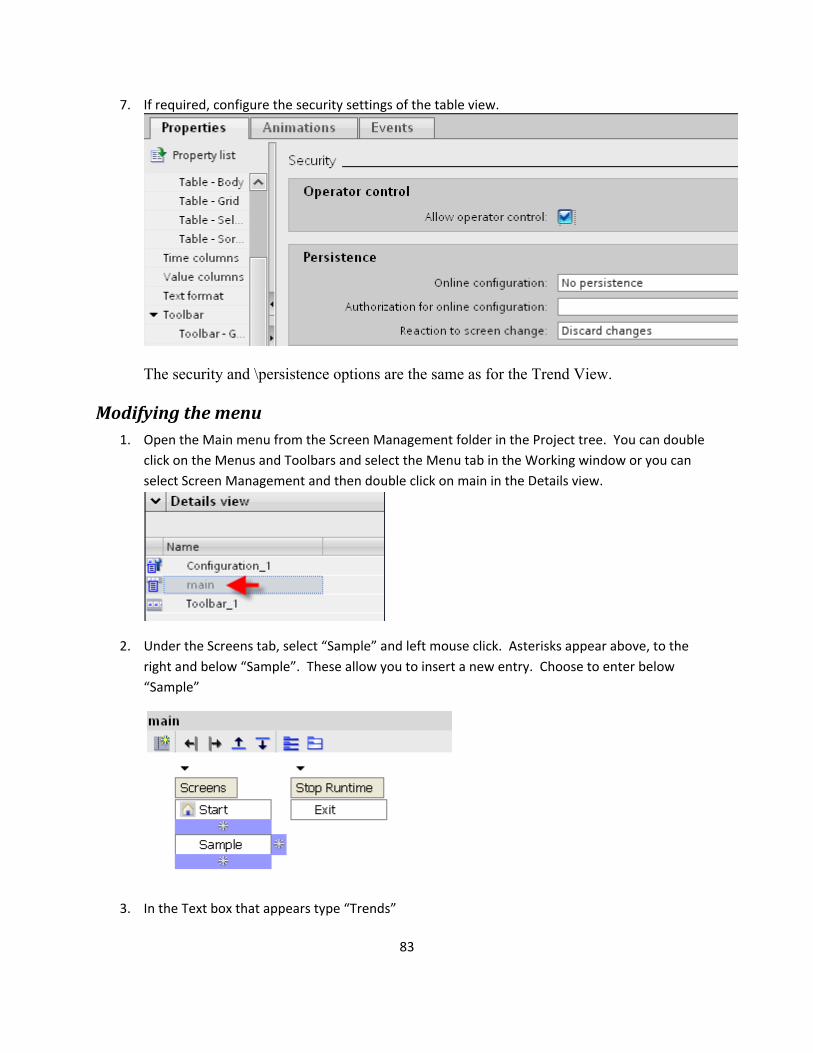
7. If required, configure the security settings of the table view.
The security and \persistence options are the same as for the Trend View.
Modifying the menu 1. Open the Main menu from the Screen Management folder in the Project tree. You can double
click on the Menus and Toolbars and select the Menu tab in the Working window or you can select Screen Management and then double click on main in the Details view.
2. Under the Screens tab, select “Sample” and left mouse click. Asterisks appear above, to the right and below “Sample”. These allow you to insert a new entry. Choose to enter below “Sample”
3. In the Text box that appears type “Trends”
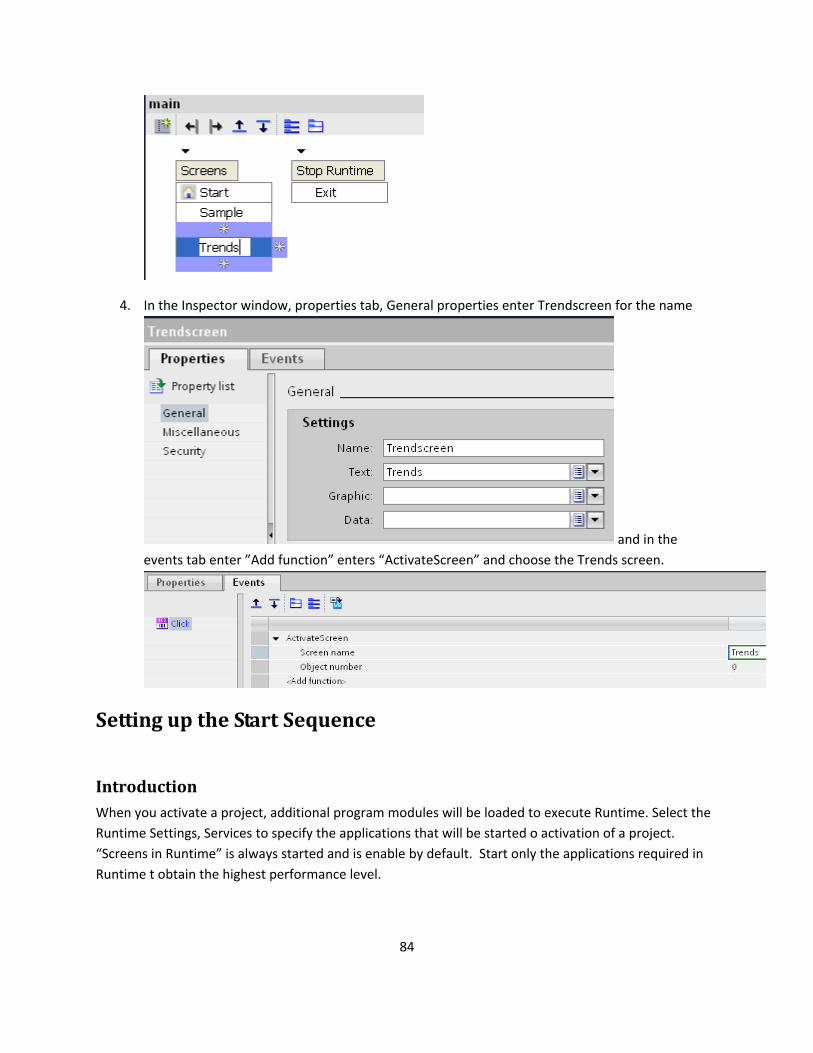
4. In the Inspector window, properties tab, General properties enter Trendscreen for the name
and in the events tab enter ”Add function” enters “ActivateScreen” and choose the Trends screen.
Setting up the Start Sequence
Introduction When you activate a project, additional program modules will be loaded to execute Runtime. Select the Runtime Settings, Services to specify the applications that will be started o activation of a project. “Screens in Runtime” is always started and is enable by default. Start only the applications required in Runtime t obtain the highest performance level.
84
85
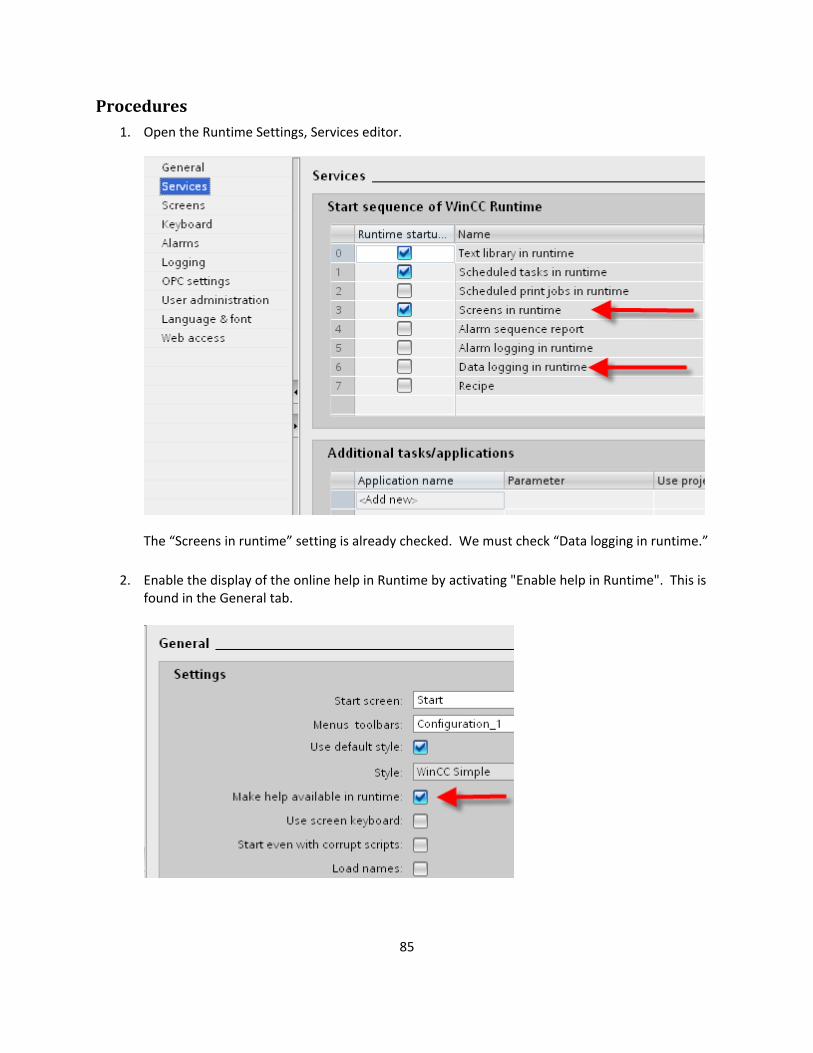
Procedures 1. Open the Runtime Settings, Services editor.
The “Screens in runtime” setting is already checked. We must check “Data logging in runtime.”
2. ntime". This is Enable the display of the online help in Runtime by activating "Enable help in Rufound in the General tab.
86
Activating and Testing the project
Introduction The following steps will show you how to activate and test the getting started project. You test the project by means of the WinCC TAG Simulator. The WinCC Tag Simulator assigns values to the internal tag "TankLevel" in Runtime. These values are acquired every 1 second in the project and saved in the archive tag "Fill_level_Archive". Data Logging runtime reads the
rchives values and transfers them to the trend window and the table window. The values are
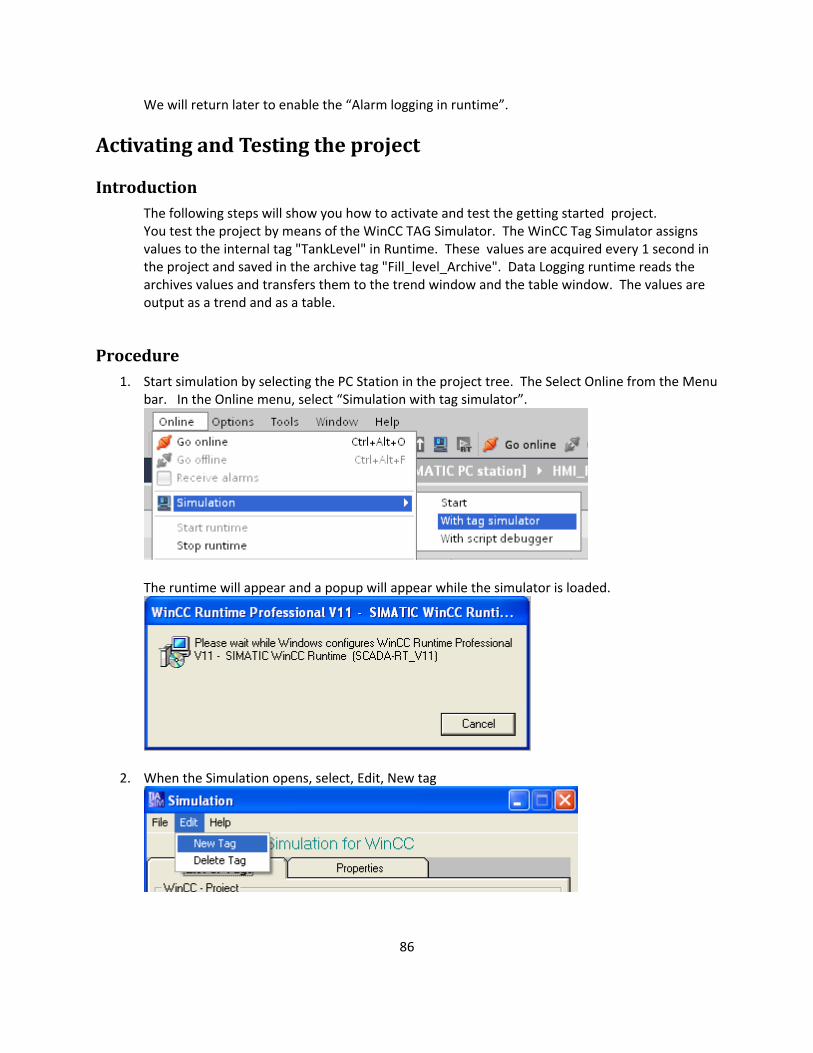
Procedure 1. Start simulation by selecting the PC Station in the project tree. The Select Online from the Menu
bar. In the Online menu, select “Simulation with tag simulator”.
We will return later to enable the “Alarm logging in runtime”.
aoutput as a trend and as a table.
The runtime will appear and a popup will appear while the simulator is loaded.
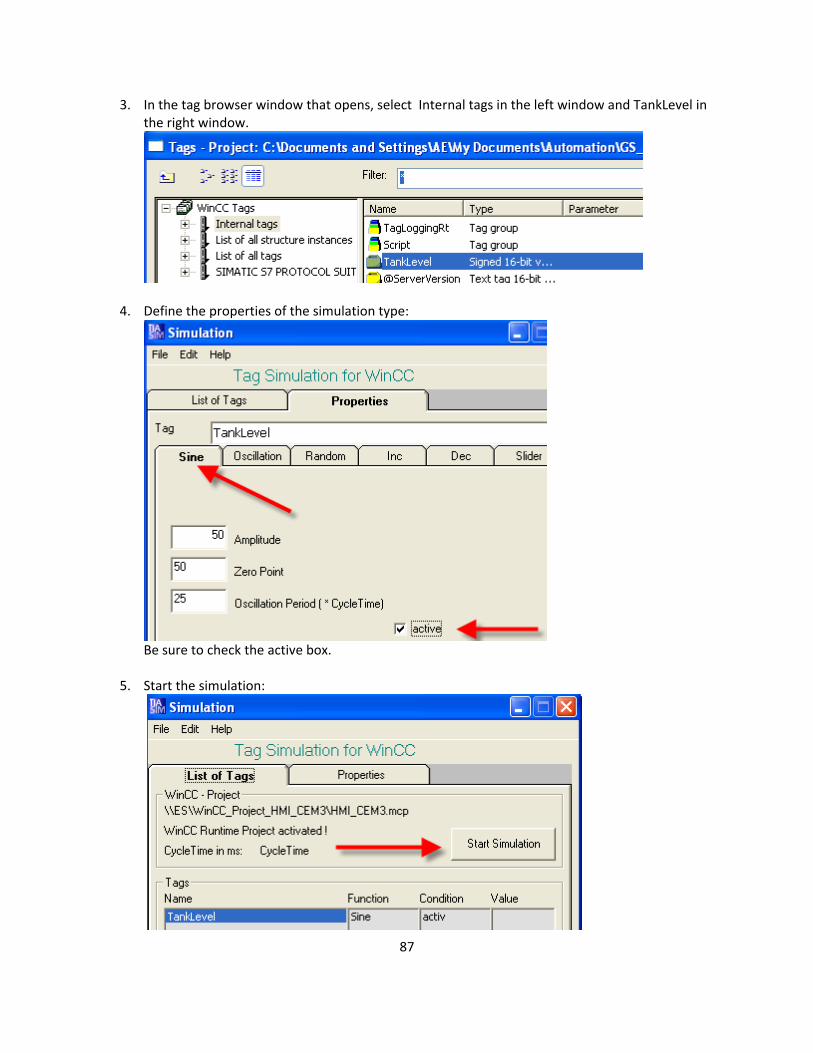
2. When the Simulation opens, select, Edit, New tag
87
3. the tag browser window that opens, select Internal tags in the left window and TankLevel in Inthe right window.
4. Define the properties of the simulation type:
Be sure to check the active box.
5. Start the simulation:
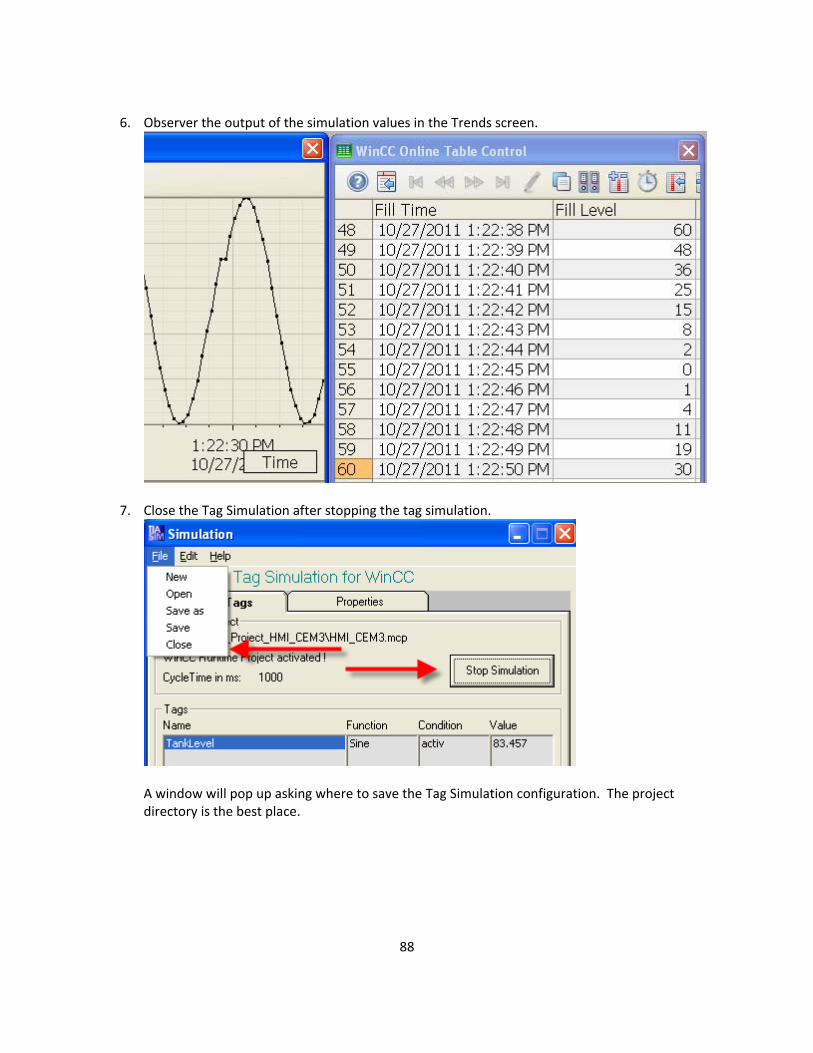
88
6. Observer the output of the simulation values in the Trends screen.
. C7 lose the Tag Simulation after stopping the tag simulation.
A window will pop up asking where to save the Tag Simulation configuration. The project
place. directory is the best
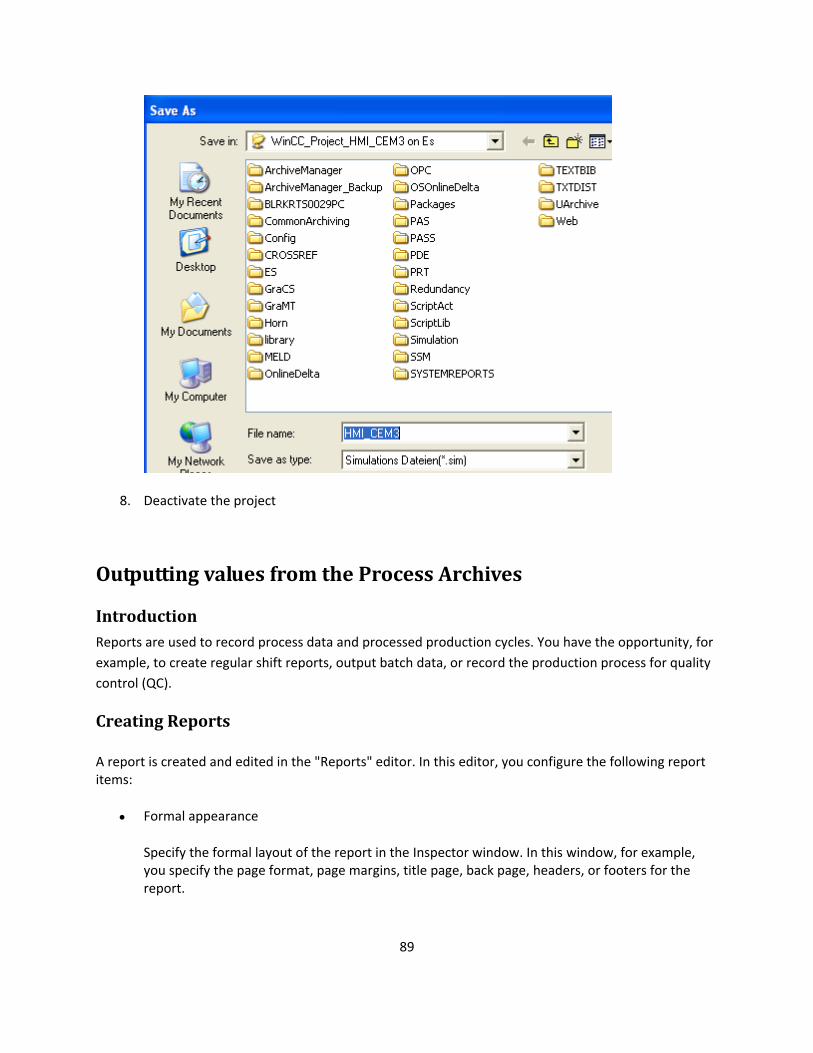
8. Deactivate the project
Outputting values from the Process Archives
Introduction Reports are used to record process data and processed production cycles. You have the opportunity, for
lity
Creating Reports
of the report in the Inspector window. In this window, for example, you specify the page format, page margins, title page, back page, headers, or footers for the
example, to create regular shift reports, output batch data, or record the production process for quacontrol (QC).
A report is created and edited in the "Reports" editor. In this editor, you configure the following report items:
Formal appearance
Specify the formal layout
report.
89
90
specify whether to output the different pages with or without watermark in
Content
In the work area, specify the content of the report, for example, the alarms of a shift. To this purpose, insert the corresponding objects into the detail page(s).
You can also design the title page, back page, headers, and footers as you please. For watermarked pages, create additional pages to be included as "background image" in the output.
The modular structure lets you configure reports that suit all of your applic tions.
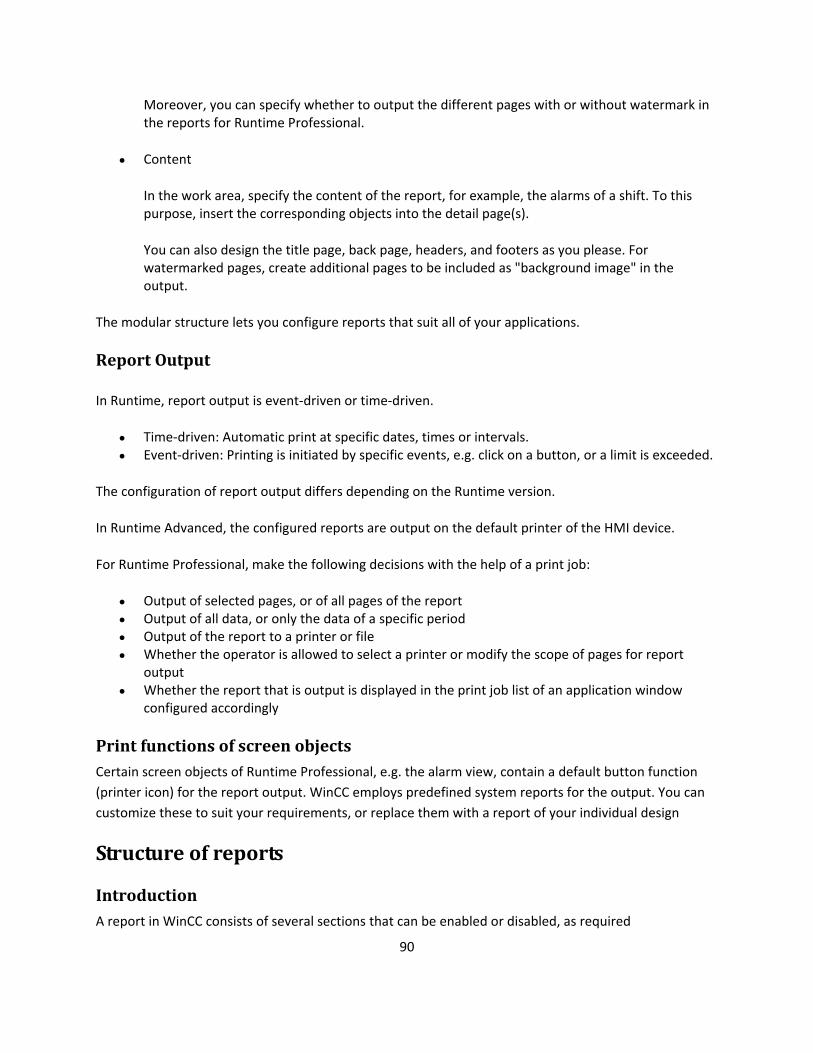
a limit is exceeded.
of report output differs depending on the Runtime version.
pages, or of all pages of the report Output of all data, or only the data of a specific period
e report that is output is displayed in the print job list of an application window accordingly
Certain screen objects of Runtime Professional, e.g. the alarm view, contain a default button function n
Introduction A report in WinCC consists of several sections that can be enabled or disabled, as required
Moreover, you canthe reports for Runtime Professional.
a
Report Output
In Runtime, report output is event-driven or time-driven.
Time-driven: Automatic print at specific dates, times or intervals. Event-driven: Printing is initiated by specific events, e.g. click on a button, or
The configuration
In Runtime Advanced, the configured reports are output on the default printer of the HMI device.
For Runtime Professional, make the following decisions with the help of a print job:
Output of selected
Output of the report to a printer or file Whether the operator is allowed to select a printer or modify the scope of pages for report
output Whether th
configured
Print functions of screen objects
(printer icon) for the report output. WinCC employs predefined system reports for the output. You cacustomize these to suit your requirements, or replace them with a report of your individual design
Structure of reports
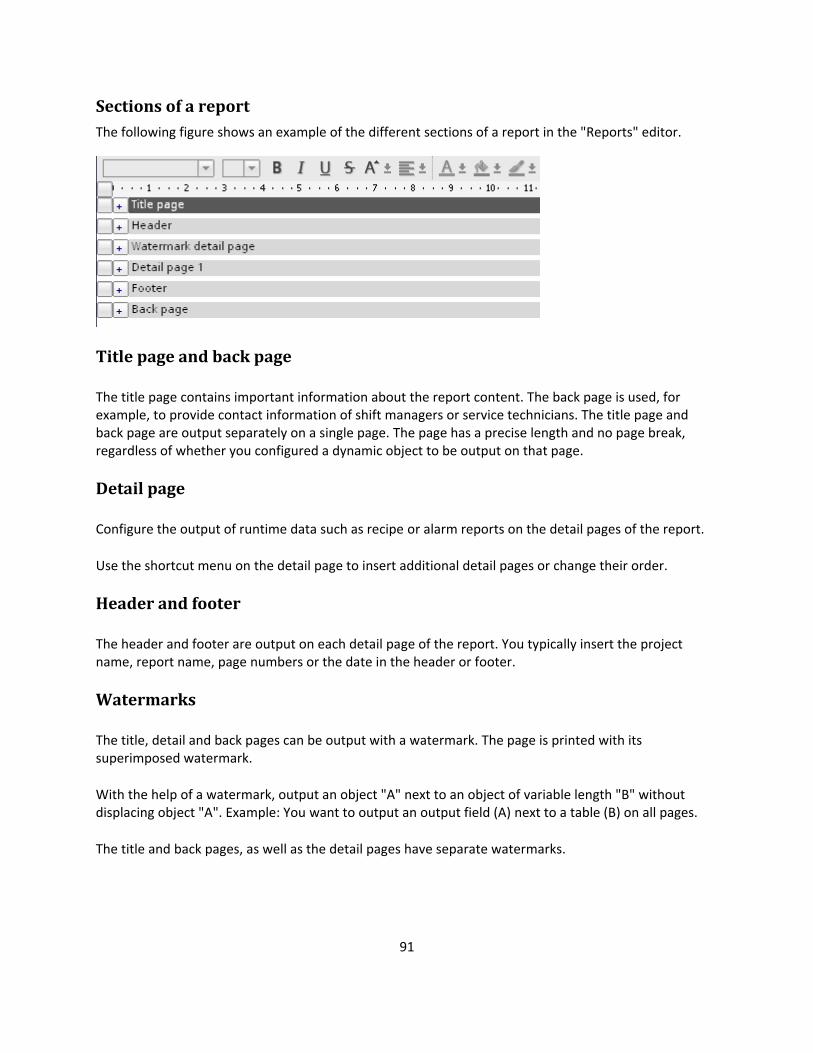
Sections of a report
91
The following figure shows an example of the different sections of a report in the "Reports" editor.
Title page and back page
. The back page is used, for example, to provide contact information of shift managers or service technicians. The title page and back page are output separately on a single page. The page has a precise length and no page break, regardless of whether you configured a dynamic object to be output on that page.
Detail page
Configure the output of runtime data such as recipe or alarm reports on the detail pages of the report.
Use the shortcut menu on the detail page to insert additional detail pages or change their order.
Header and footer
The header and footer are output on each detail page of the report. You typically insert the project name, report name, page numbers or the date in the header or footer.
Watermarks
The title, detail and back pages can be output with a watermark. The page is printed with its superimposed watermark.
With the help of a watermark, output an object "A" next to an object of variable length "B" without displacing object "A". Example: You want to output an output field (A) next to a table (B) on all pages.
The title and back pages, as well as the detail pages have separate watermarks.
The title page contains important information about the report content
92
Working with reports
Creating Reports
Principles for parathion of reports
Introduction A report in WinCC consists of several sections that can be enabled or disabled, as required.
Title page Back page Detail pages Headers and footers for the detail pages
Procedure The following figure shows the general procedure for creating a report
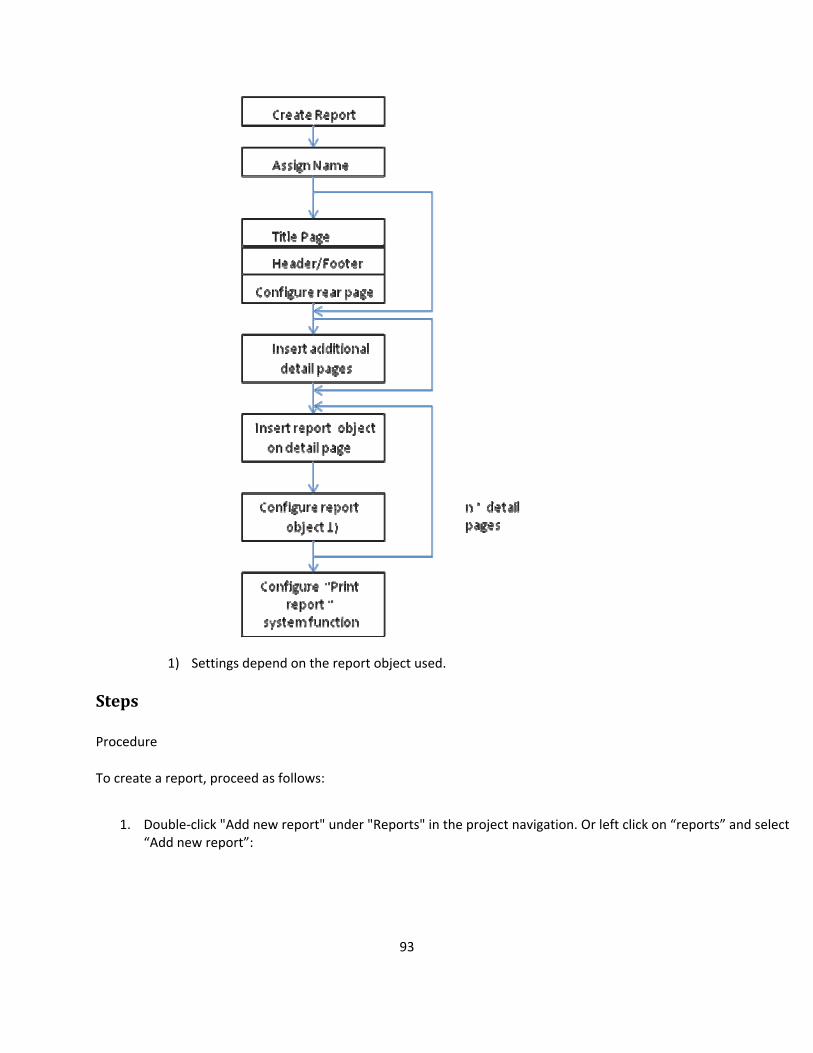
1) Settings depend on the report object used.
Steps
Procedure
To create a report, proceed as follows:
1. Double-click "Add new report" under "Reports" in the project navigation. Or left click on “reports” and select “Add new report”:
93
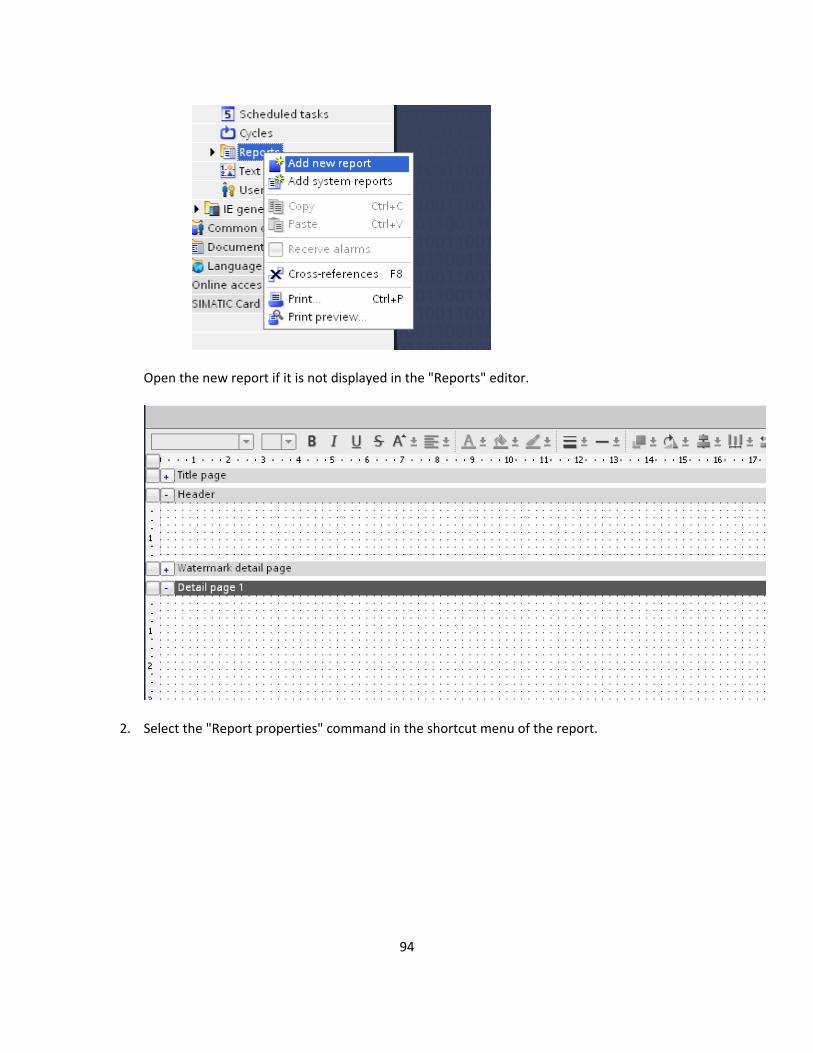
Open the new report if it is not displayed in the "Reports" editor.
2. Select the "Report properties" command in the shortcut menu of the report.
94
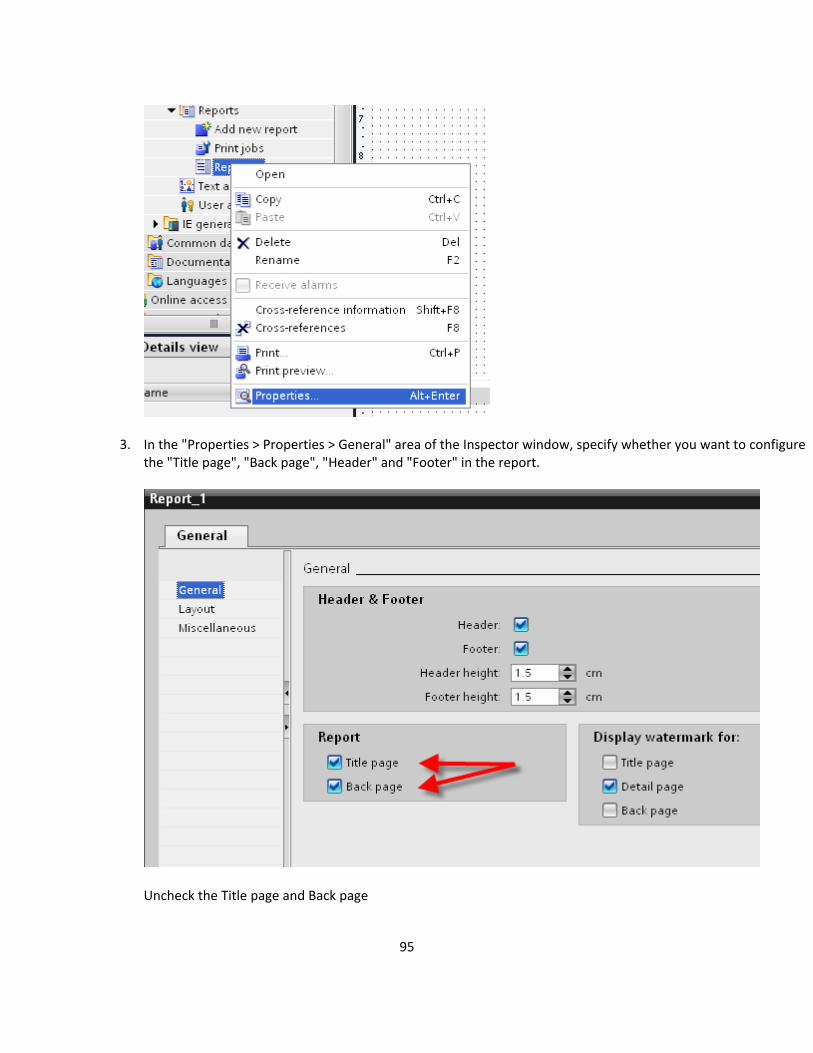
3. In the "Properties > Properties > General" area of the Inspector window, specify whether you want to configure the "Title page", "Back page", "Header" and "Footer" in the report.
Uncheck the Title page and Back page
95
96
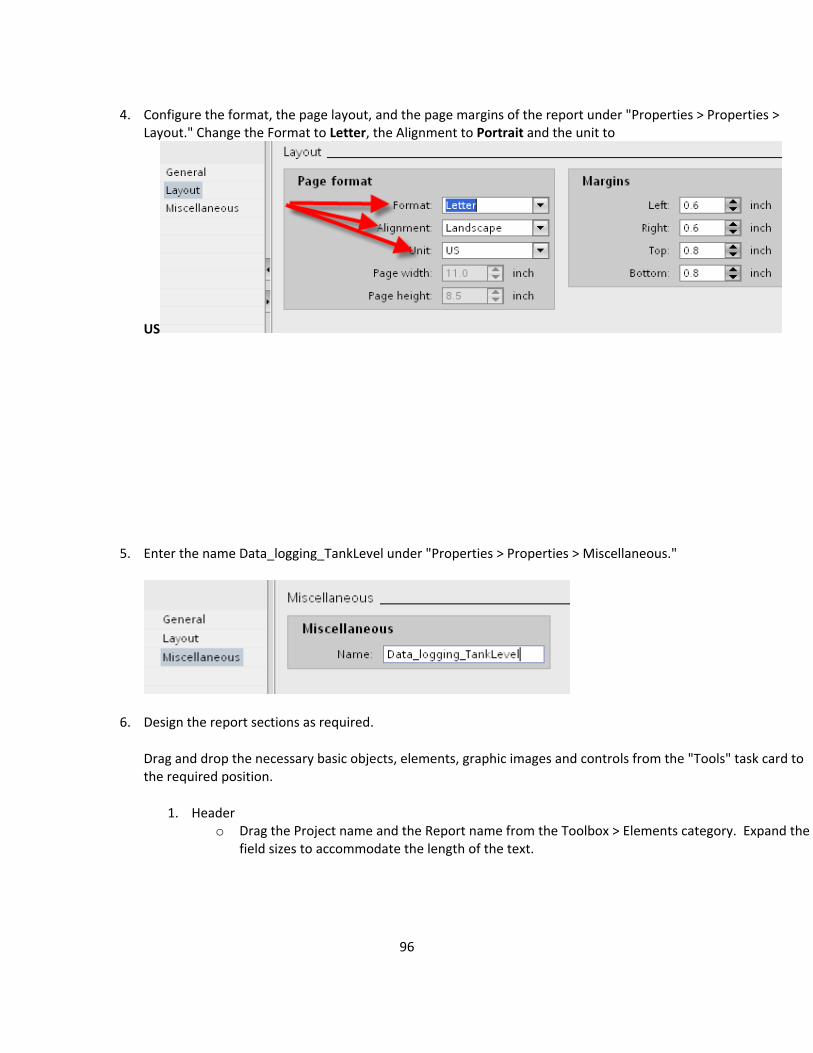
4. Configure the format, the page layout, and the page margins of the report under "Properties > Properties > Layout." Change the Format to Letter, the Alignment to Portrait and the unit to
US
5. Enter the name Data_logging_TankLevel under "Properties > Properties > Miscellaneous."
6. Design the report sections as required.
Drag and drop the necessary basic objects, elements, graphic images and controls from the "Tools" task card to the required position.
1. Header o Drag the Project name and the Report name from the Toolbox > Elements category. Expand the
field sizes to accommodate the length of the text.
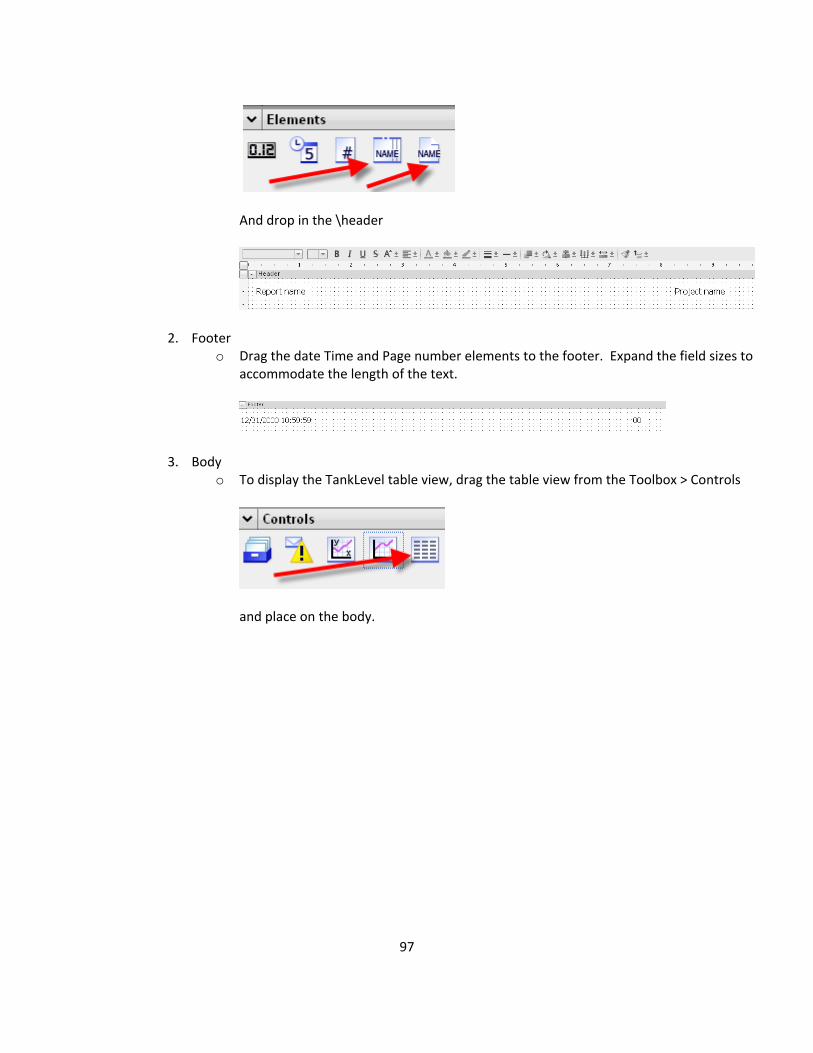
And drop in the \header
2. Footer o Drag the date Time and Page number elements to the footer. Expand the field sizes to
accommodate the length of the text.
3. Body o To display the TankLevel table view, drag the table view from the Toolbox > Co rols nt
and place on the body.
97
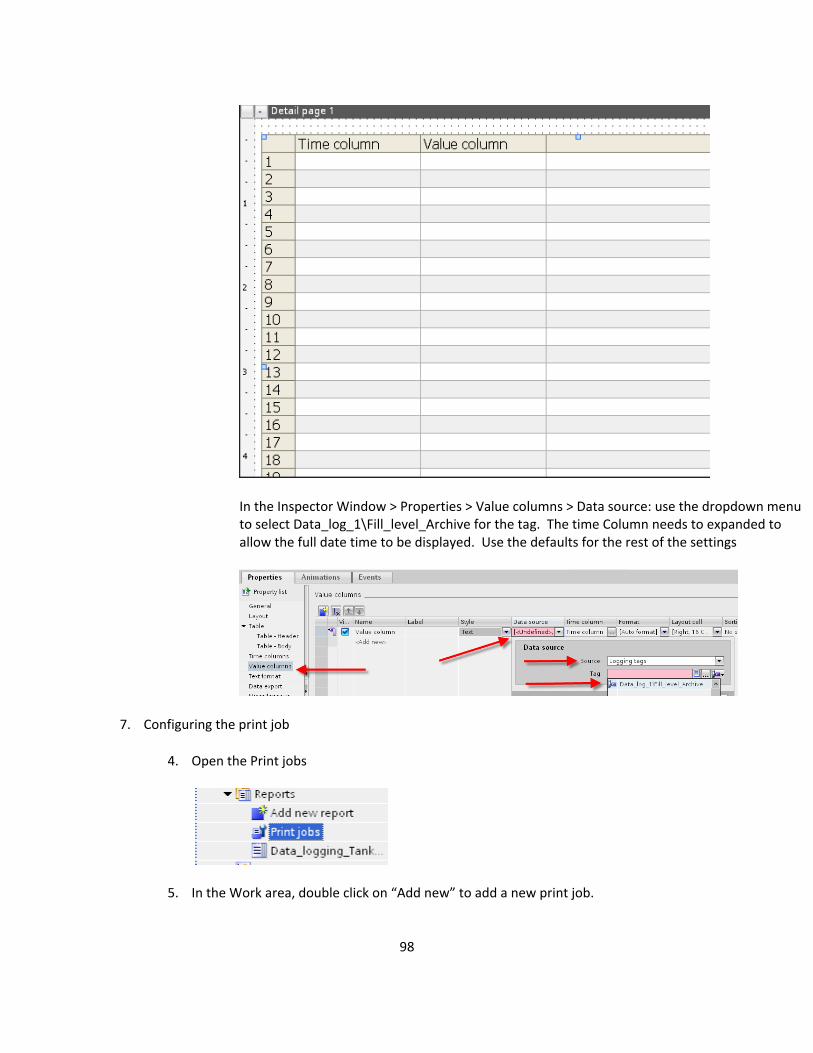
In the Inspector Window > Properties > Value columns > Data source: use the dropdown menu to select Data_log_1\Fill_level_Archive for the tag. The time Column needs to expanded to allow the full date time to be displayed. Use the defaults for the rest of the settings
7. Configuring the print job
4. Ope hn t e Print jobs
5. In the Work area, double click on “Add new” to add a new print job.
98
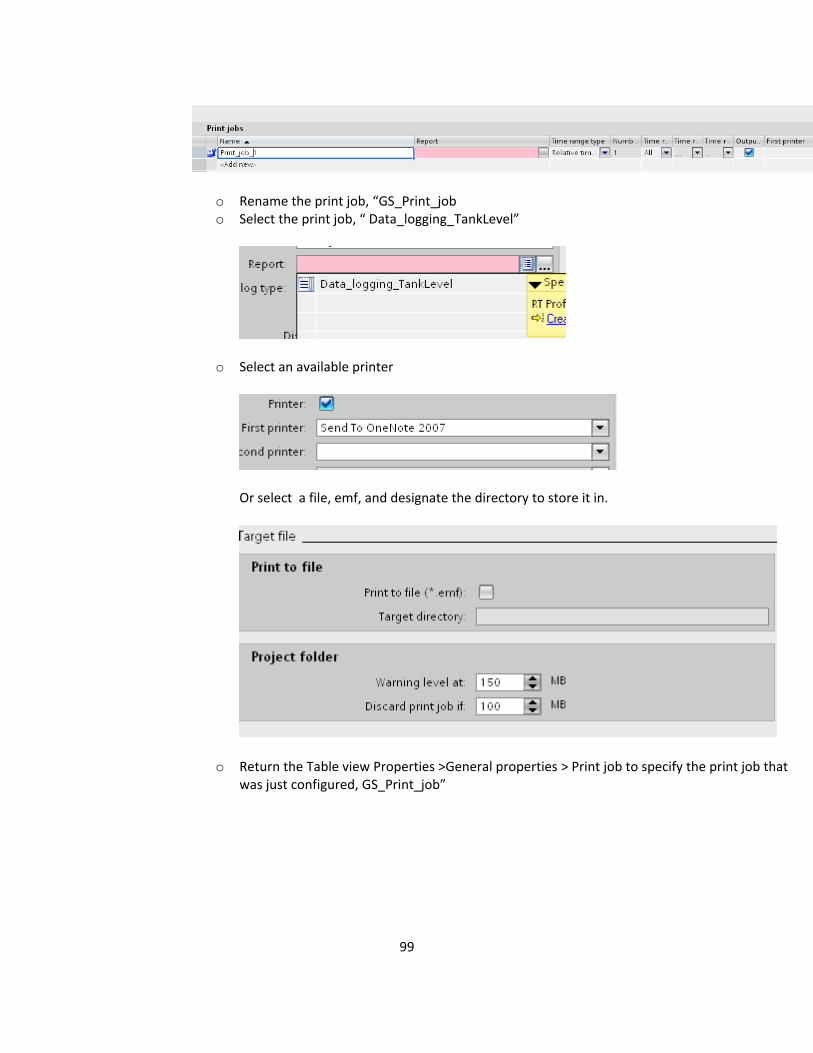
o Rename the print job, “GS_Print_job o Select the print job, “ Data_logging_TankLevel”
Select an available printer o
Or select a file, emf, and designate the directory to store it in.
o Return the Table view Properties >General properties > Print job to specify the print job that was just configured, GS_Print_job”
99
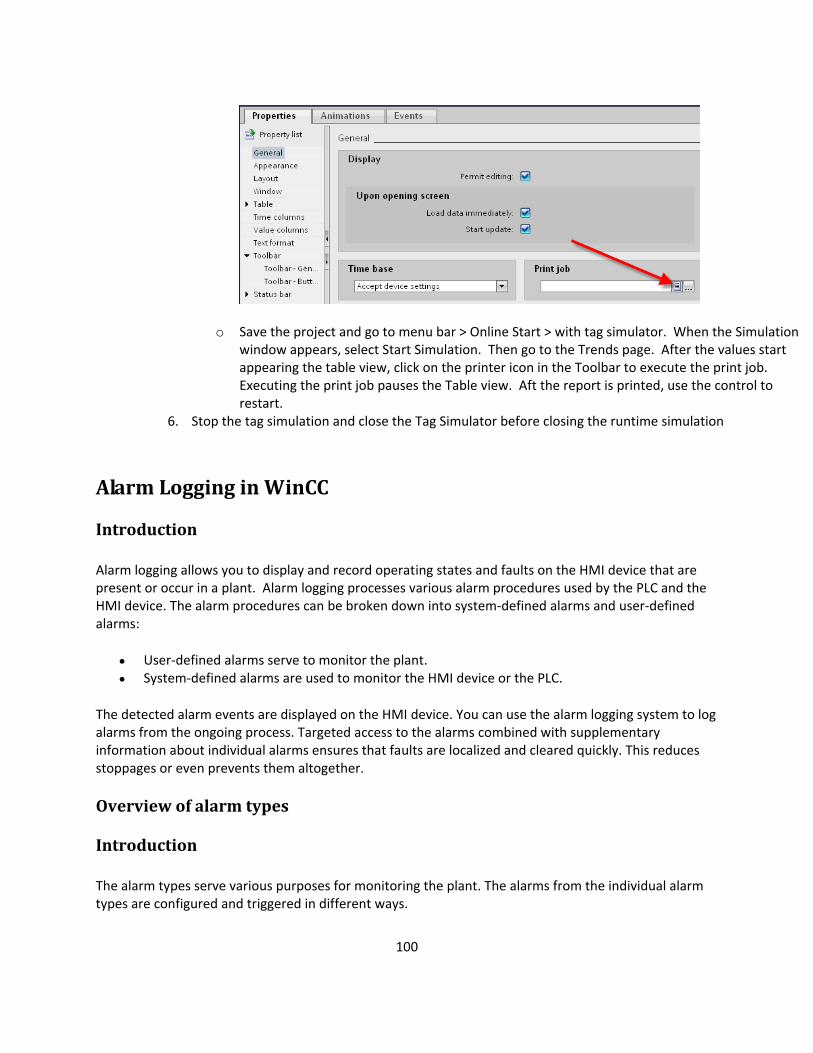
o Save the project and go to menu bar > Online Start > with tag simulator. When the Simulation window appears, select Start Simulation. Then go to the Trends page. After the values start
rinter icon in the Toolbar to execute the print job. control to
tart. simulation and close the Tag Simulator before closing the runtime simulation
Alarm Logging in WinCC
Alar lo rd operating states and faults on the HMI device that are present or o sed by the PLC and the HMIalarms:
User-defined alarms serve to monitor the plant. System-defined alarms are used to monitor the HMI device or the PLC.
The ystem to log alarms from e alarms combined with supplementary information out individual alarms ensures that faults are localized and cleared quickly. This reduces
nts them altogether.
f alarm types
The alarm types serve various purposes for monitoring the plant. The alarms from the individual alarm pes are configured and triggered in different ways.
appearing the table view, click on the pExecuting the print job pauses the Table view. Aft the report is printed, use theres
6. Stop the tag
Introduction
m gging allows you to display and recoccur in a plant. Alarm logging processes various alarm procedures u
device. The alarm procedures can be broken down into system-defined alarms and user-defined
detected alarm events are displayed on the HMI device. You can use the alarm logging s th ongoing process. Targeted access to the ab
stoppages or even preve
Overview o
Introduction
ty
100
101
levant tab in the "HMI alarms" editor to configure alarms based on the individual alarm types.
Alarm types in WinCC
WinCC supports the following alarm types:
User-defined alarms
o Analog alarms are used to monitor limit violations.
are used to monitor states.
User alarms s serve to monitor operator input.
o User alarms are triggered by means of alarm number and can be also used in scripts in
Controller alarms roller alarms in STEP 7.
o You continue to process the controller alarms in WinCC.
Sy -defined alarms
stem-defined controller alarms o e itor the PLC. o c lso belong to the category of
o System events belong to the HMI device and are imported into the project. em events mo I device.
larm ates
trodu tion
alarm ass us alarm s n the process execution w the a
Select the re
Analog alarms
Discrete alarms o Discrete alarms
o User alarm
Runtime.
o You configure cont
stem
SySystem-d fined controller alarms are used to monDiagnostisystem-defined controller
s alarms (SIMATIC S7) and system alarms (SFM) aalarms.
System events
o Syst nitor the HM
A St
In c
An umes vario tates in Runtime. The user analyzes and reports oith reference to larm states.
102
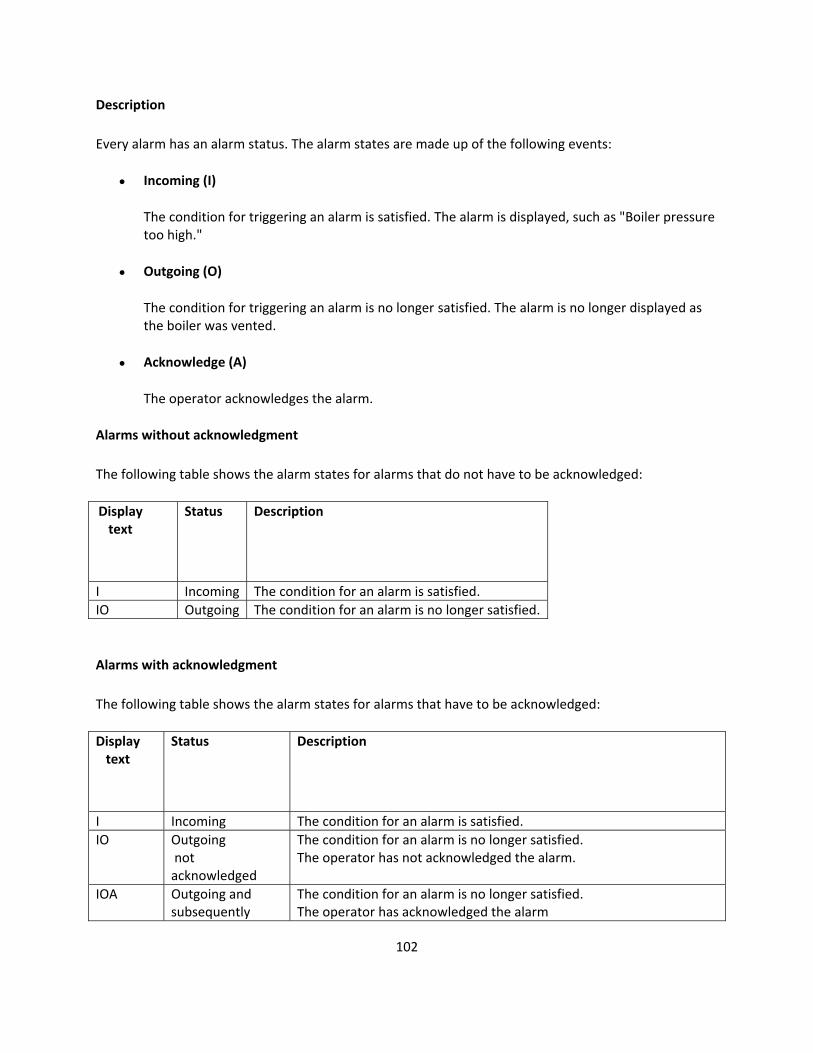
Description
Every alarm The alarm states are made up of the following events:
Incoming (I)
The essure too
Outgoing (O)
The condition for triggering an alarm is no longer satisfied. The alarm is no longer displayed as the boiler was vented.
tor acknowledges the alarm.
The following table shows the alarm states for alarms that do not have to be acknowledged:
Display
Status Description
has an alarm status.
condition for triggerhigh."
ing an alarm is satisfied. The alarm is displayed, such as "Boiler pr
Acknowledge (A)
The opera
Alarms without acknowledgment
text
I Incoming The condition for an alarm is satisfied. IO Outgoing The condition for an alarm is no longer satisfied.
Alarms with acknowledgment
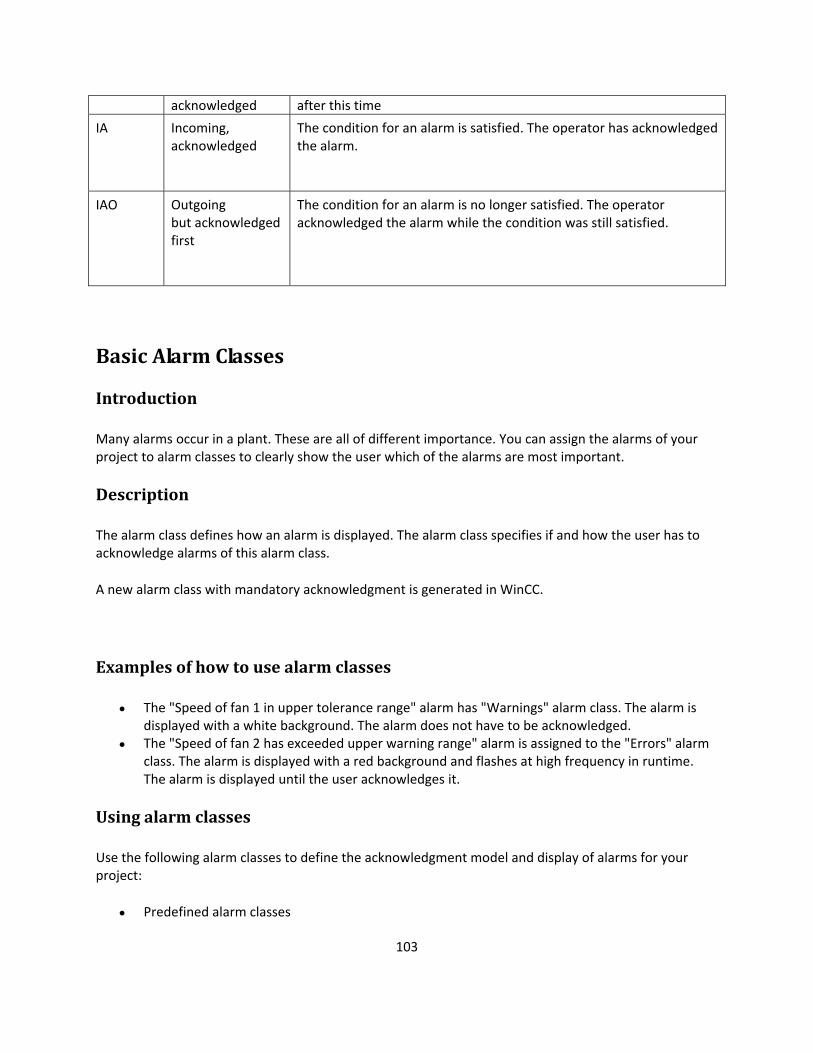
The following table shows the alarm states for alarms that have to be acknowledged:
Disp y text
la
Status Description
I Incoming The condition for an alarm is satisfied. IO Outgoing
acknowledged
The condition for an alarm is no longer satisfied. not The operator has not acknowledged the alarm.
IOA Outgoing and The condition for an alarm is no longer satisfied. he operator has acknowledged the alarm subsequently T
103
acknowledged after this time
IA Incoming, The condition for an alarm is satisfied. The operator has acknowle
acknowledged
dged the alarm.
IAO
but acknowlefirst
m is no longer satisfied. The operator d the alarm while the condition was still satisfied.
Outgoing The condition for an alardged acknowledge
Basic Alarm Cla
Introduction
Many alarms oc portance. You can assign the alarms of your project to alarm classes to clearly show the user which of the alarms are most important.
Description
The alarm class defines how an alarm is displayed. The alarm class specifies if and how the user has to acknowledge alarms f
A new alarm class with m
Examples of how to use alarm classes
pper tolerance range" alarm has "Warnings" alarm class. The alarm is displayed with a white background. The alarm does not have to be acknowledged.
Using
Use theproject:
Predefined alarm classes
sses
cur in a plant. These are all of different im
o this alarm class.
andatory acknowledgment is generated in WinCC.
The "Speed of fan 1 in u
The "Speed of fan 2 has exceeded upper warning range" alarm is assigned to the "Errors" alarm class. The alarm is displayed with a red background and flashes at high frequency in runtime. The alarm is displayed until the user acknowledges it.
alarm classes
following alarm classes to define the acknowledgment model and display of alarms for your
104
dit them only to a limited extent. Predefined under "HMI alarms > Alarm classes".
The following alarm classes already created in WinCC for every HMI device:
"Warnings"
The "Warnings" alarm class is designed to show irregular statuses and routines pr Users c dge a o l
"Errors"
The "Errors" alarm class is inte show critical erous states or limit violations in the process. The u acknowledg rms from this alarm
Alarm classes for system-defined alarm
"System"
ice and the PLCs.
vents"
The "Diagnosis Events" alarm class contains alarms that display states and events in SIMATIC S7 controllers. Users do not acknowledge alarms from this alarm class.
ayed, and define an acknowledgment model for alarms of this alarm class. The possible number of custom alarm classes depends on which runtime is used in your project.
Common alarm classes
Common alarm classes are displayed under "Shared data > Alarm classes" in the project tree and can be used for the alarms of an HMI device. Common alarm classes originate in the alarm configuration of STEP 7. If needed, you can create additional common alarm classes in WinCC.
You cannot delete predefined alarm classes and ealarm classes have been created for each HMI device
Alarm classes for user-defined alarms
in the ocess. do not a knowle larms fr m this a arm class.
nded toser must
or dange ala
class.
s
The "System" alarm class contains alarms that display states of the HMI dev
"Diagnosis E
Custom alarm classes
You can create new alarm classes under "HMI alarms > Alarm classes", configure how you want the alarms to be displ
105
onents and properties
e components of alarms in WinCC. The following table shows the basic components of
it value
Alarm comp
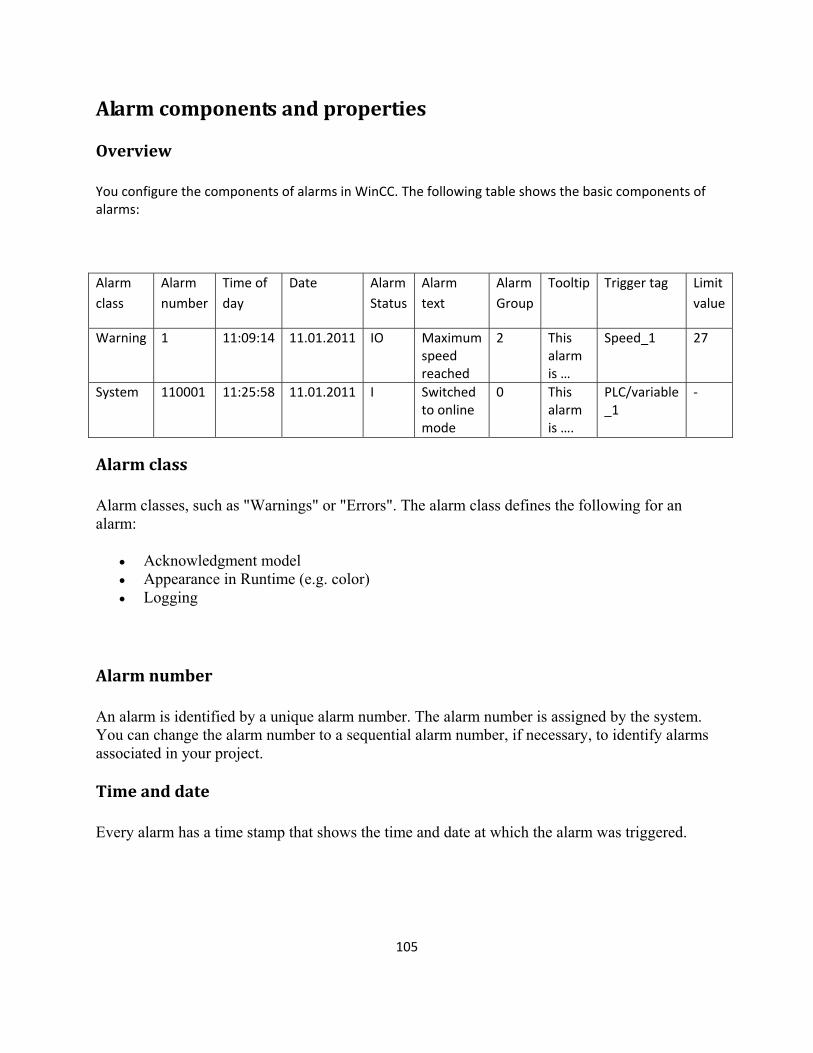
Overview
You configure thalarms:
Alarm class
Alarm number
Time of day
Date Alarm Status
Alarm text
Alarm Group
Tooltip Trigger tag Lim
Warning 1 11:09:14 11.01.2011 IO Maximum speed reached
2 This alarm is …
Speed_1 27
System 110001 11:25:58 11.01.2011 I Switched to online mode
0 This alarm is ….
PLC/variable _1
-
Alarm class
Alarm classes, such as "Warnings" or "Errors". The alarm class defines the following for an
e (e.g. color)
Alarm number
An alarm is identified by a unique alarm number. The alarm number is assigned by the system. r to a sequential alarm number, if necessary, to identify alarms
associated in your project.
Time and date
Every alarm has a tim e and date at which the alarm was triggered.
alarm:
Acknowledgment model Appearance in Runtim Logging
You can change the alarm numbe
e stamp that shows the tim
106
Al
An alarm has the events "Incoming," "Outgoing," "Acknowledge." For each event, a new alarm is output with the current status of the alarm.
Alarm text
The alarm t
The alarm text can contain output fields for current values. The values you can insert depend on the Run
Alarm group
The alarm group bundles individual alarms.
ch alarm; the user can display this tooltip in Runtime.
Trigge
Eac al larm is output when this trigger tag meets the def d or it exceeds a limit.
Limit
Ana g violations. Depending on the configuration, WinCC outputs the analog alarm as soon as the trigger tag exceeds or undershoots the limit value.
1. Edit and create alarm classes
You use the alarm class to define how an alarm will be displayed in runtime and to define the acknowledgment model for it.
2. Creating tags in the "HMI tags" editor
arm status
tex describes the cause of the alarm.
time in use. The value is retained at the time at which the alarm status changes.
Tooltip
You can configure a separate tooltip for ea
r tag
h arm is assigned a tag as trigger. The aine condition, e.g. when its state changes
value
lo alarms indicate limit
Overview of alarm configuration tasks
Steps to configure alarms
Configuring alarms in WinCC involves the following steps:
107
your project. o You create range values for the tags.
operties. o You can also assign system functions or scripts to the alarm events.
of configured alarms
e an alarm view or an alarm window in the "Screens"
Additional configuration tasks
Add n configuring al ements of your project:
Activating and editing system eve
MI alarms" editor. On completion of the import, you can edit the system events.
Activating and editing controller alarms
to be displayed on your HMI device in the alarm settings.
Creating alarm groups
Assign the alarms of your project to alarm groups based on their relation, e.g. by error cause (e.g. "power failure"), or by error source (e.g. "Motor 1").
Configuring Loop-In-Alarm
Configure a Loop-In-Alarm in order to change to a screen that contains information about an incoming alarm.
o Configure the tags for
1. Creating tags in the "HMI alarms " editor o Create custom alarms and assign these the tag to be monitored, alarm classes, alarm
groups, and other pr
2. Output
To output configured alarms, configureditor.
itio al tasks may be necessary for arms, depending on the requir
nts
You can import system events when you initially open the "System events" tab in the "H
For integrated operation of a project in STEP 7, specify the controller alarms
108
Creating alarm classes
Introduction
Create alarm classes in the "Alarm classes" tab of the "HMI alarms" editor. Some default alarm classes are already created for every project. You can create additional custom alarm classes. You can configure up to 256 alarm classes per project.
Procedure
To create an alarm class, proceed as follows:
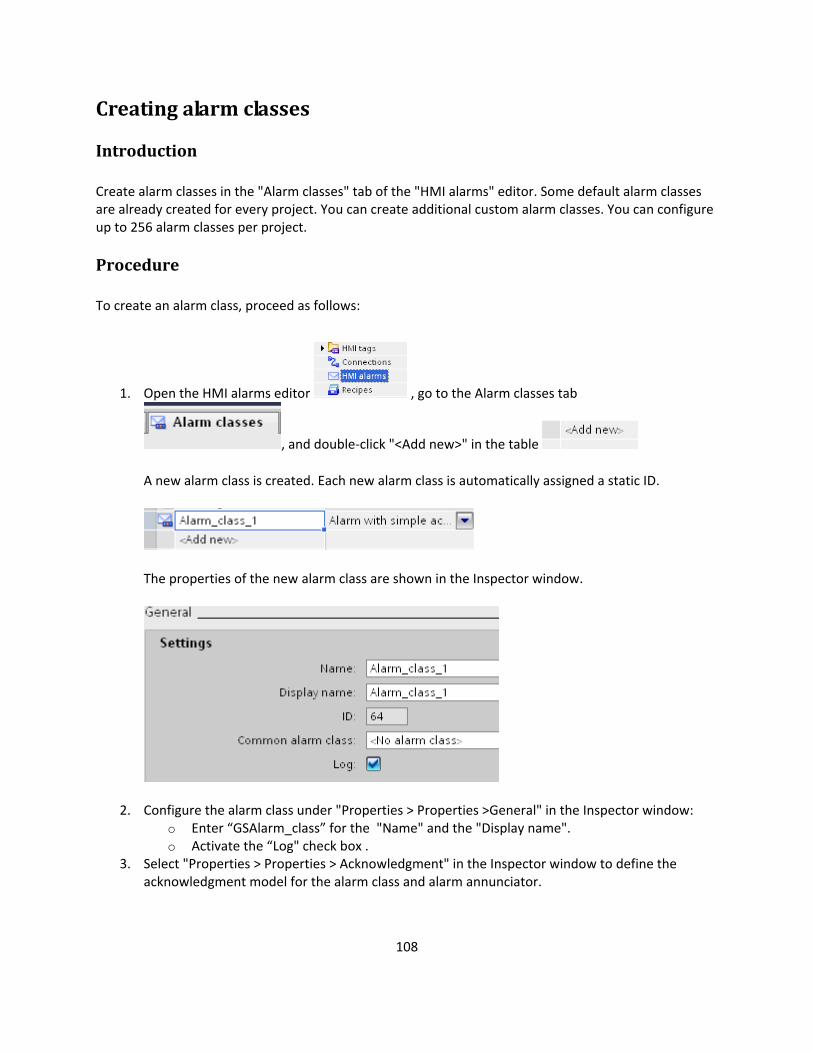
1. Open the HMI alarms editor , go to the Alarm classes tab
, and double-click "<Add new>" in the table
A new alarm class is created. Each new alarm class is automatically assigned a static ID.
The properties of the new alarm class are shown in the Inspec or window. t
2. Configure the alarm class under "Properties > Properties >General" in the Inspector window: o Enter “GSAlarm_class” for the "Name" and the "Display name". o Activate the “Log" check box .
3. Select "Properties > Properties > Acknowledgment" in the Inspector window to define the acknowledgment model for the alarm class and alarm annunciator.
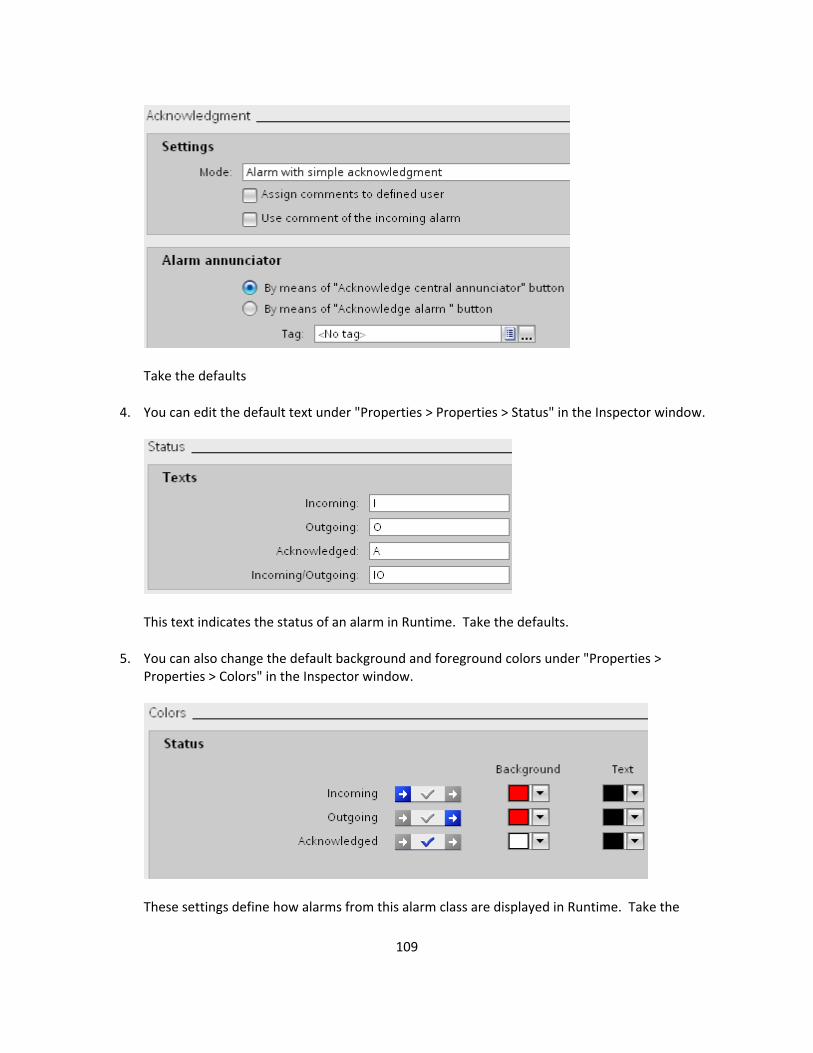
Take the defaults
4. You can edit the default text under "Properties > Properties > Status" in the Inspector window.
This text indicates the status of an alarm in Runtime. Take the defaults.
5. You can also change the default background and foreground colors under "Properties > Properties > Colors" in the Inspector window.
These settings define how alarms from this alarm class are displayed in Runtime. Take the
109
110
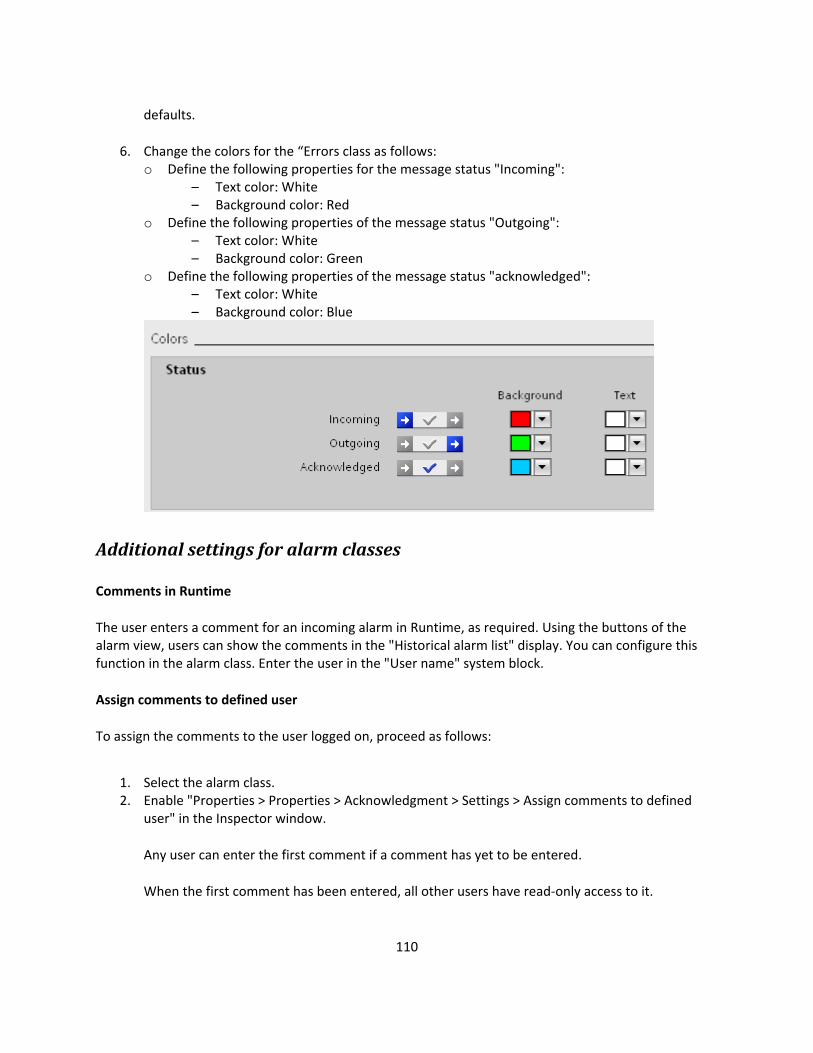
– Background color: Red g properties of the message status "Outgoing":
een o Define the following properties of the message status "acknowledged":
– Text color: White
defaults.
6. Change the colors for the “Errors class as follows: o Define the following properties for the message status "Incoming":
– Text color: White
o Define the followin– Text color: White – Background color: Gr
– Background color: Blue
Additional settings for alarm classes
Comments in Runtime
The use quired. Using the buttons of the alarm view, users can show the comments in the "Historical alarm list" display. You can configure this func n Enter the user in the "User name" system block.
Assign c
d on, proceed as follows:
Any user can enter the first comment if a comment has yet to be entered.
When the first comment has been entered, all other users have read-only access to it.
r enters a comment for an incoming alarm in Runtime, as re
tio in the alarm class.
omments to defined user
To assign the comments to the user logge
1. Select the alarm class. 2. Enable "Properties > Properties > Acknowledgment > Settings > Assign comments to defined
user" in the Inspector window.
111
atus of an alarm changes, for example, from "incoming" to "acknowledged" status, the alarm is output once again with another status. The user only assigns comments to one incoming alarm.
ed as follows:
2. Enable "Properties > Properties > Acknowledgment > Settings > Use comment of the incoming
Alarm Text Block Basics
Introduction
An alarm text blocks. Each alarm text block corresponds to one column in the table in
There a
m blocks contain system data, such as date, time, alarm number and status.
User text blocks contain the alarm text with the description of the cause of a fault and additional
Parameter blocks are used to link the alarms to process values, such as current fill levels, atures or speeds. You can configure up to 10 parameter blocks per alarm.
You enable and edit the alarm text blocks on the "Alarm text blocks" tab. To display alarm text blocks in ew, select the alarm text blocks to be displayed and logged from the enabled alarm text
blocks in the "Screens" editor.
Use comment of the incoming alarm
Whenever the st
To include comments for alarm output with the new status, proce
1. Select the alarm class.
alarm" in the Inspector window.
display is made up of alarm the alarm view.
re three groups of alarm text blocks:
System blocks
Syste
User text blocks
text with information, for example, the location of a fault.
Parameter blocks
temper
Configuring Alarm Text Blocks
an alarm vi
112
:
racters
Set the length of the parameter block to 32 characters to ensure that all characters will be
Note
The status texts of the alarms are displayed in the "Status" system block. This system block must be configured so that it is long enough to display the status texts in full.
Flashing
An alarm to be acknowledged or single alarm text blocks can be displayed as flashing in Runtime. They have to meet the following requirements:
The "Flashing" property must be enabled in the alarm class of the alarm. You configure this tab.
The "Flashing" option is enabled in the "Alarm text block" area under "General" in the Inspector window for alarm text blocks that should flash.
Alignment
On the "Alarjustified
ormat
For t
Properties of Alarm Text Blocks
Text length
The maximum text length of a user text block is 255 characters.
The text length of a parameter block can be configured as follows
Controller alarms: up to 32 cha
displayed.
Other alarm procedures: up to 255 characters
"Status" system block
property on the "Alarm classes"
m text blocks" tab, you define whether the alarm text block should be right-justified, left- or centered in an alarm view column.
F
cer ain alarm text blocks, you can choose between different display formats.
113
Configuring Alarm Text Blocks
Introduction
An alarm is made up of configured alarm text blocks. You enable the alarm text blocks for an HMI device on t text blocks for each alarm view, which logged.
Activating alarm text blocks
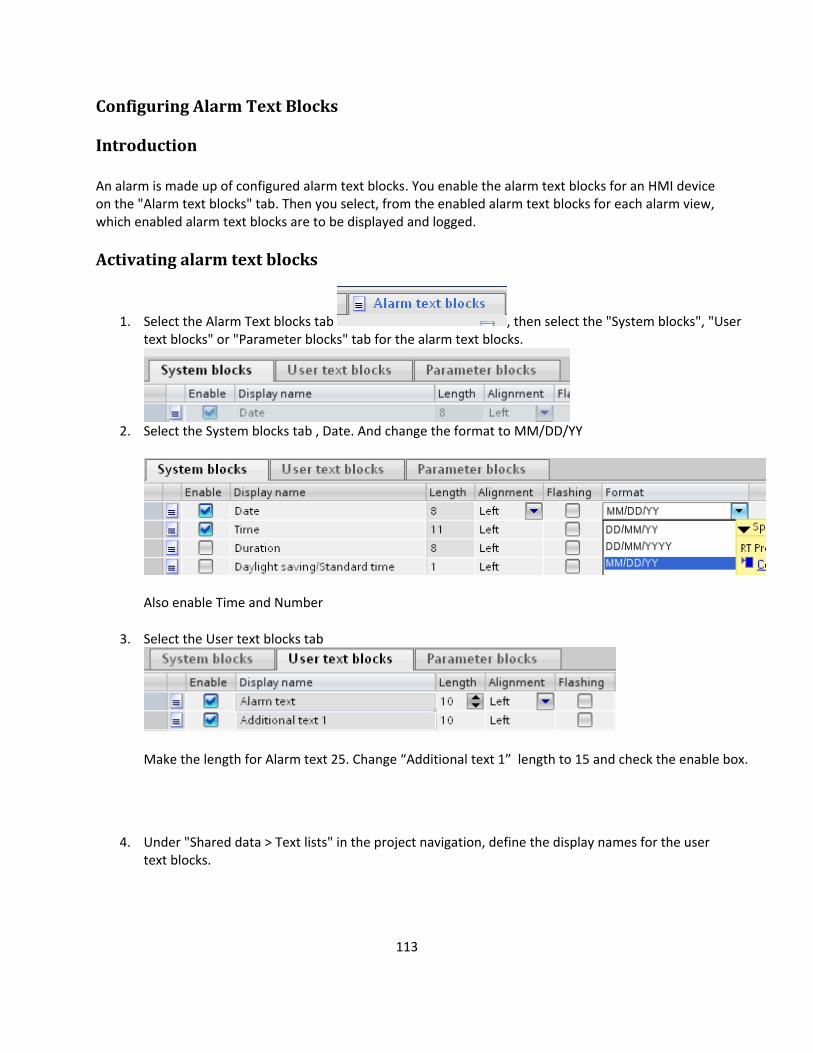
1. Select the Alarm Text blocks tab
he "Alarm text blocks" tab. Then you select, from the enabled alarm enabled alarm text blocks are to be displayed and
, then select the "System blocks", "User text blocks" or "Parameter blocks " tab for the alarm text blocks.
Select the System blocks tab , Date. And change the format to MM/DD/YY 2.
Also enable Time and Number
3. Select the User text blocks tab
Make the length for Alarm text 25. Change “Additional text 1” length to 15 and check the enable box.
.
4. Under "Shared data > Text lists" in the project navigation, define the display names for the user text blocks
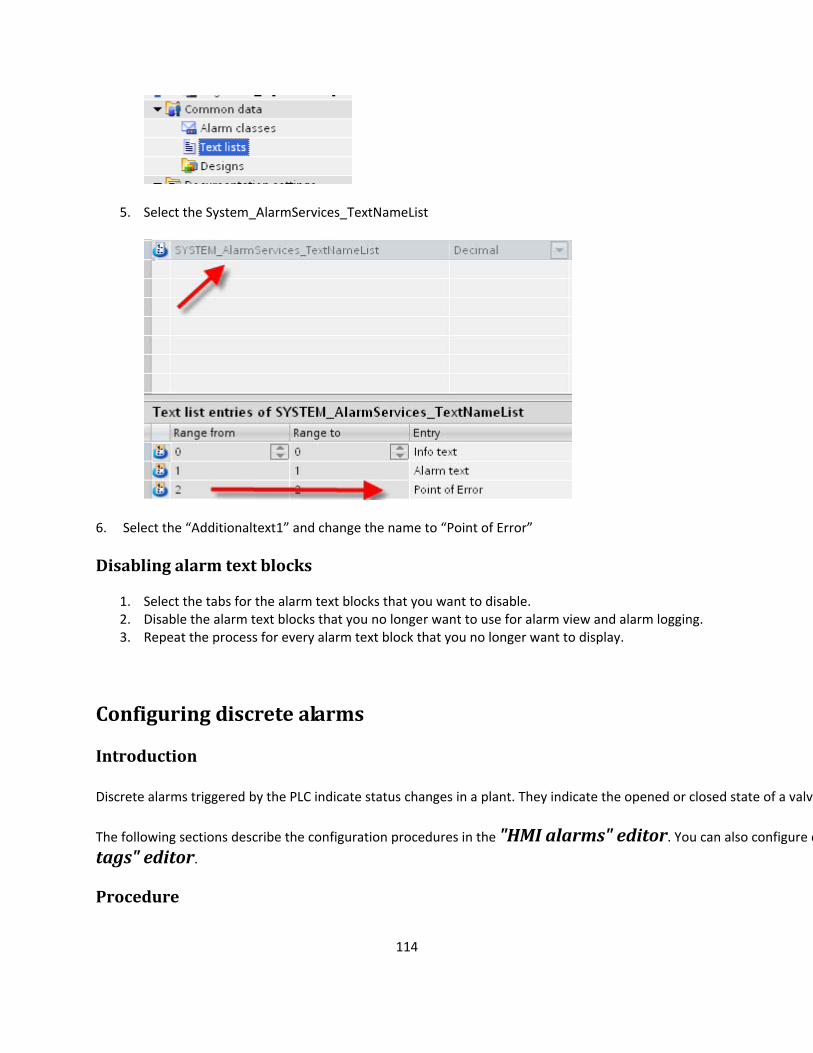
5. Select the System_AlarmServices_TextNameList
6. Select the “Additionaltext1” and change the name to “Point of Error”
Disa
1. Selec2. Disab h3. Repe th
Configuring discrete alarms
Introduction
Discrete alarms triggered by the PLC indicate status changes in a plant. They indicate the opened or closed state of a valv
bling alarm text blocks
t the tabs for the alarm text blocks that you want to disable. le t e alarm text blocks that you no longer want to use for alarm view and alarm logging. at e process for every alarm text block that you no longer want to display.
e
The following sections describe the configuration procedures in the "HMI alarms" editor. You can also configure d
tags" editor.
Procedure
114
115
To config
1.
ure a discrete alarm, proceed as follows:
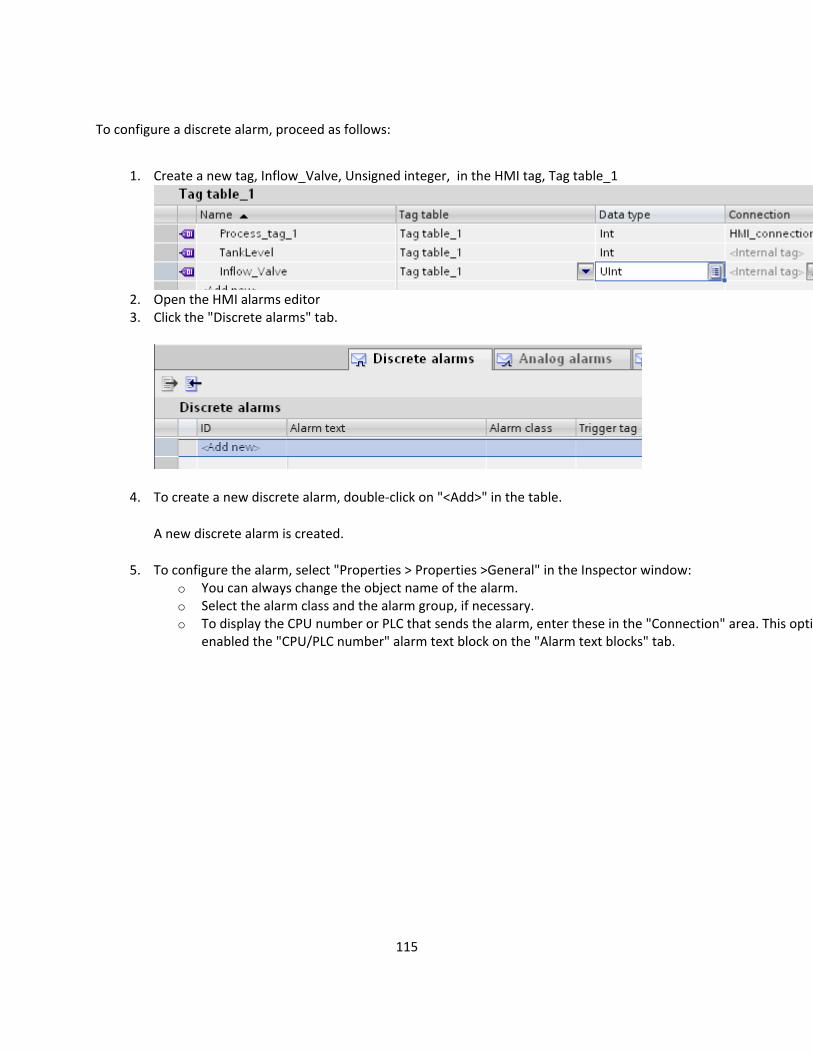
Create a new tag, Inflow_Valve, Unsigned integer, in the HMI tag, Tag table_1
2. 3.
Open the HMI alarms editor Click the "Discrete alarms" tab.
4. To create a new discrete alarm, double-click on "<Add>" in the table.
ated.
sary. e alarm, enter these in the "Connection" area. This opti
A new discrete alarm is cre
5. To configure the alarm, select "Properties > Properties >General" in the Inspector window: You cao n always change the object name of the alarm. Select the alarm class and the alarm group, if neceso To ao display the CPU number or PLC th t sends th o
enabled the "CPU/PLC number" alarm text block on the "Alarm text blocks" tab.
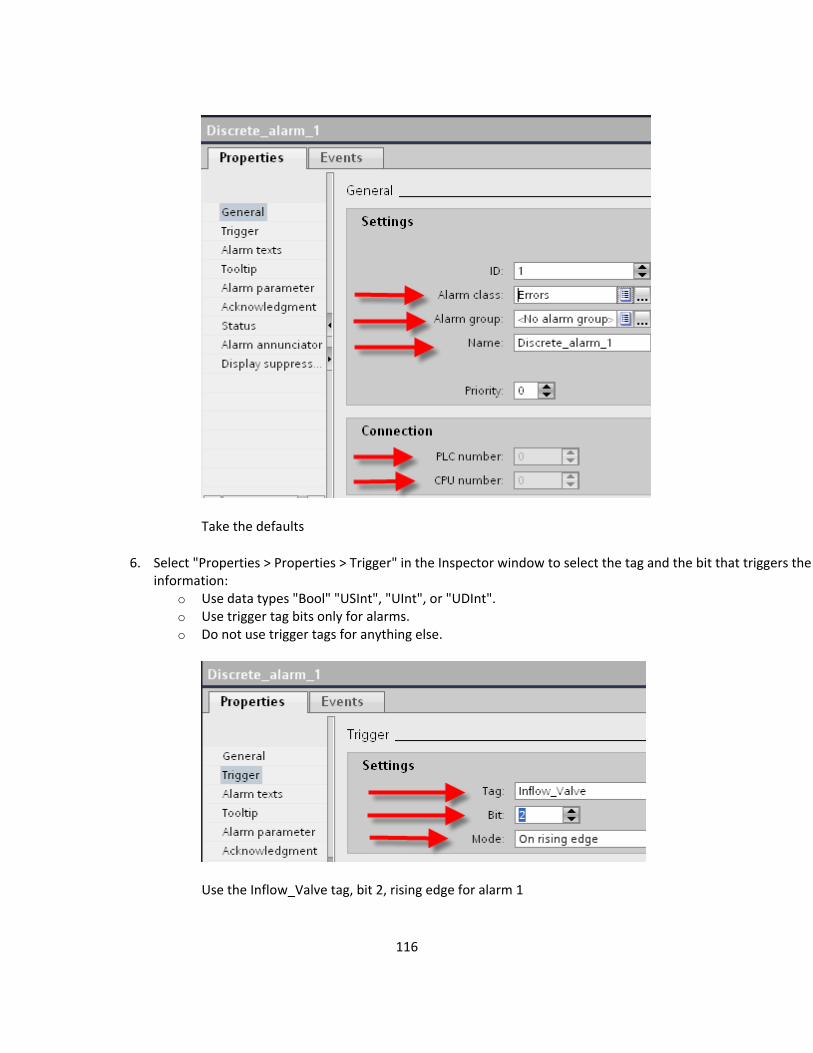
6. Select "Properties > Properties > Trigger" in the Inspector window to select the tag and the bit that triggers the information:
o o o
Take the defaults
Use data types "Bool" "USInt", "UInt", or "UDInt". Use trigger tag bits only for alarms. Do not use trigger tags for anything else.
t 2, rising edge for alarm 1 Use the Inflow_Valve tag, bi
116
117
object list and change its pro t
Not
The trigger bit is not incremented automatically if you generate a discrete alarm by copying an alarm text to a new table row. Avoid any redundant use of the trigger bit.
Notice
Note the method used to count bits in the utilized PLC when specifying the bit. For more information, refer to the "Communication" section in the PLC Online Help.
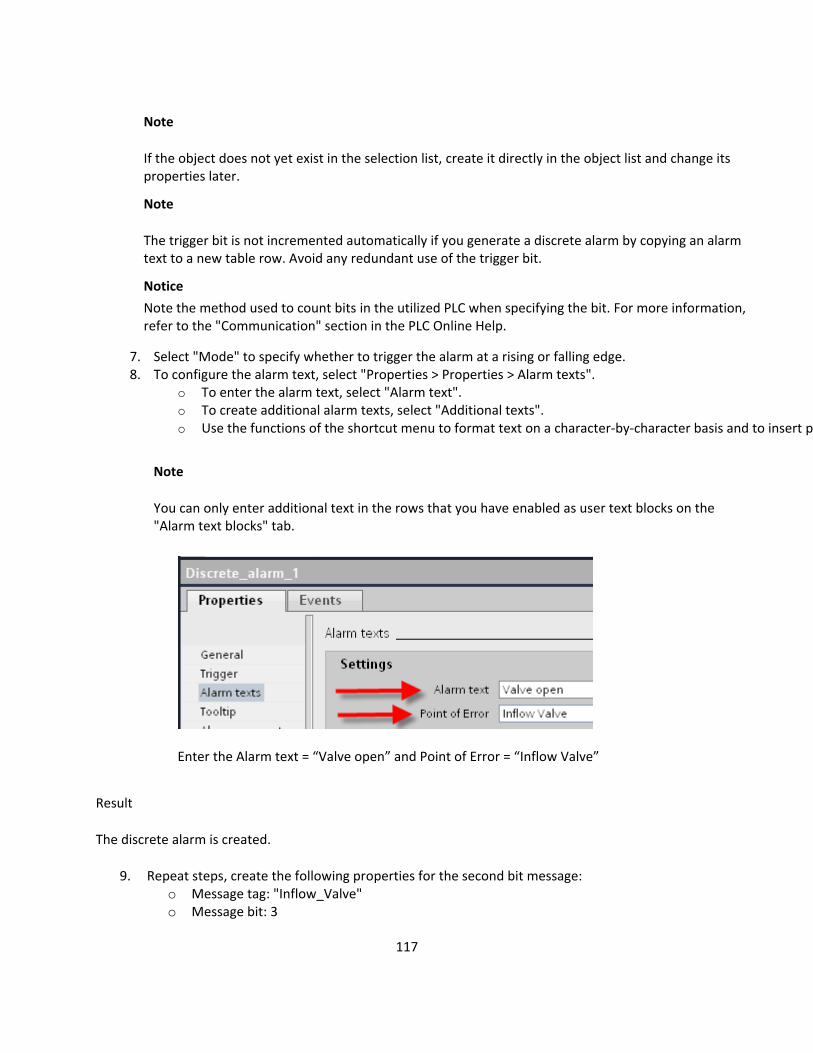
7. Select "Mode" to specify whether to trigger the alarm at a rising or falling edge. 8. To configure the alarm text, select "Properties > Properties > Alarm texts".
o To enter the alarm text, select "Alarm text". o To create additional alarm texts, select "Additional texts".
shortcut menu to format text on a character-by-character basis and to insert p
er text blocks on the
Note
If th object does not yet exist in the selection list, create it directly in thee per ies later.
e
o Use the functions of the
Note
You can only enter additional text in the rows that you have enabled as us"Alarm text blocks" tab.
ror = “Inflow Valve”
Result
The discrete alarm is created.
9. Repeat steps, create the following properties for the second bit message: o Message tag: "Inflow_Valve" o Message bit: 3
Enter the Alarm text = “Valve open” and Point of Er
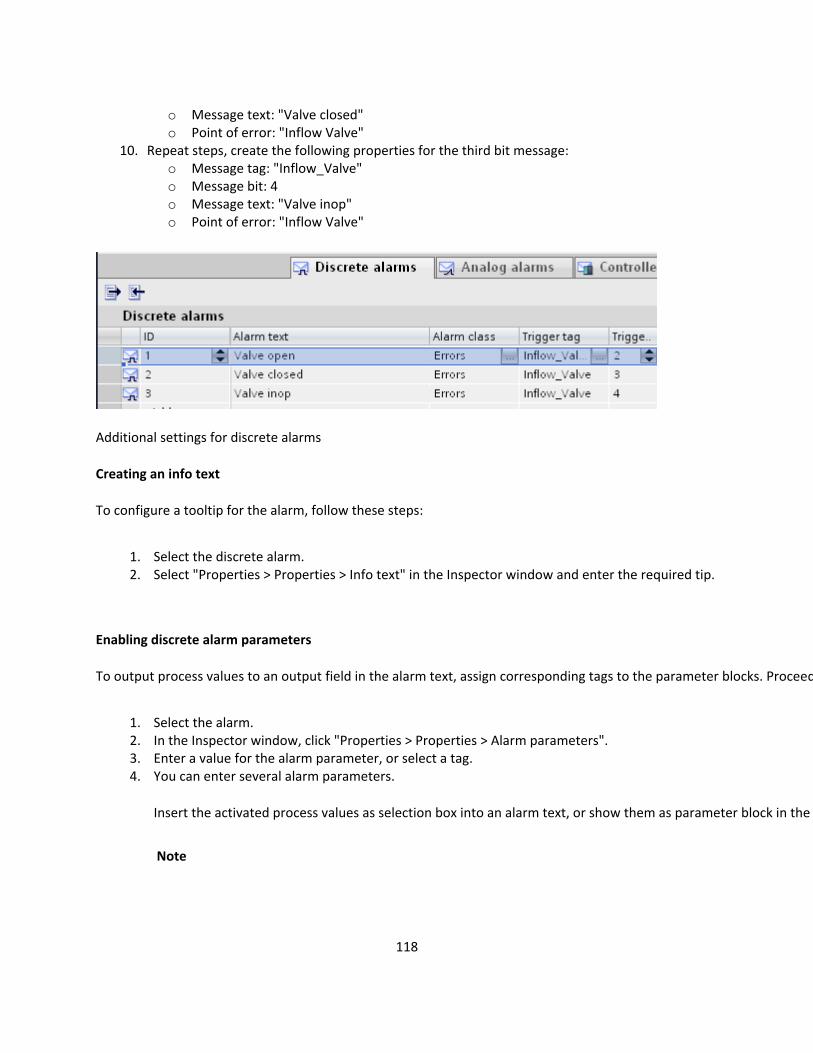
118
o Message text: "Valve closed" Point of error: "Inflow Valve"
10. R Message tag: "Inflow_Valve"
o Message text: "Valve inop" low Valve"
oepeat steps, create the following properties for the third bit message: oo Message bit: 4
o Point of error: "Inf
Additional settings for discrete alarms
Creating an info text
To co
1. Select the discrete alarm. fo text" in the Inspector window and enter the required tip.
Enabling discrete alarm parameters
nfigure a tooltip for the alarm, follow these steps:
2. Select "Properties > Properties > In
To output process values to an output field in the alarm text, assign corresponding tags to the parameter blocks. Proceed
1. Select the alarm. > Alarm parameters".
3. Enter a value for the alarm parameter, or select a tag. 4. You can enter several alarm parameters.
t, or show them as parameter block in the
Note
2. In the Inspector window, click "Properties > Properties
Insert the activated process values as selection box into an alarm tex
119
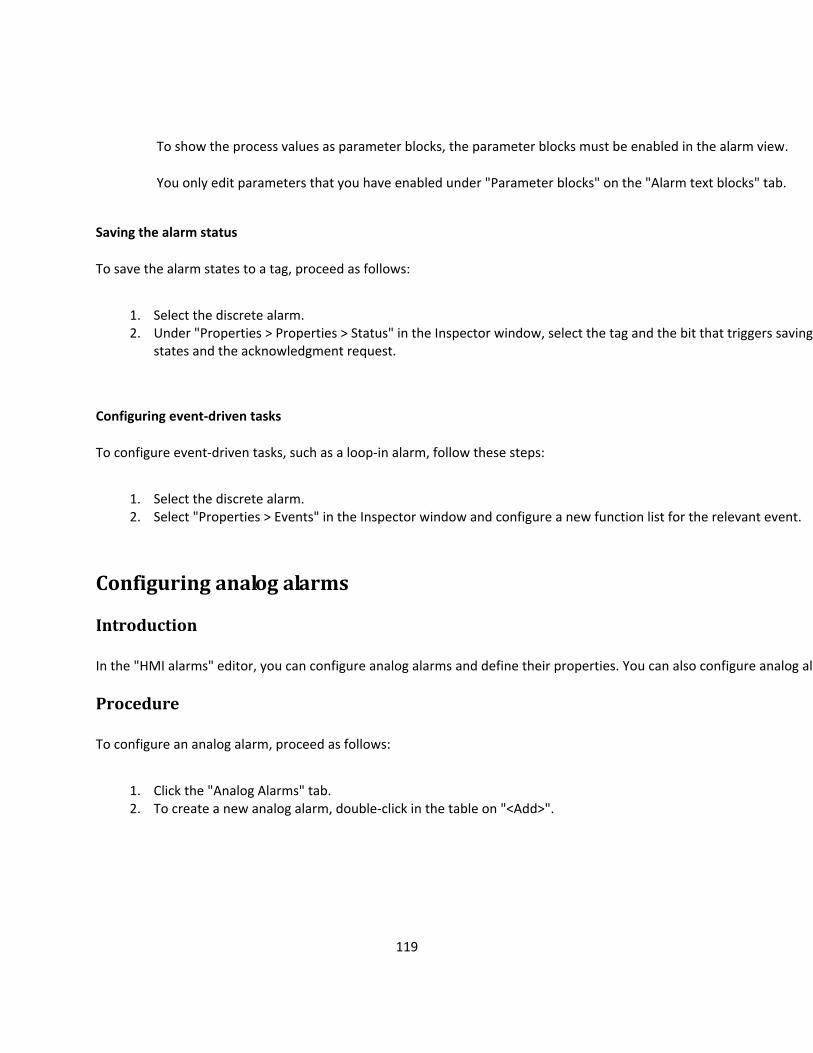
To show the process values as parameter blocks, the parameter blocks must be enabled in the alarm view.
You only edit parameters that you have enabled under "Parameter blocks" on the "Alarm text blocks" tab.
Saving the alarm status
To save th as follows:
2. Und " w, select the tag and the bit that triggers saving stat a
Configuri tasks
To configure event-driven tasks, such as a loop-in alarm, follow these steps:
1. Select the discrete alarm. 2. Select "Properties > Events" in the Inspector window and configure a new function list for the relevant event.
Configuring analog alarms
Introduction
In the es. You can also configure analog al
e alarm states to a tag, proceed
1. Select the discrete alarm. er Properties > Properties > Status" in the Inspector windoes nd the acknowledgment request.
ng event-driven
"HMI alarms" editor, you can configure analog alarms and define their properti a
Procedure
To configure an analog alarm, proceed as follows:
1. Click the "Analog Alarms" tab. 2.
To create a new analog alarm, double-click in the table on "<Add>".
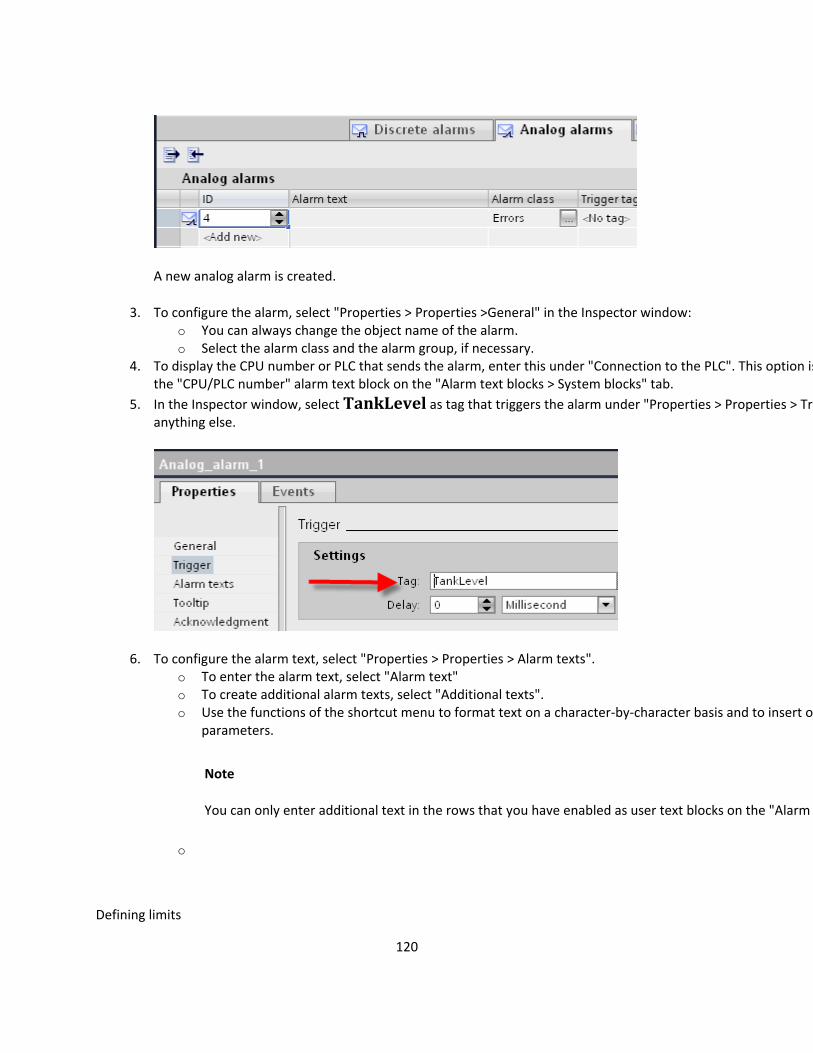
A new analog alarm is created.
3. To configure the alarm, select "Properties > Properties >General" in the Inspector window: nge the object name of the alarm.
o Select the alarm class and the alarm group, if necessary. 4.
o You can always cha
To d la larmisp y the CPU number or PLC that sends the a , enter this under "Connection to the PLC". This option isthe "CPU/PLC number" alarm text block on the "Alarm text blocks > System bloIn the Inspector window, select TankLevel as tag that triggers the alarm
cks" tab. 5. under "Properties > Properties > Tri
anything else.
6. To c f > Alarm texts". rm text, select "Alarm text"
ct "Additional texts". ter-by-character basis and to insert o
You can only enter additional text in the rows that you have enabled as user text blocks on the "Alarm
Defining limits
on igure the alarm text, select "Properties > Properties o To enter the alao To create additional alarm texts, seleo Use the functions of the shortcut menu to format text on a charac
parameters.
Note
o
120
121
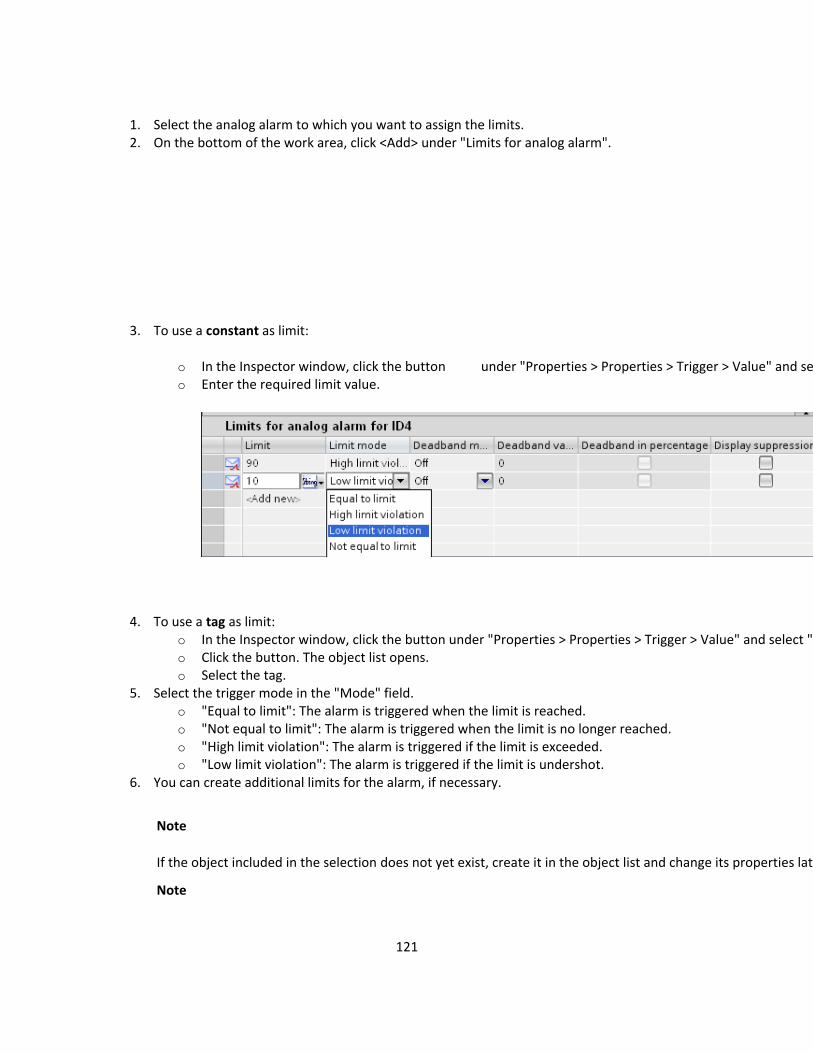
1. Select the analog alarm to which you want to assign the limits. 2.
o
On the bottom of the work area, click <Add> under "Limits for analog alarm".
3. To use a constant as limit:
In the Inspector window, click the button under "Properties > Properties > Trigger > Value" and sed limit value. o Enter the require
4. To use a tag as limit: o In the Inspector window, click the button under "Properties > Properties > Trigger > Value" and select "o Click the button. The object list opens. o Select the tag.
5. Select the trigger mode in the "Mode" field. ": The alarm is triggered when the limit is reached.
o "Not equal to limit": The alarm is triggered when the limit is no longer reached. ggered if the limit is exceeded.
o "Low limit violation": The alarm is triggered if the limit is undershot. mits for the alarm, if necessary.
If the object included in the selection does not yet exist, create it in the object list and change its properties lat
o "Equal to limit
o "High limit violation": The alarm is tri
6. You can create additional li
Note
e
Note
122
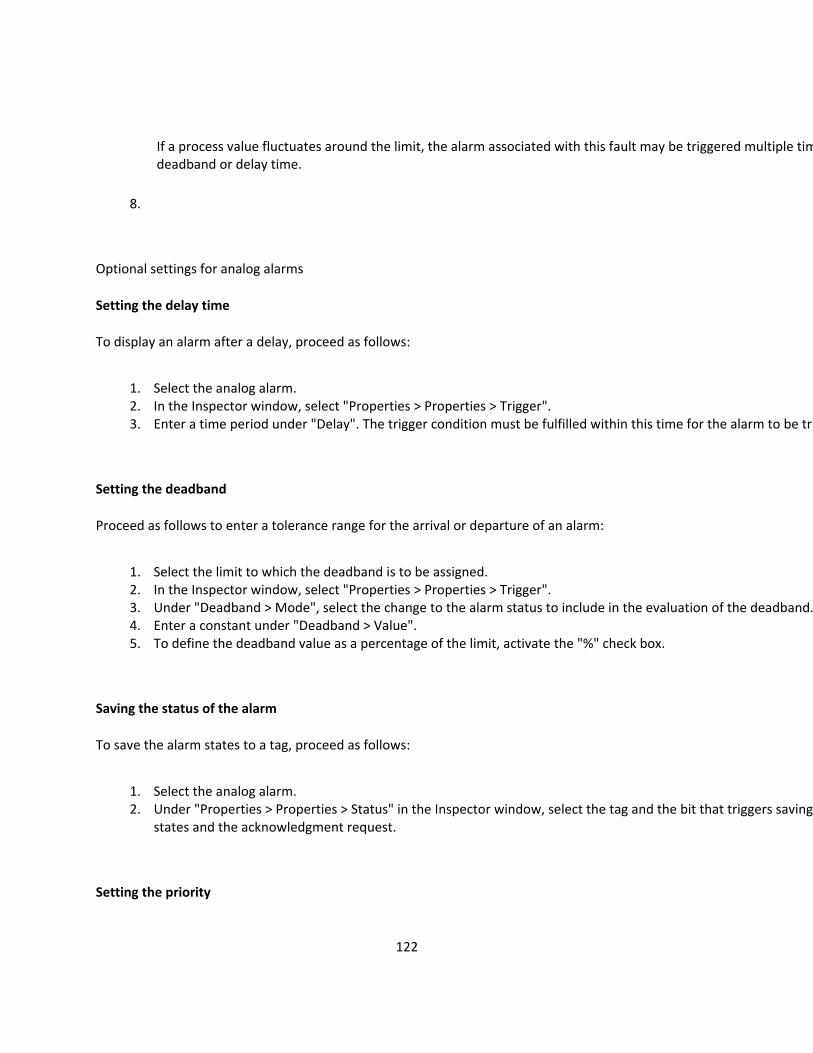
If a process value fluctuates around the limit, the alarm associated with this fault may be triggered multiple timdeadband or delay time.
8.
alog alarms
Settin h
To display an alarm after a delay, proceed as follows:
. 2. In the Inspector window, select "Properties > Properties > Trigger".
lfilled within this time for the alarm to be tr
Optional settings for an
g t e delay time
1. Select the analog alarm
3. Enter a time period under "Delay". The trigger condition must be fu i
Settin
Proceed as follows to enter a tolerance range for the arrival or departure of an alarm:
1. Select the limit to which the deadband is to be assigned. 2. In the Inspector window, select "Properties > Properties > Trigger". 3. Under "Deadband > Mode", select the change to the alarm status to include in the evaluation of the deadband.4. Enter a constant under "Deadband > Value". 5. To define the deadband value as a percentage of the limit, activate the "%" check box.
aving the status of the alarm
e analog alarm. rties > Properties > Status" in the Inspector window, select the tag and the bit that triggers saving
Setting
g the deadband
S
To save the alarm states to a tag, proceed as follows:
1. Select th2. Under "Prope
states and the acknowledgment request.
the priority
123
To set the p ri ows:
1. Select a value between 0 and 16 under "Properties > Properties > General > Priority" in the Inspector window, .
If you filter the alarm view by priority, the alarm with priority 0 will appear at the top.
Creating an info text
1. Select the analog alarm.
Configuring event-driven tasks
To configure event-driven tasks, such as a loop-in alarm, follow these steps:
1. Select the analog alarm. 2. Select "Properties > Events" in the Inspector window and configure a new function list for the
relevant event.
Parameter output in the analog alarm
Introduction
To display system or alarm parameters, insert an appropriate output field in the analog alarm.
"Limit", "Deadband" or "Current Value" can be selected as alarm parameters. The following system blocks can be selected as system parameters:
o User Name
rio ty, proceed as foll
the analog alarm. 2. Select
2. Select "Properties > Properties > Tooltip" in the Inspector window and enter a text.
124
o Computer name o Comments o Application Name
Procedure
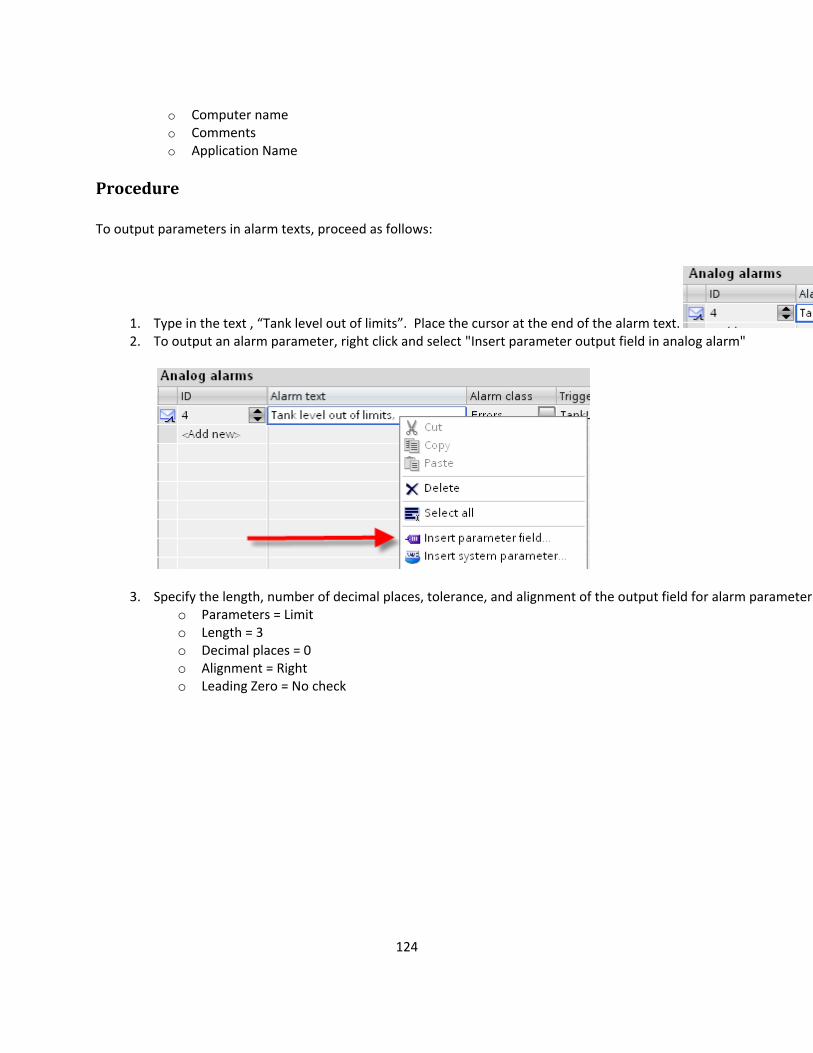
To output parameters in alarm texts, proceed as follows:
1. Type in the text , “Tank level out of limits”. Place the cursor at the end of the alarm text. 2. meter output field in analog alarm" To output an alarm parameter, right click and select "Insert para
output field for alarm parameter3. Specify the length, number of decimal places, tolerance, and alignment of the so Parameters = Limit o Length = 3 o Decimal places = 0
Alignment = Right o Leading Zero = No check
o
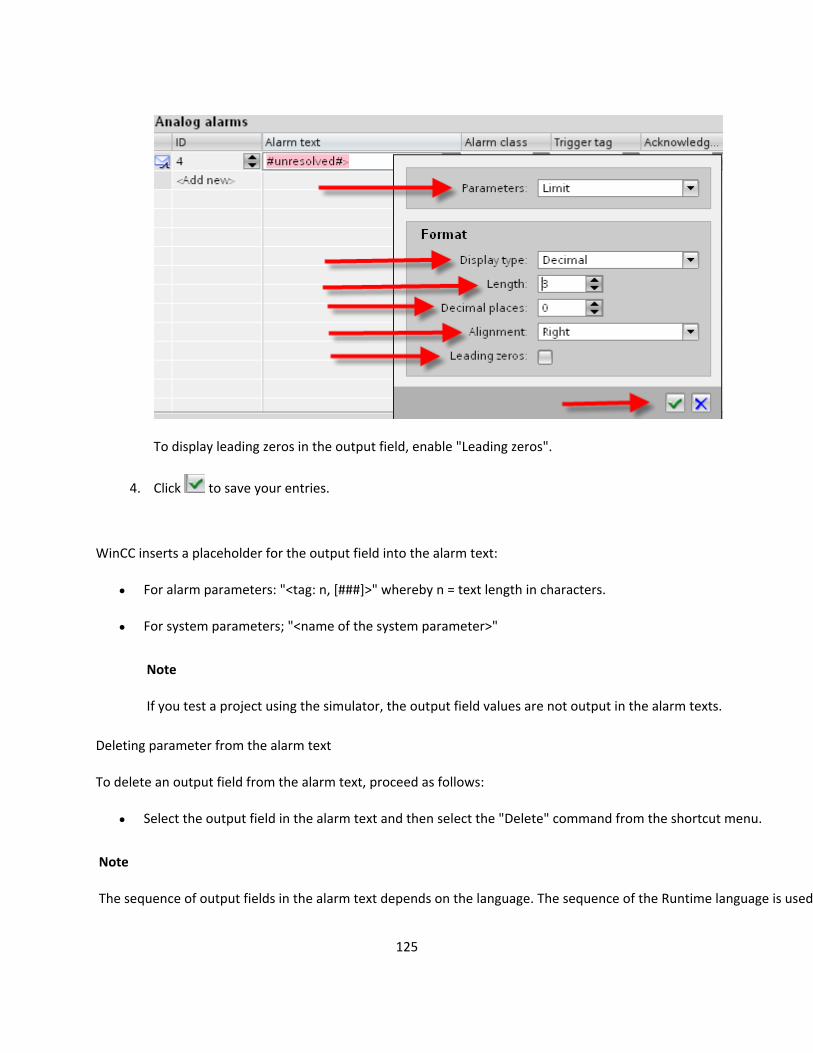
To display leading zeros in the output field, enable "Leading zeros".
4. Click to save your entries.
inCC inserts a placeholder for the output field into the alarm text:
For alarm parameters: "<tag: n, [###]>" whereby n = text length in characters.
For system parameters; "<name of the system parameter>"
Deleting parameter from the alarm text
put field from the alarm text, proceed as follows:
nd then select the "Delete" command from the shortcut menu.
Note
The sequence of output fields in the alarm text depends on the language. The sequence of the Runtime language is used
W
Note
If you test a project using the simulator, the output field values are not output in the alarm texts.
To delete an out
Select the output field in the alarm text a
125
126
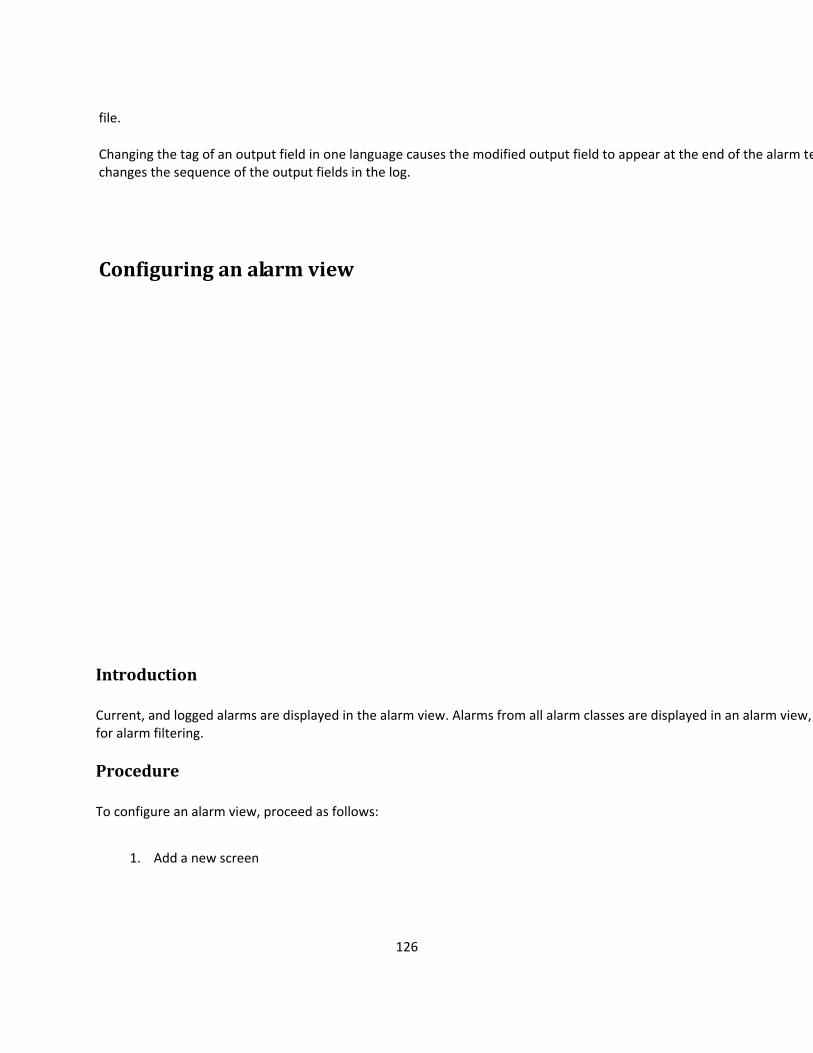
file.
Changing the tag of an output field in one language causes the modified output field to appear at the end of the alarm techanges the sequence of the output fields in the log.
Configuring an alarm view
Introduction
Current, and logged alarms are displayed in the alarm view. Alarms from all alarm classes are displayed in an alarm view, for alarm filtering.
Procedure
To configure an alarm view, proceed as follows:
1. Add a new screen
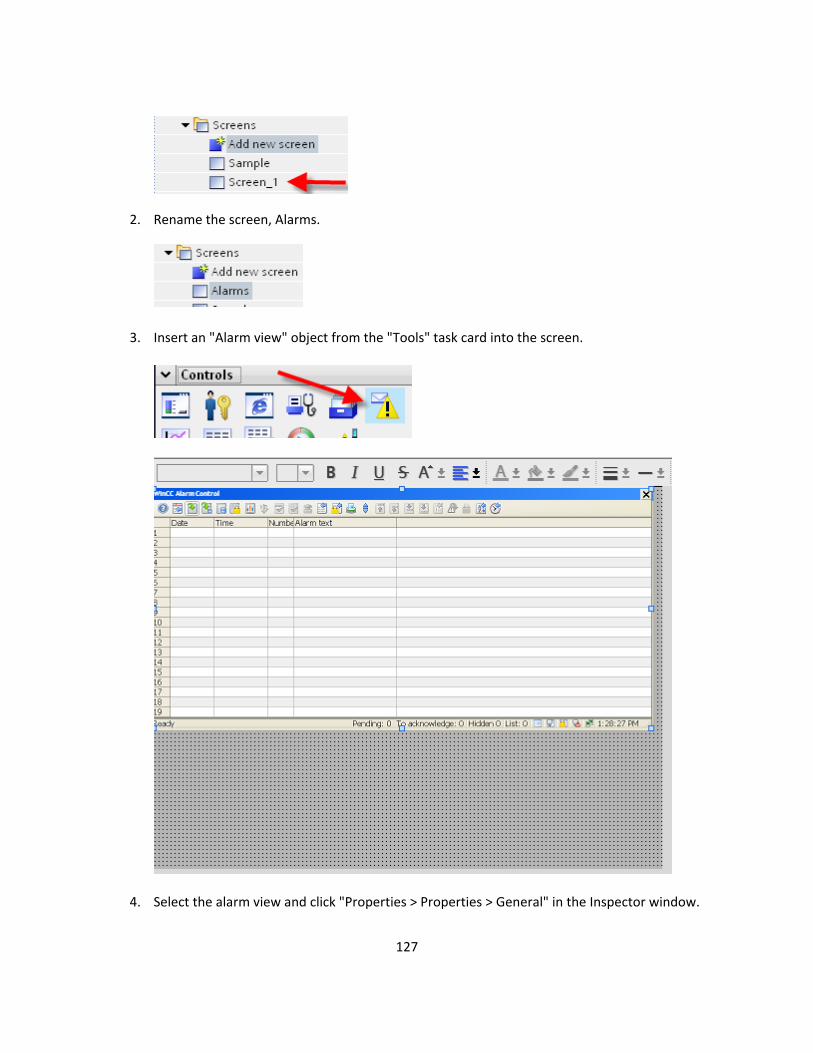
2. Rename the screen, Alarms.
Insert an "Alarm view" object from the 3. "Tools" task card into the screen.
4. Select the alarm view and click "Properties > Properties > General" in the Inspector window.
127
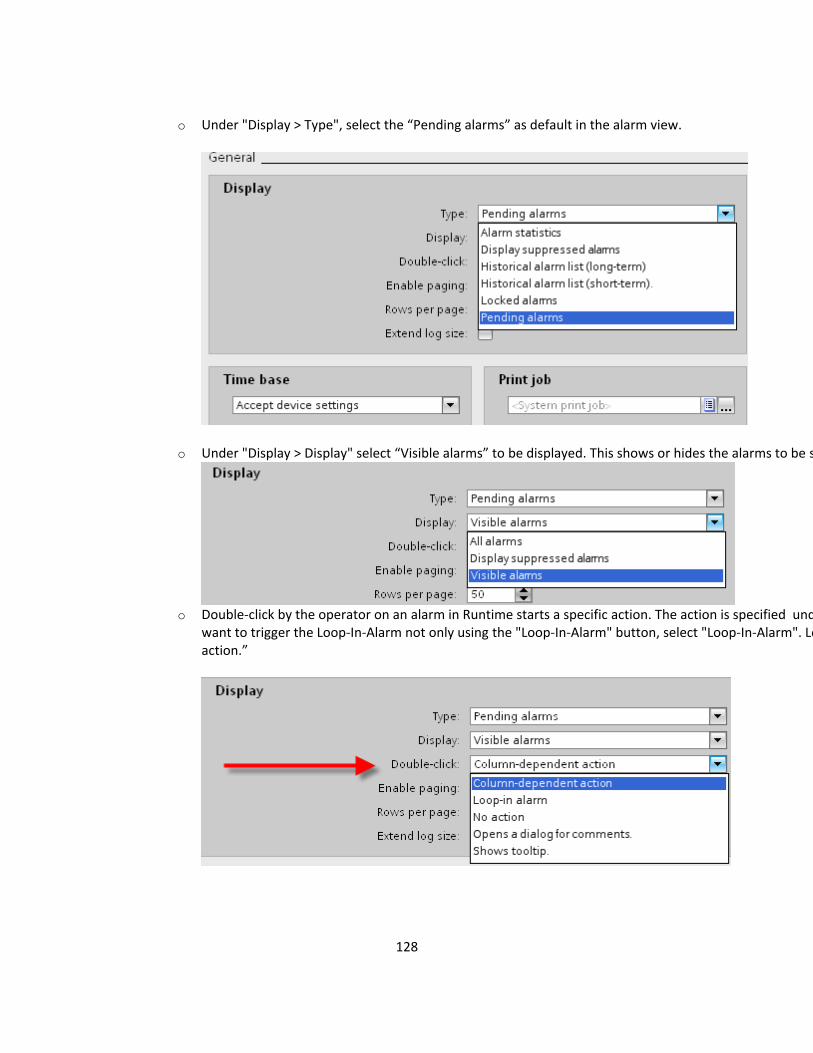
o Under "Display > Type", select the “Pending alarms” as default in the alarm view.
o arms to be Under "Display > Display" select “Visible alarms” to be displayed. This shows or hides the al s
o unDouble-click by the operator on an alarm in Runtime starts a specific action. The action is specified d
want to trigger the Loop-In-Alarm not only using the "Loop-In-Alarm" button, select "Loop-In-Alarm". Leaction.”
128
129
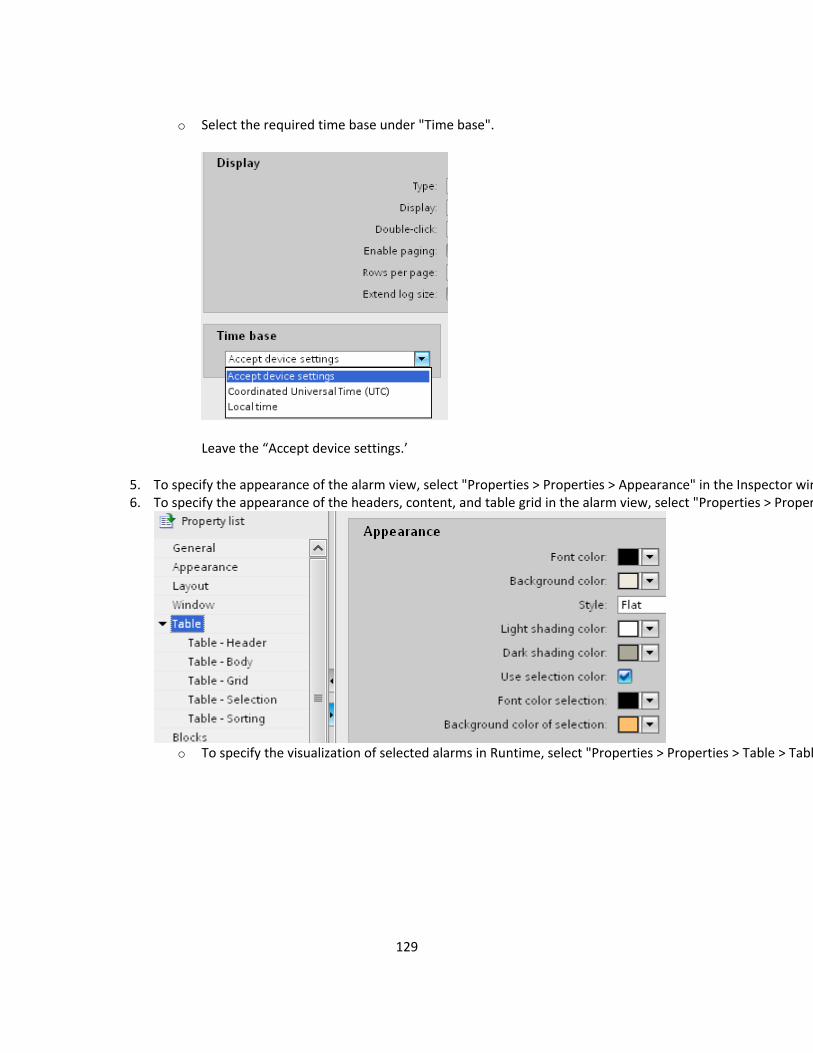
o e base". Select the required time base under "Tim
5. in the Inspector wi
Leave the “Accept device settings.’
To specify the appearance of the alarm view, select "Properties > Properties > Appearance" n6. "Properties > PropeTo specify the appearance of the headers, content, and table grid in the alarm view, select r
o To specify the visualization of selected alarms in Runtime, select "Properties > Properties > Table > Tabl
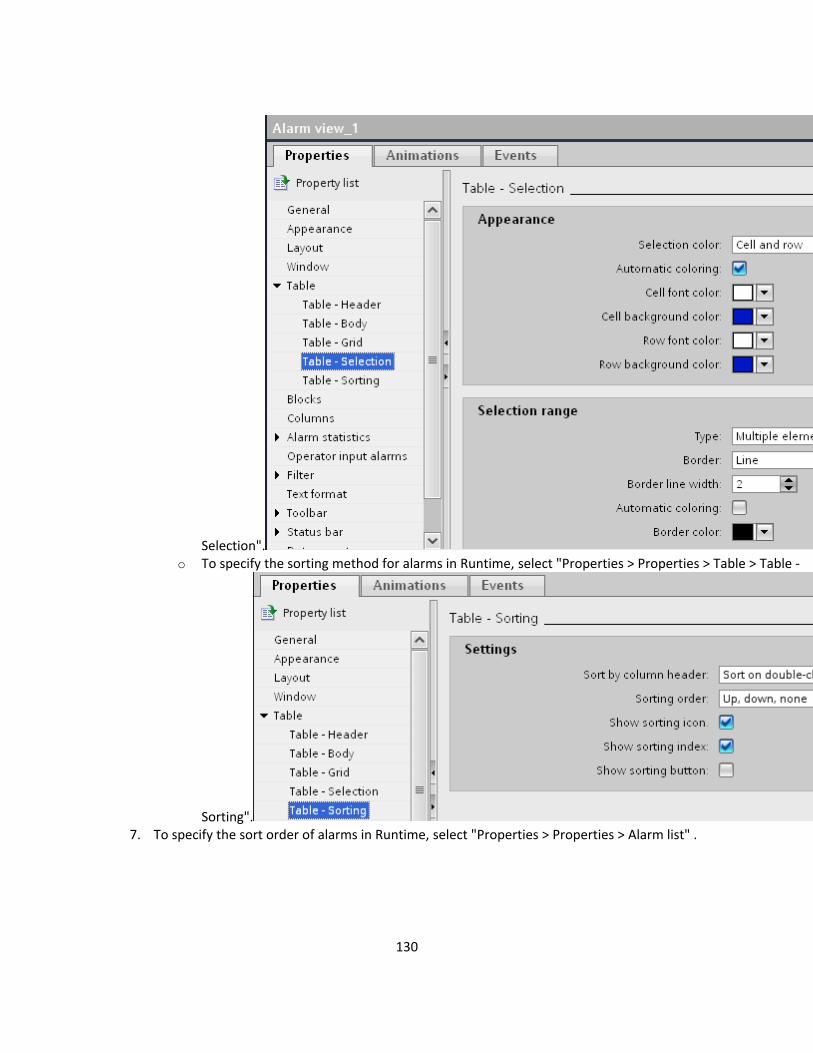
130
Selection".o To specify the sorting method for alarms in Runtime, select "Properties > Properties > Table > Table -
Sorting".7. To specify the sort order of alarms in Runtime, select "Properties > Properties > Alarm list" .
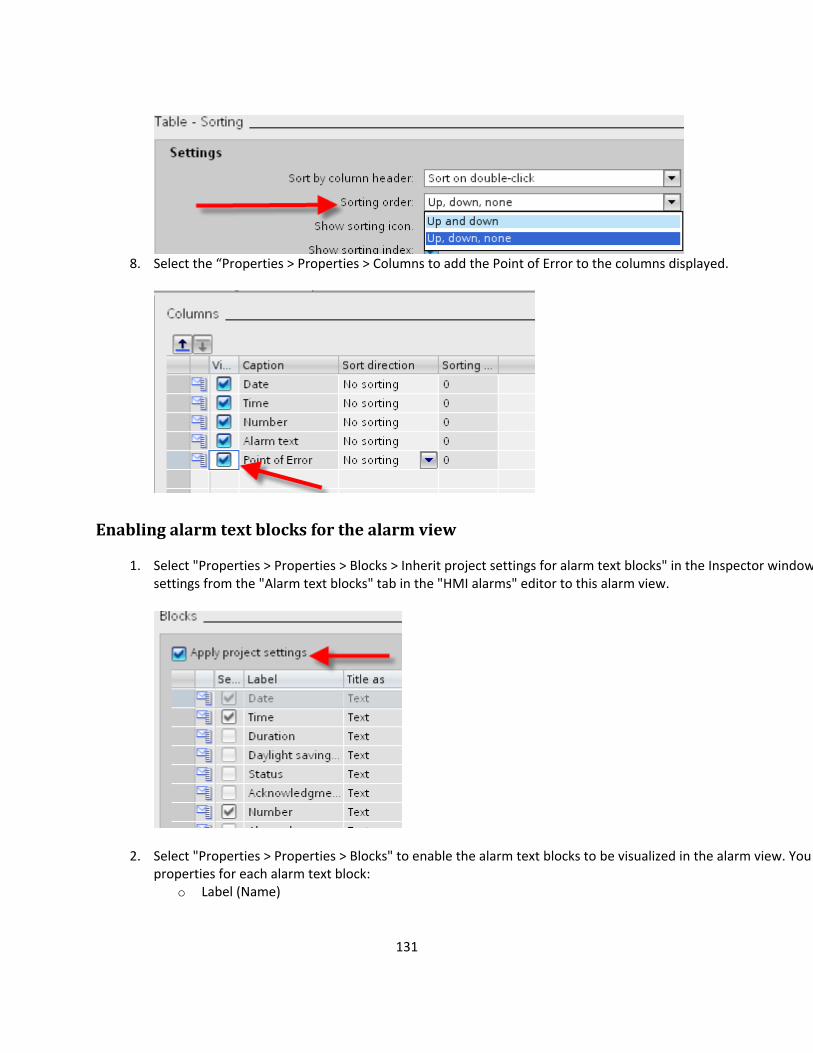
8. Error to the columns displayed. Sele th rties > Properties > Columns to add the Point of ct e “Prope
1. herit project settings for alarm text blocks" in the Inspector windo
Enabling alarm text blocks for the alarm view
Select "Properties > Properties > Blocks > In wsettings from the "Alarm text blocks" tab in the "HMI alarms" editor to this alarm view.
2. Select "Properties > Properties > Blocks" to enable the alarm text blocks to be visualized in the alarm view. You properties for each alarm text block:
o Label (Name)
131
132
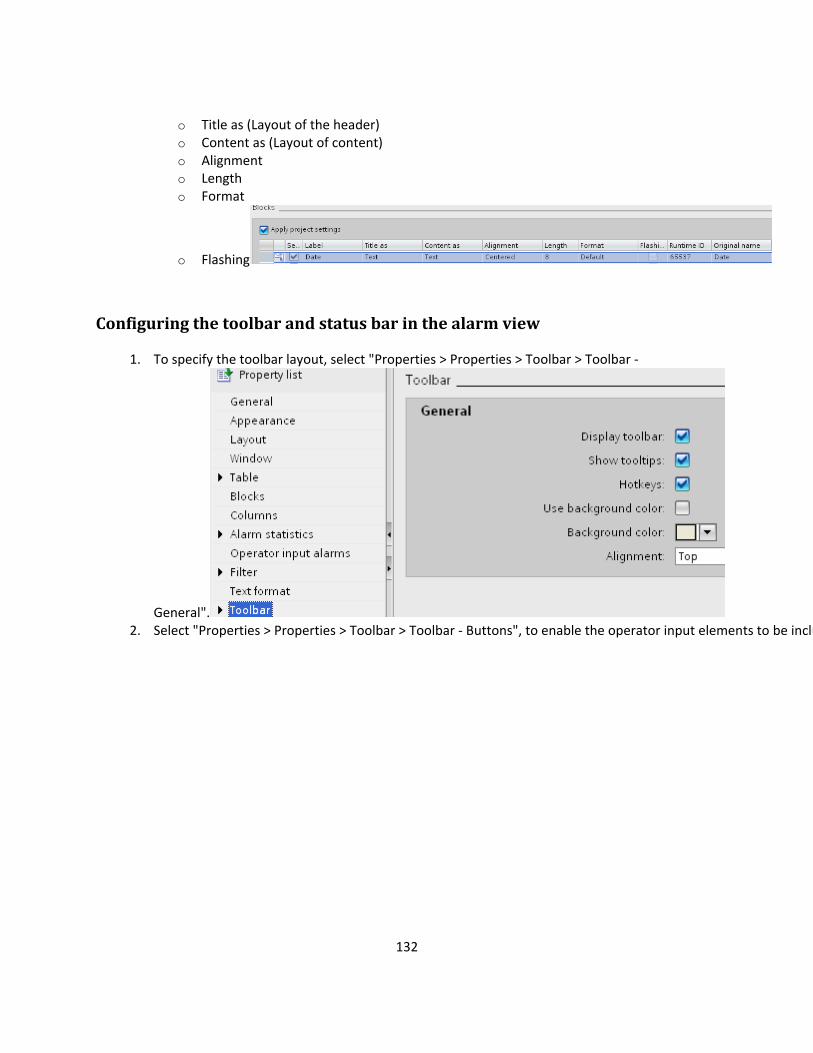
o Titleo o Alignmeo Length o Format
o Flashing
as (Layout of the header) Content as (Layout of content)
nt
Configurin
1. To specify
General".
g the toolbar and status bar in the alarm view
the toolbar layout, select "Properties > Properties > Toolbar > Toolbar -
2. Select "Properties > Properties > Toolbar > Toolbar - Bu ons", to enable the operator input elements to be incltt u
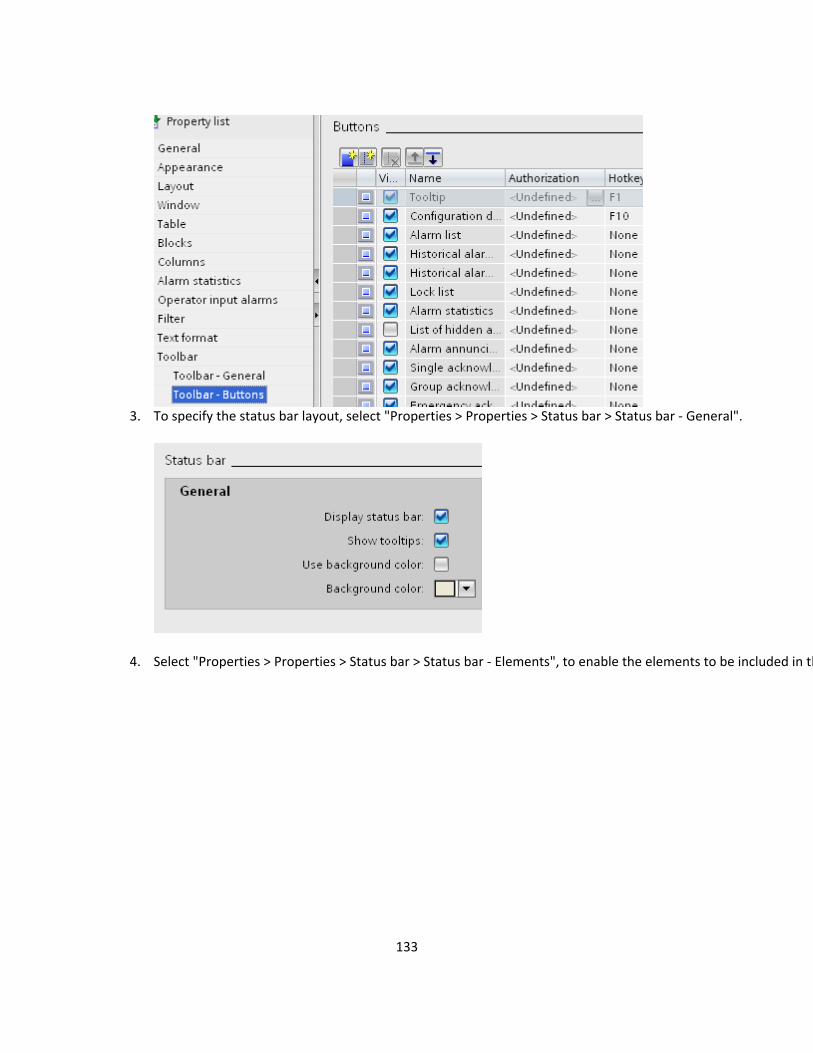
3. Properties > Status bar > Status bar - General". To specify the status bar layout, select "Properties >
4. Select "Properties > Properties > Status bar > Status bar - Elements", to enable the elements to be included in th
133
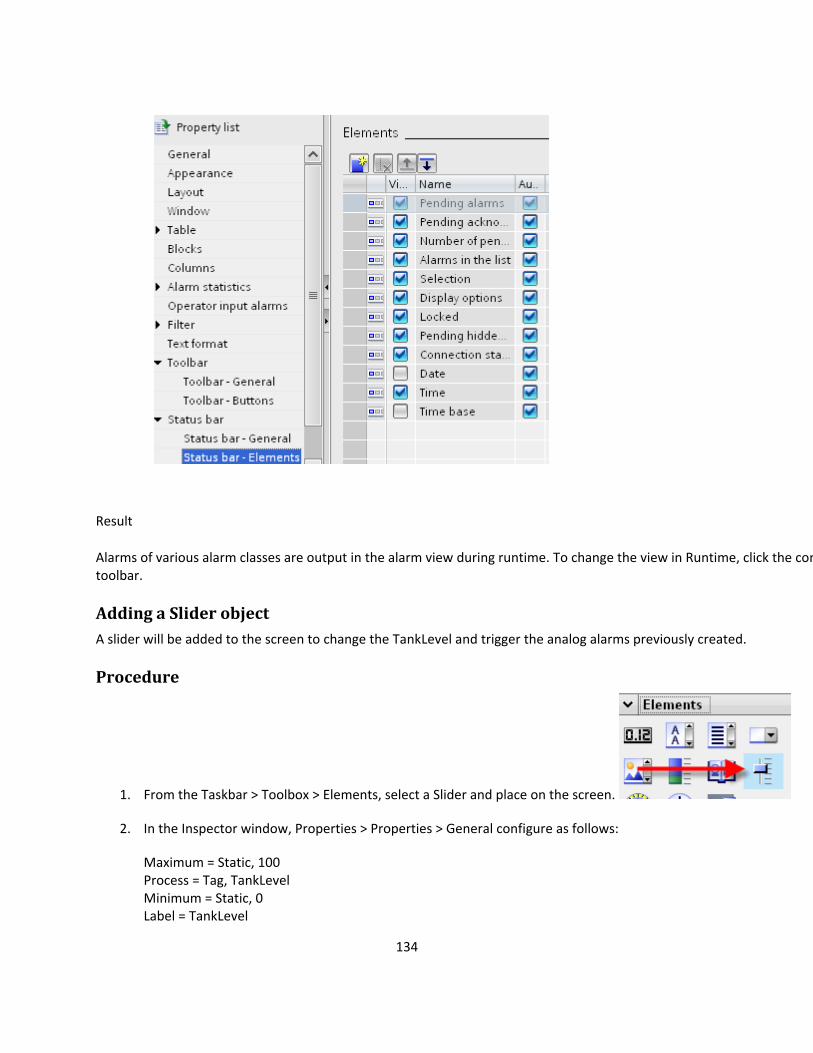
us alarm classes are output in the alarm view during runtime. To change the view in Runtime, click the co
Result
nAlarms of variotoo .
AdA slider will be added to the screen to change the TankLevel and trigger the analog alarms previously created.
Proce
1. From the Taskbar > Toolbox > Elements, select a Slider and place on the screen.
lbar
ding a Slider object
dure
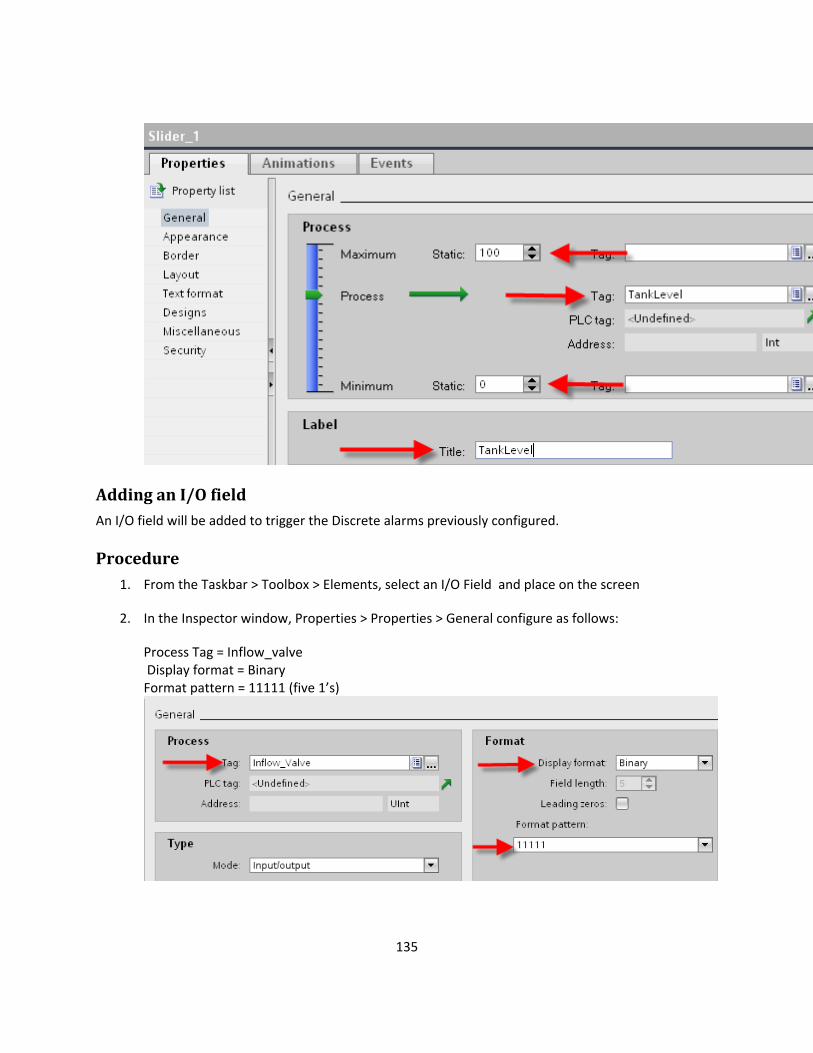
2. In the Inspector window, Properties > Properties > General configure as follows:
Maximum = Static, 100 Process = Tag, TankLevel Minimum = Static, 0 Label = TankLevel
134
135
Adding an I/O field An I/O field will be added to trigger the Discrete alarms previously configured.
Procedure om the Taskbar > Toolbox > Elements, select an I/O Field and place on the screen
2. In the Inspector window, Properties > Properties > General configure as follows:
Process Tag = Inflow_valve Display format = Binary Format pattern = 11111 (five 1’s)
1. Fr
136
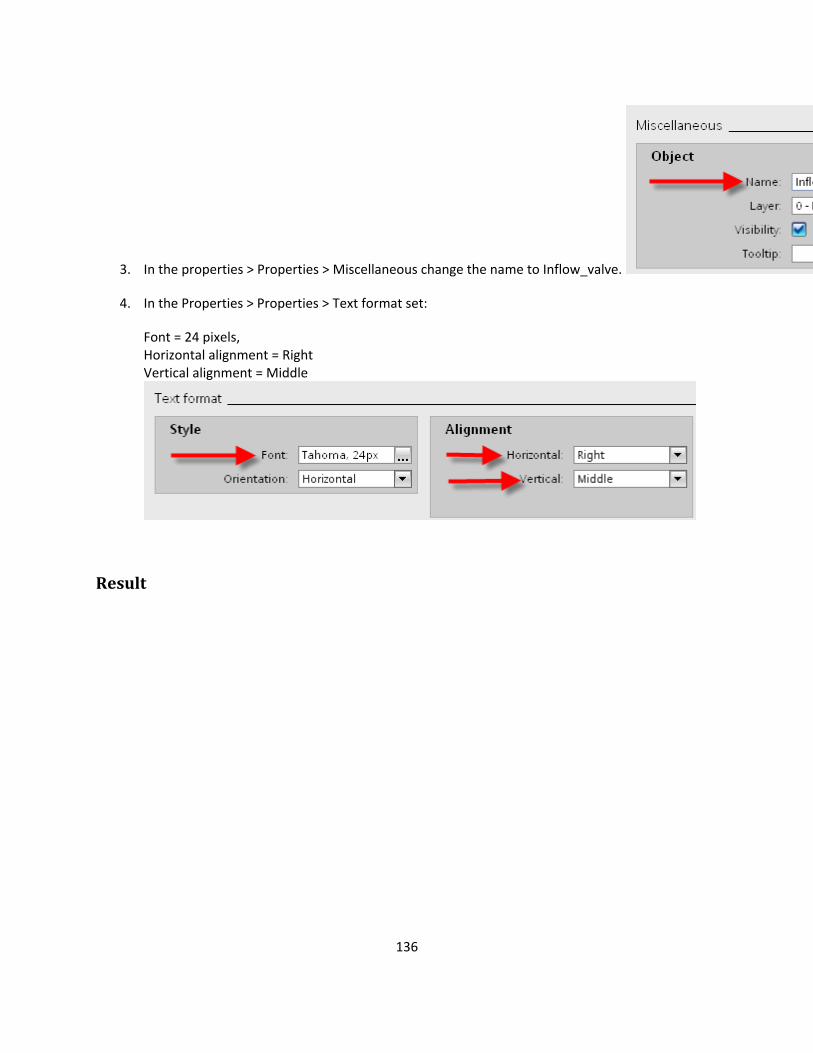
3. In the properties > Properties > Miscellaneous change the name to Inflow_valve.
4. In the Properties > Properties > Text format set:
Font = 24 pixels, Horizontal alignment = Right Vertical alignment = Middle
Result
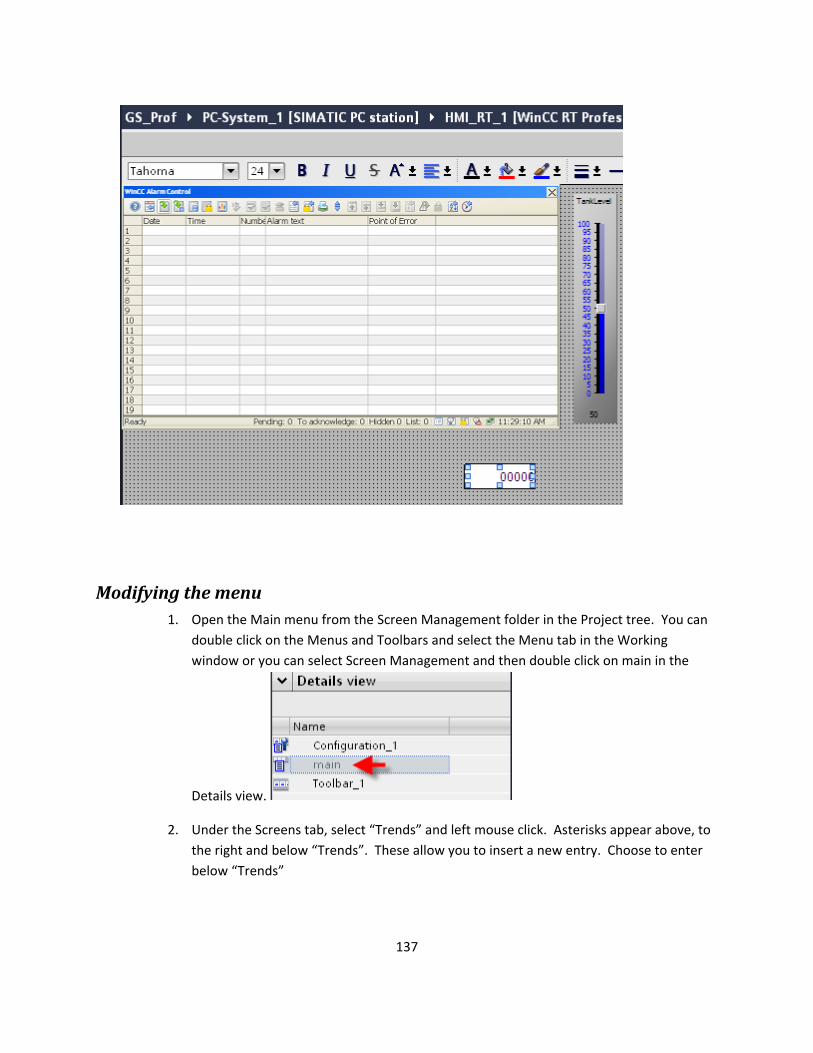
Modifying the menu 1. Open the Main menu from the Screen Management folder in the Project tree. You can
double click on the Menus and Toolbars and select the Menu tab in the Working window or you can select Screen Management and then double click on main in the
Details view.
2. Under the Screens tab, select “Trends” and left mouse click. Asterisks appear above, to the right and below “Trends”. These allow you to insert a new entry. Choose to enter below “Trends”
137
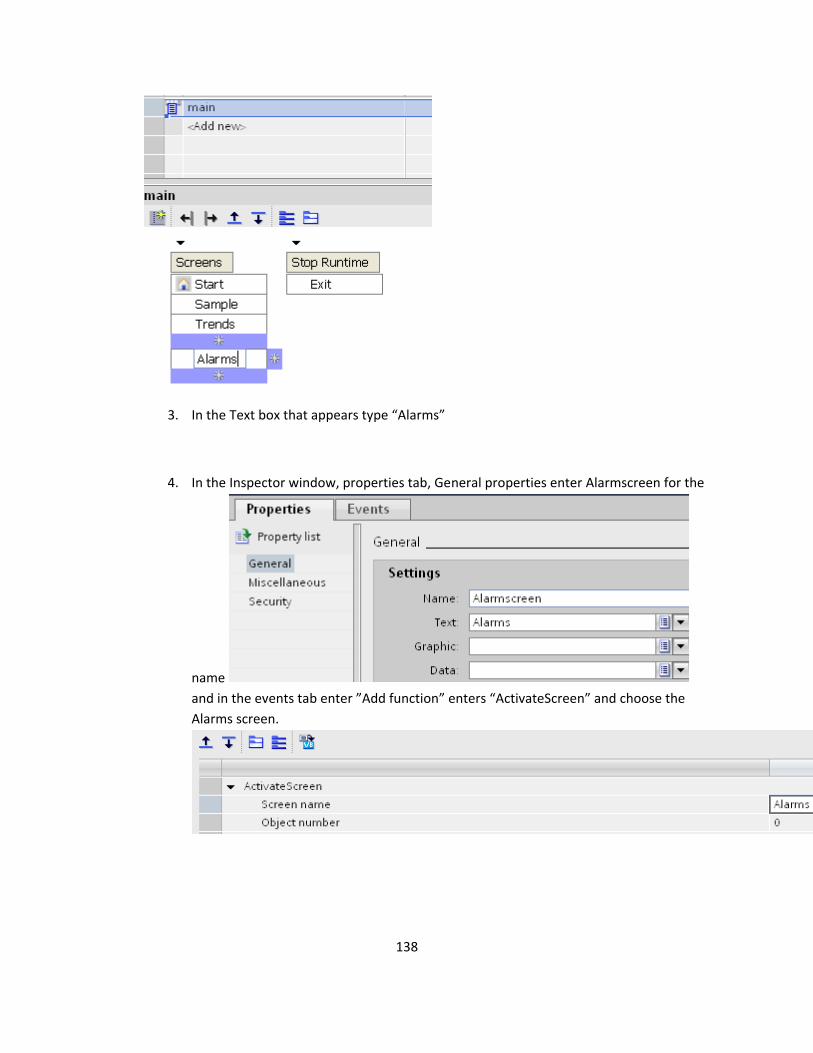
3. In the Text box that appears type “Alarms”
4. In the Inspector window, properties tab, General properties enter Alarmscreen for the
name the events tab enter ”Add function” enters “ActivateScreen” and choose the
Alarms screen. and in
138
139
Re
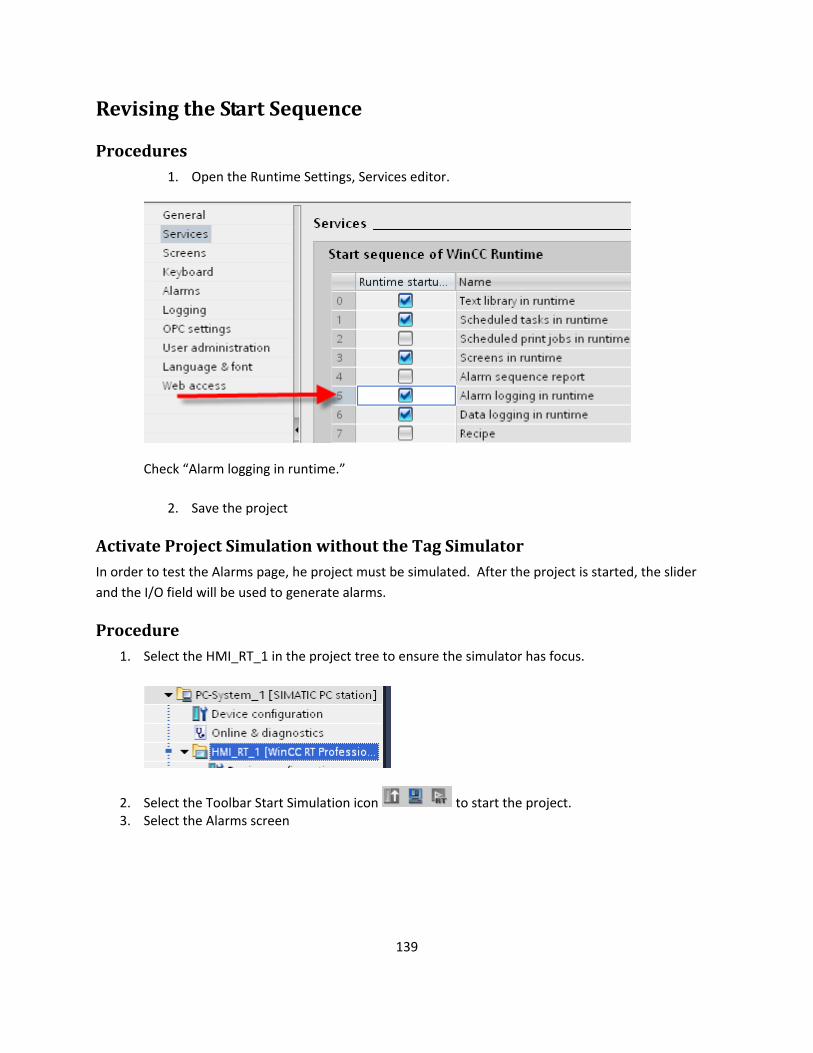
Procedures 1. Open the Runtime Settings, Services editor.
vising the Start Sequence
Check “Alarm logging in runtime.”
2. Save the project
Activate Project Simulation without the Tag Simulator In order to test the Alarms page, he project must be simulated. After the project is started, the slider and the I/O field will be used to generate alarms.
Proce1. Select the HMI_RT_1 in the project tree to ensure the simulator has focus.
dure
2. Select the Toolbar Start Simulation icon to start the project. 3. Select the Alarms screen
140
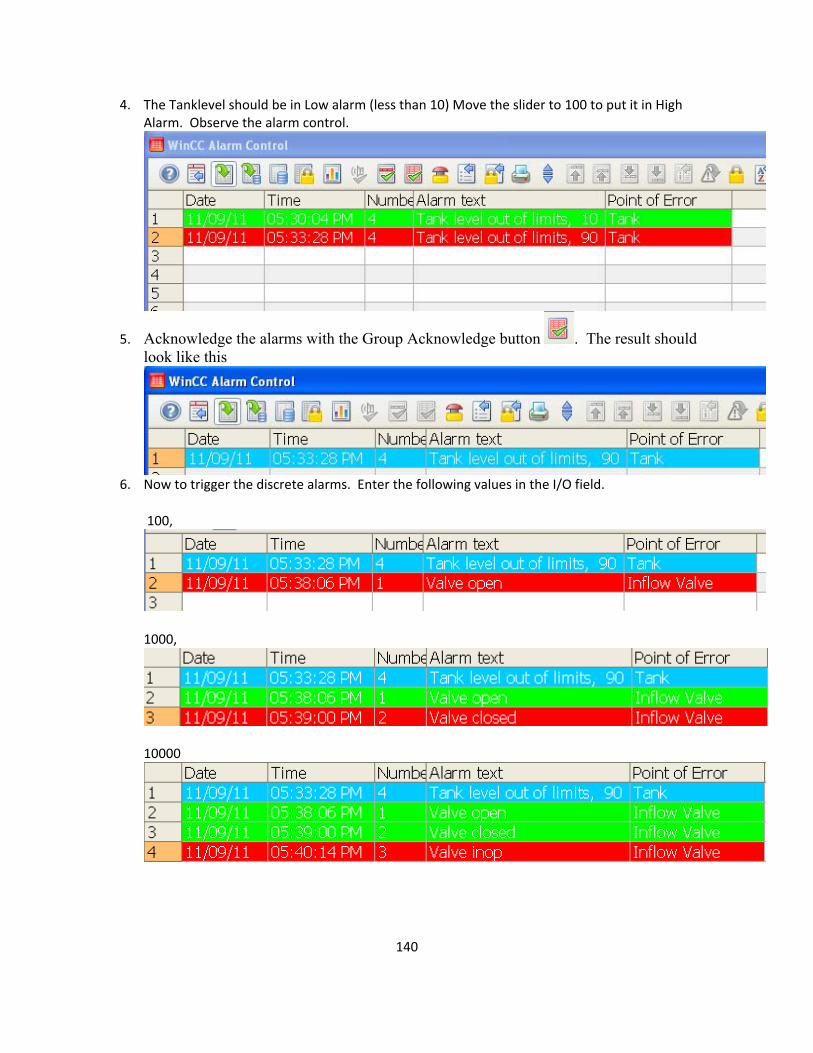
Alarm. Observe the alarm control. 4. The Tanklevel should be in Low alarm (less than 10) Move the slider to 100 to put it in High
5. Acknowledge the alarms with the Group Acknowledge button . The result should look like this
Now to trigger the discrete alarms. Enter the following values in th6. ield.
100,
e I/O f
1000,
10000
141
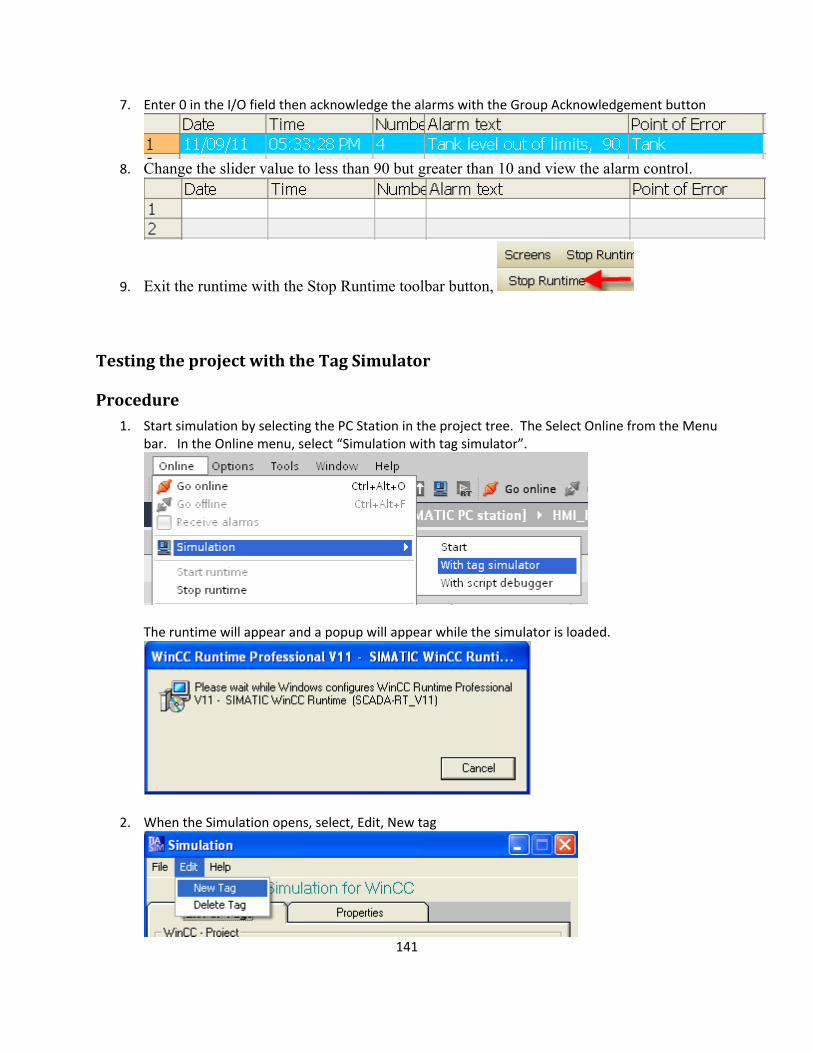
7. nter 0 in the I/O field then acknowledge the alarms with the Group Acknowledgement button E
Change the slider value to less than 90 but greater than 10 and view the alarm control. 8.
9. Exit the runtime with the Stop Runtime toolbar button,
Testing the project with the Tag Simulator
Procedure 1. Start simulation by selecting the PC Station in the project tree. The Select Online from the Menu
bar. In the Online menu, select “Simulation with tag simulator”.
The runtime will appear and a popup will appear while the simulator is loaded.
2. When the Simulation opens, select, Edit, New tag
142
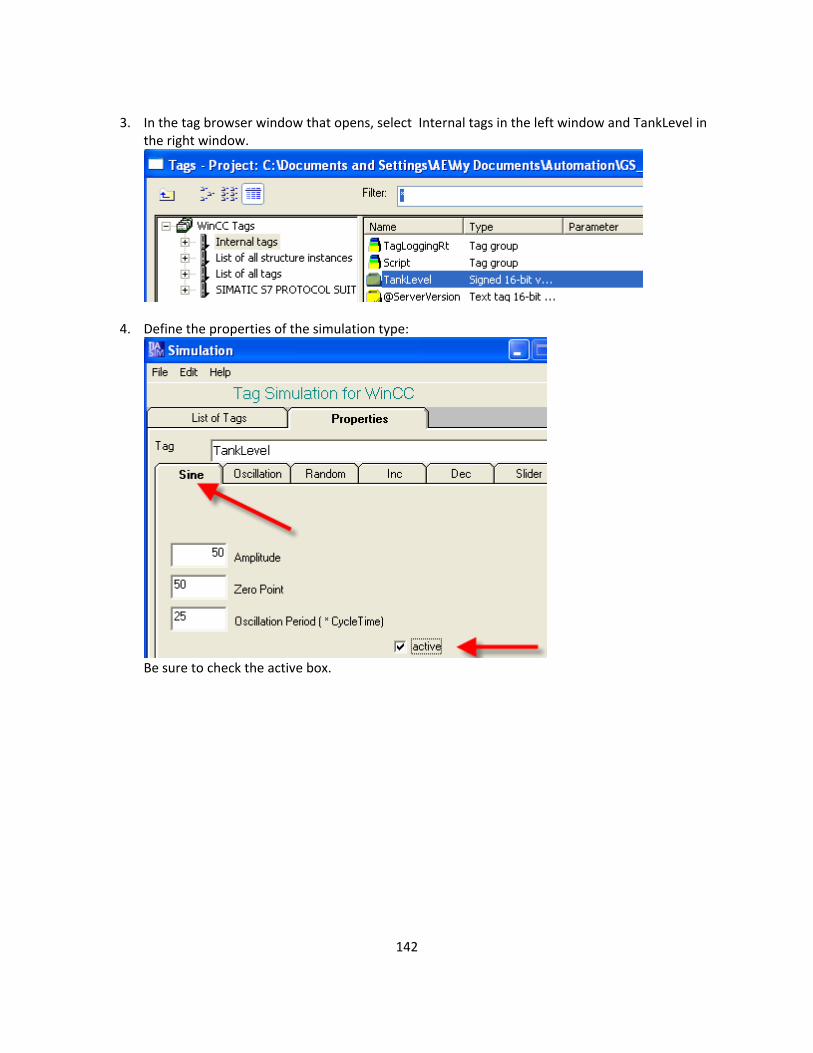
3. In the tag browser window that opens, select Internal tags in the left window and TankLevel in the right window.
4. Define the properties of the simulation type:
Be sure to check the active box.

5. Repeat the process to add Inflow_Valve
6. Start the simulation:
7. Observe how the different simulation values affect the message window.
143

144
8. Close the " Tag Simulation" after ending the simulation. Save the simulation in the project directory for future use.
11. Deactivate the project with the Stop Runtime button on the toolbar 12. This completes the Getting Started project