WILMINGTON TRUST COLLECTIVE INVESTMENT TRUST MULTI …
26
WILMINGTON TRUST COLLECTIVE INVESTMENT TRUST MULTI-MANAGER SMALL CAP GROWTH FUND FINANCIAL STATEMENTS DECEMBER 31, 2019 WITH INDEPENDENT AUDITOR'S REPORT
Transcript of WILMINGTON TRUST COLLECTIVE INVESTMENT TRUST MULTI …
WILMINGTON TRUST COLLECTIVE INVESTMENT TRUST
MULTI-MANAGER SMALL CAP GROWTH FUND
FINANCIAL STATEMENTS
DECEMBER 31, 2019
WITH
INDEPENDENT AUDITOR'S REPORT

Wilmington Trust Collective Investment Trust
MULTI-MANAGER SMALL CAP GROWTH FUND
CONTENTS Independent Auditor's Report ..................................................................................................................................................................... 1 Statement of Assets and Liabilities ............................................................................................................................................................ 3 Statement of Operations ............................................................................................................................................................................ 3 Statement of Changes in Net Assets.......................................................................................................................................................... 4 Financial Highlights .................................................................................................................................................................................... 5 Schedule of Investments ............................................................................................................................................................................ 6 Notes to the Financial Statements............................................................................................................................................................ 17
1
INDEPENDENT AUDITOR'S REPORT Wilmington Trust, N.A, Trustee for Wilmington Trust Collective Investment Trust Report on the Financial Statements We have audited the accompanying financial statements of Multi-Manager Small Cap Growth Fund (the "Fund") of Wilmington Trust Collective Investment Trust (the "Trust"), which comprise the statement of assets and liabilities, including the schedule of investments, as of December 31, 2019, and the related statements of operations and changes in net assets, and the financial highlights for the year then ended, and the related notes to the financial statements. These financial statements and financial highlights are hereinafter collectively referred to as financial statements. Management's Responsibility for the Financial Statements Management is responsible for the preparation and fair presentation of these financial statements in accordance with accounting principles generally accepted in the United States of America; this includes the design, implementation, and maintenance of internal control relevant to the preparation and fair presentation of financial statements that are free from material misstatement, whether due to fraud or error. Auditor's Responsibility Our responsibility is to express an opinion on these financial statements based on our audit. We conducted our audit in accordance with auditing standards generally accepted in the United States of America. Those standards require that we plan and perform the audit to obtain reasonable assurance about whether the financial statements are free from material misstatement. An audit involves performing procedures to obtain audit evidence about the amounts and disclosures in the financial statements. The procedures selected depend on the auditor's judgment, including the assessment of the risks of material misstatement of the financial statements, whether due to fraud or error. In making those risk assessments, the auditor considers internal control relevant to the entity's preparation and fair presentation of the financial statements in order to design audit procedures that are appropriate in the circumstances, but not for the purpose of expressing an opinion on the effectiveness of the entity's internal control. Accordingly, we express no such opinion. An audit also includes evaluating the appropriateness of accounting policies used and the reasonableness of significant accounting estimates made by management, as well as evaluating the overall presentation of the financial statements. We believe that the audit evidence we have obtained is sufficient and appropriate to provide a basis for our audit opinion. Opinion In our opinion, the financial statements referred to above present fairly, in all material respects, the financial position of the Fund as of December 31, 2019, and the results of its operations, and changes in its net assets and its financial highlights for the year then ended, in accordance with accounting principles generally accepted in the United States of America.
www.hogantaylor.com

2
Other Matter Our audit was conducted for the purpose of forming an opinion on the financial statements as a whole. The supplementary information on investments purchased and sold for the year ended December 31, 2019, following the schedule of investments, is presented for purposes of additional analysis and is not a required part of the financial statements. Such information is the responsibility of management and was derived from and relates directly to the underlying accounting and other records used to prepare the financial statements. The information has been subjected to the auditing procedures applied in the audit of the financial statements and certain additional procedures, including comparing and reconciling such information directly to the underlying accounting and other records used to prepare the financial statements or to the financial statements themselves, and other additional procedures in accordance with auditing standards generally accepted in the United States of America. In our opinion, the information is fairly stated in all material respects in relation to the financial statements as a whole.
Tulsa, Oklahoma April 29, 2020


Wilmington Trust Collective Investment Trust
See Notes to the Financial Statements. 3
AssetsInvestments in securities, at fair value (cost $9,811,058) 10,861,309$ Foreign currency, at fair value (cost $12) 13 Accrued interest and dividends 3,402 Receivable for investment securities sold 111,022 Receivable for fund units sold 4,125 Receivable for reimbursement 9,586 Total assets 10,989,457 Liabilities and Net AssetsPayable for investment securities purchased 30,802 Payable for fund units redeemed 29,982 Accrued expenses 36,884 Total liabilities 97,668 Net assets 10,891,789$
Investment incomeDividends 63,267$ Interest 8,219 Miscellaneous income 7,037 Total investment income 78,523 ExpensesTrustee, management and service provider fees 71,739 Professional fees and other operating expenses 22,894 Expense reimbursement from sub-advisor (40,822) Total expenses 53,811 Net investment income 24,712 Realized and unrealized gain on investments Net realized gain on investments 198,902 Net change in unrealized appreciation on investments 2,322,492 Net realized and unrealized gain on investments 2,521,394 Net increase in net assets resulting from operations 2,546,106$
December 31, 2019
Statement of OperationsFor the year ended December 31, 2019
Statement of Assets and Liabilities
Multi-Manager Small Cap Growth Fund

Wilmington Trust Collective Investment Trust
See Notes to the Financial Statements. 4
Increase in net assets resulting from operationsNet investment income 24,712$ Net realized gain on investments 198,902 Net change in unrealized appreciation on investments 2,322,492 Net increase in net assets resulting from operations 2,546,106 Fund unit transactionsProceeds from units issuedClass 0IM 1,525,127 Class 45 1,902 Class 60 6,612 Class R 531,810 Class R6 1,114,265 Total proceeds from units issued 3,179,716 Value of units redeemedClass 0IM (4,994,392) Class 45 (19,528) Class 60 (14,687) Class R (2,774,203) Class R6 (571,033) Total value of units redeemed (8,373,843) Decrease in net assets resulting from fund unit transactions (5,194,127) Decrease in net assets (2,648,021) Net assets, beginning of year 13,539,810 Net assets, end of year 10,891,789$
Statement of Changes in Net AssetsFor the year ended December 31, 2019
Multi-Manager Small Cap Growth Fund

Wilmington Trust Collective Investment Trust
See Notes to the Financial Statements. 5
Per Unit Operating Performance Class 0IM Class 45 Class 60Net asset value, beginning of year 218.09$ 203.53$ 202.80$ Income (loss) from investment operations:
Net investment income (loss) (1) 0.89 (1.43) (1.76) Net realized and unrealized gain on investments (1) 43.29 40.26 40.09
Total income from investment operations 44.18 38.83 38.33 Net asset value, end of year 262.27$ 242.36$ 241.13$
Total Return 20.26% 19.08% 18.90%Supplemental DataRatio to average net assets:
Gross expenses (excluding reimbursement) 0.62% 1.17% 1.32%Net expenses 0.19% 1.17% 1.32%Net investment income (loss) 0.36% (0.62%) (0.77%)
Fund Unit ActivityUnits, beginning of year 43,661 1,198 289 Issued 6,243 8 29 Redeemed (20,231) (89) (64) Units, end of year 29,673 1,117 254
Per Unit Operating Performance Class R Class R6Net asset value, beginning of year 209.56$ 214.11$ Income (loss) from investment operations:
Net investment loss (1) (0.40) (0.34) Net realized and unrealized gain on investments (1) 41.50 42.42
Total income from investment operations 41.10 42.08 Net asset value, end of year 250.66$ 256.19$
Total Return 19.61% 19.65%Supplemental DataRatio to average net assets:
Expenses 0.72% 0.70%Net investment loss (0.17%) (0.14%)
Fund Unit ActivityUnits, beginning of year 13,217 4,417 Issued 2,324 4,654 Redeemed (11,345) (2,336) Units, end of year 4,196 6,735 (1) Based on average units outstanding.
Multi-Manager Small Cap Growth Fund
Financial HighlightsFor the year ended December 31, 2019
Wilmington Trust Collective Investment Trust
See Notes to the Financial Statements. 6
Multi-Manager Small Cap Growth Fund
Schedule of Investments December 31, 2019
Principal
Amount or FairShares Cost Value
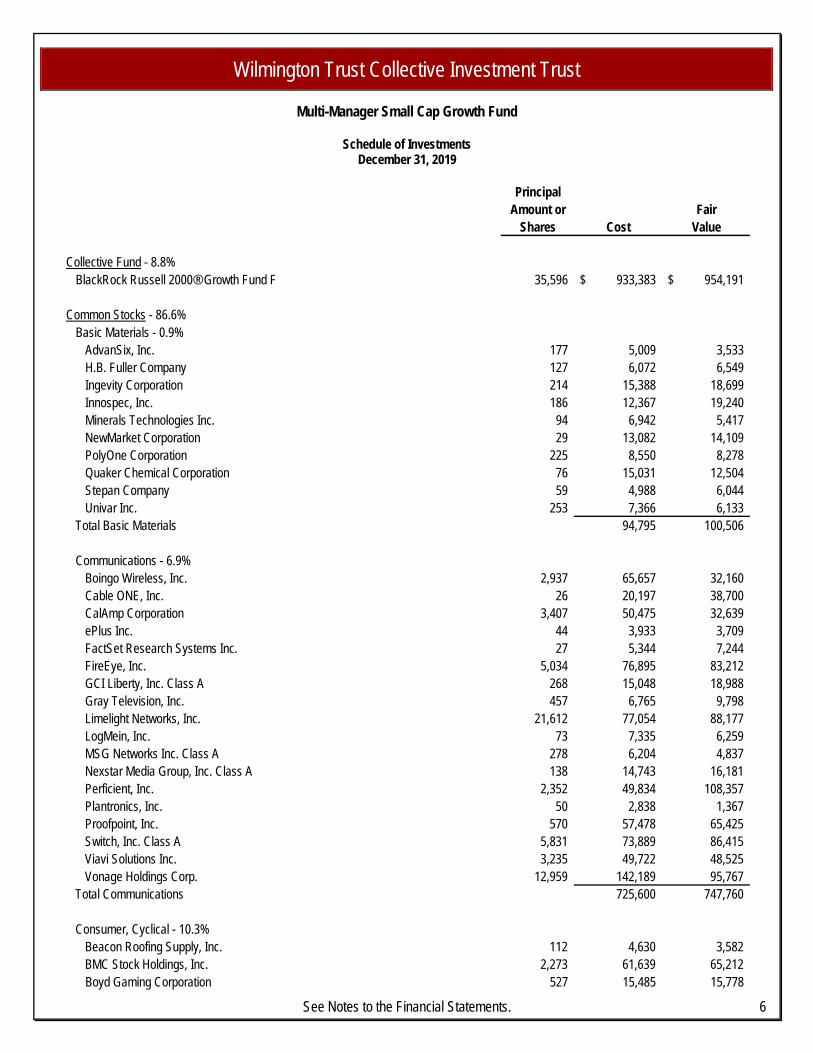
Collective Fund - 8.8%BlackRock Russell 2000® Growth Fund F 35,596 933,383$ 954,191$
Common Stocks - 86.6%Basic Materials - 0.9%
AdvanSix, Inc. 177 5,009 3,533 H.B. Fuller Company 127 6,072 6,549 Ingevity Corporation 214 15,388 18,699 Innospec, Inc. 186 12,367 19,240 Minerals Technologies Inc. 94 6,942 5,417 NewMarket Corporation 29 13,082 14,109 PolyOne Corporation 225 8,550 8,278 Quaker Chemical Corporation 76 15,031 12,504 Stepan Company 59 4,988 6,044 Univar Inc. 253 7,366 6,133
Total Basic Materials 94,795 100,506
Communications - 6.9%Boingo Wireless, Inc. 2,937 65,657 32,160 Cable ONE, Inc. 26 20,197 38,700 CalAmp Corporation 3,407 50,475 32,639 ePlus Inc. 44 3,933 3,709 FactSet Research Systems Inc. 27 5,344 7,244 FireEye, Inc. 5,034 76,895 83,212 GCI Liberty, Inc. Class A 268 15,048 18,988 Gray Television, Inc. 457 6,765 9,798 Limelight Networks, Inc. 21,612 77,054 88,177 LogMein, Inc. 73 7,335 6,259 MSG Networks Inc. Class A 278 6,204 4,837 Nexstar Media Group, Inc. Class A 138 14,743 16,181 Perficient, Inc. 2,352 49,834 108,357 Plantronics, Inc. 50 2,838 1,367 Proofpoint, Inc. 570 57,478 65,425 Switch, Inc. Class A 5,831 73,889 86,415 Viavi Solutions Inc. 3,235 49,722 48,525 Vonage Holdings Corp. 12,959 142,189 95,767
Total Communications 725,600 747,760
Consumer, Cyclical - 10.3%Beacon Roofing Supply, Inc. 112 4,630 3,582 BMC Stock Holdings, Inc. 2,273 61,639 65,212 Boyd Gaming Corporation 527 15,485 15,778

Wilmington Trust Collective Investment Trust
See Notes to the Financial Statements. 7
Multi-Manager Small Cap Growth Fund
Schedule of Investments (continued) December 31, 2019
Principal
Amount or FairShares Cost Value
Common Stocks - 86.6% (continued)Consumer, Cyclical - 10.3% (continued)
Brunswick Corporation 197 11,903$ 11,816$ Burlington Stores, Inc. 89 9,956 20,295 Carter's, Inc. 156 15,971 17,057 Casey's General Stores, Inc. 150 17,902 23,849 Cavco Industries, Inc. 39 7,404 7,620 Choice Hotels International, Inc. 161 12,767 16,652 Churchill Downs, Inc. 223 12,592 30,596 Denny's Corporation 661 9,273 13,141 Domino's Pizza, Inc. 37 7,628 10,870 Douglas Dynamics, Inc. 227 9,314 12,485 Eldorado Resorts, Inc. 2,402 106,038 143,255 Everi Holdings Inc. 3,900 52,028 52,377 Hilton Grand Vacations Inc. 373 12,939 12,827 IAA, Inc. 369 15,141 17,365 Jack in the Box Inc. 1,073 93,146 83,726 LCI Industries 111 10,712 11,891 Live Nation Entertainment, Inc. 132 4,992 9,434 Marriott Vacations Worldwide Corporation 23 2,361 2,961 Mobile Mini, Inc. 1,894 71,964 71,802 National Vision Holdings, Inc. 3,039 84,706 98,555 Papa John's International, Inc. 148 7,677 9,346 Penn National Gaming, Inc. 640 14,751 16,358 Petiq Inc. 3,368 97,110 84,368 Pool Corporation 139 14,901 29,521 Ruth's Hospitality Group, Inc. 363 9,419 7,901 SiteOne Landscape Supply, Inc. 556 42,049 50,401 Six Flags Entertainment Corporation 134 8,278 6,045 Steven Madden, Ltd. 393 10,476 16,903 Texas Roadhouse, Inc. 284 18,170 15,995 The Cheesecake Factory Incorporated 120 7,028 4,663 The Children's Place, Inc. 14 1,515 875 The Scotts Miracle-Gro Company 103 9,966 10,937 The Wendy's Company 816 16,063 18,123 Thor Industries, Inc. 112 7,430 8,320 Toro Company 285 18,639 22,706 UniFirst Corporation 89 16,106 17,976 Vail Resorts, Inc. 97 19,539 23,264 Visteon Corporation 89 10,525 7,707 Watsco Inc. 87 14,187 15,673
Total Consumer, Cyclical 994,320 1,120,228

Wilmington Trust Collective Investment Trust
See Notes to the Financial Statements. 8
Multi-Manager Small Cap Growth Fund
Schedule of Investments (continued) December 31, 2019
Principal
Amount or FairShares Cost Value
Common Stocks - 86.6% (continued)Consumer, Non-cyclical - 14.2%
Aaron's, Inc. 126 6,926$ 7,196$ ASGN Incorporated 2,669 170,952 189,419 BJ's Wholesale Club Holdings, Inc. 4,149 104,226 94,348 Booz Allen Hamilton Holding Corporation 320 14,352 22,762 Bright Horizons Family Solutions 152 17,158 22,844 Cardtronics PLC Class A 2,564 85,758 114,482 Coca-Cola Consolidated Inc. 40 9,020 11,362 Corelogic, Inc. 279 11,139 12,195 Euronet Worldwide, Inc. 226 23,644 35,609 Gartner, Inc. 57 6,694 8,784 Grand Canyon Education, Inc. 163 19,397 15,614 Green Dot Corporation Class A 3,670 108,748 85,511 Helen of Troy Ltd. 144 15,521 25,890 Hostess Brands, Inc. 6,385 91,972 92,838 ICF International, Inc. 1,312 100,528 120,205 Insperity, Inc. 1,340 132,018 115,294 J & J Snack Foods Corporation 95 12,925 17,506 John B. Sanfilippo & Son, Inc. 78 5,831 7,120 MarketAxess Holdings Inc. 62 12,769 23,505 McGrath RentCorp 77 5,871 5,894 MGP Ingredients Inc. 2,095 125,969 101,503 Performance Food Group Company 2,318 84,339 119,331 Post Holdings, Inc. 144 12,501 15,710 Rollins, Inc. 216 6,127 7,163 Service Corporation International 406 13,575 18,688 ServiceMaster Global Holdings, Inc. 378 13,528 14,613 Sprouts Farmers Market, Inc. 459 12,847 8,882 Strategic Education, Inc. 73 9,818 11,600 The Boston Beer Company, Inc. Class A 43 9,030 16,248 The Brink's Company 970 75,647 87,960 The Ensign Group, Inc. 348 13,431 15,789 The Simply Good Foods Company 2,292 56,862 65,414 Treehouse Foods, Inc. 129 10,167 6,257 WEX Inc. 97 11,872 20,318 WW International, Inc. 102 6,080 3,897
Total Consumer, Non-cyclical 1,417,242 1,541,751

Wilmington Trust Collective Investment Trust
See Notes to the Financial Statements. 9
Multi-Manager Small Cap Growth Fund
Schedule of Investments (continued) December 31, 2019
Principal
Amount or FairShares Cost Value
Common Stocks - 86.6% (continued)Energy - 1.1%
Apergy Corporation 299 11,987$ 10,100$ Dril-Quip, Inc. 114 5,086 5,348 Matador Resources Company 3,150 67,634 56,606 Murphy USA Inc. 139 9,629 16,263 PBF Energy Inc. Class A 262 10,522 8,219 PDC Energy, Inc. 143 8,172 3,742 WPX Energy, Inc. 1,458 17,224 20,033
Total Energy 130,254 120,311
Financial - 4.3%Ameris Bancorp 1,309 59,435 55,684 Carolina Financial Corporation 103 4,244 4,453 Cboe Global Markets, Inc. 124 10,607 14,880 CenterState Bank Corporation 454 11,920 11,341 E*Trade Financial Corporation 62 2,373 2,813 First Bancorp 296 10,566 11,813 Heritage Insurance Holdings, Inc. 48 746 636 Home Bancshares, Inc. 2,665 62,370 52,394 Kemper Corp. 116 8,913 8,990 MGIC Investment Corporation 241 3,390 3,415 Primerica, Inc. 925 105,916 120,768 Radian Group Inc. 298 5,237 7,498 Signature Bank 54 7,335 7,377 SLM Corporation 658 7,355 5,863 Universal Insurance Holdings, Inc. 221 9,649 6,186 Western Alliance Bancorp 1,454 77,637 82,878 Wintrust Financial Corporation 956 69,428 67,780
Total Financial 457,121 464,769
Health Care - 20.7%ACADIA Pharmaceuticals, Inc. 378 9,974 16,171 Acceleron Pharma, Inc. 123 4,756 6,521 Addus HomeCare Corporation 134 9,275 13,027 Aerie Pharmaceuticals, Inc. 96 3,994 2,320 Agios Pharmaceuticals, Inc. 126 8,617 6,017 Aimmune Therapeutics, Inc. 112 3,439 3,749 Alkermes PLC 240 7,990 4,896 Alnylam Pharmaceuticals, Inc. 19 1,009 2,188 Amedisys, Inc. 110 13,630 18,361

Wilmington Trust Collective Investment Trust
See Notes to the Financial Statements. 10
Multi-Manager Small Cap Growth Fund
Schedule of Investments (continued) December 31, 2019
Principal
Amount or FairShares Cost Value
Common Stocks - 86.6% (continued)Health Care - 20.7% (continued)
Amicus Therapeutics, Inc. 294 3,689$ 2,864$ AMN Healthcare Services, Inc. 173 9,811 10,780 Avanos Medical, Inc. 32 1,395 1,078 Axsome Therapeutics, Inc. 83 4,534 8,579 Bio-Rad Laboratories, Inc. Class A 43 10,376 15,911 BioTelemetry, Inc. 164 6,398 7,593 bluebird bio, Inc. 42 3,703 3,686 Blueprint Medicines Corporation 124 8,270 9,934 Bruker Corporation 174 6,215 8,869 Cantel Medical Corporation 167 13,725 11,840 Cardiovascular Systems, Inc. 2,822 92,399 137,121 Catalent, Inc. 396 16,073 22,295 Charles River Laboratories International, Inc. 169 17,253 25,816 Chemed Corporation 60 13,664 26,356 CorVel Corporation 101 6,505 8,823 CRISPR Therapeutics AG 127 6,772 7,735 Deciphera Pharmaceuticals, Inc. 61 3,797 3,797 Emergent BioSolutions Inc. 251 13,736 13,541 Enanta Pharmaceuticals, Inc. 30 3,504 1,853 Encompass Health Corporation 174 10,901 12,053 Exact Sciences Corporation 229 15,144 21,178 Exelixis, Inc. 173 3,033 3,048 FibroGen, Inc. 148 7,636 6,348 Global Blood Therapeutics, Inc. 170 8,858 13,513 Globus Medical Inc. Class A 254 13,332 14,956 Haemonetics Corporation 174 18,756 19,993 HealthEquity, Inc. 693 46,086 51,331 Horizon Therapeutics PLC 3,562 102,353 128,945 ICU Medical, Inc. 740 143,564 138,469 Immunomedics, Inc. 251 6,048 5,311 Innoviva, Inc. 222 3,682 3,144 Inogen, Inc. 35 3,269 2,392 Insmed Incorporated 273 6,328 6,519 Insulet Corp. 65 9,876 11,128 Ionis Pharmaceuticals, Inc. 57 2,756 3,443 Ironwood Pharmaceuticals, Inc. 307 3,972 4,086 Jazz Pharmaceuticals PLC 26 3,892 3,881 Kodiak Sciences, Inc. 118 3,831 8,490 Lantheus Holdings, Inc. 416 10,038 8,532

Wilmington Trust Collective Investment Trust
See Notes to the Financial Statements. 11
Multi-Manager Small Cap Growth Fund
Schedule of Investments (continued) December 31, 2019
Principal
Amount or FairShares Cost Value
Common Stocks - 86.6% (continued)Health Care - 20.7% (continued)
LHC Group, Inc. 488 65,306$ 67,227$ Ligand Pharmaceuticals Incorporated 1,783 220,680 185,946 LivaNova PLC 130 15,921 9,806 Madrigal Pharmaceuticals, Inc. 13 3,573 1,184 Masimo Corporation 161 16,747 25,448 Medpace Holdings, Inc. 218 14,223 18,325 Merit Medical Systems Inc. 4,058 135,977 126,691 Mirati Therapeutics, Inc. 80 6,940 10,309 Molina Healthcare, Inc. 200 19,703 27,138 MyoKardia, Inc. 96 4,292 6,997 Nektar Therapeutics 105 3,365 2,266 NeoGenomics, Inc. 4,057 53,033 118,667 Neurocrine Biosciences, Inc. 76 4,093 8,169 NuVasive, Inc. 183 11,059 14,153 Omnicell, Inc. 1,414 88,507 115,552 Pacira Pharmaceuticals, Inc. 91 4,357 4,122 Penumbra, Inc. 86 7,873 14,127 Phibro Animal Health Corporation Class A 170 5,577 4,221 PRA Health Sciences, Inc. 235 20,523 26,120 Prestige Consumer Healthcare Inc. 241 12,030 9,761 Principia Biopharma, Inc. 29 1,719 1,589 PTC Therapeutics, Inc. 170 6,528 8,165 Quidel Corporation 1,125 69,665 84,409 R1 RCM, Inc. 8,644 101,655 112,199 Reata Pharmaceuticals, Inc. Class A 20 4,216 4,089 Repligen Corporation 180 8,637 16,650 Sage Therapeutics, Inc. 105 12,553 7,580 Sarepta Therapeutics, Inc. 70 7,642 9,033 SeaSpine Holdings Corporation 4,008 62,268 48,136 Seattle Genetics, Inc. 72 4,700 8,227 Supernus Pharmaceuticals, Inc. 206 5,597 4,886 Syneos Health, Inc. 1,755 82,626 104,379 Tabula Rasa HealthCare, Inc. 126 8,263 6,134 The Cooper Companies, Inc. 23 5,163 7,390 The Pennant Group, Inc. 246 2,515 8,135 Theravance Biopharma, Inc. 132 4,950 3,417 U.S. Physical Therapy, Inc. 104 7,532 11,892 Ultragenyx Pharmaceutical Inc. 156 9,766 6,663

Wilmington Trust Collective Investment Trust
See Notes to the Financial Statements. 12
Multi-Manager Small Cap Growth Fund
Schedule of Investments (continued) December 31, 2019
Principal
Amount or FairShares Cost Value
Common Stocks - 86.6% (continued)Health Care - 20.7% (continued)
uniQure NV 120 5,003$ 8,599$ Veracyte, Inc. 2,276 63,358 63,546 Vericel Corp. 2,865 49,580 49,851 WAVE Life Sciences Ltd. 49 1,206 393 West Pharmaceutical Services, Inc. 139 13,766 20,896 Xencor, Inc. 192 6,233 6,603
Total Health Care 1,986,778 2,267,571
Industrial - 14.3%AAON, Inc. 139 6,093 6,868 Advanced Disposal Services, Inc. 338 8,353 11,110 Advanced Energy Industries, Inc. 166 11,275 11,819 Aerojet Rocketdyne Holdings, Inc. 531 17,078 24,245 Albany International Corporation Class A 153 13,282 11,616 Atkore International Group, Inc. 343 7,856 13,878 Berry Global Group, Inc. 356 16,244 16,906 BrightView Holdings, Inc. 3,069 55,214 51,774 Casella Waste Systems, Inc. Class A 509 10,501 23,429 Chase Corporation 103 11,040 12,203 Cognex Corporation 209 9,394 11,712 Coherent, Inc. 94 19,419 15,637 Comfort Systems USA, Inc. 174 7,861 8,674 Cubic Corp. 1,727 101,885 109,785 Curtiss Wright Corporation 153 15,142 21,556 Dycom Industries, Inc. 553 31,054 26,074 Eagle Materials Inc. 147 14,165 13,327 Emcor Group Inc. 179 16,106 15,448 EnPro Industries, Inc. 87 5,761 5,819 Exponent Inc. 309 11,523 21,324 frontdoor, inc. 2,071 93,556 98,207 Gardner Denver Holdings, Inc. 421 13,943 15,442 Generac Holdings Inc. 175 10,506 17,603 Graco Inc. 297 11,017 15,444 Graphic Packaging Holding Company 6,152 73,280 102,431 HEICO Corporation Class A 199 9,581 17,816 Hexcel Corporation 224 13,370 16,421 Hillenbrand, Inc. 59 1,836 1,965 Ichor Holdings, Ltd. 123 3,826 4,092 Idex Corporation 30 3,252 5,160
Wilmington Trust Collective Investment Trust
See Notes to the Financial Statements. 13
Multi-Manager Small Cap Growth Fund
Schedule of Investments (continued) December 31, 2019
Principal
Amount or FairShares Cost Value
Common Stocks - 86.6% (continued)Industrial - 14.3% (continued)
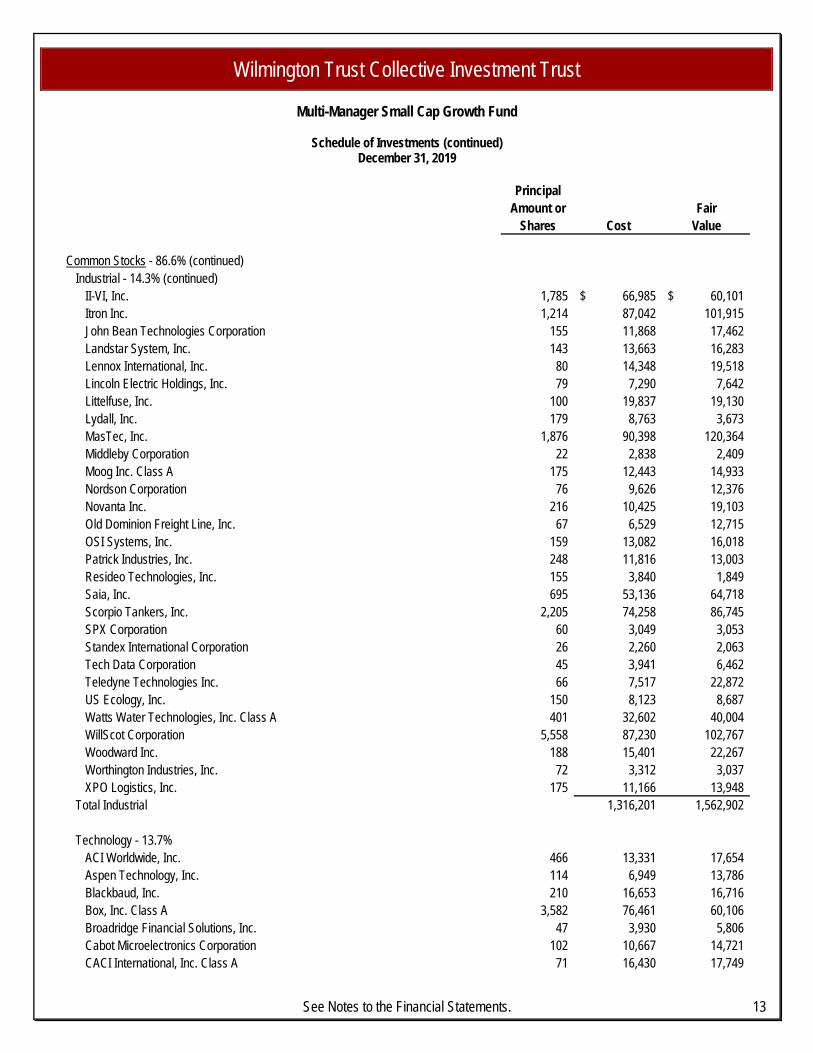
II-VI, Inc. 1,785 66,985$ 60,101$ Itron Inc. 1,214 87,042 101,915 John Bean Technologies Corporation 155 11,868 17,462 Landstar System, Inc. 143 13,663 16,283 Lennox International, Inc. 80 14,348 19,518 Lincoln Electric Holdings, Inc. 79 7,290 7,642 Littelfuse, Inc. 100 19,837 19,130 Lydall, Inc. 179 8,763 3,673 MasTec, Inc. 1,876 90,398 120,364 Middleby Corporation 22 2,838 2,409 Moog Inc. Class A 175 12,443 14,933 Nordson Corporation 76 9,626 12,376 Novanta Inc. 216 10,425 19,103 Old Dominion Freight Line, Inc. 67 6,529 12,715 OSI Systems, Inc. 159 13,082 16,018 Patrick Industries, Inc. 248 11,816 13,003 Resideo Technologies, Inc. 155 3,840 1,849 Saia, Inc. 695 53,136 64,718 Scorpio Tankers, Inc. 2,205 74,258 86,745 SPX Corporation 60 3,049 3,053 Standex International Corporation 26 2,260 2,063 Tech Data Corporation 45 3,941 6,462 Teledyne Technologies Inc. 66 7,517 22,872 US Ecology, Inc. 150 8,123 8,687 Watts Water Technologies, Inc. Class A 401 32,602 40,004 WillScot Corporation 5,558 87,230 102,767 Woodward Inc. 188 15,401 22,267 Worthington Industries, Inc. 72 3,312 3,037 XPO Logistics, Inc. 175 11,166 13,948
Total Industrial 1,316,201 1,562,902
Technology - 13.7%ACI Worldwide, Inc. 466 13,331 17,654 Aspen Technology, Inc. 114 6,949 13,786 Blackbaud, Inc. 210 16,653 16,716 Box, Inc. Class A 3,582 76,461 60,106 Broadridge Financial Solutions, Inc. 47 3,930 5,806 Cabot Microelectronics Corporation 102 10,667 14,721 CACI International, Inc. Class A 71 16,430 17,749

Wilmington Trust Collective Investment Trust
See Notes to the Financial Statements. 14
Multi-Manager Small Cap Growth Fund
Schedule of Investments (continued) December 31, 2019
Principal
Amount or FairShares Cost Value
Common Stocks - 86.6% (continued)Technology - 13.7% (continued)
Ceridian HCM Holding Inc. 221 11,626$ 15,001$ Cirrus Logic, Inc. 198 12,059 16,317 Commvault Systems, Inc. 177 10,674 7,901 Computer Modelling Group Ltd. 105 774 666 Cornerstone OnDemand, Inc. 860 33,148 50,353 CyberArk Software, Ltd. 900 102,312 104,922 Entegris Inc. 494 18,001 24,744 Envestnet Inc. 254 12,221 17,686 Exlservice Holdings, Inc. 1,396 83,224 96,966 Fair Isaac Corporation 94 12,710 35,220 Five9, Inc. 735 25,793 48,201 Fortinet, Inc. 72 3,298 7,687 J2 Global, Inc. 117 8,362 10,964 Manhattan Associates, Inc. 178 9,236 14,196 MAXIMUS, Inc. 1,061 67,627 78,928 MaxLinear, Inc. 530 14,192 11,247 Mellanox Technologies Ltd. 199 15,885 23,319 MKS Instruments, Inc. 199 20,080 21,892 Monolithic Power Systems, Inc. 113 16,657 20,116 NCR Corporation 327 12,193 11,497 Onto Innovation Inc. 129 3,788 4,714 Pegasystems, Inc. 217 10,591 17,284 PlayAGS, Inc. 6,080 95,416 73,750 PTC Inc. 49 2,960 3,670 Qualys, Inc. 1,172 96,810 97,710 RealPage, Inc. 2,101 116,546 112,929 Sapiens International Corporation N.V. 108 2,119 2,484 Science Applications International Corporation 1,022 80,719 88,935 SS&C Technologies Holdings, Inc. 235 9,219 14,429 Take-Two Interactive Software, Inc. 115 7,359 14,079 The Descartes Systems Group Inc 160 4,000 6,835 Tyler Technologies Inc. 56 9,597 16,801 Ubiquiti Inc. 85 10,139 16,063 Verint Systems, Inc. 2,094 104,582 115,924 VirtUsa Corporation 2,613 107,112 118,447 Zebra Technologies Corporation Class A 93 12,046 23,756
Total Technology 1,307,496 1,492,171

Wilmington Trust Collective Investment Trust
See Notes to the Financial Statements. 15
Multi-Manager Small Cap Growth Fund
Schedule of Investments (continued) December 31, 2019
Principal
Amount or FairShares Cost Value
Common Stocks - 86.6% (continued)Utilities - 0.2%
Middlesex Water Company 112 6,962$ 7,120$ Ormat Technologies, Inc. 206 12,630 15,351
Total Utilities 19,592 22,471 Total Common Stocks 8,449,399 9,440,440
Limited Partnership Unit - 1.1%Fortress Transportation and Infrastructure Investors LLC 5,953 105,835 116,322
Real Estate Investment Trust - 0.7%Medical Properties Trust, Inc. 3,746 51,163 79,078
Money Market Fund - 2.5%State Street Institutional U.S. Government Money Market Fund 271,278 271,278 271,278
Total Investments - 99.7% 9,811,058$ 10,861,309 Other Assets and Liabilities, Net - 0.3% 30,480 Net Assets - 100% 10,891,789$
The following is a summary of the fair value of the investments in the Fund based on the inputs used to value them as of December 31, 2019 (see Note 3):
Level 1 Level 2 Level 3 Total
Collective Fund measured atnet asset value* -$ -$ -$ 954,191$
Common Stocks 9,440,440 - - 9,440,440 Limited Partnership Unit 116,322 - - 116,322 Real Estate Investment Trust 79,078 - - 79,078 Money Market Fund 271,278 - - 271,278 Total 9,907,118$ -$ -$ 10,861,309$
Fair Value Measurements
*Certain investments that are measured at fair value using the net asset value per share (or its equivalent) as a practical expedient have not been categorized in the fair value hierarchy. The fair value amounts presented in this table are intended to permit reconciliation of the fair value hierarchy to the amounts presented in the Statement of Assets and Liabilities.

Wilmington Trust Collective Investment Trust
See Notes to the Financial Statements. 16
Multi-Manager Small Cap Growth Fund
Schedule of Investments (continued) December 31, 2019
Supplementary Information: Total investment purchases, sales proceeds, and realized gain for the year ended December 31, 2019, were:
Purchases Sales Realizedat Cost Proceeds Gain
Investments 12,859,155$ 18,040,934$ 198,902$

Wilmington Trust Collective Investment Trust
Multi-Manager Small Cap Growth Fund
Notes to the Financial Statements
December 31, 2019
17
Note 1 – Organization Wilmington Trust Collective Investment Trust (the "Trust") is intended to constitute an exempt trust under Section 501(a) of the Internal Revenue Code of 1986, as amended (the "Code"), and a group trust within the meaning of Rev. Rul. 81-100, as clarified and amended. The Trust is exempt from registration under the Investment Company Act of 1940, as amended, and the Securities Act of 1933, as amended. Wilmington Trust, N.A. ("WTNA" or the "Trustee") serves as the Trustee of the Trust. The Trustee is responsible for maintaining and administering the Trust and the Multi-Manager Small Cap Growth Fund (the "Fund") and also serves as the investment adviser (the "Investment Adviser") to the Fund. M&T Bank Corporation is the ultimate parent of the Trustee. State Street Bank and Trust Company provides custody and transfer agency services for the Trust and the Fund. The purpose of the Trust is to allow collective investments by plan sponsors of retirement plans which qualify for exemption from federal income taxation pursuant to Section 501(a) of the Code, by reason of qualifying under Section 401(a) of the Code; tax-exempt governmental plans under Section 414(d) or Section 818(a)(6) of the Code; eligible deferred compensation plans under Section 457(b) of the Code established by a government employer; group trusts or separate accounts consisting solely of assets of the foregoing; and other investors eligible for participation in the Trust. The Trust consists of separate funds with differing investment objectives, which are available for investment by participating plans. An eligible plan may join the Trust, subject to the Trustee's acceptance, and become a participating plan by executing participation documents specified by the Trustee. Not all funds within the Trust are presented herein. The Fund consists of three active sleeves and a passive index fund sleeve (the "sleeves"), each of which maintain its own separate investment guidelines and restrictions. The passive sleeve invests in the BlackRock Russell 2000®
Growth Fund F, a collective investment fund managed by BlackRock Institutional Trust Company, N.A. (the "Underlying Fund Manager"). The investment objective of the Fund is to generate a total return in excess of the Russell 2000® Growth Index benchmark over a full market cycle. WTNA has engaged AMI Asset Management Corporation and Falcon Point Capital, LLC as model portfolio providers for two of the active sleeves and T. Rowe Price Associates, Inc. as sub-advisor to the third active sleeve (the "Sub-Advisors") to provide investment advice and recommendations with respect to investment of the Fund's assets. While the Trustee generally relies on the Sub-Advisors to manage the Fund's assets, the Trustee maintains ultimate fiduciary authority over the management of and investments made in the Fund. The Sub-Advisors are engaged pursuant to a sub-advisory agreement. Note 2 – Significant Accounting Policies The financial statements have been prepared in conformity with accounting principles generally accepted in the United States of America ("U.S. GAAP"). The Fund is an investment company and follows the accounting and reporting guidance in Financial Accounting Standards Board ("FASB") Accounting Standards Codification ("ASC") Topic No. 946.

Wilmington Trust Collective Investment Trust
Multi-Manager Small Cap Growth Fund
Notes to the Financial Statements (continued)
December 31, 2019
18
Net Asset Value ("NAV") – Units of each fee class of the Fund are valued each day on which the New York Stock Exchange ("NYSE") is open for trading in accordance with the valuation procedures established by the Trustee. The NAV per unit is calculated as of the close of trading on the NYSE (generally, 4:00 p.m. U.S. Eastern time). The NAV per unit is computed by dividing the total fair value of the assets of a Fund, less its liabilities, by the total number of units outstanding at the time of such computation. Investment income earned is reinvested in the Fund and included in the determination of unit values. Fund Unit Transactions – The Fund sells new units and repurchases outstanding units on a daily basis. Unit purchases and redemptions are transacted at the NAV per fee class of the Fund determined as of the close of business each day. A summary of the Fund unit activity for the Fund is included with its Financial Highlights. The Fund requires the plan sponsor to provide advance written notice of five business days for withdrawals which will exceed $1 million or 10% of the assets invested in the Fund. Investment Valuation – Investments are valued at their current fair value determined as follows:
Investments in Collective Funds – The Fund may hold investments in units of other funds within the Trust or similar funds for which other unrelated entities are trustee. The Trustee or unrelated trustee estimates the fair value of investments in collective funds that have calculated net asset value per unit in accordance with the specialized accounting guidance for investment companies. Accordingly, as a practical expedient, investments in other such funds are valued at their net asset value as reported by the investee funds. The Fund has the ability to redeem its investments in the collective funds at net asset value without restrictions. Where one fund invests in another fund within the Trust, the Trustee fee allocated to the investment by such investee fund is waived. Money Market Funds – Investments in money market funds are valued at the daily closing net asset value of the respective fund. Securities – Securities, other than bonds, listed on a securities exchange, market or automated quotation system for which quotations are readily available are valued at the closing price on the primary exchange or market on which they are traded on the day of valuation or, if there is no such reported sale on the valuation date, at the most recent bid quotation on the principal exchange. If a market price is not readily available or if such price is deemed unreliable, it will be valued at fair value in accordance with valuation procedures established by the Trustee. The Trustee's determination of fair value involves consideration of a number of subjective factors, and therefore, no single standard for determining fair value will apply.
When the valuation methods described above are not reflective of fair value, investments are valued at fair value following procedures and/or guidelines determined by or under the direction of the valuation committee established by the Trustee. In light of the judgment involved in fair value decisions, there can be no assurance that a fair value assigned to a particular investment is accurate. Cash and Cash Equivalents – The Fund considers all highly liquid instruments with original maturities of three months or less at the acquisition date to be cash equivalents. Foreign Currency Translation – The accounting records of the Fund are maintained in U.S. dollars. Investment securities and other assets and liabilities denominated in foreign currencies are translated daily into U.S. dollars using foreign currency exchange rates determined as of the close of regular trading on the NYSE. Purchases and

Wilmington Trust Collective Investment Trust
Multi-Manager Small Cap Growth Fund
Notes to the Financial Statements (continued)
December 31, 2019
19
sales of Fund securities, commitments under forward foreign currency contracts and income receipts are translated at the prevailing exchange rate as of the date of each transaction. Realized and unrealized gain or loss on the translation of foreign currency denominated investments is included as a component of net realized and unrealized gain or loss on investments in the Statements of Operations. Realized gain or loss on foreign currency transactions may include gains and losses from sales and maturities of foreign currency exchange contracts, gains and losses realized between the trade and settlement dates of foreign security transactions or the difference between the amount of net investment income accrued on foreign securities and the U.S. dollar amount actually received. Unrealized gain or loss on foreign currency transactions include gains and losses due to changes in the value of assets and liabilities, other than Fund securities, resulting from changes in exchange rates. Certain foreign exchange gains and losses included in realized and unrealized gains and losses are included in or are a reduction of ordinary income in accordance with U.S. federal income tax regulations. Investment Transactions and Investment Income – The Fund records security transactions on a trade date basis. Dividend income is recorded on the ex-dividend date. Net realized gains and losses on investments are determined by the first-in, first-out method. Interest income and expenses are recorded daily on the accrual basis. Fee Classes and Allocations – The Fund offers multiple fee classes. Not all fee classes are available for investment by all plans. Each class is allocated expenses on the basis of expense loads assigned to that class. Income, expenses (other than expenses attributable to a specific class), and realized and unrealized gains or losses on investments are allocated to each unit class based on the units outstanding for the fee class in proportion to the total outstanding units. Use of Estimates – The preparation of financial statements in conformity with U.S. GAAP requires management to make estimates and assumptions that affect the amounts reported in the financial statements and accompanying notes. Actual results could differ from those estimates. Guarantees and Indemnifications – Under the Fund's organizational documents, each trustee, officer, employee and agent of the Trust is indemnified, to the extent permitted by law, against certain liabilities that may arise in the performance of their duties to the Fund. Additionally, in the normal course of business, the Fund enters into contracts that contain a variety of indemnification clauses. The Fund's maximum exposure under these arrangements is unknown as this would involve future claims that may be made against the Fund that have not yet occurred. However, the Fund has not had prior claims or losses pursuant to these contracts and the Trustee believes the risk of loss to be remote. Income Tax Status – The Trust has received a determination from the Internal Revenue Service that the Trust is exempt from federal income taxation under Section 501(a) of the Code. Accordingly, no federal income tax provision is required. Subsequent Events – The Trustee has evaluated the effect of subsequent events on the Fund's financial statements through April 29, 2020, which is the date the financial statements were available to be issued, and has determined that there are no material subsequent events, except as noted below, that would require disclosure or adjustment in the Fund's financial statements through this date.

Wilmington Trust Collective Investment Trust
Multi-Manager Small Cap Growth Fund
Notes to the Financial Statements (continued)
December 31, 2019
20
During the first quarter of 2020, there were worldwide outbreaks of the coronavirus. The impact of these outbreaks, as well as other epidemics and pandemics that may arise in the future, could negatively affect the domestic and international economies, individual companies and the market in general in significant and unforeseen ways. Any such impact could adversely affect the performance of the securities in which the Fund is invested and the investment performance of the Fund. Effective May 1, 2020, the Multi-Manager Small Cap Growth Fund will be restructured to eliminate the multi-manager approach and fund sleeves and the Fund will be renamed as the WTNA Small Cap Growth Select Fund. Note 3 – Fair Value Measurements Fair value is defined as the price a fund would receive to sell an asset or pay to transfer a liability in an orderly transaction between market participants at the measurement date. Various inputs are used in determining the fair value of the Fund's investments. The Trustee has performed an analysis of the significance and character of these inputs to the fair value determination. These inputs are summarized in the three broad levels listed below:
• Level 1 – Quoted prices in active markets for identical investments.
• Level 2 – Other significant observable inputs (including quoted prices for similar investments, interest rates, credit risk, and others).
• Level 3 – Significant unobservable inputs (including the Trustee's own assumptions in determining the fair value of investments).
The inputs or methodology used for valuing investments are not necessarily an indication of the risk associated with investing in those investments. A summary of the inputs used as of December 31, 2019, in valuing the Fund's assets carried at fair value is included in Note 2. The aggregate fair value of the investments in the Fund, by input level used as of December 31, 2019, is included following the Fund's Schedule of Investments. The Financial Accounting Standards Board ("FASB") issued Accounting Standards Update ("ASU") 2018-13, Fair Value Measurement (Topic 820) – Disclosure Framework – Changes to the Disclosure Requirements for Fair Value Measurement. ASU 2018-13 modifies the disclosure requirements in Topic 820. The Fund elected to early adopt ASU 2018-13, effective December 31, 2019.

Wilmington Trust Collective Investment Trust
Multi-Manager Small Cap Growth Fund
Notes to the Financial Statements (continued)
December 31, 2019
21
Note 4 – Fees and Expenses Trustee, Estimated Blended Sub-Advisory and Underlying Fund Management, and Service Provider Fees All asset-based fees are based upon the net assets as determined at the end of each preceding business day as set forth in the table below (in basis points). Except as otherwise noted, all asset-based fees are paid from the assets of the Fund.
Fee Class
Trustee Fee
Estimated Blended Sub-Advisory and Underlying Fund Management Fees
Service Provider Fee
Class 0IM 3 0 0 Class 45 13 43 (1) 45 Class 60 13 43 (1) 60 Class R 13 43 (1) 0 Class R6 10 43 (1) 0
(1) Table shows fees on the first $250 million only. Certain Sub-Advisory fees are reduced when the Sub-Advisor sleeve value
exceeds $250 million. Trustee Fee – The Trustee receives an annual fee for trustee and administrative services provided to the Fund. Trustee fees, except as noted below with respect to Class 0IM, are based upon the average daily value of the Fund and are accrued daily, paid quarterly in arrears and charged against the assets invested in the Fund. Such Trustee fees for the year ended December 31, 2019, are included in the Statement of Operations for the Fund. Plans invested in Class 0IM have agreed to pay external fees that are paid either by redemption of Fund units or paid directly by the plan sponsor. Portions of external fees are paid to the Sub-Advisors and Underlying Fund Manager for investment advisory services provided to the respective fund sleeve. External fees are based on the fair value as of the last business day of the previous month end and paid monthly in advance. Sub-Advisory and Underlying Fund Management Fees – The Sub-Advisors and Underlying Fund Manager are compensated for their investment advisory services provided to the Fund. Management fees for each class, except as noted below with respect to Class 0IM, are based upon the average daily value of the Fund and are accrued daily, paid quarterly in arrears and charged against the assets invested in the Fund. Plans in Class 0IM (or their plan sponsors) pay a management fee to the Sub-Advisors and Managers of the underlying funds of 43 basis points based on the month-end values of the Fund. These fees are reflected in the Fund's gross expense ratio. Service Provider Fee – Service provider fees, if any, are used to compensate other service providers to the Fund, including brokers and financial intermediaries and other parties providing services to retirement plans participating in the Fund. Service provider fees may also be paid to plan service providers, such as third-party administrators and recordkeepers that provide sub-transfer agency, recordkeeping and other administrative services to participating plans invested in the Fund.

Wilmington Trust Collective Investment Trust
Multi-Manager Small Cap Growth Fund
Notes to the Financial Statements (continued)
December 31, 2019
22
Operating Expenses – In addition to the fees described above, the Fund bears expenses related to its operation, including, but not limited to, audit, custody, tax and legal services. Expenses incurred in connection with the investment and reinvestment of Fund assets, including, without limitation, transfer agency fees, brokerage commission and other expenses, are also charged against the Fund. When assets of the Fund are invested in other investment vehicles, such as other collective funds or Exchange-Traded Funds, those investment vehicles will incur fees and expenses, which will be reflected in the operating results and value of the Fund's investment in such investment vehicle, and are separate and distinct from the fees and expenses of the Fund described above. Note 5 – Related Party Transactions The Trustee is a national bank that provides trust and custodial services for tax-advantaged retirement plans as well as trust and investment services to business pension and retirement plans. The Trustee is responsible for managing the Trust's investment and business affairs. Note 6 – Risks Associated with Investing in the Fund In the normal course of business, the Fund trades financial instruments and enters into financial transactions where risk of potential loss exists due to changes in the fair value of the investments. The principal risks associated with investing in the Fund are:
• Growth Investing. Growth securities may be subject to increased volatility as the value of these securities is highly sensitive to market fluctuations and future earnings expectations. These securities typically trade at higher multiples of current earnings than do other securities and may lose value if it appears their earnings expectations may not be met.
• Industry and Sector Investing. Concentrating assets in a particular industry, sector of the economy, or
markets may increase volatility because the investment will be more susceptible to the impact of market, economic, regulatory, and other factors affecting that industry or sector compared with a more broadly diversified asset allocation.
• Issuer. A stake in any individual security is subject to the risk that the issuer of that security performs poorly,
resulting in a decline in the security's value. Issuer-related declines may be caused by poor management decisions, competitive pressures, technological breakthroughs, reliance on suppliers, labor problems or shortages, corporate restructurings, fraudulent disclosures, or other factors. Additionally, certain issuers may be more sensitive to adverse issuer, political, regulatory, market, or economic developments.
• Management. Performance is subject to the risk that the sub-advisor's asset allocation and investment
strategies do not perform as expected, which may cause the Fund to underperform its benchmark, other investments with similar objectives, or the market in general. The investment is subject to the risk of loss of income and capital invested, and the sub-advisor does not guarantee its value, performance, or any particular rate of return.

Wilmington Trust Collective Investment Trust
Multi-Manager Small Cap Growth Fund
Notes to the Financial Statements (continued)
December 31, 2019
23
• Market/Market Volatility. The market value of the Fund's securities may fall rapidly or unpredictably because of changing economic, political, or market conditions, which may reduce the value of the Fund.
• Multi-Manager. Multi-Manager Funds consist of multiple specialized "sleeves," each holding investments recommended by different sub-advisors. The sleeves' individual investing styles may not complement each other. This can result in both higher portfolio turnover and enhanced or reduced concentration in a particular region, country, industry, or investing style compared with an investment in a single sub-advised fund.
• Small Cap. Concentrating assets in small-capitalization stocks may subject the Fund to the risk that those stocks underperform other capitalizations or the market as a whole. Smaller, less-seasoned companies may be subject to increased liquidity risk compared with mid- and large-cap companies.