WILLPLUS Holdings Corporationfisco.jp/news/pdf/willplus20200403_e.pdfprofit growing 32.4% due to...
FISCO Ltd. http://www.fisco.co.jp COMPANY RESEARCH AND ANALYSIS REPORT FISCO Ltd. Analyst Ken Segawa WILLPLUS Holdings Corporation 3538 Tokyo Stock Exchange First Section 3-Apr.-2020
Transcript of WILLPLUS Holdings Corporationfisco.jp/news/pdf/willplus20200403_e.pdfprofit growing 32.4% due to...

FISCO Ltd.
http://www.fisco.co.jp
COMPANY RESEARCH AND ANALYSIS REPORT
FISCO Ltd. Analyst
Ken Segawa
WILLPLUS Holdings Corporation3538
Tokyo Stock Exchange First Section
3-Apr.-2020

COMPANY RESEARCH AND ANALYSIS REPORT
FISCO Ltd.
http://www.fisco.co.jp
3-Apr.-2020WILLPLUS Holdings Corporation3538 Tokyo Stock Exchange First Section https://www.willplus.co.jp/en/ir/
02
We encourage readers to review our complete legal statement on “Disclaimer” page.
■Summary --------------------------------------------------------------------------------------------------------------------------------------------------------------------------- 01
1. Company profile . . . . . . . . . . . . . . . . . . . . . . . . . . . . . . . . . . . . . . . . . . . . . . . . . . . . . . . . . . . . . . . . . . . . . . . . . . . . . . . . . . . . . . . . . . . . . . . . . . . . . . . . . . . . . . . . . . . . . . . . . . . . . . . . . . . . . . . . . . 01
2. Overview of 1H FY6/20 . . . . . . . . . . . . . . . . . . . . . . . . . . . . . . . . . . . . . . . . . . . . . . . . . . . . . . . . . . . . . . . . . . . . . . . . . . . . . . . . . . . . . . . . . . . . . . . . . . . . . . . . . . . . . . . . . . . . . . . . . . . . . . . 01
3. FY6/20 outlook.. . . . . . . . . . . . . . . . . . . . . . . . . . . . . . . . . . . . . . . . . . . . . . . . . . . . . . . . . . . . . . . . . . . . . . . . . . . . . . . . . . . . . . . . . . . . . . . . . . . . . . . . . . . . . . . . . . . . . . . . . . . . . . . . . . . . . . . . . . . 01
4. Business strategies . . . . . . . . . . . . . . . . . . . . . . . . . . . . . . . . . . . . . . . . . . . . . . . . . . . . . . . . . . . . . . . . . . . . . . . . . . . . . . . . . . . . . . . . . . . . . . . . . . . . . . . . . . . . . . . . . . . . . . . . . . . . . . . . . . . . . 02
■Company profile --------------------------------------------------------------------------------------------------------------------------------------------------------- 03
1. Company profile . . . . . . . . . . . . . . . . . . . . . . . . . . . . . . . . . . . . . . . . . . . . . . . . . . . . . . . . . . . . . . . . . . . . . . . . . . . . . . . . . . . . . . . . . . . . . . . . . . . . . . . . . . . . . . . . . . . . . . . . . . . . . . . . . . . . . . . . . . 03
2. History . . . . . . . . . . . . . . . . . . . . . . . . . . . . . . . . . . . . . . . . . . . . . . . . . . . . . . . . . . . . . . . . . . . . . . . . . . . . . . . . . . . . . . . . . . . . . . . . . . . . . . . . . . . . . . . . . . . . . . . . . . . . . . . . . . . . . . . . . . . . . . . . . . . . . . . . 03
3. Description of business . . . . . . . . . . . . . . . . . . . . . . . . . . . . . . . . . . . . . . . . . . . . . . . . . . . . . . . . . . . . . . . . . . . . . . . . . . . . . . . . . . . . . . . . . . . . . . . . . . . . . . . . . . . . . . . . . . . . . . . . . . . . . . . 04
■Business strategies ------------------------------------------------------------------------------------------------------------------------------------------------ 06
1. Trends in the automotive market in Japan .. . . . . . . . . . . . . . . . . . . . . . . . . . . . . . . . . . . . . . . . . . . . . . . . . . . . . . . . . . . . . . . . . . . . . . . . . . . . . . . . . . . . . . . . . . . . . . . . . . 06
2. Growth strategies . . . . . . . . . . . . . . . . . . . . . . . . . . . . . . . . . . . . . . . . . . . . . . . . . . . . . . . . . . . . . . . . . . . . . . . . . . . . . . . . . . . . . . . . . . . . . . . . . . . . . . . . . . . . . . . . . . . . . . . . . . . . . . . . . . . . . . . . 08
■Performance trends ------------------------------------------------------------------------------------------------------------------------------------------------ 13
1. Overview of 1H FY6/20 . . . . . . . . . . . . . . . . . . . . . . . . . . . . . . . . . . . . . . . . . . . . . . . . . . . . . . . . . . . . . . . . . . . . . . . . . . . . . . . . . . . . . . . . . . . . . . . . . . . . . . . . . . . . . . . . . . . . . . . . . . . . . . . 13
2. Financial condition and performance indicators . . . . . . . . . . . . . . . . . . . . . . . . . . . . . . . . . . . . . . . . . . . . . . . . . . . . . . . . . . . . . . . . . . . . . . . . . . . . . . . . . . . . . . . . . . 14
■Outlook ------------------------------------------------------------------------------------------------------------------------------------------------------------------------------- 16
• FY6/20 outlook.. . . . . . . . . . . . . . . . . . . . . . . . . . . . . . . . . . . . . . . . . . . . . . . . . . . . . . . . . . . . . . . . . . . . . . . . . . . . . . . . . . . . . . . . . . . . . . . . . . . . . . . . . . . . . . . . . . . . . . . . . . . . . . . . . . . . . . . . . . . 16
■Shareholder returns ------------------------------------------------------------------------------------------------------------------------------------------------ 18
1. Dividend policy . . . . . . . . . . . . . . . . . . . . . . . . . . . . . . . . . . . . . . . . . . . . . . . . . . . . . . . . . . . . . . . . . . . . . . . . . . . . . . . . . . . . . . . . . . . . . . . . . . . . . . . . . . . . . . . . . . . . . . . . . . . . . . . . . . . . . . . . . . . 18
2. Shareholder Benefits Program .. . . . . . . . . . . . . . . . . . . . . . . . . . . . . . . . . . . . . . . . . . . . . . . . . . . . . . . . . . . . . . . . . . . . . . . . . . . . . . . . . . . . . . . . . . . . . . . . . . . . . . . . . . . . . . . . . . . 18
■ Index

COMPANY RESEARCH AND ANALYSIS REPORT
FISCO Ltd.
http://www.fisco.co.jp
3-Apr.-2020WILLPLUS Holdings Corporation3538 Tokyo Stock Exchange First Section https://www.willplus.co.jp/en/ir/
01 18
01
We encourage readers to review our complete legal statement on “Disclaimer” page.
█ Summary
Achieved major increases in sales and profits in 1H FY6/20 as the investment-recovery period
1. Company profile
WILLPLUS Holdings Corporation <3538> (hereafter, also “the Company”) is a pure holding company with four con-
solidated subsidiaries that are engaged in sales of imported cars. They sell 10 brands, including JEEP, FIAT, BMW,
MINI, VOLVO, and Porsche, through authorized dealerships. The Company manages 32 dealerships, starting with
in Fukuoka Prefecture, where its business originated, as well as in areas including Tokyo and Kanagawa Prefecture.
Also, as its growth strategies, it is developing a multi-brand strategy, a dominant strategy, and an M&A strategy.
The Company is investing in existing dealerships to respond to corporate identify (CI) changes, to relocate to prime
locations, and to improve management efficiency, while at the same time, it is investing in new dealerships to expand
commercial areas, to complement existing areas, and to expand the business scope of existing brands. Moreover,
through M&A, it intends to enter-into new areas, acquire new brands, and increase its market shares of existing
brands. As the M&A take the form of acquiring the businesses of other authorized dealers, it is difficult to incorporate
the numerical values related to them in advance into business plans. To respond in an agile manner at the time an
M&A proposal occurs, investment waves can occur that affect the Company’s short-term earnings, but at FISCO,
we think that it can maintain its medium- to long-term growth trend.
In FY6/18 dealership investment, for the year there was 1 dealership from a new opening, 1 dealership from a
business takeover, and 3 dealerships from renovations, and renovations and relocations. But in FY6/19, this was
expanded to 4 dealerships from new openings, 2 dealerships from business transfers, and 4 dealerships from
renovations, and renovations and relocations. The number of dealerships in this fiscal year increased by 6, compared
to an increase of 2 dealerships in FY6/18.
2. Overview of 1H FY6/20
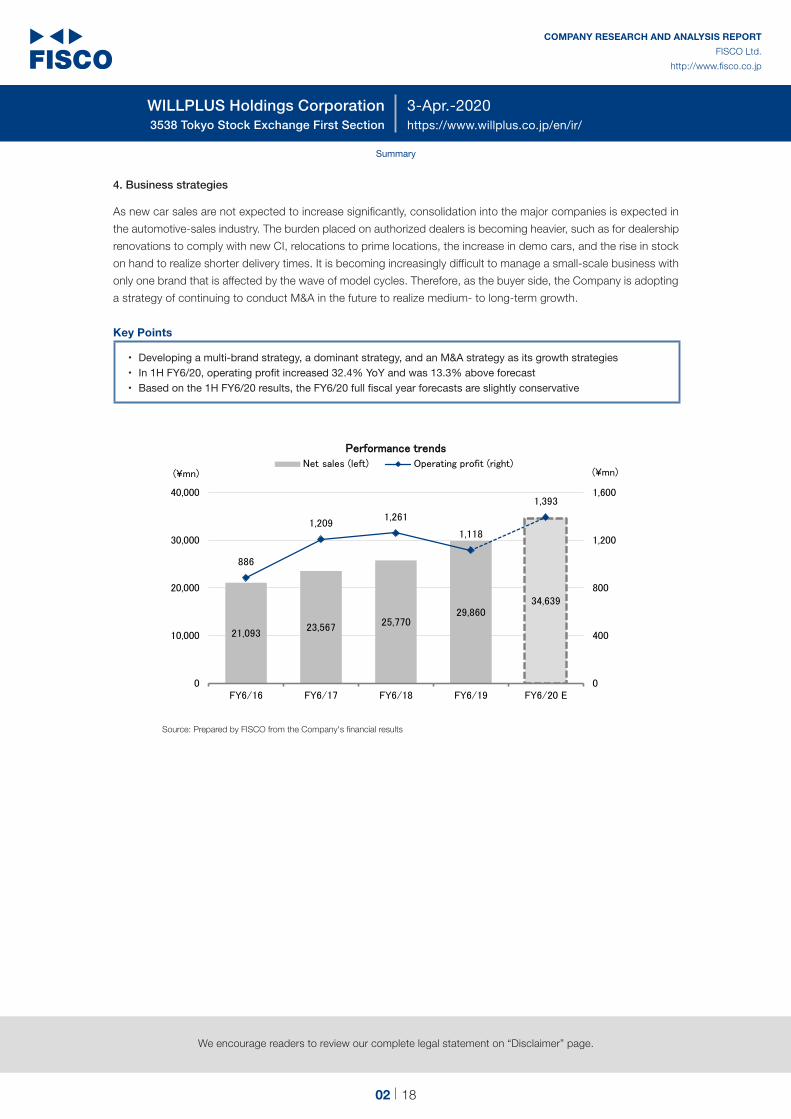
In 1H FY6/20, sales and profits increased significantly, with net sales rising 31.5% year-on-year (YoY) and operating
profit growing 32.4% due to full contribution of the dealerships added in the previous fiscal year. The results were
also strong compared to the initial forecasts, with net sales 7.5% above forecast and operating profit 13.3% above
forecast. Dealership openings in FY6/20 are as follows; in the 1H, 1 dealership from the opening of a renovated MINI
dealership, and 1 dealership from a new opening specializing in used imported cars, which is the Company Group’s
first dealership; and in 3Q, 1 dealership from a newly constructed and relocated MINI dealership opening. Also, in
the Fukuoka and neighboring area, it is implementing a MINI dominant strategy and has increased its presence in
this area.
3. FY6/20 outlook
For the FY6/20 full fiscal year outlook, the Company has left the initial forecasts unchanged, of net sales to increase
16.0% YoY and operating profit to rise 24.6%.To a certain extent the forecasts incorporate the impact of the
consumption tax hike implemented in October 2019, but there have been unexpected factors, like the spread of the
new coronavirus infection. However, if the initial forecasts unchanged, other revenue from vehicle maintenance and
automobile insurance fees, which is a recurring revenue-based business in which revenue accumulates according
to car sales, will decline more in the 2H than the 1H. The product inventory accumulated up to the end of 1H will
become delivered vehicles in the 2H, so it might be said that the full fiscal year forecasts are conservative.
COMPANY RESEARCH AND ANALYSIS REPORT
FISCO Ltd.
http://www.fisco.co.jp
3-Apr.-2020WILLPLUS Holdings Corporation3538 Tokyo Stock Exchange First Section https://www.willplus.co.jp/en/ir/
02 18
02
We encourage readers to review our complete legal statement on “Disclaimer” page.
Summary
4. Business strategies
As new car sales are not expected to increase significantly, consolidation into the major companies is expected in
the automotive-sales industry. The burden placed on authorized dealers is becoming heavier, such as for dealership
renovations to comply with new CI, relocations to prime locations, the increase in demo cars, and the rise in stock
on hand to realize shorter delivery times. It is becoming increasingly difficult to manage a small-scale business with
only one brand that is affected by the wave of model cycles. Therefore, as the buyer side, the Company is adopting
a strategy of continuing to conduct M&A in the future to realize medium- to long-term growth.
Key Points
• Developing a multi-brand strategy, a dominant strategy, and an M&A strategy as its growth strategies• In 1H FY6/20, operating profit increased 32.4% YoY and was 13.3% above forecast• Based on the 1H FY6/20 results, the FY6/20 full fiscal year forecasts are slightly conservative
21,09323,567 25,770
29,86034,639
886
1,2091,261
1,118
1,393
0
400
800
1,200
1,600
0
10,000
20,000
30,000
40,000
FY6/16 FY6/17 FY6/18 FY6/19 FY6/20 E
(¥mn)(¥mn)
PPeerrffoorrmmaannccee ttrreennddss
Net sales (left) Operating profit (right)
Source: Prepared by FISCO from the Company's financial results

COMPANY RESEARCH AND ANALYSIS REPORT
FISCO Ltd.
http://www.fisco.co.jp
3-Apr.-2020WILLPLUS Holdings Corporation3538 Tokyo Stock Exchange First Section https://www.willplus.co.jp/en/ir/
03 18
03
We encourage readers to review our complete legal statement on “Disclaimer” page.
█ Company profile
Handles 10 brands of overseas vehicle manufacturers at 32 dealerships
1. Company profile
The Company is a pure holding company with four consolidated subsidiaries engaged in sales of imported cars sales.
Its 32 dealerships within Japan sell the 10 main brands of Alfa Romeo, FIAT, ABARTH, JEEP, Jaguar, Land Rover,
BMW, MINI, VOLVO, and Porsche. Also, its dealerships are located in Miyagi Prefecture, Fukushima Prefecture,
Tokyo, Kanagawa Prefecture, Yamaguchi Prefecture, and Fukuoka Prefecture.
From its corporate philosophy of “The joy of + in the future,” the Company’s name is derived from “providing the
future together with imported cars (=WILL) and continuing to take on the challenge of being able to propose a ‘joyful
life’ to everyone involved (=PLUS).”
The Company actively opened dealerships in the three-year period from FY6/17 to FY6/19, with 6 dealerships from
new openings, 11 dealerships from renovations, and renovations and relocations, and 4 dealerships from business
takeovers. The compound annual growth rates (CAGR) in the three-year period from FY6/16 to FY6/19 were 12.3%
for net sales and 8.0% for operating profit. Operating profit fell in FY6/19 due to the increase in upfront investment,
but it is forecast to increase 24.6% YoY in FY6/20.
2. History
In 1997, the father of Takaaki Naruse, the current President, established Sunflower CJ in Kitakyushu City, Fukuoka
Prefecture. Soon thereafter, Sunflower CJ acquired a Chrysler (U.S.) dealership and began operating as an official
Chrysler dealer. After engaging in new and used car sales, Takaaki Naruse acquired all the shares of Fukuoka
Chrysler in October 2004 and became independent. He then opened a dealership in Ota Ward, Tokyo in 2005, and
entered-into Tokyo. After that, in 2007 he established WILLPLUS Holdings Corporation.
For its stock-market listing, the Company was listed on the Tokyo Stock Exchange (TSE) JASDAQ (standard) market
in March 2016, which was changed to the TSE 2nd Section in September 2017, and then upgraded to the TSE 1st
Section in February 2018.
Through actively conducting M&A, the Company acquired imported cars sales rights and commercial areas for the
leading brands, and at the same time, it rapidly expanded its dealership network through new dealership openings.
In 2008, it made CHECKER MOTORS CORPORATION a wholly owned subsidiary, starting handling FIAT and
Alfa Romeo, and made a fully-fledged entry into the Kanto area. In 2009, it acquired 2 JEEP dealerships in the
Metropolitan Tokyo area and 5 BMW and MINI dealerships through business takeovers, and in 2014, it made a
wholly owned subsidiary of Teio Auto Corporation, which sells VOLVO vehicles. Also in 2017, it established Willplus
Eins Corporation, which took over the business of Porsche Center Sendai in 2018, thereby handling Porsche and
entering-into the Tohoku area for the first time.

COMPANY RESEARCH AND ANALYSIS REPORT
FISCO Ltd.
http://www.fisco.co.jp
3-Apr.-2020WILLPLUS Holdings Corporation3538 Tokyo Stock Exchange First Section https://www.willplus.co.jp/en/ir/
04 18
04
We encourage readers to review our complete legal statement on “Disclaimer” page.
Company profile
History
Date Business change Brand developmentCommercial area
expansion
October 2007 Established WILLPLUS Holdings Corporation
July 2008Converted CHECKER MOTORS CORPORATION into a wholly-owned subsidiary
Began handling FIAT/Alfa Romeo vehicles
Fully fledged entry into the Kanto area
July 2009Took over 2 directly managed dealerships from Chrysler Japan Co., Ltd.
September 2009Willplus Motoren Corporation took over the businesses of 5 dealerships
Began handling BMW and MINI vehicles
April 2014 Converted Teio Auto Corporation into a wholly-owned subsidiary Began handling VOLVO vehicles
November 2017 Established Willplus Eins Corporation
April 2018 Took over the Jaguar/Land Rover Shonan businessBegan handling Jaguar/Land Rover vehicles
December 2018 Took over the Porsche Center Sendai businessBegan handling the Porsche brand
Entered-into the Tohoku area for the first time
March 2019Opened the new MINI Yamaguchi and MINI NEXT Shunan dealerships
Entered the Chugoku area for the first time
April 2019 Took over the Jaguar/Land Rover Mitaka business
Source: Prepared by FISCO from the Company's securities report and results briefing materials
As of the end of 1H FY6/20, the Company Group is managing 32 dealerships. Breaking them down according to the
consolidated subsidiary managing them, CHECKER MOTORS, which handles Alfa Romeo, FIAT, ABARTH, JEEP,
Jaguar, and Land Rover, is managing 17 dealerships; Willplus Motoren Corporation, which handles BMW and MINI,
is managing 9 dealerships; Teio Auto, which handles VOLVO, is managing 4 dealerships; and Willplus Eins, which
handles Porsche, is managing 2 dealerships.
List of Operating Companies
NameCHECKER MOTORS
CORPORATIONWillplus Motoren
CorporationTeio Auto Corporation Willplus Eins Corporation
Number of dealerships(as of December 31, 2019)
17 9 4 2
Importers
FCA Japan Limited
BMW Japan Corporation Volvo Car Japan Limited Porsche Japan KKJaguar Land Rover Japan Limited
Brands handled
JEEPAlfa Romeo
FIATABARTHJaguar
Land Rover
BMWMINI
VOLVO Porsche
Source: Prepared by FISCO from the Company's results briefing materials
3. Description of business
(1) Business models
As an authorized dealer for the sales of imported cars, the Company purchases new cars from importers (the
Japanese subsidiaries of overseas auto manufacturers), which it then sells. In terms of the details of the importers,
FCA Japan Limited, which is the Japanese subsidiary of the FCA (Fiat Chrysler Automobiles N.V.) Group, handles
the Alfa Romeo, FIAT, and ABARTH brands of Italy and the JEEP brand of the United States. Jaguar Land Rover
Japan Limited handles Jaguar and Land Rover, and BMW Japan Corp. handles BMW and MINI. VOLVO are
handled by Volvo Car Japan Limited and Porsche by Porsche Japan.

COMPANY RESEARCH AND ANALYSIS REPORT
FISCO Ltd.
http://www.fisco.co.jp
3-Apr.-2020WILLPLUS Holdings Corporation3538 Tokyo Stock Exchange First Section https://www.willplus.co.jp/en/ir/
05 18
05
We encourage readers to review our complete legal statement on “Disclaimer” page.
Company profile
The Company purchases used cars at auto auctions and by trade-ins. Also, trade-ins of brands not handled by
the Company are sold at auto auctions. In addition, alongside sales of cars, it sells automobile insurance and
provides after-sales services (maintenance and repairs).
Schematic diagram of the Company Group’s businesses
Source: Prepared by FISCO from the Company's results briefing materials
(2) Percentages of total net sales
In 1H FY6/20, the percentages of total net sales by business were that new cars provided 52.0%, used cars
21.6%, auto auction sales 9.1%, vehicle maintenance 12.5%, and others (insurance, etc.) 4.8%. In terms of
profitability, the most profitable is agency commissions, which is mainly from “others.” For vehicles, due to their
high cost of sales ratio, the profitability of new cars is lower than that of used cars. Auto auction sales are sales
of traded-in cars with brands not handled by the Company Group, and it is working to realize the maximum
trade-ins to secure profits.

COMPANY RESEARCH AND ANALYSIS REPORT
FISCO Ltd.
http://www.fisco.co.jp
3-Apr.-2020WILLPLUS Holdings Corporation3538 Tokyo Stock Exchange First Section https://www.willplus.co.jp/en/ir/
06 18
06
We encourage readers to review our complete legal statement on “Disclaimer” page.
█ Business strategies
The Company’s growth strategies are a multi-brand strategy, a dominant strategy, and an M&A strategy
1. Trends in the automotive market in Japan
Due to the declining birthrate and aging population, the population of Japan peaked in 2008 at 128.08mn people
and is now trending downward. In the estimate for February 2020, the population had declined by slightly more
than 2mn people from its peak to 126.01mn people. It is considered that young people are tending not to buy a
car and elderly people are giving up their driving licenses, but according to the statistics of the Japan Automobile
Manufacturers Association, Inc., at the end of 2017, the number of owned passenger cars, which is the total of
standard-size, small-size, and kei minicars , was 61.804mn, the highest level ever. The number of passenger cars
owned at the end of 2017 had increased by 10.639mn compared to the end of 1999, and on breaking this down,
standard-size cars increased by 5.786mn, small-size cars decreased by 8.366mn, and kei minicars increased by
13.219mn. In terms of the changes in the composition ratio from the end of 1999 to 2017, standard-size cars had
changed from 25.4% to 30.4%, small-size cars from 57.1% to 33.7%, and kei minicars from 17.5% to 35.9%. It
can be said that the purchasing behavior of consumers is polarizing and small-size cars have lost share. Also, for
the kei minicar standards, the engine capacity was increased from 360cc to 550cc, and furthermore to 660cc, while
the total body length was increased from 3 meters to 3.4 meters, and the total width increased from 1.3 meters to
1.48 meters. So pragmatic consumers are tending toward owning kei minicars, while people who prioritize hobbies,
lifestyle, and values are tending toward owning standard-size cars.
1,301.4 1,704.0 1,880.0
2,920.9 2,314.4 2,084.3
894.2 1,848.7 2,216.1
55,,111166..55
55,,886677..11 66,,118800..44
0.0
1,000.0
2,000.0
3,000.0
4,000.0
5,000.0
6,000.0
7,000.0
(10,000 cars)
CChhaannggeess iinn vveehhiicclleess ((ppaasssseennggeerr ccaarrss)) aanndd oowwnneerrsshhiipp aatt eenndd ooff ppeerriioodd
Standard-size car Small-size car Kei minicars
Source: prepared by FISCO from “Automobile Statistics Monthly" (Japan Automobile Manufacturers Association, Inc.)

COMPANY RESEARCH AND ANALYSIS REPORT
FISCO Ltd.
http://www.fisco.co.jp
3-Apr.-2020WILLPLUS Holdings Corporation3538 Tokyo Stock Exchange First Section https://www.willplus.co.jp/en/ir/
07 18
07
We encourage readers to review our complete legal statement on “Disclaimer” page.
Business strategies
New car sales are affected by factors including the economy, interest rates, and the launch dates of new models.
The number of new registrations of passenger cars peaked at 4.768mn in 2004, and registrations fell below 4mn to
3.924mn due to the impact of the Lehman Shock in 2009. In 2011 when the Great East Japan Earthquake occurred,
registrations declined to as low as 3.525mn. Subsequently, they recovered to the 4mn level and were 4.301mn in
2019. Breaking down the new registrations of passenger cars, on comparing 1999 and 2019, standard-size cars
trended from 17.4% to 36.9%, small-size cars from 52.8% to 28.7%, and kei minicars from 29.8% to 34.4%, so it
would appear that the share of small-size cars has fallen significantly.
72.4 114.0
158.6
219.4 124.6
123.6
123.6
113.9
147.9
441155..44
447766..88
335522..55
447700..00
443300..11
0.0
100.0
200.0
300.0
400.0
500.0
(10,000 cars)
TTrreennddss iinn nneeww rreeggiissttrraattiioonnss ooff vveehhiicclleess
((ppaasssseennggeerr ccaarrss))Standard-size carSmall-size carKei minicars
2014/4
Consumption
tax hike
(5%→8%)
2019/10
Consumption
tax hike
(8%→10%)
Source: prepared by FISCO from “Automobile Statistics Monthly" (Japan Automobile Manufacturers Association, Inc.)
The number of newly registered imported cars (overseas manufacturers) declined from 271,000 in 1999 to 168,000
in 2009 after the Lehman Shock, but subsequently recovered to 326,000 in 2019. The share of imported passenger
cars of all registered cars (standard- and small-size passenger cars) not including Japan’s proprietary kei minicar
standard, was 9.3% in 1999, 6.4% in 2009, and 11.6% in 2019. The share of imported cars in Germany, which has
the world’s largest auto manufacturer VW, the luxury car brand Mercedes-Benz, and BMW, which is also a popular
brand in Japan, is high at 39.2%, while in the US it is 23.2% and in Italy 73.5%. Therefore, the Company Group
considers there is considerable room for the share of imported cars in Japan to grow.

COMPANY RESEARCH AND ANALYSIS REPORT
FISCO Ltd.
http://www.fisco.co.jp
3-Apr.-2020WILLPLUS Holdings Corporation3538 Tokyo Stock Exchange First Section https://www.willplus.co.jp/en/ir/
08 18
08
We encourage readers to review our complete legal statement on “Disclaimer” page.
Business strategies
27.1
16.8
32.6
9.3
6.4
11.6
0.0
2.0
4.0
6.0
8.0
10.0
12.0
14.0
0.0
5.0
10.0
15.0
20.0
25.0
30.0
35.0
(%)(10,000 cars)
TTrreennddss iinn tthhee nnuummbbeerr ooff nneeww rreeggiissttrraattiioonnss ooff iimmppoorrtteedd ppaasssseennggeerr ccaarrss
aanndd tthheeiirr sshhaarreeNumber of new registrations of imported passenger cars (left)Share (right)
Note : the share of imported cars is the percentage of imported passenger cars of all registered passenger cars (not including kei minicars).
Source: prepared by FISCO from the data of the Japan Automobile Importers Association and the Japan Automobile Dealers Association
2. Growth strategies
The Company’s growth strategies are (1) a multi-brand strategy, (2) a dominant strategy, and (3) an M&A strategy.
(1) Multi-brand strategy
The Company Group is adopting a multi-brand strategy and it handles 10 brands. In the past, the pattern for
vehicle-model changes was a minor change after 2 years and a full model change after 4 years. But recently, the
time for a full model change has lengthened to 6 to 7 years. This is because new car development has become
mainly focused on exhaust gas standards and installing safety equipment, such as ADAS (Advanced Driver
Assistance Systems), rather than on driving performance, and also as the interests of consumers has shifted to
design, comfort, and safety, rather than fuel-efficiency competitiveness on catalogs. Although the sales-volume
wave has become smaller due to this lengthening of the cycle, sales are affected by the decline in sales at the
end of a model’s period and the launches of new competing models. By handling 10 brands, the Company is
aiming to level out the fluctuations in sales cycles caused by model changes by cancelling out the differences in
the timing of the launches of new models between the brands.
In the ranking of the number of new registrations of cars of overseas manufacturers in 2019 (calendar year), all of
the 10 brands that the Company handles were in the top 20. Its standards for selecting a brand are 1) the potential
to become a major dealer among the brands and 2) strong brand power that can be expected to realize constant
sales. The Company is targeting more than 9 brands which it does not handle. Generally, importers, which are
the Japanese subsidiaries of overseas manufacturers, gives sales rights to the dealers in each area based on the
dealer contract and conduct sales. However, as many areas are already filled, an M&A strategy of acquiring or
taking over the businesses of existing dealers is important.

COMPANY RESEARCH AND ANALYSIS REPORT
FISCO Ltd.
http://www.fisco.co.jp
3-Apr.-2020WILLPLUS Holdings Corporation3538 Tokyo Stock Exchange First Section https://www.willplus.co.jp/en/ir/
09 18
09
We encourage readers to review our complete legal statement on “Disclaimer” page.
Business strategies
The number of new registrations of cars of overseas manufacturers (calendar year)
(unit: cars)
Ranking Brand name 2005 2010 2015 2016 2017 2018 2019 Share
1 Mercedes-Benz 45,852 30,920 65,159 67,378 68,215 67,531 66,523 22.29%
2 * BMW 44,980 32,426 46,229 50,571 52,527 50,982 46,814 15.69%
3 VW 53,441 46,704 54,765 47,233 49,036 51,958 46,791 15.68%
4 Audi 15,420 16,854 29,414 28,502 28,336 26,473 24,222 8.12%
5 * BMW MINI 13,602 11,338 21,083 24,548 25,427 25,984 23,813 7.98%
6 * Volvo 13,447 7,767 13,510 14,553 15,764 17,392 18,583 6.23%
7 * JEEP 2,136 1,877 7,129 9,388 10,101 11,438 13,354 4.48%
8 Peugeot 10,354 6,021 5,906 7,403 8,242 9,881 10,626 3.56%
9 * Porsche 3,572 3,335 6,690 6,887 6,923 7,166 7,192 2.41%
10 Renault 3,532 2,536 5,082 5,303 7,119 7,252 6,803 2.28%
11 * FIAT 1,453 5,562 6,032 6,717 6,522 6,013 5,987 2.01%
12 * Land Rover 2,069 727 2,979 3,165 3,597 3,964 4,549 1.52%
13 Citroen 2,299 2,402 1,978 2,009 3,152 3,560 4,113 1.38%
14 * Jaguar 3,461 1,138 1,349 2,883 2,614 3,260 3,259 1.09%
15 * ABARTH 1,472 1,857 2,286 2,352 2,628 0.88%
16 * Alfa Romeo 4,541 1,816 2,321 1,767 1,838 2,510 2,370 0.79%
17 smart 2,812 1,101 1,012 4,508 4,638 2,465 1,990 0.67%
18 Maserati 402 287 1,449 1,323 1,824 1,453 1,260 0.42%
19 DS 925 1,129 799 749 904 0.30%
20 Ferrari 391 493 720 678 775 767 870 0.29%
Overseas manufacturers, total 244,908 180,255 284,471 294,060 305,043 308,389 298,378 100.00%
Note: rankings and shares are from 2019 data *Brands handled by the Company Source: prepared by FISCO from “Automobile Statistics Monthly" (Japan Automobile Manufacturers Association, Inc.)
(2) Dominant strategy
A dominant strategy refers to a strategy of opening dealerships in a concentrated manner in a specific region. The
Company utilizes a multi-brand strategy to conduct this dominant strategy. The aims of the dominant strategy
are to capture customers by offering them multiple choices and increase efficiency through making the human
resources within the Group mobile and optimizing their allocation. It is to meet the needs of customers who want
to change to another brand during a model-cycle valley, or who want to try a model of another brand (for example,
an SUV). Of course, in order to maintain dealer rights, it is necessary to increase sales volume to above a certain
level for each of the brands.
Some specific examples of the Company Group’s dominant strategy include its dealership networks in the
Kanagawa area and the Kitakyushu area. In the Kanagawa area, it manages 6 dealerships, and breaking them
down, they are Jaguar/Land Rover Shonan (Approved Hiratsuka used cars sales), Jaguar/Land Rover Shonan
(Shonan showroom new car sales), Jaguar/Land Rover Shonan (Service center), JEEP Fujisawa Shonan, Alfa
Romeo Fujisawa Shonan, and FIAT/ ABARTH Fujisawa Shonan. In the Kitakyushu area, it manages 6 dealerships:
VOLVO Cars Kitakyushu, JEEP Kitakyushu, BMW Kokura, BMW Yahata, MINI Kokura, and Jaguar/Land Rover
Kitakyushu.
By brand, the Company is actively investing in MINI in FY6/20. In November 2019, it reopened the renovated
MINI Hakata /MINI NEXT Hakata dealership, which is compliant with the latest CI. In January 2020, it relocated
the MINI Yamaguchi /MINI NEXT Yamaguchi dealership to a more prime location and opened a newly constructed
dealership compliant with the latest CI. Also, in March 2019, it entered-into the Chugoku area for the first time,
choosing Yamaguchi Prefecture as a location as it is comparatively close to Fukuoka Prefecture, its existing Kyushu
area. Currently, it has 2 MINI dealerships in Yamaguchi Prefecture and 3 in Fukuoka Prefecture and it is the major
authorized dealer of this brand in this area.

COMPANY RESEARCH AND ANALYSIS REPORT
FISCO Ltd.
http://www.fisco.co.jp
3-Apr.-2020WILLPLUS Holdings Corporation3538 Tokyo Stock Exchange First Section https://www.willplus.co.jp/en/ir/
10 18
10
We encourage readers to review our complete legal statement on “Disclaimer” page.
Business strategies
The Company Group’s dealership network by region
Miyagi Prefecture
Sendai[PS] New and used car sales and aftermarket services
Fukuoka Prefecture
Koriyama[PS] New and used car sales and aftermarket services
Tokyo
Shinjuku[MINI] New and used car sales and aftermarket services
Ikebukuro[FT/AB] New and used car sales and aftermarket services
Meguro [JP] New and used car sales
Ota[AR] New and used car sales and aftermarket services
Setagaya[JP] New and used car sales and aftermarket services
[AR] New and used car sales and aftermarket services
[FT/AB] New and used car sales and aftermarket services
Denenchofu[FT/AB] New and used car sales and aftermarket services
Mitaka[JG/LR] New and used car sales and aftermarket services
Kanagawa Prefecture
Shonan[JP] New and used car sales and aftermarket services
[AR] New and used car sales and aftermarket services
[FT/AB] New and used car sales and aftermarket services
[JG/LR] New and used car sales
Hiratsuka[JG/LR] Used car sales and aftermarket services
Yamaguchi Prefecture
Yamaguchi[MINI] New and used car sales and aftermarket services
Shunan [MINI] Used car sales
Fukuoka Prefecture
Kokura [MINI] New and used car sales[BMW] New and used car sales and aftermarket services
Yahata [MINI] Used car sales[BMW] New and used car sales and aftermarket services
Kitakyushu[JP] New and used car sales and aftermarket services
[VC] New and used car sales and aftermarket services[JG/LR] New and used car sales and aftermarket services
Fukuoka-nishi[JP] New and used car sales and aftermarket services
[MINI] New and used car sales and aftermarket services
Fukuoka[JP] New and used car sales and aftermarket services
[MINI] New and used car sales and aftermarket services
[VC] New and used car sales and aftermarket services
Fukuoka-Minami[VC] New and used car sales and aftermarket services
Kurume[JP] New and used car sales and aftermarket services
[VC] New and used car sales and aftermarket services
Munakata [JP/BMW/VL] Used car sales
Note: JP: JEEP, AR: Alfa Romeo, FT: FIAT, AB: ABARTH, JG: Jaguar, LR: Land Rover, VC: VOLVO, PS: PorscheSource: Prepared by FISCO from the Company's results briefing materials
(3) M&A strategy
The M&A strategy is to 1) enter-into new areas, 2) acquire new brands (multi-brand strategy), and 3) increase the
shares of existing brands. The areas that are the candidates to enter-into are government-designated cities* with
a population of more than 1mn people and core regional cities with a population of more than 400,000 people.
* The designated cities with a population of more than 1mn people are Sapporo, Sendai, Saitama, Yokohama, Kawasaki, Nagoya, Kyoto, Osaka, Kobe, Hiroshima, and Fukuoka.

COMPANY RESEARCH AND ANALYSIS REPORT
FISCO Ltd.
http://www.fisco.co.jp
3-Apr.-2020WILLPLUS Holdings Corporation3538 Tokyo Stock Exchange First Section https://www.willplus.co.jp/en/ir/
11 18
11
We encourage readers to review our complete legal statement on “Disclaimer” page.
Business strategies
In December 2018, Willplus Eins took over the business of Porsche Center Sendai, thereby entering-into Tohoku
for the first time. This case is an entry into a new area and at the same time, the acquisition of a new brand. In
order to cover all the commercial areas in the Tohoku area, it opened Porsche Center Koriyama as the second
dealership in Fukushima Prefecture in January 2019. Normally, when entering into a new area, the Company
choses locations adjacent to existing bases as the success rate of locations that are not adjacent to an existing
base tends to be low. Porsche, which is synonymous with luxury sports cars, has a stable sales track record
and was in the top 10 for the number of new registered cars of overseas manufacturers in 2019, ranking the 9th.
Through this takeover, the Company strategically acquired a new brand.
The nationwide network of authorized dealers of imported cars is not as large as that for domestically produced
cars, but there is considerable room for growth for the Company. The numbers of bases for new cars, used cars,
and services are 279 for BMW, 203 for MINI, and 105 VOLVO new car dealers.
The number of bases by region for BMW, MINI, VOLVO
(bases)
Region
BMW MINI
VOLVONew carsTotal
New and used car
sales
New car sales
Used car sales
Aftermarket services
TotalNew and used car
sales
New car sales
Used car sales
Aftermarket services
Hokkaido 19 2 5 4 0 8 5 0 1 2 3
Tohoku 15 3 5 6 1 13 4 4 5 0 7
Kanto 109 16 54 29 10 80 12 35 21 12 38
Chubu 52 10 27 14 1 35 9 14 9 3 21
Kinki 47 7 23 12 5 31 7 12 9 3 20
Chugoku 16 9 3 4 0 11 6 1 3 1 4
Shikoku 5 3 1 1 0 6 4 1 1 0 3
Kyushu and Okinawa
24 5 11 7 1 19 9 2 5 3 9
Total 279 55 129 77 18 203 56 69 54 24 105
Source: Prepared by FISCO from Company materials
For introductions of M&A proposals, the Company directly approaches importers, financial institutions, or broker-
age firms, or the other party approaches it. It examines aspects including future growth potential and business
synergies, and after completing the various types of due diligence, formulates a business plan and confirms
elements such as the investment-recovery period. In order to be preferentially introduced to proposals, the
Company works on building good relations with importers. On the other hand, in the case of financial institutions
and brokerage firms, there is often competitive bidding. In this case, the Company Group bids in accordance with
factors such as its internal investment-recovery standard.
The models and price bands of the brands handled by the Company Group are rich in variety. The sales prices are
¥1.84mn to ¥3.39mn for FIAT, ¥2.38mn to ¥5.79mn for MINI, and ¥6.80mn to ¥36.56mn for Porsche. Previously,
the image was that “owners of imported cars are wealthy” and “imported cars break down easily,” but the price
difference between imported cars and domestically produced cars has narrowed and their quality has also
improved. In terms of price, they have become more affordable and their user groups are expanding.

COMPANY RESEARCH AND ANALYSIS REPORT
FISCO Ltd.
http://www.fisco.co.jp
3-Apr.-2020WILLPLUS Holdings Corporation3538 Tokyo Stock Exchange First Section https://www.willplus.co.jp/en/ir/
12 18
12
We encourage readers to review our complete legal statement on “Disclaimer” page.
Business strategies
The sales price bands of the brands handled by the Company
Note: The percentages in parentheses are the shares of the number of new registrations of overseas manufacturers’ passenger cars in 2019. Domestic shares are between the cars of overseas manufacturers. Source: Prepared by FISCO from Company materials
(4) Investment in dealerships
Investment in dealerships leads to an increase in the number of repeaters through improving the number of
visitors to dealerships and customer satisfaction (CS). Therefore, the Company Group is investing in existing
dealerships in order to comply with the latest CI and to improve the quality of services, and at the same time, is it
progressing relocations to locations where management efficiency can be expected to improve as prime locations.
Importers seek improvements, such as investment in the latest CI to expand sales and the holding of ample dealer
inventory to shorten delivery times. There are appearing cases of business transfers from among the dealers
who were content with sales rights in small-scale in existing areas due to the burden placed on them of investing
in dealerships, the increase in demo cars, having to respond to new CI, and the issue of business succession.
Aims of investing in dealerships
Source: Prepared by FISCO from the Company's results briefing materials

COMPANY RESEARCH AND ANALYSIS REPORT
FISCO Ltd.
http://www.fisco.co.jp
3-Apr.-2020WILLPLUS Holdings Corporation3538 Tokyo Stock Exchange First Section https://www.willplus.co.jp/en/ir/
13 18
13
We encourage readers to review our complete legal statement on “Disclaimer” page.
Business strategies
The aims of new dealership openings are to expand commercial areas, to complement existing areas, and to
expand the scope of the business for existing brands. This is because it is necessary to continuously increase the
number of dealerships through new openings and business takeovers in order to realize sustainable growth. The
timings of corporate acquisitions and business takeovers cannot be determined in advance, and it is not a good
idea to miss the investment timing. Therefore, investment, including in M&A, tends to occur in waves. In FY6/17,
dealership development for the year was 1 dealership from a new opening, 1 dealership from a business takeover,
and 4 dealerships from renovations, and renovations and relocations. Also, in FY6/18, it was 1 dealership from
a new opening, 1 dealership from a business takeover, and 3 dealerships from renovations, and renovations and
relocations. In contrast to this, it was 4 dealerships from new openings, 2 dealerships from business takeovers,
and 4 dealerships from renovations, and renovations and relocations in FY6/19. The increase in the number of
dealerships during this period was 6, compared to 2 in the previous fiscal period, and there were 32 dealerships
at the end of the period. Purchases to acquire property, plant and equipment increased sharply, from ¥254mn in
the previous fiscal period to ¥828mn, and depreciation rose from ¥553mn to ¥982mn. Although EBITDA increased
from ¥1,910mn in the previous fiscal period to ¥2,013mn, operating profit declined from ¥1,261mn to ¥1,118mn.
FY6/19 was an investment period which kept down profits, but FY6/20 is the investment-recovery period and
a high profit-increase rate is expected. In the short term, a wave can occur in the Company’s results due to the
timing of investment, but at FISCO, we think results are on a growth track in the medium- to long-term.
Dealership development by fiscal quarter
(dealerships)
FY6/17 FY6/18 FY6/19
1Q 1H 3Q 4Q FY 1Q 1H 3Q 4Q FY 1Q 1H 3Q 4Q FY
New dealership openings 1 1 1 1 1 3 4
Business takeovers 1 1 1 1 1 1 2
Dealerships renovations, and renovations and relocations
1 2 1 4 2 1 3 4 4
No. of dealerships at end of period 24 26 32
Financial data (¥mn)
Purchase of property, plant and equipment
-575 -254 -982
Depreciation 419 553 828
Operating profit 1,209 1,261 1,118
EBITDA 1,724 1,910 2,013
Source: Prepared by FISCO from the Company's financial results and results briefing materials
█ Performance trends
In 1H FY6/20, operating profit increased 32.4% YoY and was 13.3% above forecast
1. Overview of 1H FY6/20
In the 1H FY6/20 results, net sales increased 31.5% YoY to ¥17,981mn, operating profit rose 32.4% to ¥748mn,
ordinary profit grew 34.8% to ¥754mn, and profit attributable to owners of parent climbed 45.7% to ¥490mn.
Compared to the initial forecasts, net sales was 7.5% above forecast, operating profit 13.3% above forecast, ordinary
profit 15.0% above forecast, and profit attributable to owners of parent 15.0% above forecast.

COMPANY RESEARCH AND ANALYSIS REPORT
FISCO Ltd.
http://www.fisco.co.jp
3-Apr.-2020WILLPLUS Holdings Corporation3538 Tokyo Stock Exchange First Section https://www.willplus.co.jp/en/ir/
14 18
14
We encourage readers to review our complete legal statement on “Disclaimer” page.
Performance trends
1H FY6/20 consolidated financial results
(¥mn)
1H FY6/19 1H FY6/20 YoY vs. forecast
Amountvs. net sales
Forecast Resultsvs. net sales
Change % change Change % change
Net sales 13,677 - 16,731 17,981 - 4,304 31.5% 1,250 7.5%
New cars 7,165 52.4% - 9,350 52.0% 2,185 30.5% - -
Used cars 2,625 19.2% - 3,881 21.6% 1,256 47.8% - -
Auto auction sales 1,480 10.8% - 1,631 9.1% 151 10.2% - -
Vehicle maintenance 1,793 13.1% - 2,253 12.5% 460 25.6% - -
Others 612 4.5% - 865 4.8% 253 41.3% - -
Gross profit 2,821 20.6% - 3,560 19.8% 739 26.2% - -
SG&A expenses 2,255 16.5% - 2,812 15.6% 556 24.7% - -
Operating profit 565 4.1% 660 748 4.2% 183 32.4% 87 13.3%
Ordinary profit 559 4.1% 656 754 4.2% 194 34.8% 98 15.0%
Profit attributable to owners of parent
336 2.5% 426 490 2.7% 153 45.7% 64 15.0%
Source: Prepared by FISCO from the Company's financial results and results briefing materials
In net sales by business, sales in all businesses particularly new cars increased. New car sales increased 30.5%
YoY and constituted 52.0% of net sales. The percentage of total net sales from used cars sales was 21.6% and
they increased significantly, up 47.8%. The other sales-increase rates were up 10.2% for auto auctions, up 25.6%
for vehicle maintenance, and up 41.3% for others, including insurance.
In FY6/19, the Company actively invested in dealerships and conducted business takeovers, so the number of demo
cars increased. Therefore, the total amount of depreciation and the amortization of goodwill increased 41.5% YoY
(¥159mn) to ¥544mn. The increase in operating profit was only ¥183mn, but EBITDA increased ¥342mn.
Product inventory has accumulated, but vehicle deliveries are scheduled for the 2H FY6/20
2. Financial condition and performance indicators
At the end of 1H FY6/20, total assets were up ¥1,625mn on the end of the previous fiscal period to ¥16,299mn. In
non-current assets, cash and deposits decreased ¥569mn, but inventory products increased ¥1,590mn. Although
the number of inventory turnover days has lengthened to 82 days, there are already reserved products, and vehicles
are scheduled to be delivered in 2H FY6/20. Property, plant, and equipment, which had increased ¥2,107mn in the
previous fiscal period, increased only ¥527mn in 1H FY6/20.
The funds for vehicle procurement are dependent on cash and deposits and short-term borrowing, so the current
ratio was down by 5.7 percentage points (pp) on the end of the previous fiscal period to 104.3%. Also, the equity
ratio, which is a ratio of long-term financial stability, was down 1.1pp to 35.8%.

COMPANY RESEARCH AND ANALYSIS REPORT
FISCO Ltd.
http://www.fisco.co.jp
3-Apr.-2020WILLPLUS Holdings Corporation3538 Tokyo Stock Exchange First Section https://www.willplus.co.jp/en/ir/
15 18
15
We encourage readers to review our complete legal statement on “Disclaimer” page.
Performance trends
Consolidated balance sheet and performance indicators
(¥mn)
End-FY6/17 End-FY6/18 End-FY6/19 End-1H FY6/20 Change
Current assets 5,889 7,212 8,247 9,337 1,089
Cash and time deposits 1,416 1,463 1,412 842 -569
Accounts receivable - trade 121 148 217 134 -83
Inventories 3,733 4,974 5,751 7,317 1,565
Non-current assets 3,464 4,100 6,425 6,962 536
Property, plant and equipment 2,558 3,121 5,228 5,756 527
Intangible assets 483 390 428 388 -40
Investments and other assets 422 588 768 817 48
Total assets 9,354 11,312 14,673 16,299 1,625
Current liabilities 4,399 5,215 7,492 8,948 1,456
Non-current liabilities 812 1,302 1,759 1,510 -249
Total liabilities 5,211 6,518 9,252 10,459 1,206
(Interest-bearing debt) 1,724 2,552 4,429 5,028 598
Shareholders' equity 4,142 4,793 5,421 5,840 418
Total net assets 4,142 4,793 5,421 5,840 418
Total liabilities and net assets 9,354 11,312 14,673 16,299 1,625
[Stability]
Current ratio 133.9% 138.3% 110.1% 104.3% -5.8pt
Equity ratio 44.3% 42.4% 36.9% 35.8% -1.1pt
Source: Prepared by FISCO from the Company's financial results and securities report
On the Statement of Cash Flows, cash flows from financing activities increased, but not enough to cover the
decreases in cash flows from operating activities and cash flows from investing activities, so at the end of the fiscal
quarter, the balance of cash and cash equivalents was ¥842mn, down ¥266mn on the end of the same period in the
previous fiscal year and down ¥569mn on the end of the previous fiscal period. The main reason for the decrease
in cash flows from operating activities was the increase in inventories. As previously explained, this was due to
advanced purchases of products scheduled to be sold in the 2H. The main factor for cash flows from investing
activities was purchases to acquire property, plant, and equipment (¥609mn) for dealership renovations.
Consolidated Statement of Cash Flows
(¥mn)
1H FY6/19 1H FY6/20 Change
Cash flows from operating activities -33 -447 -413
Cash flows from investing activities -747 -648 98
Cash flows from financing activities 425 526 100
Cash and cash equivalents at end of period 1,109 842 -266
Source: Prepared by FISCO from the Company's results briefing materials

COMPANY RESEARCH AND ANALYSIS REPORT
FISCO Ltd.
http://www.fisco.co.jp
3-Apr.-2020WILLPLUS Holdings Corporation3538 Tokyo Stock Exchange First Section https://www.willplus.co.jp/en/ir/
16 18
16
We encourage readers to review our complete legal statement on “Disclaimer” page.
█ Outlook
Based on the 1H results, the FY6/20 full fiscal year forecasts are slightly conservative
• FY6/20 outlook
For the FY6/20 full fiscal year outlook, the Company has left the initial forecasts unchanged, of net sales to increase
16.0% YoY to ¥34,639mn, operating profit to rise 24.6% to ¥1,393mn, ordinary profit to grow 24.2% to ¥1,384mn,
and profit attributable to owners of parent to increase 19.4% to ¥871mn. FY6/19 was an investment period, so while
sales increased significantly in this period by 15.9%, operating profit declined 11.4% due to the burden of upfront
investment. But FY6/20 is the period to obtain the return on this investment, so the profit-increase rate is expected
to be higher than the sales-increase rate.
By business, the sales-increase rates on the previous fiscal period will be 22.1% for new cars, 11.2% for used cars,
5.7% for auto auction sales, 12.1% for vehicle maintenance, and 3.5% for others, so all the businesses are expected
to grow. Wrangler by JEEP was launched in FY6/19 and considerable stock was obtained for it in 1H FY6/20, and
it will contribute to sales in the 2H. The new models scheduled to be launched during FY6/20 are Land Rover’s
EVOQUE, BMW’s X7 and 1 Series, VOLVO’s S60, and Porsche’s 911.
Also, the dealerships newly opened and acquired from business takeovers in FY6/19 will contribute for the full fiscal
year in FY6/20. In FY6/19, there was 1 dealership from a new opening and 1 dealership from a business takeover
in the 1H, 3 dealerships from new openings in the 3Q, and 1 dealership from a business takeover in the 4Q, so the
increase in dealerships was concentrated in the 2H. For FY6/20, the Company opened the renovated MINI Hakata
/ MINI NEXT Hakata (Hakata Ward, Fukuoka City, Fukuoka Prefecture) dealership that is compliant with the latest CI
in November 2019. Also, in the same month, it newly opened CHECKER MOTORS Approved Munakata (Munakata
City, Fukuoka Prefecture), which is the Company Group’s first dealership specializing in imported used cars. This
dealership mainly handles JEEP, but also brands including BMW and VOLVO.
FY6/20 forecasts
(¥mn)
FY6/19Results
FY6/20Forecast
1H progress rate
% change
Net sales 29,860 34,639 51.9% 16.0%
New cars 15,432 18,845 49.6% 22.1%
Used cars 5,962 6,630 58.5% 11.2%
Auto auction sales 3,192 3,372 48.4% 5.7%
Vehicle maintenance 3,868 4,337 51.9% 12.1%
Others 1,403 1,453 59.5% 3.5%
Operating profit 1,118 1,393 53.7% 24.6%
Ordinary profit 1,115 1,384 54.5% 24.2%
Profit attributable to owner of parent 730 871 56.3% 19.4%
Source: Prepared by FISCO from the Company's financial results and results briefing materials
In FY6/20, results in the 1H exceed the initial forecasts, of net sales increasing 7.5% (¥1,250mn) and operating profit
rising 13.3% (¥87mn), but the Company has left the full fiscal year forecasts unchanged. Therefore, the 2H Company
forecasts seem somewhat conservative. The impact of the consumption tax hike in October 2019 was incorporated
into the initial forecasts, but a negative factor that was not expected initially is the spread of the coronavirus infection.
In consideration of this, it decided to leave the initial forecasts unchanged.

COMPANY RESEARCH AND ANALYSIS REPORT
FISCO Ltd.
http://www.fisco.co.jp
3-Apr.-2020WILLPLUS Holdings Corporation3538 Tokyo Stock Exchange First Section https://www.willplus.co.jp/en/ir/
17 18
17
We encourage readers to review our complete legal statement on “Disclaimer” page.
Outlook
The rates of progress up to 1H FY6/20 for the full fiscal year forecasts were 51.9% for net sales and 53.7% for
operating profit. The rates of progress in the previous 4 fiscal periods were less than 50% for net sales, so for
FY6/20 also, the initial forecast was set as 48.3%. As a result, the net sales forecasts in the 2H of FY6/20 for
vehicle maintenance and others (optional automobile insurance, etc.) are below the levels of the previous 6 months.
Fundamentally, these highly profitable, recurring revenue-based businesses stably grow accordingly to the increase
in the number of car sales, so it might be said that the FY6/20 full year results forecasts are conservative.
2211,,009933 2233,,556677
2255,,777700
2299,,886600
3344,,663399
0
10,000
20,000
30,000
40,000
FY6/16 FY6/17 FY6/18 FY6/19 FY6/20 E
(¥mn)
TTrreenndd iinn nneett ssaalleess aanndd ppeerrcceennttaaggeess iinn tthhee 11HH aanndd tthhee 22HH1H 2H
46.6%49.2% 48.4%
53.4%50.8%
54.2%
48.1%
51.6%
45.8%51.9%
Source: Prepared by FISCO from the Company's financial results and results briefing materials
888866
11,,220099 11,,226611
11,,111188
11,,339933
0
500
1,000
1,500
FY6/16 FY6/17 FY6/18 FY6/19 FY6/20 E
(¥mn)
TTrreenndd iinn ooppeerraattiinngg pprrooffiitt aanndd ppeerrcceennttaaggeess iinn tthhee 11HH aanndd tthhee 22HH
1H 2H
52.5%
52.2% 52.3%
47.5%
47.8%49.5%
46.3%
47.7%
50.5%
53.7%
Source: Prepared by FISCO from the Company's financial results and results briefing materials

COMPANY RESEARCH AND ANALYSIS REPORT
FISCO Ltd.
http://www.fisco.co.jp
3-Apr.-2020WILLPLUS Holdings Corporation3538 Tokyo Stock Exchange First Section https://www.willplus.co.jp/en/ir/
18 18
18
We encourage readers to review our complete legal statement on “Disclaimer” page.
█ Shareholder returns
The FY6/20 dividend forecast is ¥14 per share for a dividend payout ratio of 15.0%
1. Dividend policy
The Company has positioned shareholder returns as an important management issue, and its basic policy is to
maintain stable dividends while keeping a balance with internal reserves in order to increase corporate value. It
targets a dividend payout ratio of around 15%. In FY6/19, it paid a dividend per share of ¥13.8 (interim dividend
¥5.0, period-end dividend ¥8.8) as initially forecast with an increase of ¥0.6 YoY per share and the dividend payout
ratio of 17.6%. For FY6/20, it is forecasting that the dividend will increase ¥0.2 to ¥14.0 (interim dividend ¥5.0,
year-end dividend ¥9.0) for a forecast dividend payout ratio of 15.0%.
2.50
5.00 5.00 5.00
10.75
9.50
8.20 8.809.00
17.6
14.9 15.0
17.615.0
0.0
5.0
10.0
15.0
20.0
0.00
4.00
8.00
12.00
16.00
FY6/16 FY6/17 FY6/18 FY6/19 FY6/20 E
(%)(¥)
DDiivviiddeenndd ppeerr sshhaarree aanndd ddiivviiddeenndd ppaayyoouutt rraattiioo
Interim dividend (left) Year-end dividend (left)
1100..7755
1122..00001133..2200
1133..8800 1144..0000
Note: The Company conducted a 2-for-1 stock split of common shares with an effective date of April 1, 2017 and November 1, 2017.Dividends per share in the past have been retroactively adjusted.
Source: Prepared by FISCO from the Company's financial results
2. Shareholder Benefits Program
As part of its measures to return profits to shareholders, the Company has introduced a shareholder benefits program
in order to increase the appeal of investing in its shares and so that more people will own its shares. Shareholders
registered in the shareholders’ register at the end of June in each year and who own 1 unit (100 shares) or more of
shares will be given a QUO card worth ¥1,000.

Disclaimer
FISCO Ltd. (“FISCO”) offer stock price and index information for use under the approval of the Tokyo Stock Exchange, the Osaka Stock Exchange and Nikkei Inc.
This report is provided solely for the purpose of offering information, and is not a solicitation of investment nor any other act or action.
FISCO prepared and published this report based on information which it considered reliable; however, FISCO does not warrant the accuracy, completeness, fitness nor reliability of the contents of this report or the said information.
The issuers’ securities, currencies, commodities, securities and other financial instruments mentioned in this report may increase or decrease in value or lose their value due to influence from corporate activities, economic policies, world affairs and other factors. This report does not make any promises regarding any future outcomes. If you use this report or any information mentioned herein, regardless of the purpose therefor, such use shall be made based on your judgment and responsibility, and FISCO shall not be liable for any damage incurred by you as a result of such use, irrespective of the reason.
This report has been prepared at the request of the company subject hereto based on the provision of information by such company through telephone interviews and the like. However, the hypotheses, conclusions and all other contents contained herein are based on analysis by FISCO. The contents of this report are as of the time of the preparation hereof, and are subject to change without notice. FISCO is not obligated to update this report.
The intellectual property rights, including the copyrights to the main text hereof, the data and the like, belong to FISCO, and any revision, reprocessing, reproduction, transmission, distribution or the like of this report and any duplicate hereof without the permission of FISCO is strictly prohibited.
FISCO and its affiliated companies, as well as the directors, officers and employees thereof, may currently or in the future trade or hold the financial instruments or the securities of issuers that are mentioned in this report.
Please use the information in this report upon accepting the above points.
◾ For inquiry, please contact: ◾FISCO Ltd.5-11-9 Minami Aoyama, Minato-ku, Tokyo, Japan 107-0062Phone: 03-5774-2443 (Financial information Dept.) Email: [email protected]


![AutoKrew - HR [For Automotive Dealerships]](https://static.fdocuments.us/doc/165x107/5a6644737f8b9a44398b4743/autokrew-hr-for-automotive-dealerships.jpg)