
William Trenouth, Jennifer Thompson, and Dr. Bahram ...
56
An Erosion and Sediment Control Design Tool for Construction Sites William Trenouth, Jennifer Thompson, and Dr. Bahram Gharabaghi March 28, 2012
Transcript of William Trenouth, Jennifer Thompson, and Dr. Bahram ...

An Erosion and Sediment Control Design Tool for Construction Sites
William Trenouth, Jennifer Thompson, and Dr. Bahram Gharabaghi
March 28, 2012

Construction Site Stormwater Runoff
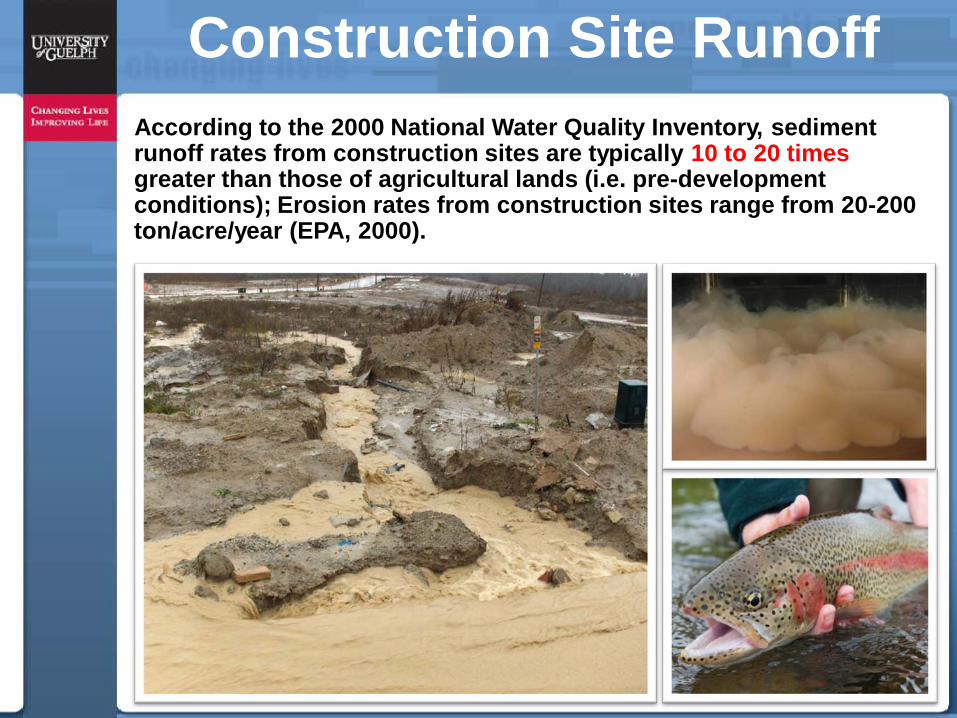
Construction Site Runoff According to the 2000 National Water Quality Inventory, sediment runoff rates from construction sites are typically 10 to 20 times greater than those of agricultural lands (i.e. pre-development conditions); Erosion rates from construction sites range from 20-200 ton/acre/year (EPA, 2000).
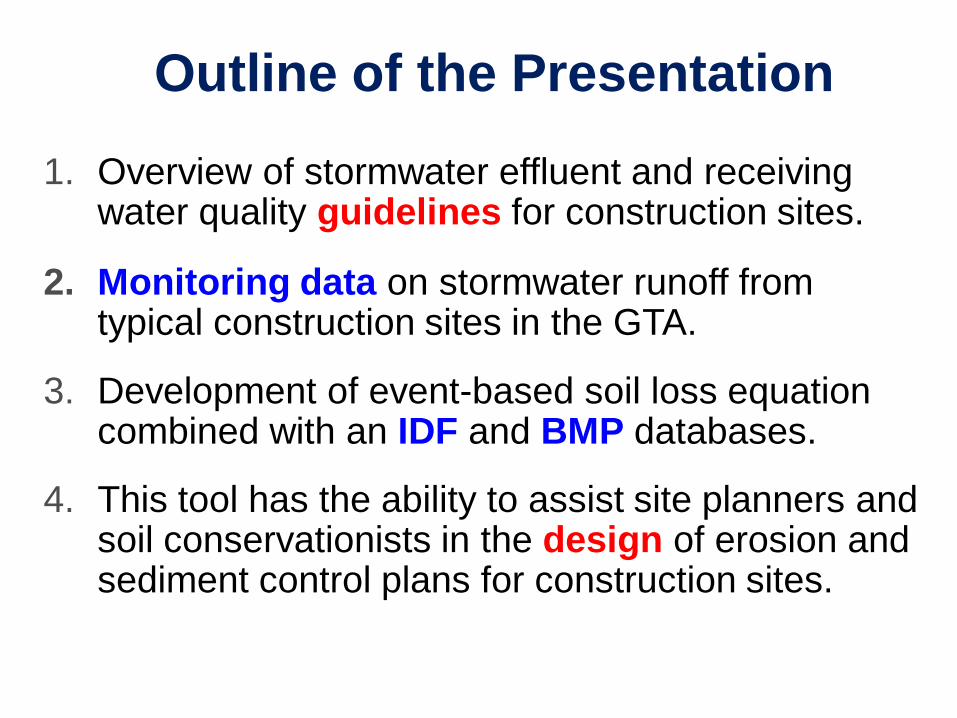
1. Overview of stormwater effluent and receiving water quality guidelines for construction sites.
2. Monitoring data on stormwater runoff from typical construction sites in the GTA.
3. Development of event-based soil loss equation combined with an IDF and BMP databases.
4. This tool has the ability to assist site planners and soil conservationists in the design of erosion and sediment control plans for construction sites.
Outline of the Presentation

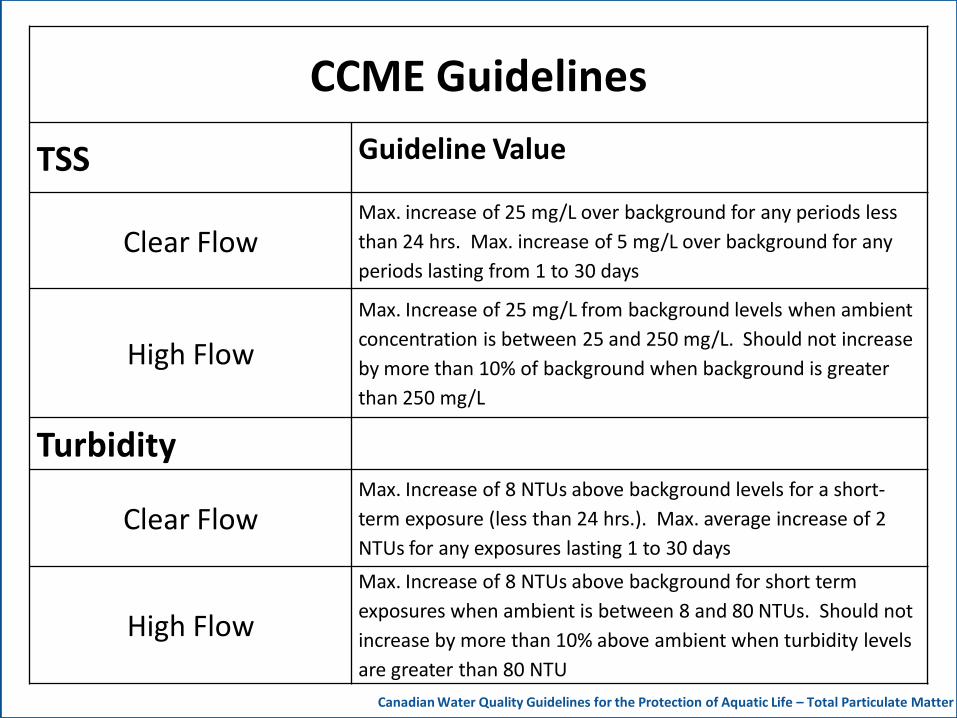
CCME Guidelines
TSS Guideline Value
Clear Flow Max. increase of 25 mg/L over background for any periods less than 24 hrs. Max. increase of 5 mg/L over background for any periods lasting from 1 to 30 days
High Flow Max. Increase of 25 mg/L from background levels when ambient concentration is between 25 and 250 mg/L. Should not increase by more than 10% of background when background is greater than 250 mg/L
Turbidity
Clear Flow Max. Increase of 8 NTUs above background levels for a short-term exposure (less than 24 hrs.). Max. average increase of 2 NTUs for any exposures lasting 1 to 30 days
High Flow Max. Increase of 8 NTUs above background for short term exposures when ambient is between 8 and 80 NTUs. Should not increase by more than 10% above ambient when turbidity levels are greater than 80 NTU
Canadian Water Quality Guidelines for the Protection of Aquatic Life – Total Particulate Matter
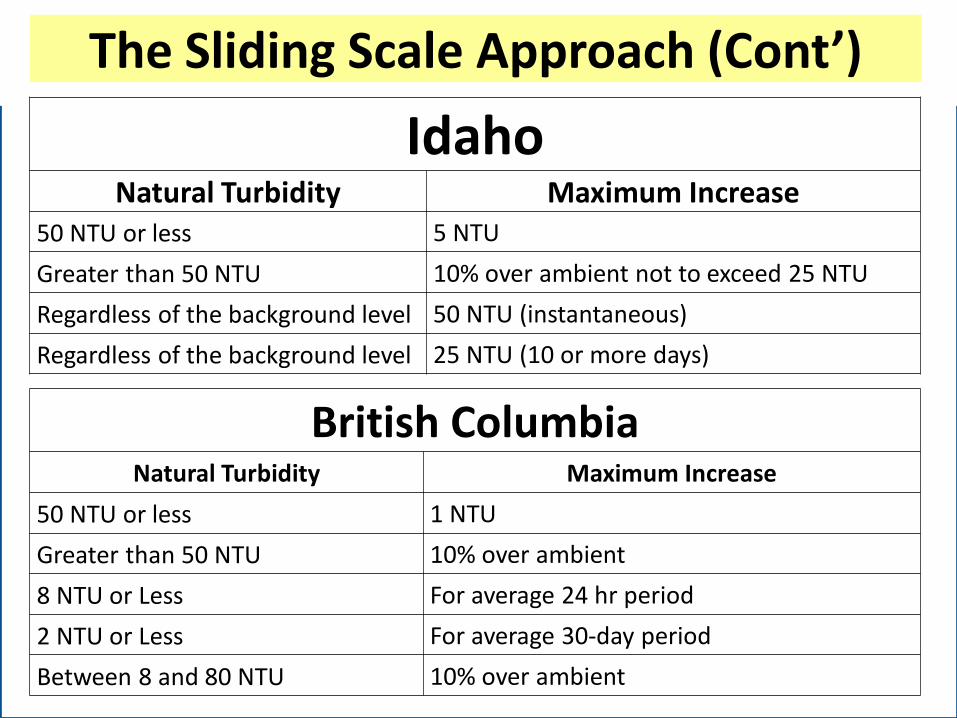
The Sliding Scale Approach (Cont’)
Idaho Natural Turbidity Maximum Increase
50 NTU or less 5 NTU Greater than 50 NTU 10% over ambient not to exceed 25 NTU Regardless of the background level 50 NTU (instantaneous) Regardless of the background level 25 NTU (10 or more days)
British Columbia Natural Turbidity Maximum Increase
50 NTU or less 1 NTU Greater than 50 NTU 10% over ambient 8 NTU or Less For average 24 hr period 2 NTU or Less For average 30-day period Between 8 and 80 NTU 10% over ambient

Washington State Department of Transportation Highway Runoff Manual: 25 NTU or Less – Not likely to cause an exceedance in
the receiving waters; BMP’s likely working properly 26-249 NTU – Likely resulting in an exceedance; BMP’s
not working/installed properly. Revise ESC within 7 days and fix problem within 10
250 or More NTU – Likely resulting in an exceedance; BMP’s and ESC likely failing. Notify State within 24 hrs. Make revisions to ESC in 7 days Implement plan within 10 days of exceedance Sample daily until discharge is 25 NTU or less
The Sliding Scale Approach (Cont’)
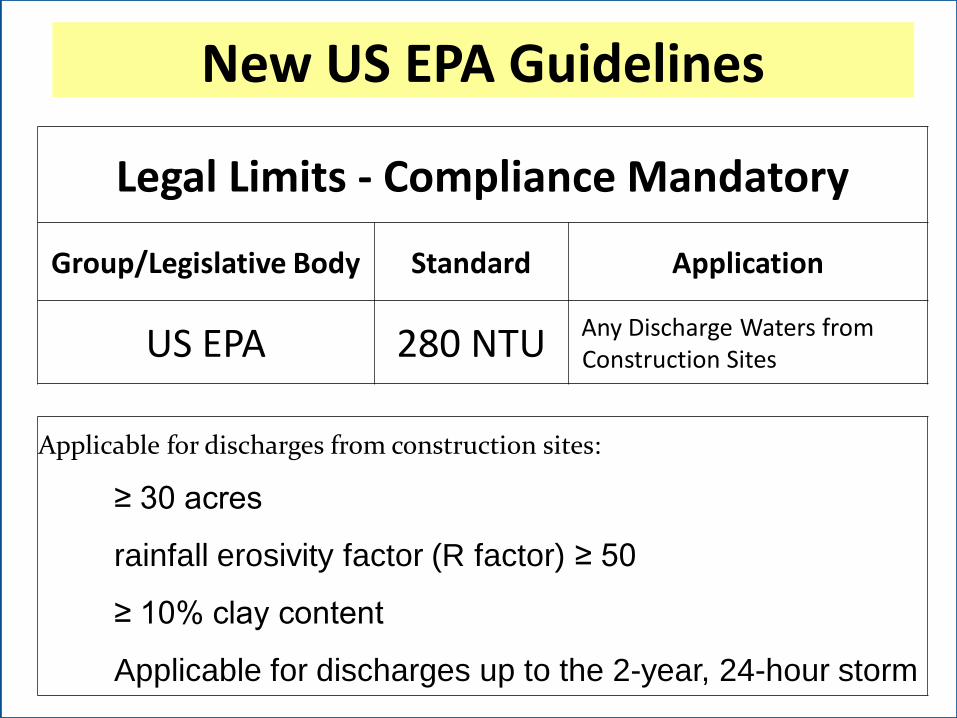
New US EPA Guidelines
Legal Limits - Compliance Mandatory
Group/Legislative Body Standard Application
US EPA 280 NTU Any Discharge Waters from . Construction Sites
Applicable for discharges from construction sites:
≥ 30 acres
rainfall erosivity factor (R factor) ≥ 50
≥ 10% clay content
Applicable for discharges up to the 2-year, 24-hour storm
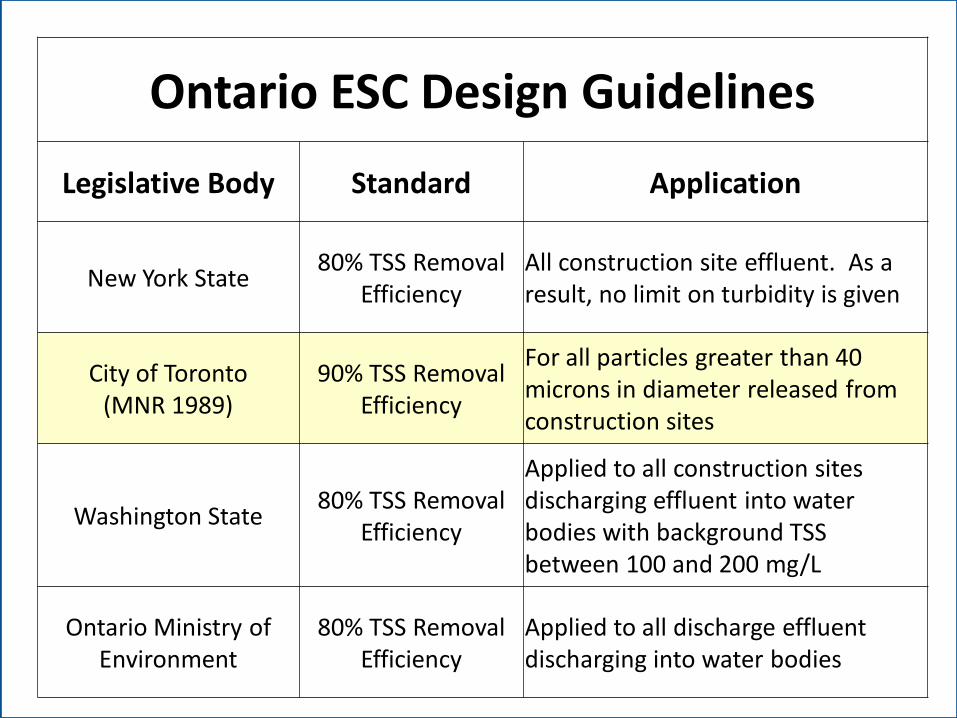
Ontario ESC Design Guidelines
Legislative Body Standard Application
New York State 80% TSS Removal Efficiency
All construction site effluent. As a result, no limit on turbidity is given
City of Toronto (MNR 1989)
90% TSS Removal Efficiency
For all particles greater than 40 microns in diameter released from construction sites
Washington State 80% TSS Removal Efficiency
Applied to all construction sites discharging effluent into water bodies with background TSS between 100 and 200 mg/L
Ontario Ministry of Environment
80% TSS Removal Efficiency
Applied to all discharge effluent discharging into water bodies
12
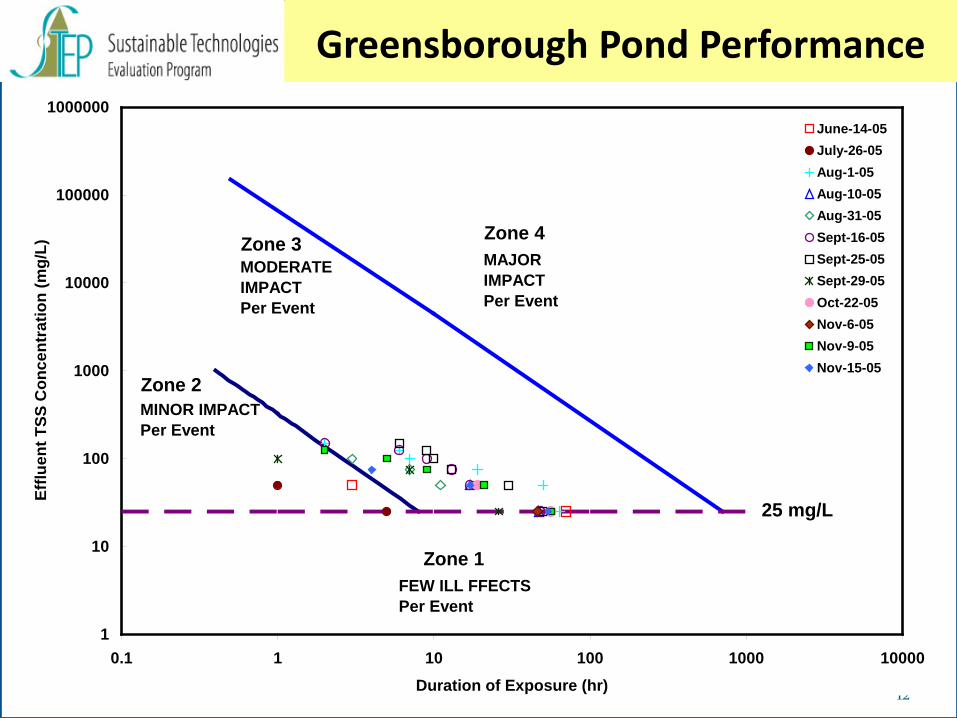
Greensborough Pond Performance
1
10
100
1000
10000
100000
1000000
0.1 1 10 100 1000 10000Duration of Exposure (hr)
Efflu
ent T
SS C
once
ntra
tion
(mg/
L)
June-14-05July-26-05Aug-1-05Aug-10-05Aug-31-05Sept-16-05Sept-25-05Sept-29-05Oct-22-05Nov-6-05Nov-9-05Nov-15-05
Zone 4MAJOR IMPACTPer Event
Zone 3MODERATE IMPACTPer Event
MINOR IMPACTPer Event
Zone 2
FEW ILL FFECTSPer Event
Zone 1
25 mg/L

Greensborough Development
≈76 ha in size Rapidly-
urbanizing catchment Monitoring
from 2004 - 2005
13

Cookstown Public School ≈85 ha in
size School lot
with agriculture (alfalfa) upstream
14

Alcona Project Site
≈74 ha in size Agricultural;
four separate fields identified
15

Grangehill Phase 7 - Guelph
16

Stormwater Monitoring
Lake Simcoe
Alcona
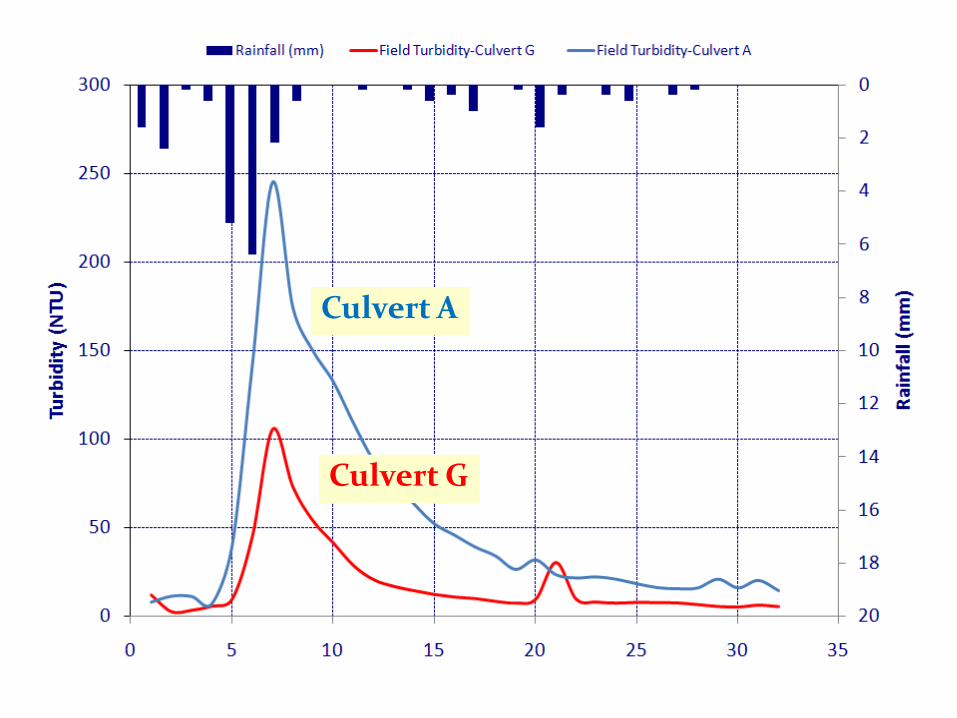
Culvert A
Culvert G
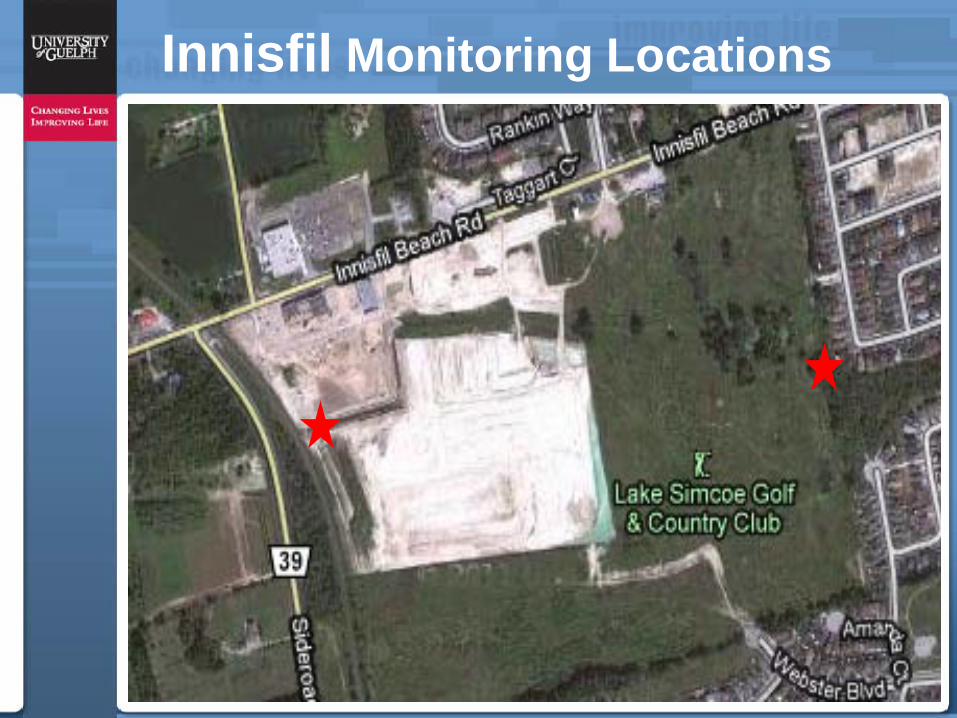
Innisfil Monitoring Locations
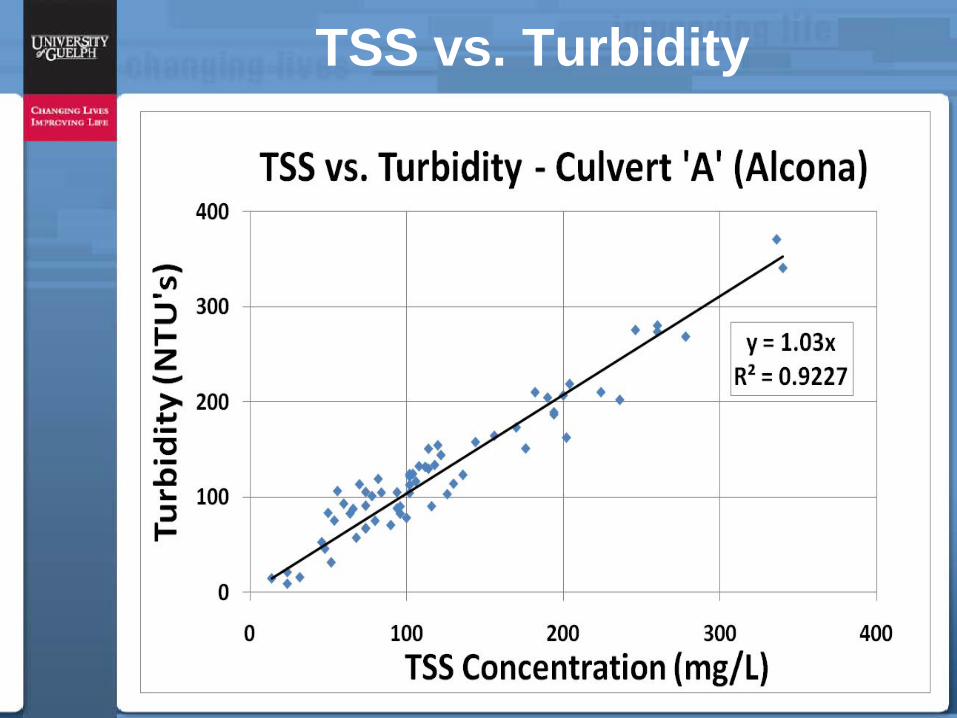
TSS vs. Turbidity
20
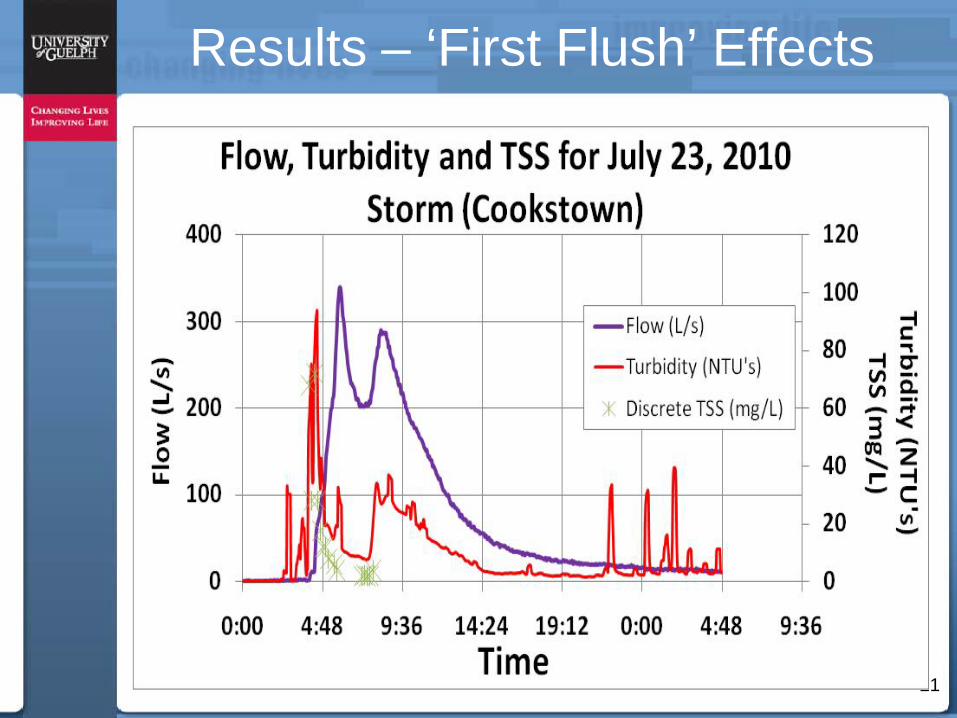
Results – ‘First Flush’ Effects
21
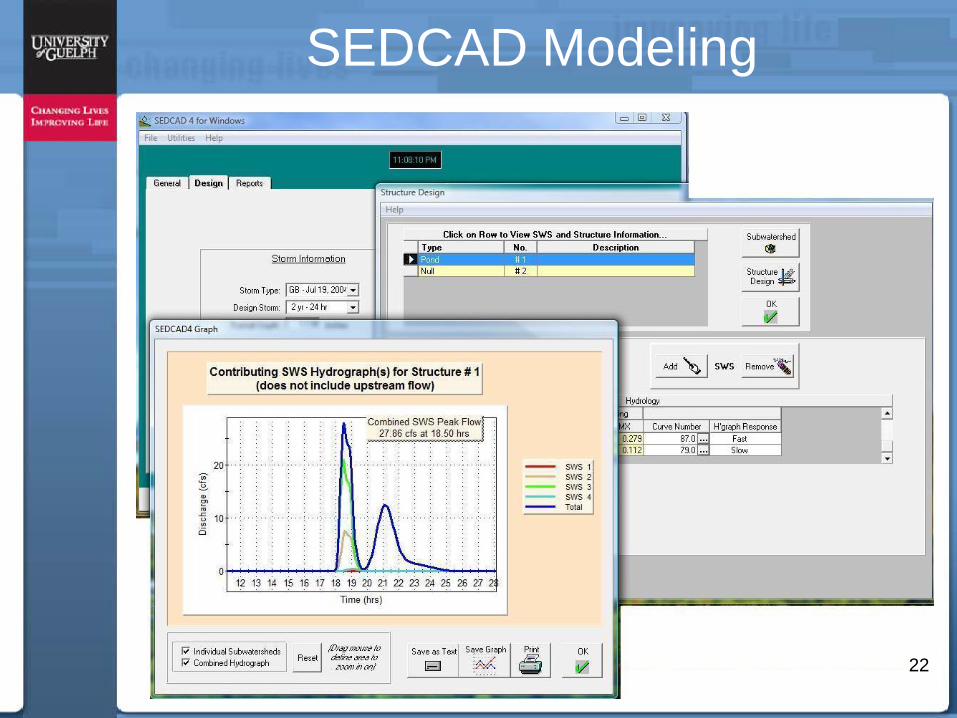
SEDCAD Modeling
22
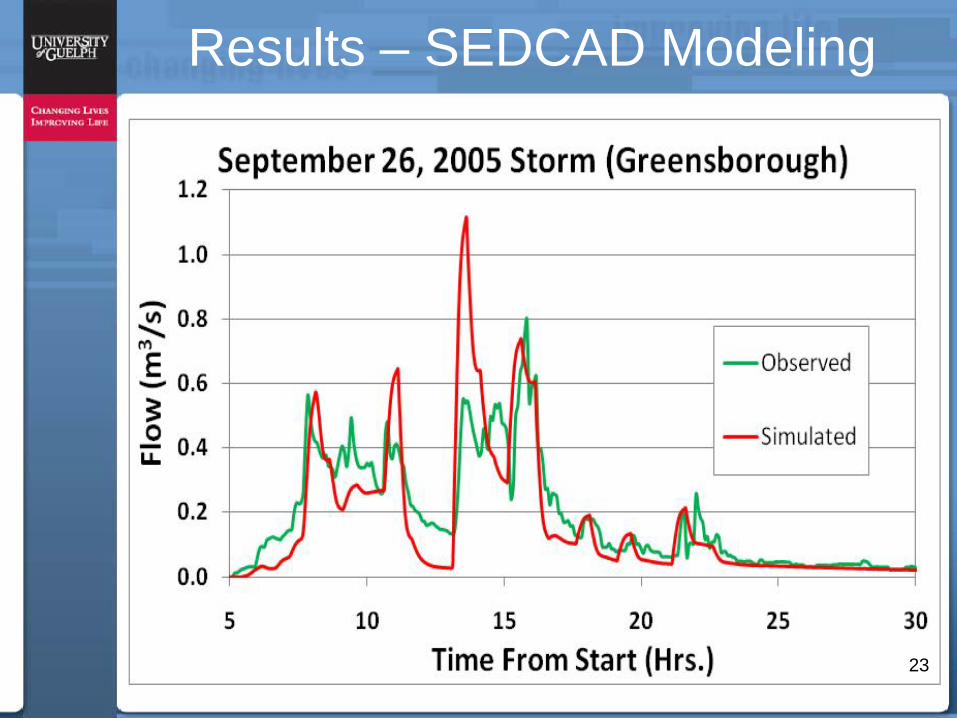
Results – SEDCAD Modeling
23
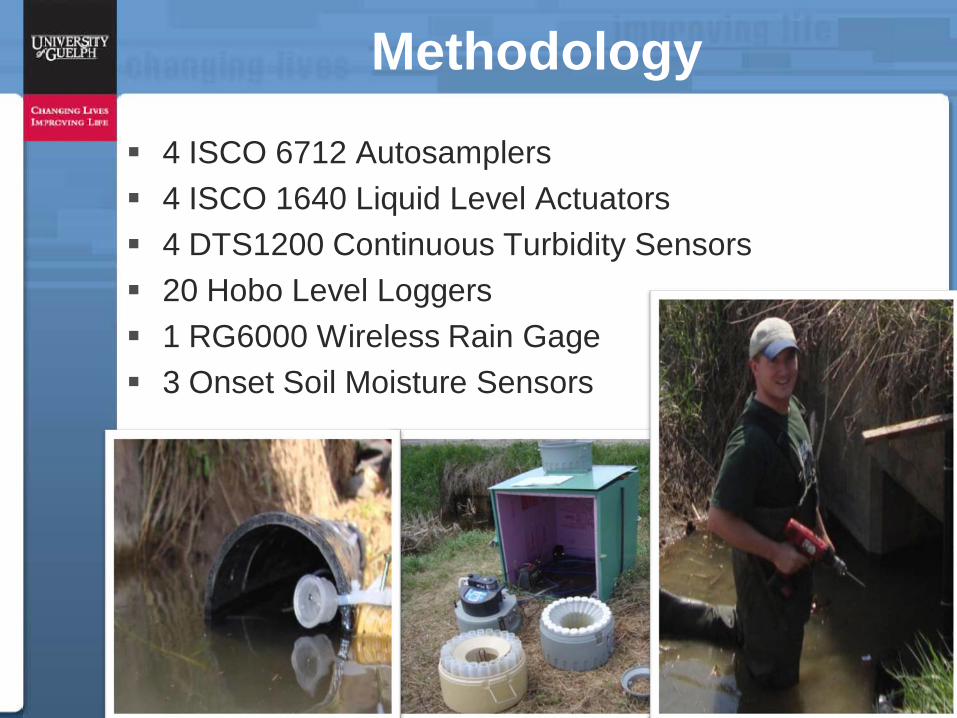
Methodology
24
4 ISCO 6712 Autosamplers 4 ISCO 1640 Liquid Level Actuators 4 DTS1200 Continuous Turbidity Sensors 20 Hobo Level Loggers 1 RG6000 Wireless Rain Gage 3 Onset Soil Moisture Sensors
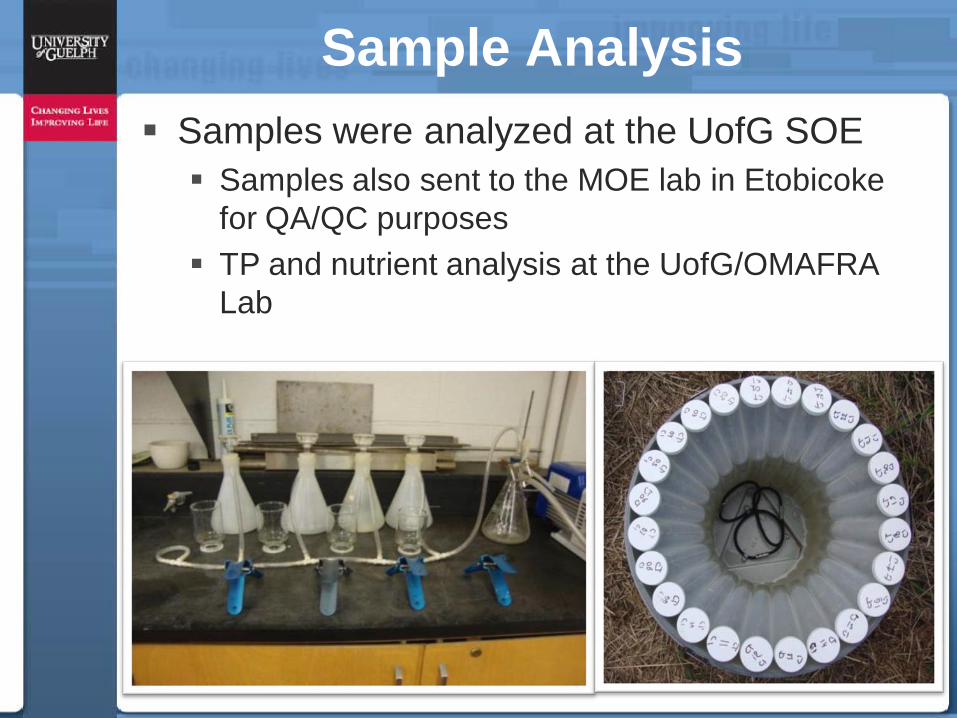
Sample Analysis Samples were analyzed at the UofG SOE Samples also sent to the MOE lab in Etobicoke
for QA/QC purposes TP and nutrient analysis at the UofG/OMAFRA
Lab
25
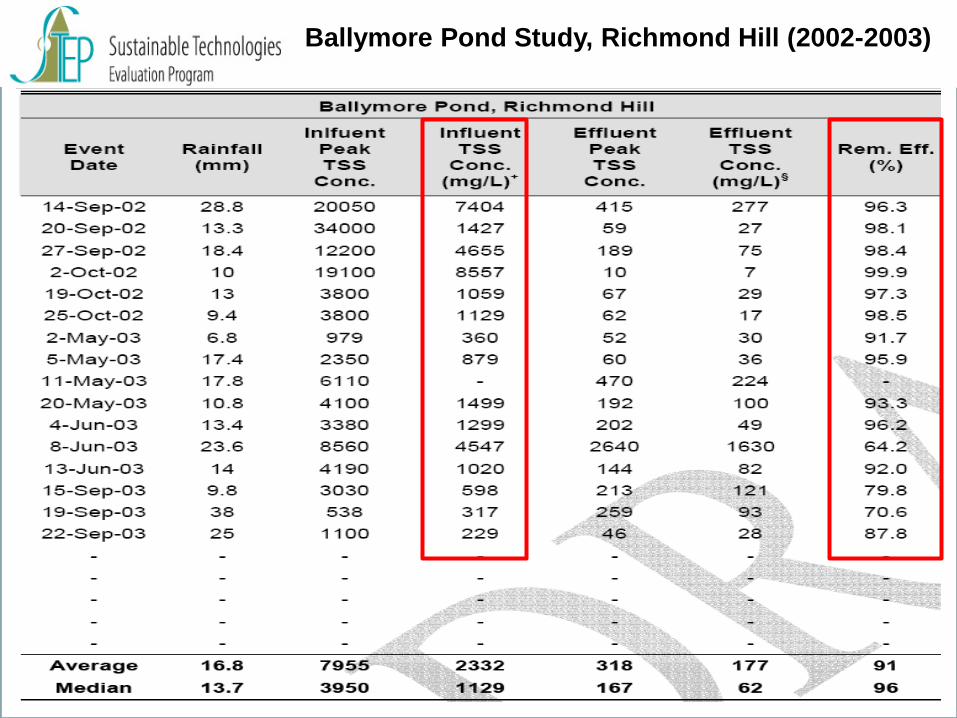
Ballymore Pond Study, Richmond Hill (2002-2003)
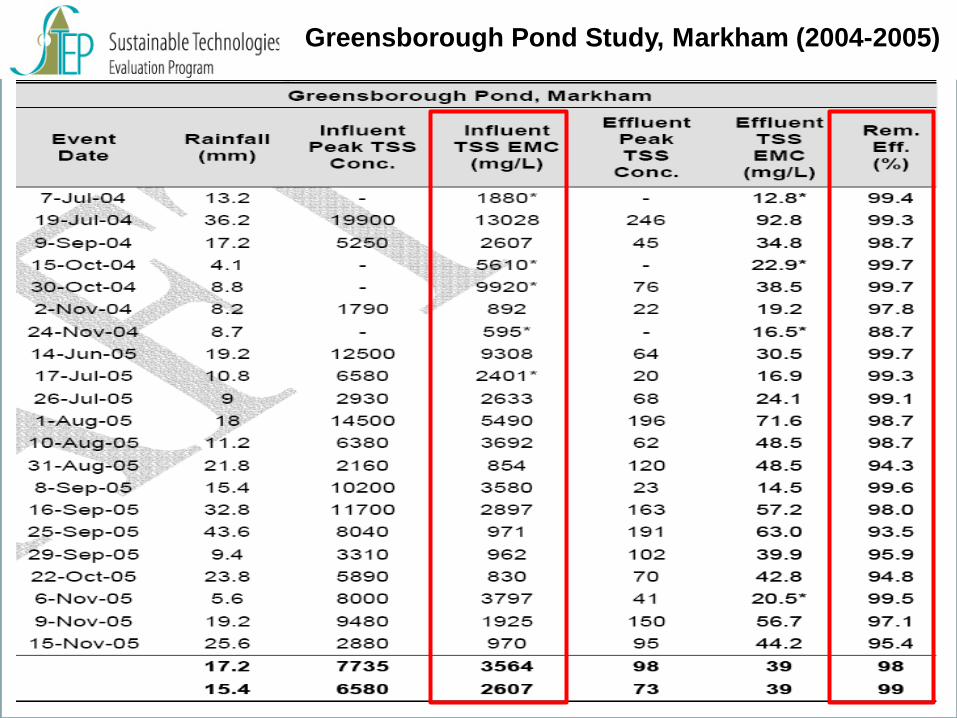
Greensborough Pond Study, Markham (2004-2005)
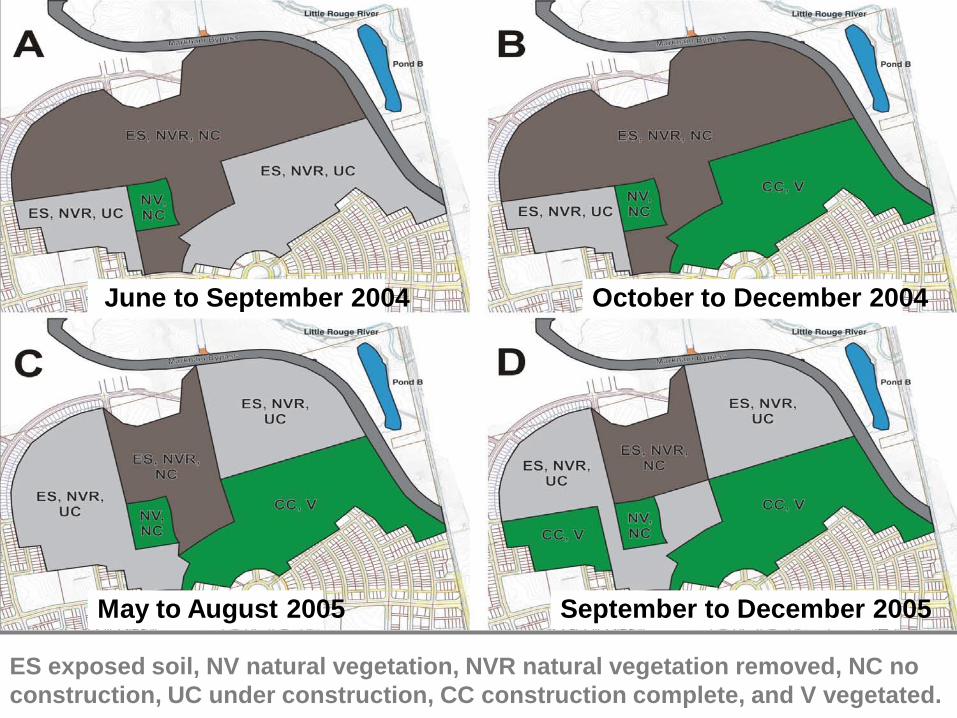
ES exposed soil, NV natural vegetation, NVR natural vegetation removed, NC no construction, UC under construction, CC construction complete, and V vegetated.
June to September 2004 October to December 2004
May to August 2005 September to December 2005
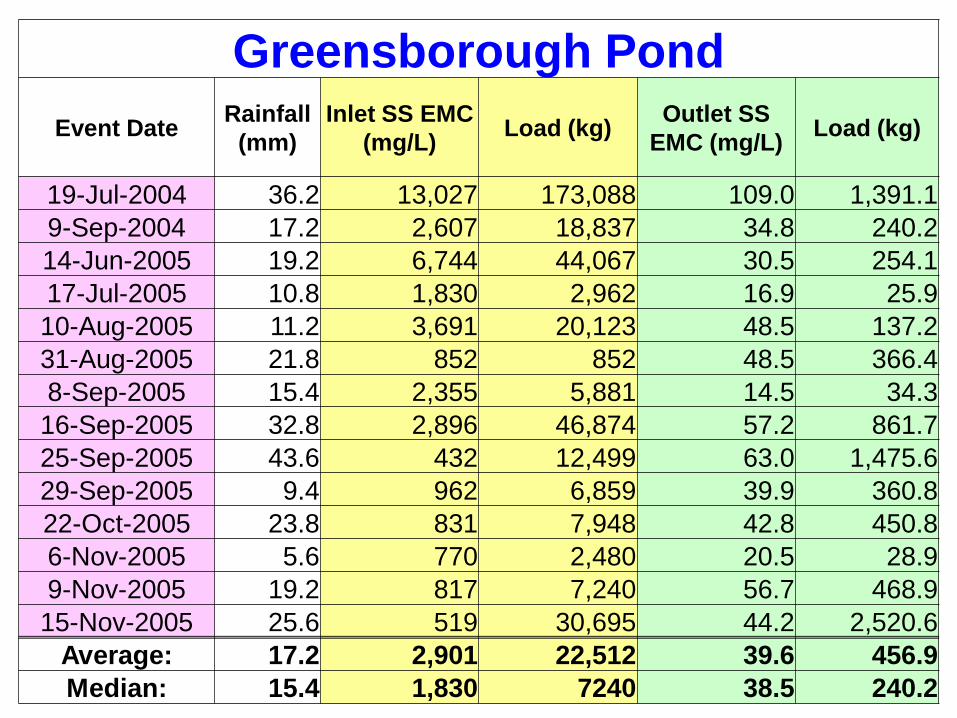
Greensborough Pond Event Date Rainfall
(mm) Inlet SS EMC
(mg/L) Load (kg) Outlet SS EMC (mg/L) Load (kg)
19-Jul-2004 36.2 13,027 173,088 109.0 1,391.1 9-Sep-2004 17.2 2,607 18,837 34.8 240.2 14-Jun-2005 19.2 6,744 44,067 30.5 254.1 17-Jul-2005 10.8 1,830 2,962 16.9 25.9 10-Aug-2005 11.2 3,691 20,123 48.5 137.2 31-Aug-2005 21.8 852 852 48.5 366.4 8-Sep-2005 15.4 2,355 5,881 14.5 34.3 16-Sep-2005 32.8 2,896 46,874 57.2 861.7 25-Sep-2005 43.6 432 12,499 63.0 1,475.6 29-Sep-2005 9.4 962 6,859 39.9 360.8 22-Oct-2005 23.8 831 7,948 42.8 450.8 6-Nov-2005 5.6 770 2,480 20.5 28.9 9-Nov-2005 19.2 817 7,240 56.7 468.9 15-Nov-2005 25.6 519 30,695 44.2 2,520.6
Average: 17.2 2,901 22,512 39.6 456.9 Median: 15.4 1,830 7240 38.5 240.2
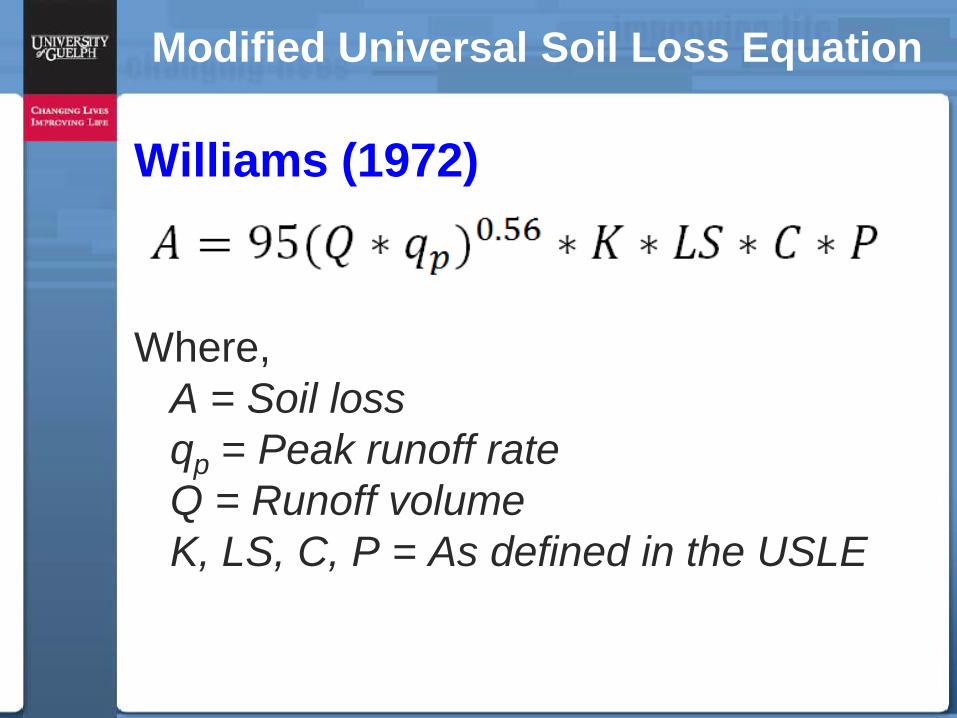
Modified Universal Soil Loss Equation
Williams (1972)
Where, A = Soil loss qp = Peak runoff rate Q = Runoff volume K, LS, C, P = As defined in the USLE

Modified Universal Soil Loss Equation
Onstad and Foster (1975)
Where, A = Soil loss qp = Peak runoff rate Q = Runoff volume Rst = Rainfall erosivity K, LS, C, P = As defined in the USLE
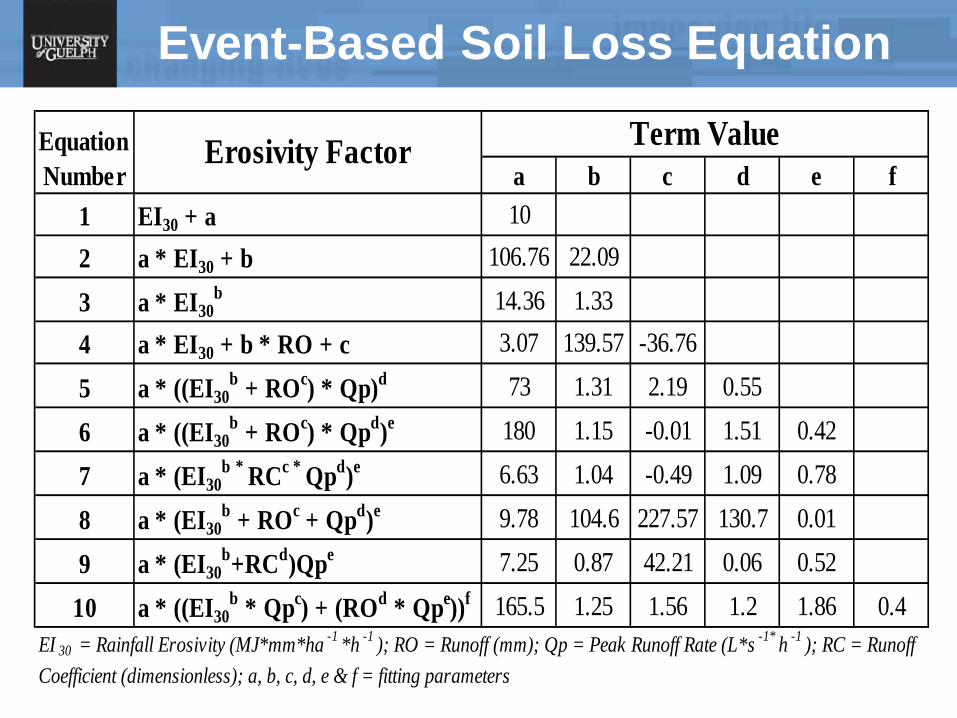
Event-Based Soil Loss Equation
a b c d e f1 EI30 + a 102 a * EI30 + b 106.76 22.09
3 a * EI30b 14.36 1.33
4 a * EI30 + b * RO + c 3.07 139.57 -36.76
5 a * ((EI30b + ROc) * Qp)d 73 1.31 2.19 0.55
6 a * ((EI30b + ROc) * Qpd)e 180 1.15 -0.01 1.51 0.42
7 a * (EI30b * RCc * Qpd)e 6.63 1.04 -0.49 1.09 0.78
8 a * (EI30b + ROc + Qpd)e 9.78 104.6 227.57 130.7 0.01
9 a * (EI30b+RCd)Qpe 7.25 0.87 42.21 0.06 0.52
10 a * ((EI30b * Qpc) + (ROd * Qpe))f 165.5 1.25 1.56 1.2 1.86 0.4
Erosivity Factor Term ValueEquation Number
EI 30 = Rainfall Erosivity (MJ*mm*ha -1 *h -1 ); RO = Runoff (mm); Qp = Peak Runoff Rate (L*s -1* h -1 ); RC = Runoff Coefficient (dimensionless); a, b, c, d, e & f = fitting parameters
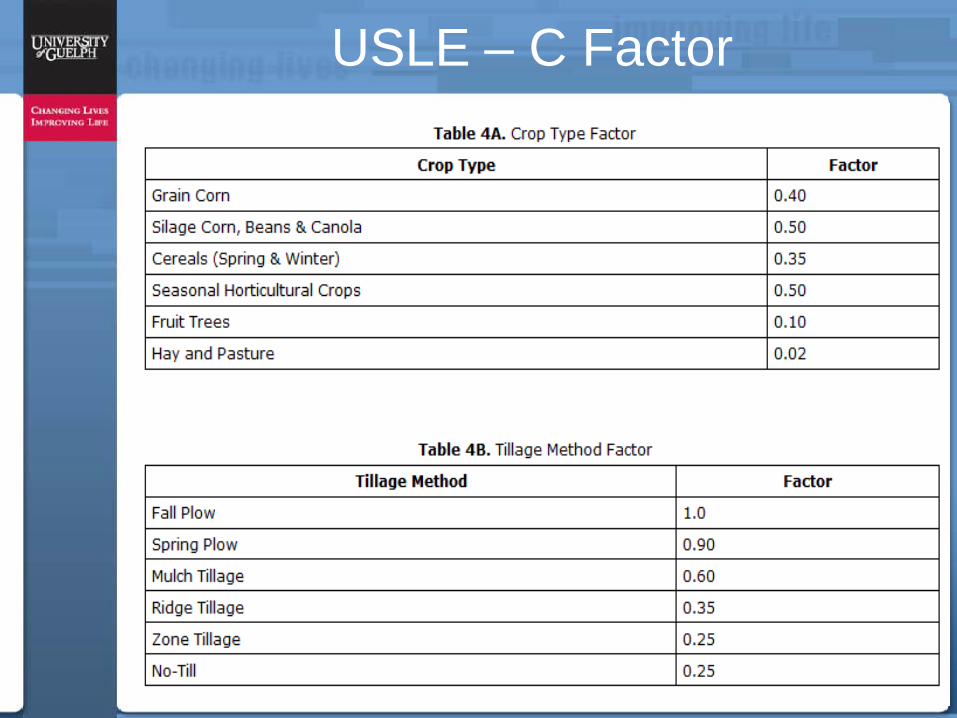
USLE – C Factor
1/29/99 36
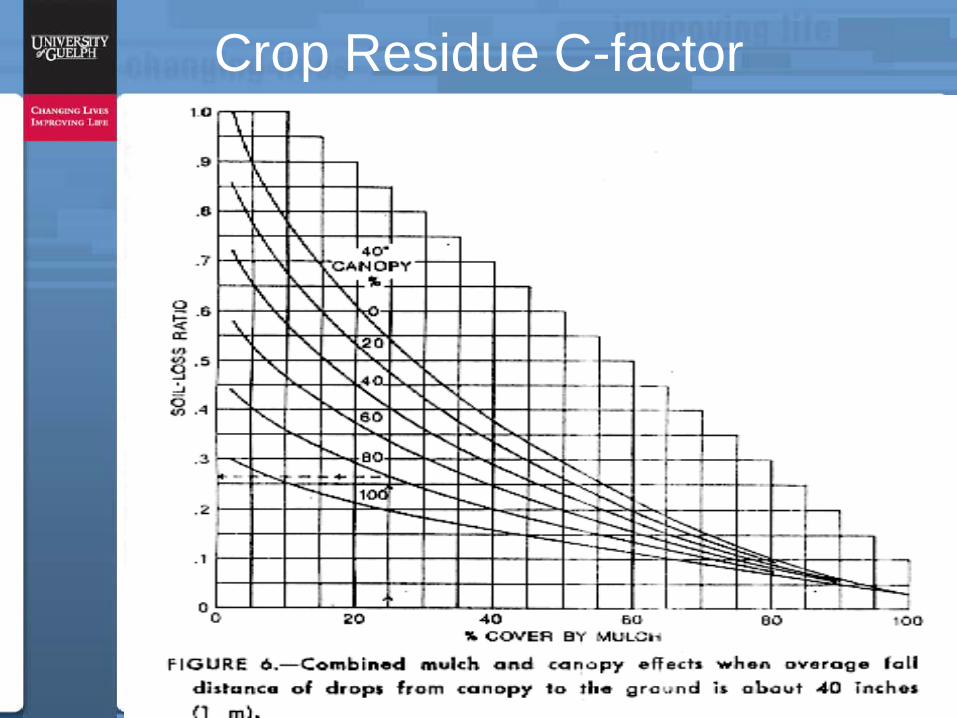
Crop Residue C-factor
37
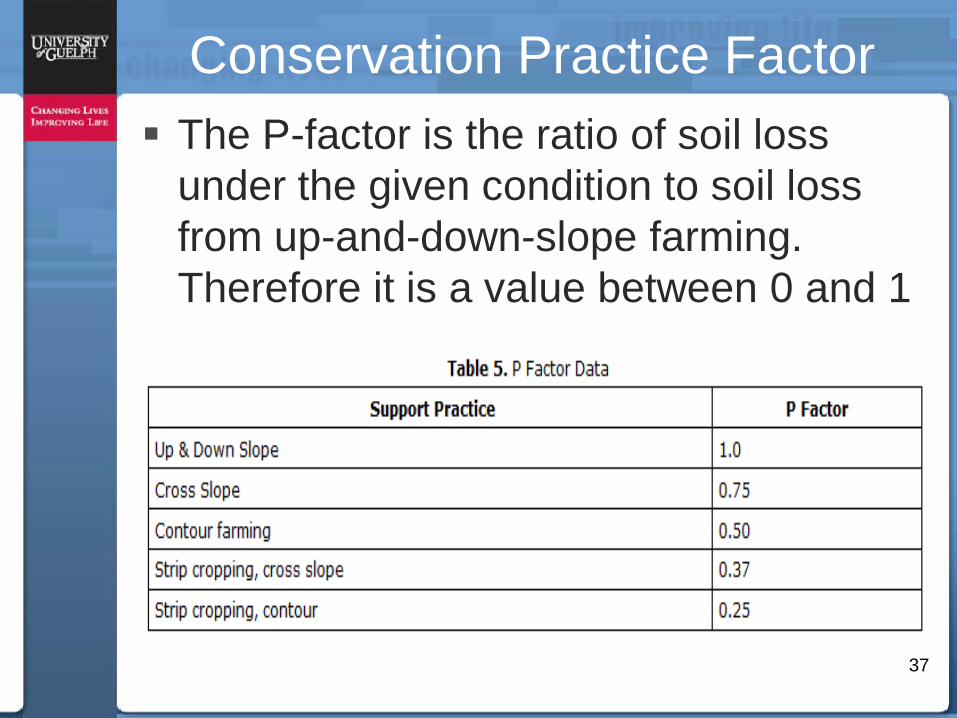
Conservation Practice Factor The P-factor is the ratio of soil loss
under the given condition to soil loss from up-and-down-slope farming. Therefore it is a value between 0 and 1
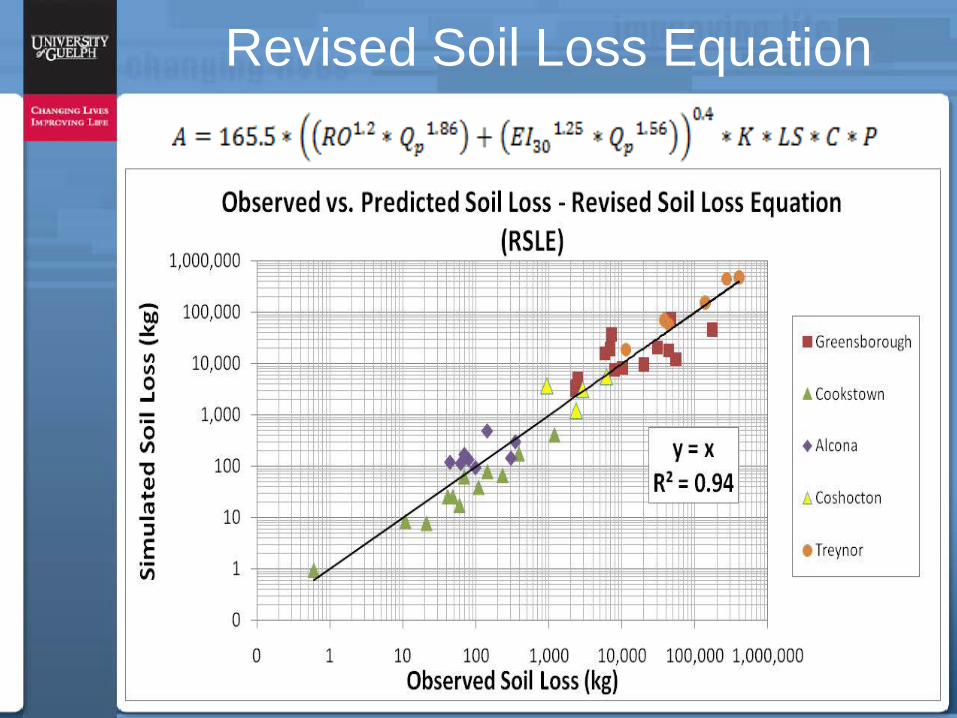
Revised Soil Loss Equation
38
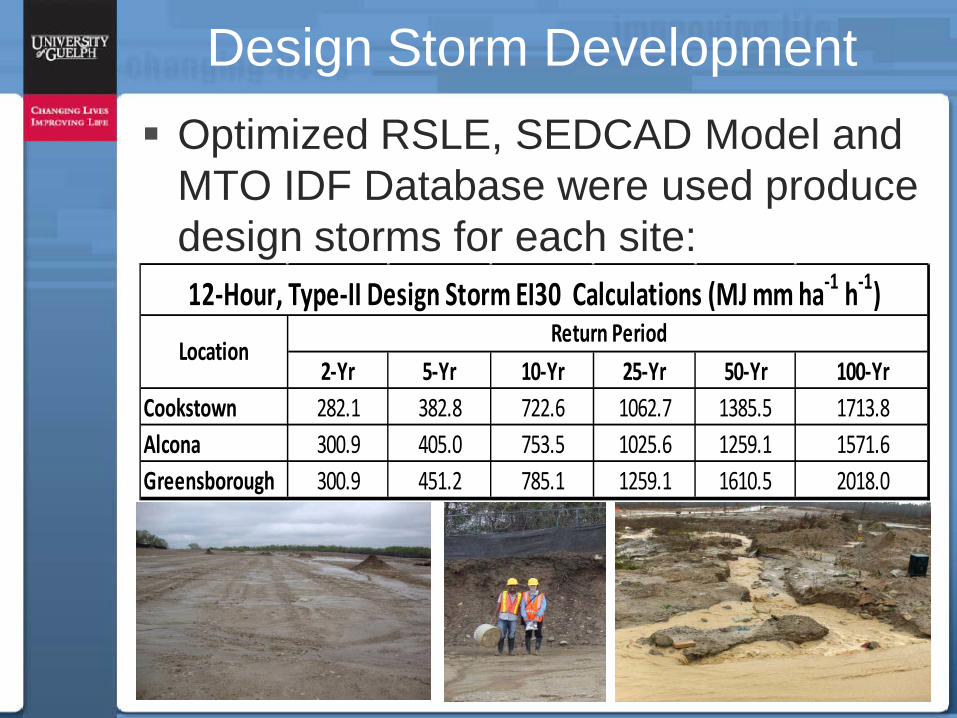
Design Storm Development Optimized RSLE, SEDCAD Model and
MTO IDF Database were used produce design storms for each site:
39
2-Yr 5-Yr 10-Yr 25-Yr 50-Yr 100-YrCookstown 282.1 382.8 722.6 1062.7 1385.5 1713.8Alcona 300.9 405.0 753.5 1025.6 1259.1 1571.6Greensborough 300.9 451.2 785.1 1259.1 1610.5 2018.0
Location
12-Hour, Type-II Design Storm EI30 Calculations (MJ mm ha-1 h-1)Return Period

Staged ESC Planning
1) Earthworks 3) Building construction
2) Servicing
The dynamic nature of the construction process and the importance of having the most appropriate and effective controls in place requires separate ESC Plans showing measures that must be in place prior to each stage of construction
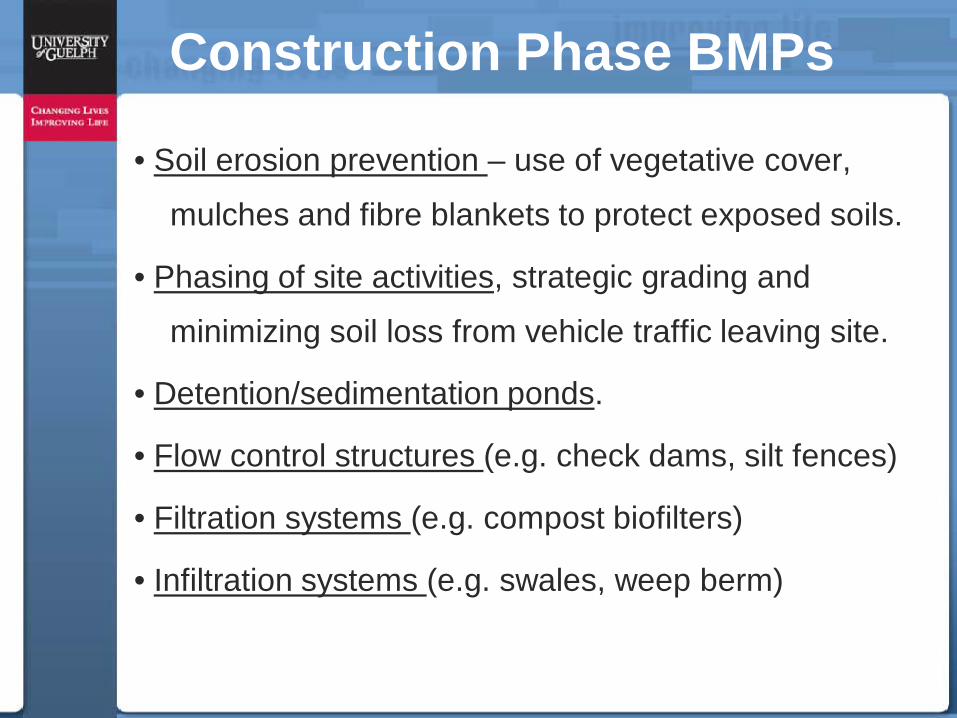
Construction Phase BMPs
• Soil erosion prevention – use of vegetative cover,
mulches and fibre blankets to protect exposed soils.
• Phasing of site activities, strategic grading and
minimizing soil loss from vehicle traffic leaving site.
• Detention/sedimentation ponds.
• Flow control structures (e.g. check dams, silt fences)
• Filtration systems (e.g. compost biofilters)
• Infiltration systems (e.g. swales, weep berm)
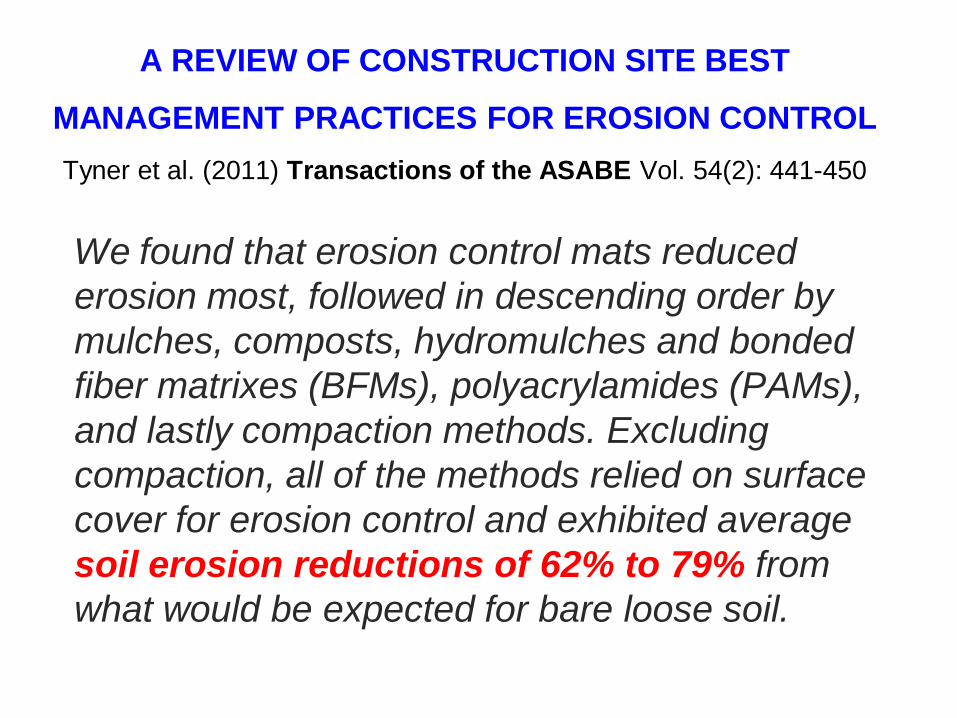
A REVIEW OF CONSTRUCTION SITE BEST
MANAGEMENT PRACTICES FOR EROSION CONTROL Tyner et al. (2011) Transactions of the ASABE Vol. 54(2): 441-450
We found that erosion control mats reduced erosion most, followed in descending order by mulches, composts, hydromulches and bonded fiber matrixes (BFMs), polyacrylamides (PAMs), and lastly compaction methods. Excluding compaction, all of the methods relied on surface cover for erosion control and exhibited average soil erosion reductions of 62% to 79% from what would be expected for bare loose soil.

Agricultural BMPs BMP Sediment TP Source Material
No-Tillage 92 (85) 69 (62) (Merriman et al, 2009; Dinnes, 2004; Wagow et al, 2002; Bryant et al, 2008; Schnepf and Cox, 2006)
Vegetative Buffer Strips 74 (69) 61 (57)
(Schnepf and Cox, 2006; Mikkelsen and Gilliam, SEPA, 2010; Ghebremichael and Watzin, 2008; Gitau et al, 2005; Boyer, 2006; Melcher and Skagen, 2005)
Ditch Bank Stabilization 70 (59) 38 (37)
(Merriman et al, 2009; Cook, 1999; DPRA Inc, 1989; SEPA, 2010; SWCS, 2008; Yagow et al, 2002)
Conservation Tillage 55 (56) 45 (42)
(SERA 17, 2009; Yagow et al, 2002; Bryant et al, 2008; Gitau et al, 2005; Schenepf and Cox, 2006)
Streambank Fencing 40 (47) 30 (30) (Schnepf, 2006; Cook, 1999; SWCS,
2008; Merriman et al, 2009)
Cover Crops 35 (44) 48 (37) (Merriman et al, 2009; Dinnes, 2004; Yagow et al, 2002; SEPA, 2010; SWCS, 2008; Schnepf and Cox, 2006)
Reforestation 14 (27) 10 (27) (Merriman et al, 2009; SWCS, 2008)
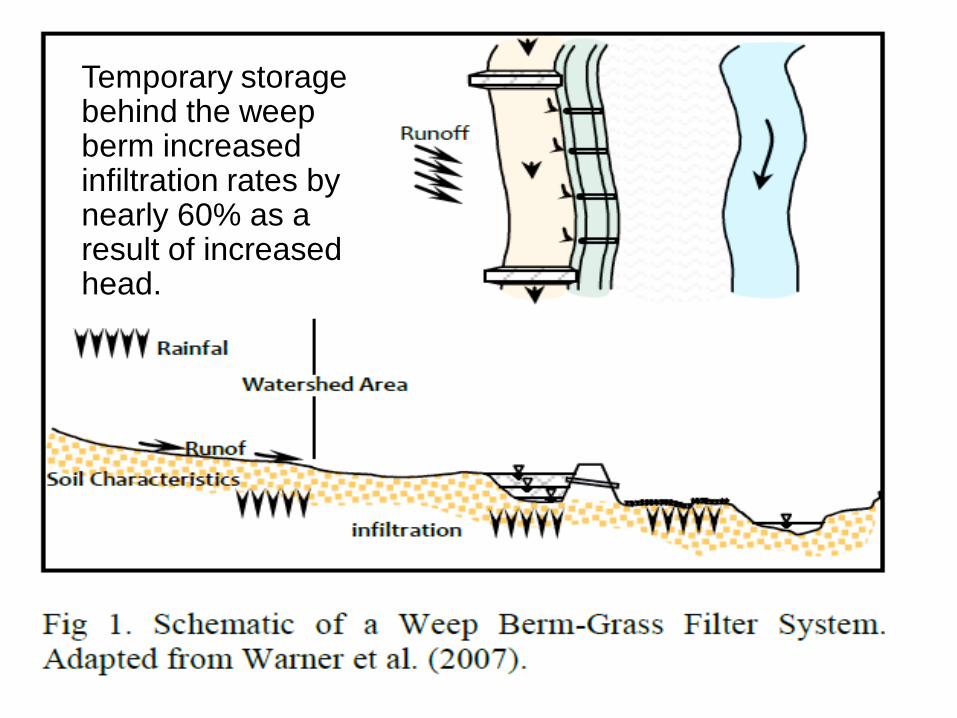
Temporary storage behind the weep berm increased infiltration rates by nearly 60% as a result of increased head.
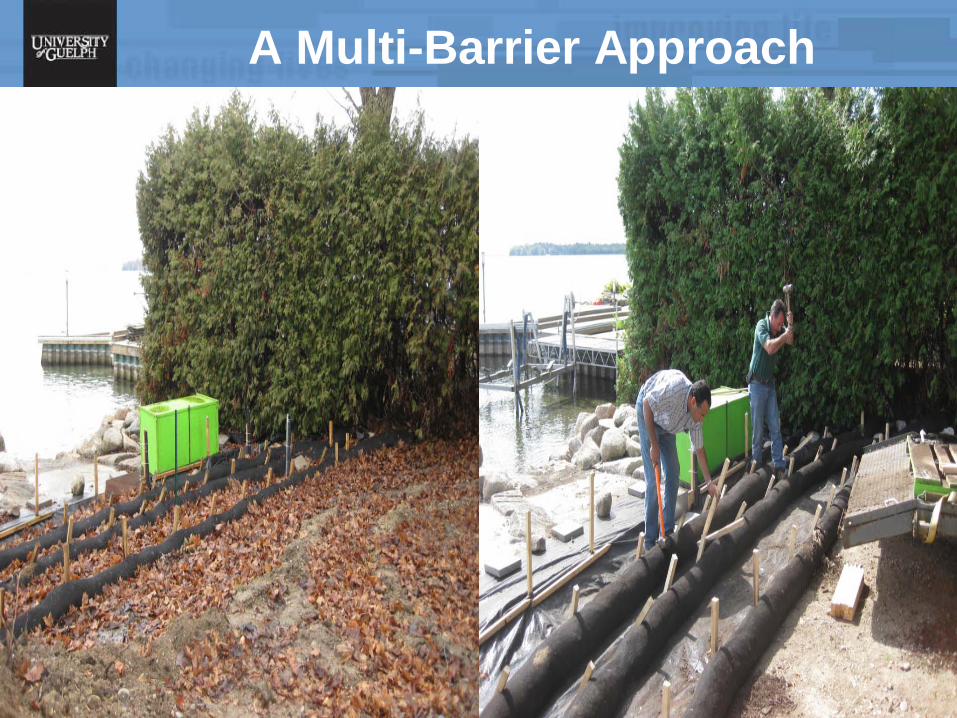
A Multi-Barrier Approach
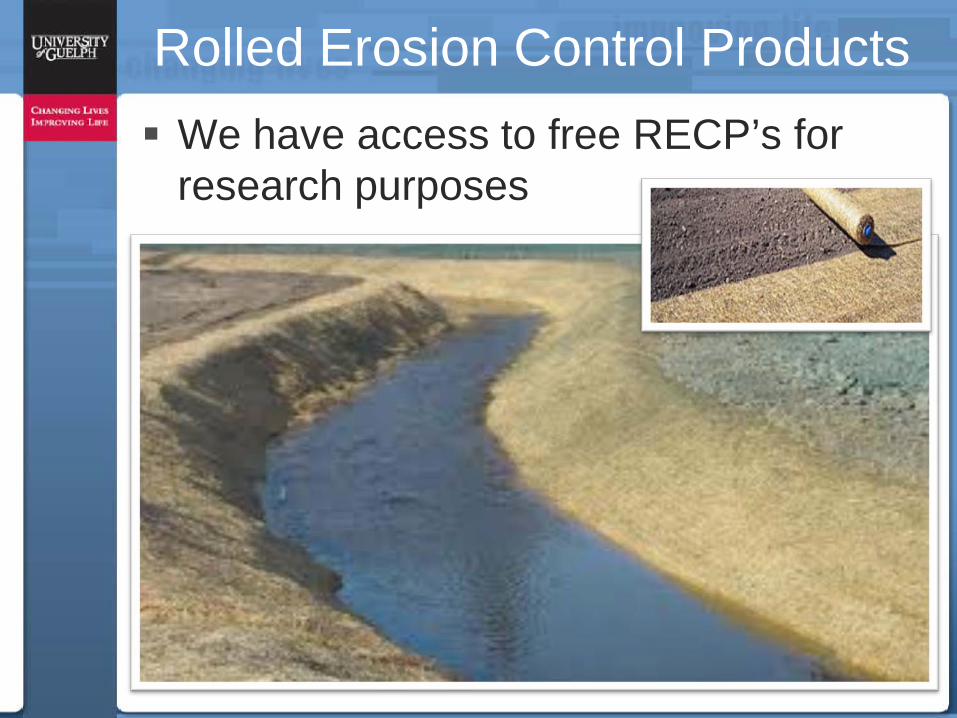
Rolled Erosion Control Products We have access to free RECP’s for
research purposes
46
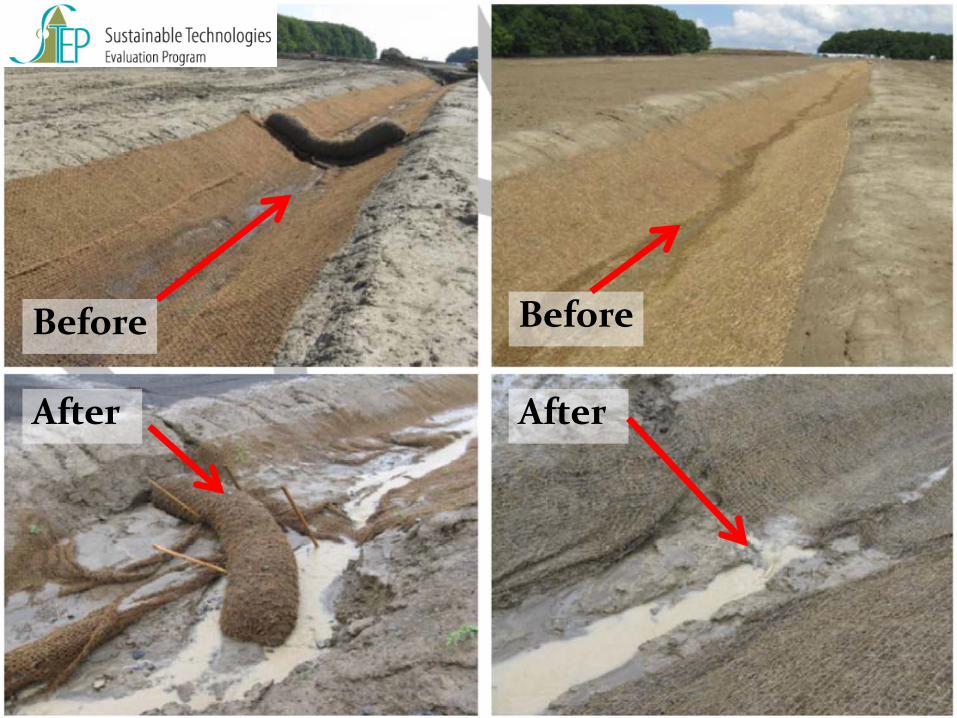
Before Before
After After
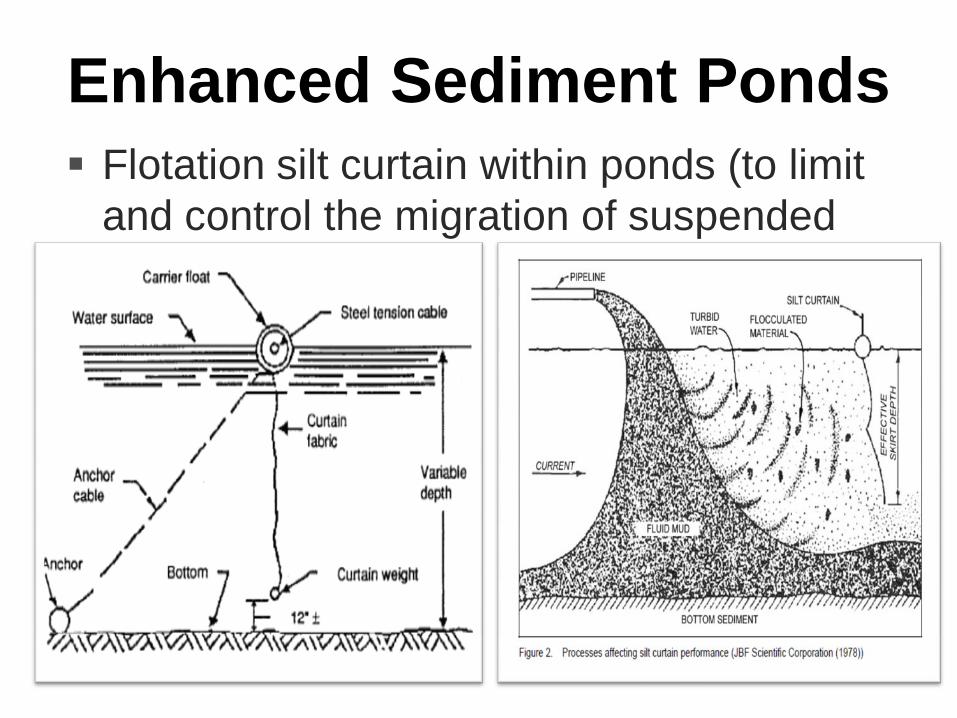
Flotation silt curtain within ponds (to limit and control the migration of suspended sediment)
Enhanced Sediment Ponds
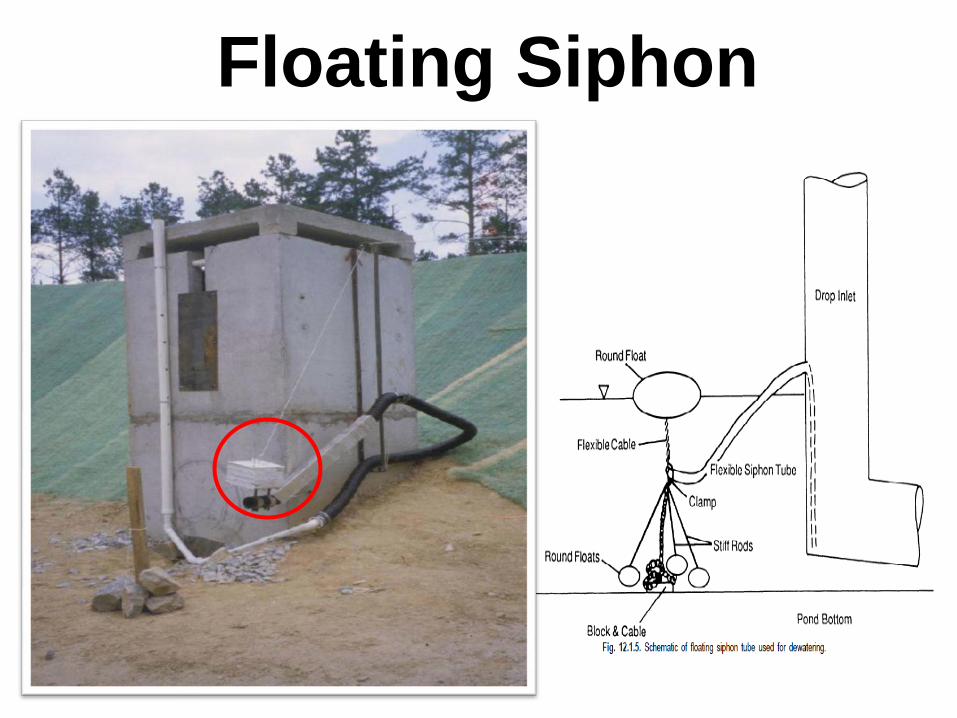
Floating Siphon
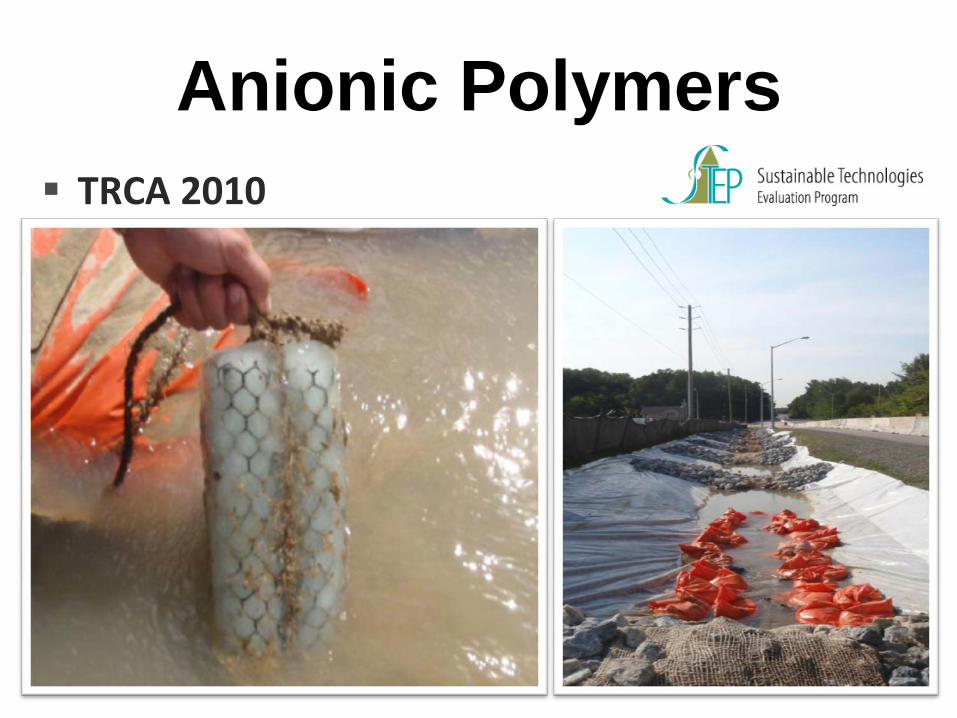
TRCA 2010
Anionic Polymers

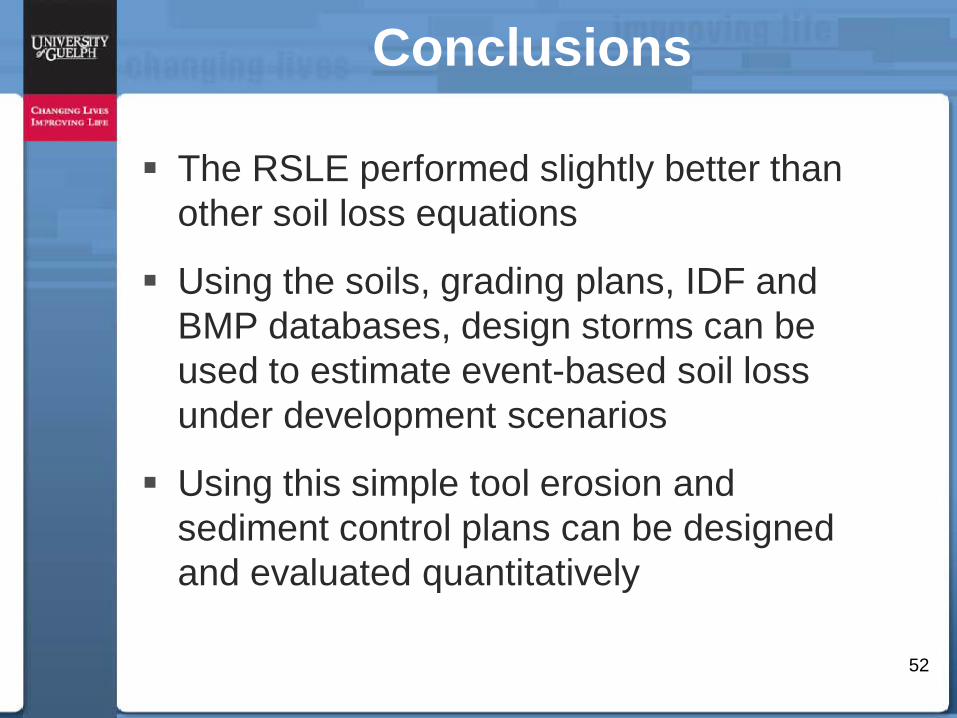
Conclusions
The RSLE performed slightly better than other soil loss equations
Using the soils, grading plans, IDF and BMP databases, design storms can be used to estimate event-based soil loss under development scenarios
Using this simple tool erosion and sediment control plans can be designed and evaluated quantitatively
52
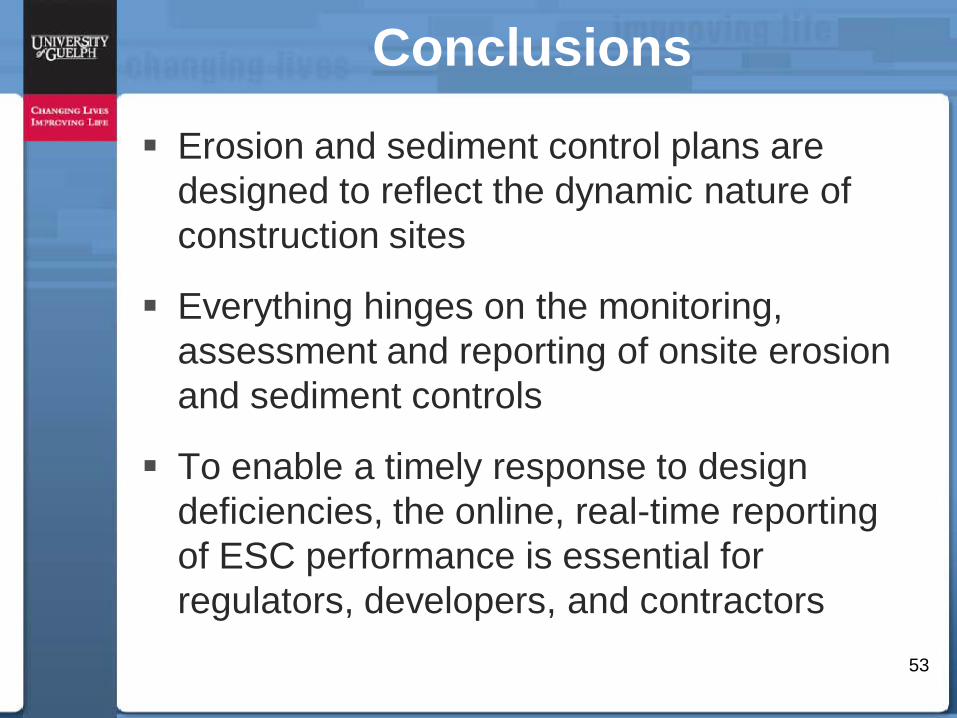
Conclusions
Erosion and sediment control plans are designed to reflect the dynamic nature of construction sites
Everything hinges on the monitoring, assessment and reporting of onsite erosion and sediment controls
To enable a timely response to design deficiencies, the online, real-time reporting of ESC performance is essential for regulators, developers, and contractors
53

http://dev.web.uoguelph.ca/engineering/swm/
Acknowledgements Environment Canada Ontario Centres for Excellence Ontario Ministry of the Environment Lake Simcoe Region Conservation Authority Toronto and Region Conservation Authority Simcoe County District School Board Town of Innisfil and City of Guelph The Cortel Group and Greenland Consulting Metrus Development and Exp Consulting Pratt Development and EXP Consulting Alcona Downs Development and Stantec Consulting Filtrexxx Canada 55


![Peggy Thompson Film Research Collection - UBC … · Peggy Thompson Film Research Collection Compiled by Jennifer Vanderfluit (2016) ... [gangsters w/machine guns]. United Artists.](https://static.fdocuments.us/doc/165x107/5afc20077f8b9a814d8bb2e2/peggy-thompson-film-research-collection-ubc-thompson-film-research-collection.jpg)


