William J. Hughes Technical Center Flight Progress...
116
DOT/FAA/TC-09/08 Federal Aviation Administration William J. Hughes Technical Center Atlantic City International Airport, NJ 08405 Comparing the Tower Operations Digital Data System to Paper Flight Progress Strips in Zero- Visibility Operations Todd R. Truitt, Ph.D., Human Factors Team – Atlantic City, ATO-P Robert Muldoon, M.S., Northrop Grumman Information Technology July 2009 Technical Report This document is available to the public through the National Technical Information Service (NTIS), Springfield, VA 22161. A copy is retained for reference at the William J. Hughes Technical Center Library. U.S. Department of Transportation Federal Aviation Administration
Transcript of William J. Hughes Technical Center Flight Progress...
DOT/FAA/TC-09/08 Federal Aviation Administration William J. Hughes Technical Center Atlantic City International Airport, NJ 08405
Comparing the Tower Operations Digital Data System to Paper Flight Progress Strips in Zero-Visibility Operations Todd R. Truitt, Ph.D., Human Factors Team – Atlantic City, ATO-P Robert Muldoon, M.S., Northrop Grumman Information Technology July 2009 Technical Report
This document is available to the public through the National Technical Information Service (NTIS), Springfield, VA 22161. A copy is retained for reference at the William J. Hughes Technical Center Library.
U.S. Department of Transportation Federal Aviation Administration

NOTICE
This document is disseminated under the sponsorship of the U.S. Department
of Transportation in the interest of information exchange. The United States
Government assumes no liability for the contents or use thereof. The United
States Government does not endorse products or manufacturers. Trade or
manufacturers’ names appear herein solely because they are considered
essential to the objective of this report. This document does not constitute
Federal Aviation Administration (FAA) certification policy. Consult your
local FAA aircraft certification office as to its use.
This report is available at the FAA William J. Hughes Technical Center’s full-
text Technical Reports Web site: http://actlibrary.tc.faa.gov in Adobe®
Acrobat® portable document format (PDF).

Technical Report Documentation Page 1. Report No.
DOT/FAA/TC-09/08
2. Government Accession No. 3. Recipient’s Catalog No.
4. Title and Subtitle
Comparing the Tower Operations Digital Data System to Paper Flight Progress Strips in
Zero-Visibility Operations
5. Report Date
July 2009
6. Performing Organization Code
AJP-6110
7. Author(s)
Todd R. Truitt, Ph.D., Human Factors Team – Atlantic City, ATO-P
Robert Muldoon, M.S., Northrop Grumman Information Technology
8. Performing Organization Report No.
DOT/FAA/TC-09/08
10. Work Unit No. (TRAIS)
9. Performing Organization Name and Address
Federal Aviation Administration
Human Factors Team – Atlantic City, ATO-P
William J. Hughes Technical Center
Atlantic City International Airport, NJ 08405
11. Contract or Grant No.
13. Type of Report and Period Covered
Technical Report
12. Sponsoring Agency Name and Address
Federal Aviation Administration
Human Factors Research and Engineering Group
800 Independence Avenue, S.W.
Washington, DC 20591
14. Sponsoring Agency Code
AJP-61
15. Supplementary Notes
16. Abstract
The current experiment used a high-fidelity, human-in-the-loop simulation to compare the Tower Operations Digital Data System
(TODDS) to paper flight progress strips (FPSs) during zero-visibility Airport Traffic Control Tower operations. Sixteen current
controllers participated in groups of two. Each group received touchscreen and TODDS training before completing eight practice
and eight test scenarios. The participants worked at both the ground and local control positions under four experimental conditions.
The participants used either the Integrated TODDS (electronic flight data integrated with surface surveillance, weather information,
and digital-taxi communications), FPSs with Airport Surface Detection Equipment – Model X (ASDE-X), Perceptual-Spatial
TODDS (electronic flight data integrated with weather information and digital-taxi communications, but no surface surveillance), or
FPSs only, to control airport traffic. The participants had a Standard Terminal Automation Replacement System (STARS) display in
all four conditions, but did not have an out-the-window view. Dependent measures included the number and duration of airport
operations, number and duration of communications, TODDS usability, and participant opinion. The data revealed advantages for
surface surveillance and TODDS. The Integrated TODDS provided additional benefits that may help reduce the risk of runway
incursions, ease the flow of surface operations, and support the Staffed Virtual Tower concept.
17. Key Words
Airport Traffic Control Tower
Electronic Flight Data
NextGen
Tower Operations
18. Distribution Statement
This document is available to the public through the
National Technical Information Service, Springfield,
Virginia, 22161. A copy is retained for reference at
the William J. Hughes Technical Center Library.
19. Security Classification (of this report) Unclassified
20. Security Classification (of this page)
Unclassified 21. No. of Pages
116 22. Price
Form DOT F 1700.7 (8-72) Reproduction of completed page authorized

iii
Table of Contents
Page
Acknowledgments......................................................................................................................... vii
Executive Summary....................................................................................................................... ix
1. INTRODUCTION ...................................................................................................................... 1
1.1 Background........................................................................................................................... 1
1.2 Purpose.................................................................................................................................. 6
2. METHOD ................................................................................................................................... 7
2.1 Participants............................................................................................................................ 7
2.2 Apparatus .............................................................................................................................. 8
2.3 Procedure .............................................................................................................................. 9
2.3.1 Touchscreen Training Protocol.................................................................................. 10
2.3.2 TODDS Training ....................................................................................................... 11
2.3.3 Practice and Experimental Scenarios......................................................................... 11
2.3.4 Airport Traffic Scenario............................................................................................. 12
3. RESULTS ................................................................................................................................. 14
3.1 Airport System Metrics....................................................................................................... 15
3.1.1 Number of Airport Operations................................................................................... 15
3.1.2 Ramp Waiting Time................................................................................................... 15
3.1.3 Taxi Operations.......................................................................................................... 16
3.1.4 Departure Delays ....................................................................................................... 18
3.1.5 Operational Errors...................................................................................................... 19
3.1.6 Surface Movement Clearances .................................................................................. 20
3.1.7 Push-To-Talk ............................................................................................................. 22
3.1.7.1 PTT – Ground Controller to Pilot.................................................................. 22
3.1.7.2 PTT – Pilot to Ground Controller.................................................................. 24
3.1.7.3 PTT – Local Controller to Pilot..................................................................... 25
3.1.7.4 PTT – Pilot to Local Controller..................................................................... 25
3.2 TODDS Usability ............................................................................................................... 26
3.2.1 Integrated TODDS..................................................................................................... 27
3.2.2 Perceptual-Spatial TODDS........................................................................................ 30
3.3 Post-Scenario Questionnaire............................................................................................... 33
3.4 Post-Experiment Questionnaire .......................................................................................... 36
4. RECOMMENDED DESIGN CHANGES................................................................................ 37
4.1 Recommended Design Changes for I-TODDS................................................................... 37
4.1.1 Improve Automatic Data Block Offset ...................................................................... 37
4.1.2 Redesign Proximal List Header/Button Labels ......................................................... 38
4.1.3 Position of Recalled FDEs......................................................................................... 38
4.1.4 Improve Runway Occupancy Indicator ..................................................................... 39
iv
4.2 Recommended Design Changes for PS-TODDS................................................................ 39
4.2.1 Remove FDEs from the Departure List ..................................................................... 39
4.2.2 Reduce FDE Drag Sensitivity.................................................................................... 39
4.2.3 Modify the FDE Recall Procedure............................................................................. 40
4.3 Recommended Common Design Changes for the I-TODDS and the PS-TODDS ............ 41
4.3.1 Increase Salience of Hold Short Indicator ................................................................. 41
4.3.2 Increase Salience of ATIS Update............................................................................. 41
4.3.3 Add METAR Information ......................................................................................... 41
5. CONCLUSION AND RECOMMENDATIONS ..................................................................... 41
References..................................................................................................................................... 43
Acronyms...................................................................................................................................... 44
Appendix A – Informed Consent Statement
Appendix B – Biographical Questionnaire
Appendix C – Touchscreen Training Instructions
Appendix D – TODDS Training Protocol
Appendix E – Post-Scenario Questionnaire
Appendix F – Post-Experiment Questionnaire
Appendix G – Justification for Repeated Measures ANOVA Procedure
Appendix H – Participants’ Responses for the Post-Scenario Questionnaire
Appendix I – Participants’ Responses for the Post-Experiment Questionnaire

v
List of Illustrations
Figures Page
Figure 1. The I-TODDS interface for the ground control position................................................. 3
Figure 2. The I-TODDS interface for the local control position. ................................................... 4
Figure 3. The PS-TODDS interface for the ground control position.............................................. 5
Figure 4. The PS-TODDS interface for the local control position. ................................................ 6
Figure 5. Equipment including the ground and local controller positions, ASDE-X, and STARS
displays. The IDS display and FPS bays are not shown. ............................................... 8
Figure 6. Airport diagram including runways, taxiways, and ramp spots. ................................... 13
Figure 7. Mean duration of ramp waiting time per aircraft for departure aircraft by surface
surveillance presence and flight data type..................................................................... 16
Figure 8. Mean duration of taxi-out operations per aircraft by surface surveillance presence and
flight data type............................................................................................................... 17
Figure 9. Mean duration of taxi-in operations per aircraft by surface surveillance presence and
flight data type............................................................................................................... 17
Figure 10. Mean number of departure delays by surface surveillance presence and flight data
type. ............................................................................................................................. 18
Figure 11. Mean duration of departure delays by surface surveillance presence and flight data
type. ............................................................................................................................. 19
Figure 12. Mean number of ground controller-to-pilot transmissions by surface surveillance
presence and flight data type. ...................................................................................... 23
Figure 13. Mean duration of ground controller-to-pilot transmissions by surface surveillance
presence and flight data type. ...................................................................................... 23
Figure 14. Mean number of pilot-to-ground controller transmissions by surface surveillance
presence and flight data type. ...................................................................................... 24
Figure 15. Mean duration of pilot-to-ground controller transmissions by surface surveillance
presence and flight data type. ...................................................................................... 25
Figure 16. Mean number of pilot-to-local controller transmissions by surface surveillance
presence and flight data type. ...................................................................................... 26
Figure 17. Mean duration of pilot-to-local controller transmissions by surface surveillance
presence and flight data type. ...................................................................................... 26
Figure 18. Recommend button/header design for the ground (left) and local (right) control
positions to prevent inadvertent selection of a proximal button. ................................ 38
vi
Tables Page
Table 1. Means and Standard Deviations (SD) for the Biographical Questionnaire ...................... 7
Table 2. Schedule of Events............................................................................................................ 9
Table 3. Button Sizes (width X height) Used in the Touchscreen Training Protocol .................. 10
Table 4. Equipment Used in the Four Experimental Conditions .................................................. 11
Table 5. Counterbalancing Order of Conditions........................................................................... 12
Table 6. Mean (SD) Number of Airport Operations by Type and Condition ............................... 15
Table 7. Mean (SD) Number of Operational Errors by Type and Condition ............................... 20
Table 8. Mean (SD) Number of Clearances by Type and Condition............................................ 21
Table 9. Mean Number of Touchscreen Actions, Error Rates, and Percentage Change in Error
Rates for the Ground and Local Control Positions with the Integrated TODDS............ 27
Table 10. Number of Task Errors and Task Failures by Type for I-TODDS............................... 29
Table 11. Mean Number of Touchscreen Actions, Error Rates, and Percentage Change in Error
Rates for the Ground and Local Control Positions with PS-TODDS........................... 30
Table 12. Number of Task Errors by Type for PS-TODDS ......................................................... 32
Table 13. Mean (SD) Post-Scenario Questionnaire Ratings for the Ground Control Positions
by Experimental Condition........................................................................................... 33
Table 14. Mean (SD) Post-Scenario Questionnaire Ratings for the Local Control Position by
Experimental Condition................................................................................................ 34
Table 15. Mean (SD) Post-Experimental Questionnaire Ratings by Item.................................... 36

vii
Acknowledgments
Thanks to everyone who made this research possible. This project was a team effort that
required lots of skill and attention to detail. The following individuals demonstrated
extraordinary skill and their efforts are much appreciated.
Dino Piccione (FAA) – Sponsor, Program Manager – Human Factors Research and Engineering
Group
Dr. Earl S. Stein (FAA) – Group Manager – Human Factors Team - Atlantic City
Dr. D. Michael McAnulty (FAA) – Technical Lead – Human Factors Team - Atlantic City
David Chappuies (FAA) – Subject Matter Expert
Jim McGhee (Northrop Grumman IT) – Subject Matter Expert
Richard Ridgway (Northrop Grumman IT) – Subject Matter Expert
Dallas Shiles (Barco) – Software Development
Jonathan Lykens (Engility) – Software Development
Albert Macias (FAA) – Laboratory Infrastructure Management
John Dilks (Engility) – Laboratory Infrastructure Management
Wallace Daczkowski (Engility) – Laboratory Infrastructure Management
Ed Little (Engility) – Network Administrator
April Jackman (Northrop Grumman) – Technical Editor
Dana Whicker (Engility) – Software Development
Samantha Fullerton (Engility) – Software Development
George Chachis (Engility) – Simulation Pilot Coordination and Scheduling
Bob Engiles (FAA) – Simulation Pilot
Walt Ellis (Engility) – Simulation Pilot
Charlie Haubrich (Engility) – Simulation Pilot
Jack “JC” Lester (Engility) – Simulation Pilot
Andre Lonchambon (Engility) – Simulation Pilot
Brian Murphy (Engility) – Simulation Pilot
Henry “Smokey” Mahoney (Engility) – Simulation Pilot
Bruce Slack (FAA) – Simulation Pilot
FAA William J. Hughes Technical Center Metal Shop – Flight strip bays and monitor mount
construction
Special thanks to the FAA airport traffic control facilities in Las Vegas, Miami, Philadelphia,
Phoenix, and Salt Lake City for providing support and lending us some of the nation’s finest air
traffic controllers.

viii

ix
Executive Summary
The planned Next Generation Air Transportation System (NextGen) calls for a number of
operational improvements in all air traffic domains. In anticipation of these future improvements,
Federal Aviation Administration Engineering Research Psychologists used a rapid prototyping
methodology and worked with air traffic Subject Matter Experts and software developers to
design and build the Tower Operations Digital Data System (TODDS) prototypes. TODDS is an
integrated information display and interface concept for use by ground and local controllers in
Airport Traffic Control Towers (ATCTs). We created two TODDS prototypes to accommodate
ATCTs with and without surface surveillance technology. The Integrated TODDS (I-TODDS)
relies on surface surveillance and combines Electronic Flight Data (EFD), aircraft position,
weather information, and digital communications. The Perceptual-Spatial TODDS (PS-TODDS)
does not integrate surface surveillance, but uses a map that allows controllers to organize flight
data spatially and integrate EFD, weather information, and digital communications. Both
TODDS prototypes were designed to support current ATCT operations, but the I-TODDS also
provides a potential solution for future Staffed NextGen Tower (SNT) operations.
The current experiment compared the TODDS concepts to current operations using paper Flight
Progress Strips (FPSs) both with and without surface surveillance. Sixteen controller participants
worked busy airport traffic, without an out-the-window (OTW) view (i.e., zero visibility), under
four conditions: I-TODDS, PS-TODDS, FPSs with surface surveillance and an Information
Display System (IDS) weather display, or FPSs without surface surveillance and an IDS weather
display. The participants had access to short-range radar information supplied by a Standard
Terminal Automation Replacement System (STARS) display in all four conditions. During the
experiment, the researchers collected objective measures of airport operations, controller and
pilot communications, and usability metrics for the TODDS. The participants provided
subjective ratings and feedback concerning workload, awareness, and the usability of the TODDS.
The participants reported that surface surveillance increased their awareness of the traffic
situation and reduced their overall level of effort. The presence of surface surveillance also
significantly improved airport efficiency by increasing the number of departures and by reducing
ramp waiting time, number and duration of departure delays, and number of ground controller-
to-pilot transmissions. When the participants used the TODDS, the ramp-waiting time increased
due to data communications, but the number and duration of ground controller-to-pilot
transmissions decreased. The I-TODDS decreased the duration of taxi-out and taxi-in operations.
The participants’ use of the I-TODDS also resulted in an operational increase in the number of
departures and a reduction in the number and duration of departure delays, but these differences
were not statistically significant. The overall error rate for the TODDS usage was 4% − which is
a reduction from the initial design concept where the error rate was 12% for the I-TODDS and
8% for the PS-TODDS. The participants reported that the TODDS would be useful, and they
thought it would have a positive effect on ATCT operations − especially when integrated with
surface surveillance, as in the I-TODDS condition. However, the participants had some
reservations about the PS-TODDS because they thought it required more effort and could
mislead the ground controller regarding true aircraft position.

x
Based on the results of this experiment where the participants did not have an OTW view, we
believe that the I-TODDS may support SNT operations. Therefore, the authors recommend a
number of design changes to improve both the usability and the capability of the TODDS.
Future experiments should compare the TODDS with and without an OTW view to assess the
quantity and quality of heads-down time while continuing to refine and expand the scope of the
original concept.
1
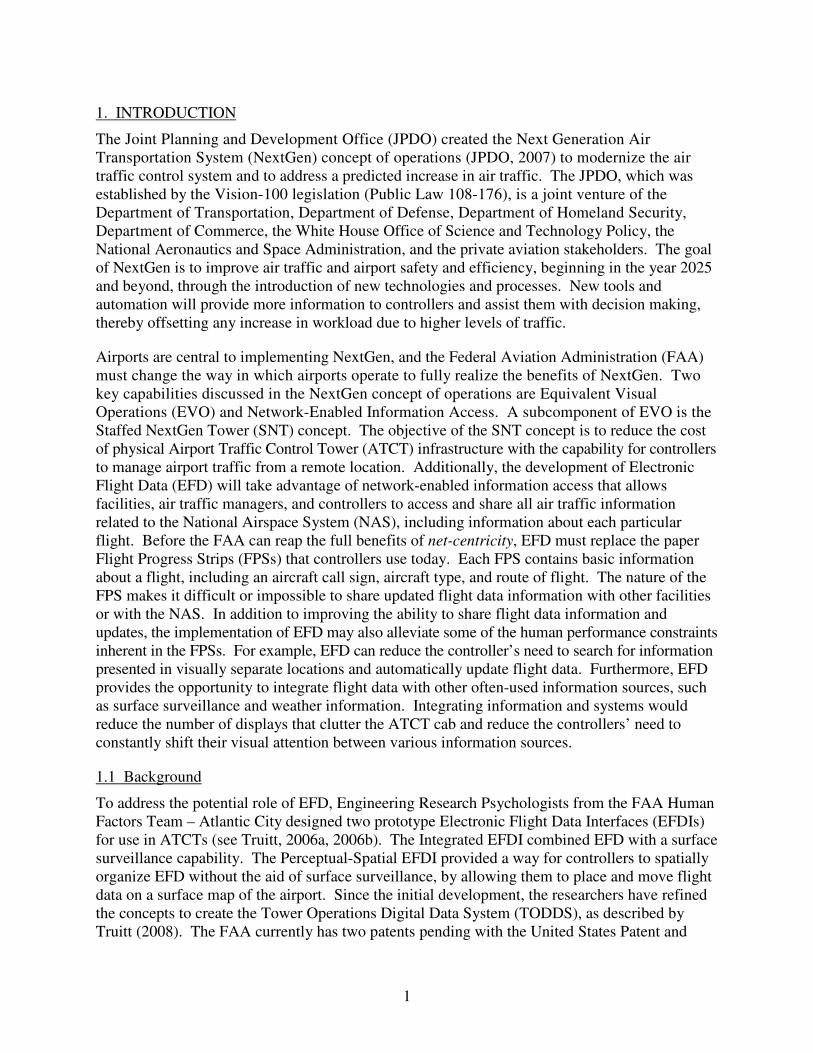
1. INTRODUCTION
The Joint Planning and Development Office (JPDO) created the Next Generation Air
Transportation System (NextGen) concept of operations (JPDO, 2007) to modernize the air
traffic control system and to address a predicted increase in air traffic. The JPDO, which was
established by the Vision-100 legislation (Public Law 108-176), is a joint venture of the
Department of Transportation, Department of Defense, Department of Homeland Security,
Department of Commerce, the White House Office of Science and Technology Policy, the
National Aeronautics and Space Administration, and the private aviation stakeholders. The goal
of NextGen is to improve air traffic and airport safety and efficiency, beginning in the year 2025
and beyond, through the introduction of new technologies and processes. New tools and
automation will provide more information to controllers and assist them with decision making,
thereby offsetting any increase in workload due to higher levels of traffic.
Airports are central to implementing NextGen, and the Federal Aviation Administration (FAA)
must change the way in which airports operate to fully realize the benefits of NextGen. Two
key capabilities discussed in the NextGen concept of operations are Equivalent Visual
Operations (EVO) and Network-Enabled Information Access. A subcomponent of EVO is the
Staffed NextGen Tower (SNT) concept. The objective of the SNT concept is to reduce the cost
of physical Airport Traffic Control Tower (ATCT) infrastructure with the capability for controllers
to manage airport traffic from a remote location. Additionally, the development of Electronic
Flight Data (EFD) will take advantage of network-enabled information access that allows
facilities, air traffic managers, and controllers to access and share all air traffic information
related to the National Airspace System (NAS), including information about each particular
flight. Before the FAA can reap the full benefits of net-centricity, EFD must replace the paper
Flight Progress Strips (FPSs) that controllers use today. Each FPS contains basic information
about a flight, including an aircraft call sign, aircraft type, and route of flight. The nature of the
FPS makes it difficult or impossible to share updated flight data information with other facilities
or with the NAS. In addition to improving the ability to share flight data information and
updates, the implementation of EFD may also alleviate some of the human performance constraints
inherent in the FPSs. For example, EFD can reduce the controller’s need to search for information
presented in visually separate locations and automatically update flight data. Furthermore, EFD
provides the opportunity to integrate flight data with other often-used information sources, such
as surface surveillance and weather information. Integrating information and systems would
reduce the number of displays that clutter the ATCT cab and reduce the controllers’ need to
constantly shift their visual attention between various information sources.
1.1 Background
To address the potential role of EFD, Engineering Research Psychologists from the FAA Human
Factors Team – Atlantic City designed two prototype Electronic Flight Data Interfaces (EFDIs)
for use in ATCTs (see Truitt, 2006a, 2006b). The Integrated EFDI combined EFD with a surface
surveillance capability. The Perceptual-Spatial EFDI provided a way for controllers to spatially
organize EFD without the aid of surface surveillance, by allowing them to place and move flight
data on a surface map of the airport. Since the initial development, the researchers have refined
the concepts to create the Tower Operations Digital Data System (TODDS), as described by
Truitt (2008). The FAA currently has two patents pending with the United States Patent and
2
Trademark Office; one for each of the original designs of the Integrated TODDS (I-TODDS) and
the Perceptual-Spatial TODDS (PS-TODDS) (see Truitt, 2006a).
To design the TODDS, we used an interface development process based on The Bridge
methodology (Dayton, McFarland, & Kramer, 1998) that relies on a multidisciplinary team and
continuous usability testing throughout the development process. By creating and submitting
task flows and paper prototypes to repeated usability testing before creating the functional
prototypes, we were able to ensure that the resulting interfaces would function as expected. The
Bridge methodology also allowed the interface design team to address numerous usability and
task flow problems before the software development began. We continued to conduct usability
testing during the subsequent software development and rapid prototyping. Truitt (2006a)
provides the details of the entire design and development process.
When the initial prototypes were functional, the researchers conducted formal usability testing to
identify remaining problems and to ensure that actual users could learn and operate the interfaces
effectively (Truitt & Muldoon, 2007). The initial usability test provided data that enabled us to
refine the EFDIs and to expand the scope of the concept into the TODDS. The initial usability
test identified features that were the most difficult to use, and it provided the controller participants
with an opportunity to identify any missing information and to make suggestions for new features.
The participants included current and supervisory ATCT controllers who worked in teams of two
(one local controller, and one ground controller) to manage flight data with the EFDIs in a part-
task simulation. They completed a training protocol and practice scenarios before engaging in
the test scenarios. Throughout the simulation, we observed each participant’s behavior and
recorded audio, video, and user interaction data. We calculated error rates and assessed whether
the participants’ performance had changed after practice. We also collected subjective responses
from the participants regarding the usability of the EFDIs. The results showed that the
participants were able to learn how to operate the EFDIs rather quickly. However, they may not
have had enough time to learn how to use the touch sensitive displays reliably. For the
Integrated EFDI, the participants had an error rate of 16% during practice and an error rate of
12% during the test. For the Perceptual-Spatial EFDI, the participants had an error rate of 7%
during practice and 8% during the test. The relatively high error rates resulted from a few
actions that the participants had difficulty performing. Overall, the participants’ responses to the
EFDIs were favorable. The participants thought the EFDIs were well organized and easy to use.
They also thought that the EFDIs required little effort, provided all of the necessary flight data,
and supported their awareness of the airport traffic situation. However, there were several
functions that were difficult to use, which may have contributed to the participants’ concerns that
the EFDIs may cause too much “heads-down” time and may be labor intensive in some
situations. The researchers made recommendations to improve the usability of the EFDIs by
suggesting changes for difficult-to-perform actions and by considering the participants’
suggestions for new features.
We designed the newest version of the EFDIs, the TODDS, to address the findings of the
usability test and to expand the scope of the interfaces beyond flight data management. In
addition to making the most difficult features easier to use, the TODDS added the ability for
ATCT controllers to issue digital-taxi (D-Taxi) clearances and to perform taxi-conformance
monitoring for departure aircraft, to indicate closed runway and taxiway segments, and to access

3
integrated weather information, including advisories for wake turbulence separation. Truitt
(2008) presents a complete description of the concept refinements and new features. We also
designed a touchscreen training protocol to better familiarize users with the touch sensitive
displays, prior to learning how to use the TODDS. Figures 1, 2, 3, and 4 present screen captures
of the I-TODDS and the PS-TODDS interfaces for the ground and local control positions.
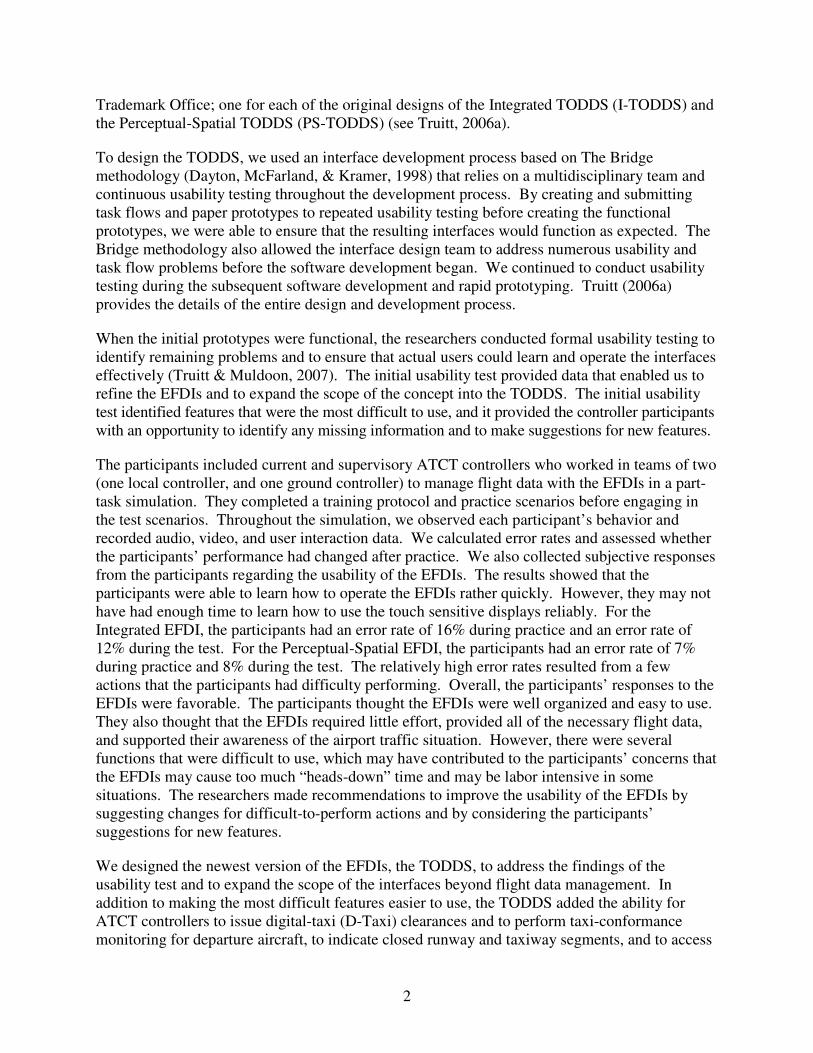
Figures 1 and 2 present screen captures of the I-TODDS including lists of flight data elements
(FDEs), flight data readout area, airport map with surface surveillance, aircraft position symbols,
data blocks, weather information, and quick action buttons. Figures 3 and 4 present screen
captures of the PS-TODDS including arrival and departure FDEs, flight data readout area, airport
map, weather information, and quick action buttons.
Figure 1. The I-TODDS interface for the ground control position.
4
Figure 2. The I-TODDS interface for the local control position.

5
Figure 3. The PS-TODDS interface for the ground control position.
6
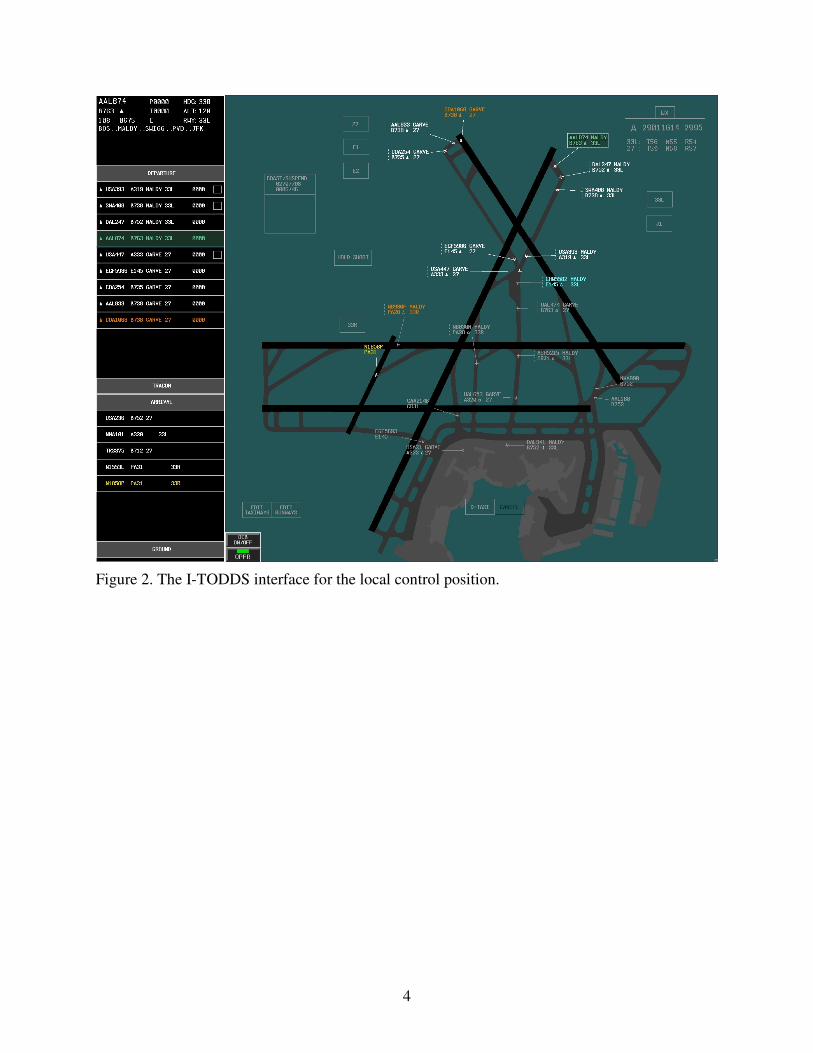
Figure 4. The PS-TODDS interface for the local control position.
1.2 Purpose
The purpose of this experiment was to compare the I-TODDS and the PS-TODDS to paper FPSs
in a zero-visibility ATCT operation. We also wanted to collect additional usability data on the
TODDS interface designs and assess the controllers’ ability to use the touchscreen hardware.
We implemented an experimental design to answer the following research questions.
1. Does the I-TODDS provide any advantages over FPSs with surface surveillance in a
zero-visibility environment?
2. Does the PS-TODDS provide any advantages over FPSs in a zero-visibility environment
when surface surveillance is unavailable?
3. Are the new TODDS enhancements effective and easy to use?
4. What additional features are required to improve the TODDS capability and to better
support the ATCT controllers’ tasks?
5. Is the I-TODDS a potential solution for the SNT concept?

7
2. METHOD
We conducted the experiment in the Research, Development, and Human Factors Laboratory
(RDHFL) at the FAA William J. Hughes Technical Center. The experiment placed current
ATCT controllers in a high-fidelity, human-in-the-loop (HITL) simulation to compare paper
FPSs to the TODDS under zero-visibility conditions. The controller participants did not have an
out-the-window (OTW) view and had to control airport traffic using only remote surveillance
capability and pilot position reports. After receiving touchscreen and interface training, the
participants controlled simulated airport traffic from both the ground and local control positions.
The experiment used a 2 (run number – first vs. second) x 2 (flight data type - TODDS vs. FPS)
x 2 (surface surveillance - yes vs. no) within-subjects repeated measures design.
2.1 Participants
Sixteen current ATCT controllers (15 male, and 1 female) served as the participants. We
recruited the participants from ATCT facilities rated at Level 10 and above so that they would
have some experience with complex, high traffic operations. Because the simulated ATCT
environment was similar to a configuration of Boston Logan International Airport (BOS), to
ensure valid results, controllers from Boston ATCT were not eligible as participants. The
participants took part in groups of two and were always in a group with someone from their own
facility. The participants completed the Informed Consent Statement (see Appendix A) and
provided information about themselves by completing the Biographical Questionnaire (see
Appendix B). All participants had normal or corrected-to-normal vision. Ten of the participants
wore corrective lenses during the experiment. The participants averaged 42.4 years of age and
had actively worked in an ATCT for an average of 17.8 years. The participants rated their skill
level as high and their level of stress as low. They also reported being highly motivated to
participate in the experiment. Table 1 summarizes the participants’ responses on the
biographical questionnaire.
Table 1. Means and Standard Deviations (SD) for the Biographical Questionnaire
Item Question Mean (SD)
3 What is your age (years)? 42.4 (7.3)
4 How long (years) have you worked as a Certified Professional Controller
(include both FAA and military experience)?
19.3 (8.0)
5 How long (years) have you worked as a Certified Professional Controller
for the FAA?
17.3 (7.6)
6 How long (years) have you actively controlled traffic in an airport traffic
control tower?
17.8 (6.6)
7 How many of the past 12 months have you actively controlled traffic in an
airport traffic control tower?
12.0 (0.0)
8 Rate your current skill as a Certified Professional Controller. 9.1 (0.8)
9 Rate your current level of stress. 2.9 (1.7)
10 Rate your level of motivation to participate in this study. 9.2 (0.8)
8
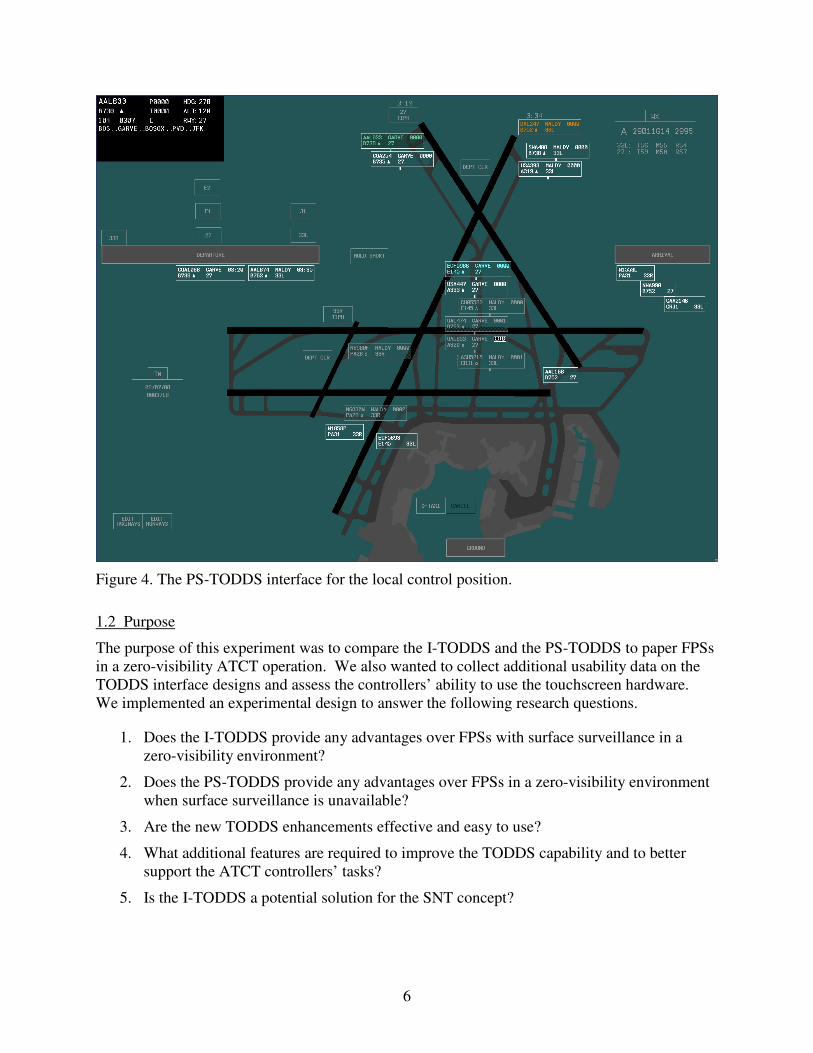
2.2 Apparatus
The experiment room contained five displays. Three displays were 21.3″ VarTech Systems, Inc.
touchscreens. Each touchscreen had an active display area of 17″ (43.2 cm) wide and 12.75″
(32.4 cm) high with a 1,600 x 1,200-pixel format and a viewing angle of 85 degrees. The
touchscreens used resistive technology to enable a surface that participants could activate with
any object, including their fingertips. We mounted each touchscreen on a stand that allowed the
user to adjust the horizontal and vertical viewing angle. Each touchscreen had an associated
Airport Surface Detection Equipment – Model X (ASDE-X) keyboard and a trackball, and a
keypad as an additional input device. Two of the touchscreens contained the ground and local
control positions of TODDS, and one contained ASDE-X. The ASDE-X display did not use the
touchscreen capability. The fourth display presented the Standard Terminal Automation
Replacement System (STARS) radar data on a Raytheon 20″ Tower Display Monitor. The fifth
display presented a single screen of the Information Display System (IDS) that showed the
Automatic Terminal Information Service (ATIS) code, ATIS update time, current wind direction,
speed, gust, and runway visual range for each active runway. Figure 5 shows the equipment
configuration (except for the IDS, which was mounted above the ASDE-X). We also constructed
two FPS bays that fit over the touchscreens for use in the FPS conditions. Each FPS bay could
hold 60 FPSs. Prior to data collection, we printed the FPSs needed for each scenario, using an
IER512 thermal printer and the appropriate thermal paper. The simulation utilized the
Distributed Environment for Simulation, Rapid Engineering, and Experimentation (DESIREE)
air traffic control simulator, the Target Generation Facility (TGF) aircraft simulator, five
simulation pilot workstations, and a two-way communications system.
Figure 5. Equipment including the ground and local controller positions, ASDE-X, and STARS
displays. The IDS display and FPS bays are not shown.

9
2.3 Procedure
The participants traveled to the RDHFL on a Monday and returned to their facility after the
completion of testing on Thursday night, or on Friday. The participants worked in groups of
two. When they arrived at the RDHFL, each participant, the Principal Investigator, and a
witness read and signed an Informed Consent Statement (see Appendix A). The participants
then completed the Biographical Questionnaire (see Appendix B) and received a briefing on the
schedule of events (see Table 2), the simulated airport traffic operations, and an overview of the
experiment. When the experimenter had answered the participants’ questions, they began the
touchscreen training protocol.
Table 2. Schedule of Events
Time Tuesday Time Wednesday Time Thursday
0830 Welcome,
Informed
Consent
0830 Practice
Scenario 3
0830 Test
Scenario 3
0900 Touchscreen
Training
0915 Break 0915 Break
1200 Lunch 0930 Practice
Scenario 4
0930 Test
Scenario 4
1300 TODDS
Training 1
1015 Break 1015 Break
1400 Break 1030 Practice
Scenario 5
1030 Test
Scenario 5
1415 TODDS
Training 2
1115 Break 1115 Break
1515 Break 1130 Practice
Scenario 6
1130 Test
Scenario 6
1530 Practice
Scenario 1
1215 Lunch 1215 Lunch
1615 Break 1315 Practice
Scenario 7
1315 Test
Scenario 7
1630 Practice
Scenario 2
1400 Break 1400 Break
1700 End of Day 1415 Practice
Scenario 8
1415 Test
Scenario 8
1500 Break 1500 Post-Experiment
Questionnaire
1515 Test
Scenario 1
1530 Out Briefing
1600 Break
1615 Test
Scenario 2
1700 End of Day

10
2.3.1 Touchscreen Training Protocol
Before starting the touchscreen training, the participants read the instructions (see Appendix C).
The experimenter then demonstrated the touchscreen tasks by giving examples of both successful
and unsuccessful trials. The participants then completed five practice trials for each of three
touchscreen tasks. The experimenter instructed the participants that the accuracy of their touches
was most important and that they should not sacrifice accuracy for speed. The experimenter then
answered any questions that the participants had. During the touchscreen training, each
participant stood centered in front of a touchscreen. The participants were instructed to keep
their body centered to the touchscreen to minimize errors due to parallax (i.e., off-angle viewing)
and to control reaching distance. For optimal performance, the experimenter also adjusted the
angle of the touchscreen to ensure that the participant was looking directly at the screen.
The touchscreen training protocol consisted of three specific tasks, each performed with 10
different button sizes, across multiple trials. The participants started with the first button size
and performed all three tasks for that button size before moving on to the next button size. The
three tasks were to select a single button, select two buttons in sequence, and drag a button to a
target area. Each participant completed a total of 30 different scenarios (i.e., three tasks for each
of 10 button sizes). Table 3 shows the button sizes in order of presentation. The size of the
target area for the drag task was approximately 50% larger than the size of the button. The
buttons (and target zone in the drag task) appeared at random locations on the touchscreen.
Table 3. Button Sizes (width X height) Used in the Touchscreen Training Protocol
Button Pixels Inches Centimeters
1 140 X 140 1.49 X 1.49 3.78 X 3.78
2 70 X 70 0.74 X 0.74 1.89 X 1.89
3 328 X 40 3.49 X 0.43 8.85 X 1.08
4 170 X 40 1.81 X 0.43 4.59 X 1.08
5 122 X 38 1.30 X 0.40 3.29 X 1.03
6 106 X 40 1.13 X 0.43 2.86 X 1.08
7 96 X 40 1.02 X 0.43 2.59 X 1.08
8 75 X 38 0.80 X 0.40 2.02 X 1.03
9 45 X 48 0.48 X 0.51 1.21 X 1.30
10 42 X 40 0.44 X 0.43 1.13 X 1.08
The participants used the index finger of their dominant hand to complete a minimum of 50 trials
and a maximum of 100 trials during each of the 30 scenarios. We required the participants to
achieve a streak of 10 successful trials in a row, with the streak occurring at or after reaching the
minimum number of trials. For example, if a participant performed Trials 41 through 50 without
an error, the scenario ended because they completed a streak of 10 and completed the minimum
number of trials. If the participant had not achieved a streak of 10 successful trials after reaching
the minimum number of trials, the scenario continued until they achieved the streak, or until they
reached the maximum number of trials. The participants could view a running tally of their
streak length, hits, and misses in the bottom right corner of the touchscreen.

11
The button border appeared highlighted in green when the participant completed a trial
successfully. The button border appeared highlighted in red when the participant failed a trial.
A trial failure was recorded for button selections if the participant’s touch landed outside of a
button’s border or if they selected a button and dragged it simultaneously. Therefore, button
selection required accuracy and concentration. When dragging a button across the screen, the
participant’s fingertip had to remain in contact with the touchscreen. Lifting their finger from
the touchscreen before placing the button completely inside the target area resulted in a failed
trial. After completing a scenario, the participant had the option of taking a break before starting
the next scenario. The entire touchscreen training protocol lasted approximately 2 hours,
including breaks.
2.3.2 TODDS Training
After the participants completed the touchscreen training, they received specific training on the
TODDS. Half of the groups received training on the I-TODDS first, and the other half received
training on the PS-TODDS first. In Appendix D, we provide an outline of the training protocol
for each of the TODDS design. The participants performed each task in the protocol to
demonstrate their understanding. If a participant was unable to complete a task, the experimenter
demonstrated the task, and then asked the participant to perform the task again. Training
continued until both participants in a group understood how to perform all of the TODDS tasks.
The training for each of the TODDS designs lasted approximately 1 hour.
2.3.3 Practice and Experimental Scenarios
After receiving the TODDS training, the participants completed eight practice scenarios by
working at both the ground and local controller positions in each of four conditions. In
Condition 1, the I-TODDS condition, the participants had access to an ASDE-X display
integrated with EFD, weather information, D-Taxi clearances, and taxi-conformance monitoring.
In Condition 2, the FPS + ASDE-X condition, the participants used FPSs and had access to the
ASDE-X and IDS weather display. In Condition 3, the PS-TODDS condition, the participants
used PS-TODDS, which included weather information and D-Taxi clearances, but they not have
access to ASDE-X. In Condition 4 (the FPS only condition), the participants used FPSs and the
IDS weather information, but did not have access to ASDE-X. When ASDE-X was not present,
the participants had to rely on pilot position reports for information about aircraft location. The
participants had access to the STARS display in all conditions. Table 4 shows the experimental
conditions and the equipment that was available in each condition.
Table 4. Equipment Used in the Four Experimental Conditions
Condition
Equipment Used 1 2 3 4
I-TODDS X
PS-TODDS X
FPS X X
ASDE-X X X
IDS X X
STARS X X X X
Note. ASDE-X is not a stand-alone system in Condition 1, but it is
integrated with the I-TODDS on a single touchscreen display.
12
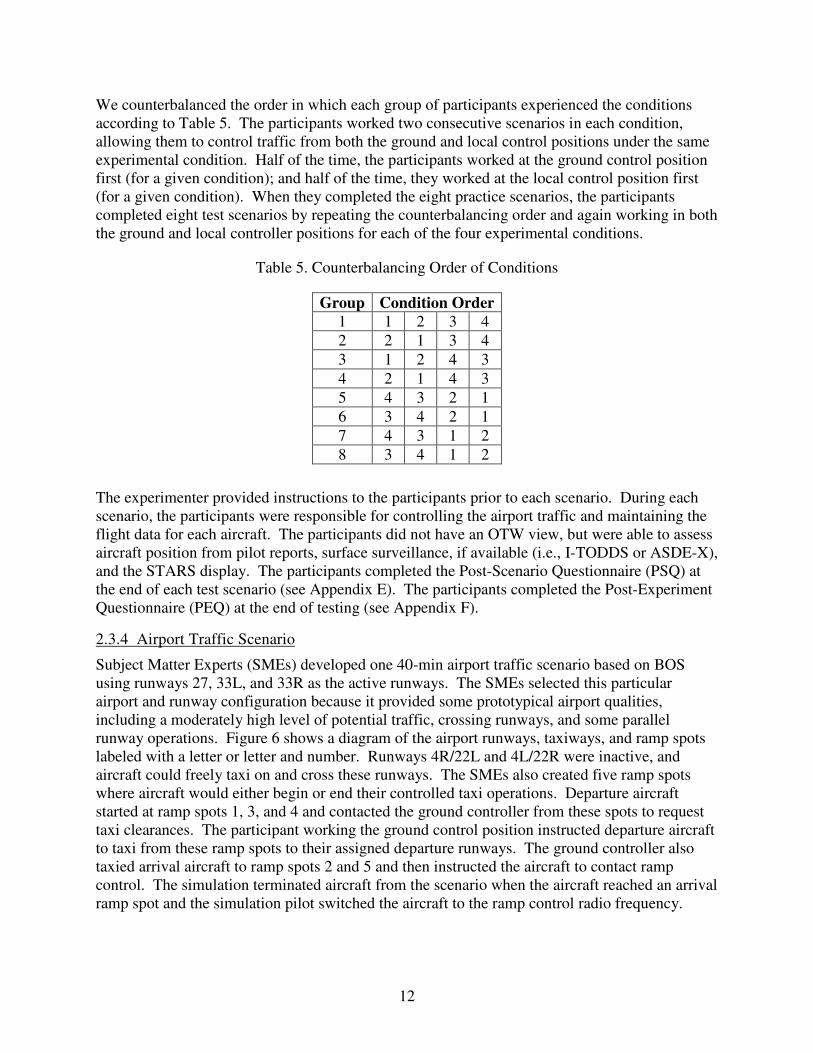
We counterbalanced the order in which each group of participants experienced the conditions
according to Table 5. The participants worked two consecutive scenarios in each condition,
allowing them to control traffic from both the ground and local control positions under the same
experimental condition. Half of the time, the participants worked at the ground control position
first (for a given condition); and half of the time, they worked at the local control position first
(for a given condition). When they completed the eight practice scenarios, the participants
completed eight test scenarios by repeating the counterbalancing order and again working in both
the ground and local controller positions for each of the four experimental conditions.
Table 5. Counterbalancing Order of Conditions
Group Condition Order
1 1 2 3 4
2 2 1 3 4
3 1 2 4 3
4 2 1 4 3
5 4 3 2 1
6 3 4 2 1
7 4 3 1 2
8 3 4 1 2
The experimenter provided instructions to the participants prior to each scenario. During each
scenario, the participants were responsible for controlling the airport traffic and maintaining the
flight data for each aircraft. The participants did not have an OTW view, but were able to assess
aircraft position from pilot reports, surface surveillance, if available (i.e., I-TODDS or ASDE-X),
and the STARS display. The participants completed the Post-Scenario Questionnaire (PSQ) at
the end of each test scenario (see Appendix E). The participants completed the Post-Experiment
Questionnaire (PEQ) at the end of testing (see Appendix F).
2.3.4 Airport Traffic Scenario
Subject Matter Experts (SMEs) developed one 40-min airport traffic scenario based on BOS
using runways 27, 33L, and 33R as the active runways. The SMEs selected this particular
airport and runway configuration because it provided some prototypical airport qualities,
including a moderately high level of potential traffic, crossing runways, and some parallel
runway operations. Figure 6 shows a diagram of the airport runways, taxiways, and ramp spots
labeled with a letter or letter and number. Runways 4R/22L and 4L/22R were inactive, and
aircraft could freely taxi on and cross these runways. The SMEs also created five ramp spots
where aircraft would either begin or end their controlled taxi operations. Departure aircraft
started at ramp spots 1, 3, and 4 and contacted the ground controller from these spots to request
taxi clearances. The participant working the ground control position instructed departure aircraft
to taxi from these ramp spots to their assigned departure runways. The ground controller also
taxied arrival aircraft to ramp spots 2 and 5 and then instructed the aircraft to contact ramp
control. The simulation terminated aircraft from the scenario when the aircraft reached an arrival
ramp spot and the simulation pilot switched the aircraft to the ramp control radio frequency.

13
Figure 6. Airport diagram including runways, taxiways, and ramp spots.
The traffic scenario included 49 departures and 31 arrivals. Arrival and departure operations
occurred on all three of the active runways. Twenty-seven of the departure aircraft were
assigned to depart runway 27, 20 were assigned to runway 33L, and two were assigned to depart
from runway 33R. Thirteen of the arrival aircraft were assigned to land on runway 27, 15 to
runway 33L, and three were assigned to land on runway 33R. Given the findings of Simmons,
Boan, and Massimini (2000), the airport traffic scenario met or exceeded the arrival/departure rate
for the BOS 27/33 configuration. The high traffic-load scenario maintained constant pressure on
the runways and provided the opportunity for any significant experimental effects to emerge.
The scenario included a variety of commercial and civil aircraft types including Airbus (A319,
A320, A321, A330), Boeing (B712, B733, B734, B735, B737, B738, B752, B762, B763),
Cessna (CRJ1), Embraer (E145), McConnell Douglas (MD80, MD88), and Piper (PA28 and
PA31). All aircraft had the ability to conduct data communications. After developing the base
air traffic scenario, the SMEs created 16 different “versions” of the base scenario by changing

14
the aircraft call signs. By changing only the aircraft call signs, we reduced the potential effects
of traffic demand and aircraft type while reducing the likelihood that the participants would
recognize that the basic airport traffic was identical across the experimental conditions. We
presented each version of the scenario in the same order for all participants; however, the
participants experienced each version of the base scenario in a different combination of
experimental conditions.
The scenario began with aircraft already on the airport surface; eight aircraft were on the local
controller’s frequency, either on approach or preparing to enter the BOS airspace, and three
aircraft were taxiing to their assigned departure runways on the ground controller’s frequency.
The TGF simulator generated departure aircraft on one of three ramp spots, as determined by the
airport traffic scenario. Only one aircraft could occupy a ramp spot at any given time. When the
ground controller moved an aircraft from a ramp spot, the TGF simulator generated the next
departure aircraft for that ramp spot at the appropriate time, as determined by the airport traffic
scenario. The ground controller had to taxi arrival aircraft to one of two ramp spots and switch
the aircraft to the ramp frequency before the simulator removed the aircraft from the scenario.
We did not simulate aircraft in the non-movement area of the ramp (gate arrival and push back),
so ramp control was not a factor. Five simulation pilots occupied the pilot workstations and
entered commands, as directed by the participants, to guide all aircraft and to simulate pilot
communications. Three simulation pilots communicated with the ground controller position,
and two simulation pilots communicated with the local controller position.
We collected both objective and subjective dependent measures using a completely within-
subjects, repeated measures design. The DESIREE simulator collected objective usability
measures for the TODDS interfaces by automatically recording the participants’ interaction with
the TODDS, including the number and duration of all actions. Video cameras mounted in the
ceiling recorded the video data of each participant’s workstation. The TGF simulator recorded
objective airport system data. SMEs observed each run and recorded any operational errors that
occurred. Digital audio recorders captured all voice transmissions, and DESIREE collected
Push-To-Talk (PTT) data, including the number and duration of all radio communications. The
participants provided subjective data at the end of each scenario and at the end of the experiment.
3. RESULTS
We analyzed each dataset using the appropriate repeated measures Analysis of Variance
(ANOVA) procedure (see Appendix G for information on repeated measure designs and our
overall approach to the data analyses). Of greatest interest were comparisons of the TODDS
prototypes to their respective FPS conditions (i.e., I-TODDS vs. FPS + ASDE-X, and PS-
TODDS vs. FPS, as shown in Table 3). We also compared the two FPS conditions to each other
to determine what contribution, if any, surface surveillance provided. We analyzed the data
collected from the ground and local control positions separately. If the omnibus ANOVA found
a significant interaction or main effect, then we computed the Tukey Honestly Significant
Difference (HSD) post hoc test to identify the differences. We conducted planned comparisons
to examine the research questions more closely. We only reported statistically significant effects
when they were relevant to the question at hand. All statistically significant results reported in
this document were significant using an alpha level of 0.05. All error bars in the subsequent
graphs indicate the range for ±1 standard deviation (SD).
15
3.1 Airport System Metrics
The TGF simulator recorded numerous airport system metrics including the number of arrivals
and departures; duration of ramp delays; duration of taxi operations; number and duration of
departure delays; and number of surface movement clearances including taxi, Hold Short, cross
runway, and Taxi-Into-Position-and-Hold (TIPH).
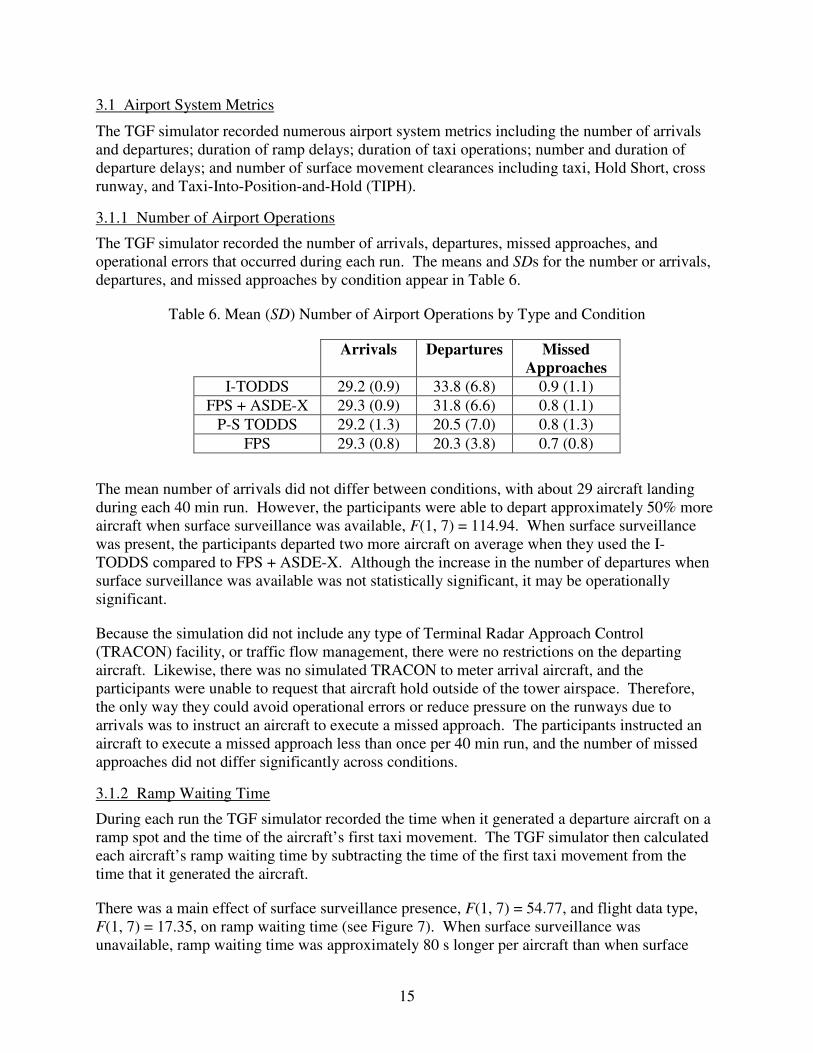
3.1.1 Number of Airport Operations
The TGF simulator recorded the number of arrivals, departures, missed approaches, and
operational errors that occurred during each run. The means and SDs for the number or arrivals,
departures, and missed approaches by condition appear in Table 6.
Table 6. Mean (SD) Number of Airport Operations by Type and Condition
Arrivals Departures Missed
Approaches
I-TODDS 29.2 (0.9) 33.8 (6.8) 0.9 (1.1)
FPS + ASDE-X 29.3 (0.9) 31.8 (6.6) 0.8 (1.1)
P-S TODDS 29.2 (1.3) 20.5 (7.0) 0.8 (1.3)
FPS 29.3 (0.8) 20.3 (3.8) 0.7 (0.8)
The mean number of arrivals did not differ between conditions, with about 29 aircraft landing
during each 40 min run. However, the participants were able to depart approximately 50% more
aircraft when surface surveillance was available, F(1, 7) = 114.94. When surface surveillance
was present, the participants departed two more aircraft on average when they used the I-
TODDS compared to FPS + ASDE-X. Although the increase in the number of departures when
surface surveillance was available was not statistically significant, it may be operationally
significant.
Because the simulation did not include any type of Terminal Radar Approach Control
(TRACON) facility, or traffic flow management, there were no restrictions on the departing
aircraft. Likewise, there was no simulated TRACON to meter arrival aircraft, and the
participants were unable to request that aircraft hold outside of the tower airspace. Therefore,
the only way they could avoid operational errors or reduce pressure on the runways due to
arrivals was to instruct an aircraft to execute a missed approach. The participants instructed an
aircraft to execute a missed approach less than once per 40 min run, and the number of missed
approaches did not differ significantly across conditions.
3.1.2 Ramp Waiting Time
During each run the TGF simulator recorded the time when it generated a departure aircraft on a
ramp spot and the time of the aircraft’s first taxi movement. The TGF simulator then calculated
each aircraft’s ramp waiting time by subtracting the time of the first taxi movement from the
time that it generated the aircraft.
There was a main effect of surface surveillance presence, F(1, 7) = 54.77, and flight data type,
F(1, 7) = 17.35, on ramp waiting time (see Figure 7). When surface surveillance was
unavailable, ramp waiting time was approximately 80 s longer per aircraft than when surface

16
surveillance was available. The ramp waiting time was about 37 s longer per aircraft when the
participants used the TODDS instead of FPSs. The fact that the participants working at the
ground controller position were able to move departure aircraft off of the ramp spots quicker
when surface surveillance was available suggests that the surface surveillance improved airport
efficiency. Aircraft may have waited longer on the ramp when the participants were using the
TODDS compared to when the participants were using FPSs because of the inherent delay that is
associated with transmitting, receiving, and acknowledging digital communications. When the
TGF simulator generated an aircraft on a ramp spot in the TODDS conditions, the pilot
automatically sent a request for taxi clearance to the ground controller. The ground controller
then issued a taxi clearance via data communications by selecting the aircraft’s data block, or
FDE, and then selecting the D-Taxi button. It took up to 30 s for a D-Taxi clearance to reach an
aircraft and for the pilot to accept the clearance and respond via data communications. When the
ground controller received an indicator that the pilot had accepted the D-Taxi clearance, the
ground controller instructed the pilot by voice to execute the taxi instructions.
93 18568 1360
50
100
150
200
250
300
Yes No
Surface Surveillance
Me
an
Du
rati
on
(s)
of
Ra
mp
Wa
itin
g
Tim
e TODDS
FPS
Figure 7. Mean duration of ramp waiting time per aircraft for departure aircraft by surface
surveillance presence and flight data type.
3.1.3 Taxi Operations
The TGF simulator also measured the duration of taxi operations including total taxi-out and
taxi-in time. For taxi-out operations, the TGF simulator recorded the duration from when an
aircraft made its first taxi movement from the ramp spot until departure (i.e., wheels up). For
taxi-in operations, the TGF simulator recorded the duration from when an aircraft landed (i.e.,
touch down) until it reached an arrival ramp spot.
For taxi-out operations, there was a significant interaction of surface surveillance presence and
flight data type, F(1, 7) = 6.68. Planned comparisons revealed that aircraft took significantly less
time to taxi out (106 s per aircraft) when the participants used the I-TODDS compared to FPS +
ASDE-X, F(1, 7) = 6.35, but there was no significant difference between flight data types when
surface surveillance was unavailable (see Figure 8).

17
778 1068872 10270
200
400
600
800
1000
1200
1400
Yes No
Surface Surveillance
Mea
n D
ura
tio
n (
s)
of
Tax
i O
ut
TODDS
FPS
Figure 8. Mean duration of taxi-out operations per aircraft by surface surveillance presence and
flight data type.
For taxi-in operations, the TGF simulator recorded the duration from when an aircraft landed
until it reached an arrival ramp spot. There was a significant main effect of surface surveillance
presence, F(1, 7) = 44.52, specifically, taxi-in operations were over 1 min shorter when the
participants had surface surveillance. A planned comparison showed that taxi-in operations were
significantly shorter (35 s per aircraft) in the I-TODDS condition than in the FPS + ASDE-X
condition, F(1, 7) = 10.79 (see Figure 9). Fight data type did not significantly affect taxi-in
durations when surface surveillance was unavailable.
202 282237 2840
50
100
150
200
250
300
350
Yes No
Surface Surveillance
Mea
n D
ura
tio
n (
s)
of
Tax
i In
TODDS
FPS
Figure 9. Mean duration of taxi-in operations per aircraft by surface surveillance presence and
flight data type.
18
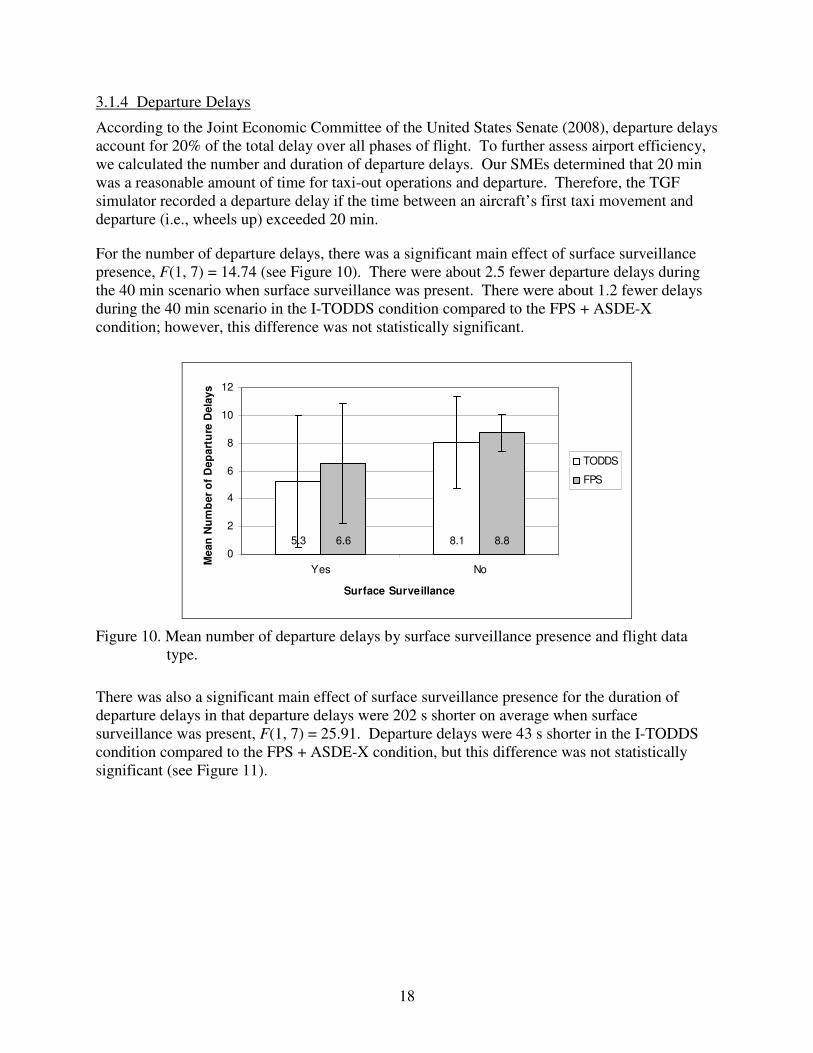
3.1.4 Departure Delays
According to the Joint Economic Committee of the United States Senate (2008), departure delays
account for 20% of the total delay over all phases of flight. To further assess airport efficiency,
we calculated the number and duration of departure delays. Our SMEs determined that 20 min
was a reasonable amount of time for taxi-out operations and departure. Therefore, the TGF
simulator recorded a departure delay if the time between an aircraft’s first taxi movement and
departure (i.e., wheels up) exceeded 20 min.
For the number of departure delays, there was a significant main effect of surface surveillance
presence, F(1, 7) = 14.74 (see Figure 10). There were about 2.5 fewer departure delays during
the 40 min scenario when surface surveillance was present. There were about 1.2 fewer delays
during the 40 min scenario in the I-TODDS condition compared to the FPS + ASDE-X
condition; however, this difference was not statistically significant.
5.3 8.16.6 8.80
2
4
6
8
10
12
Yes No
Surface Surveillance
Me
an
Nu
mb
er
of
De
pa
rtu
re D
ela
ys
TODDS
FPS
Figure 10. Mean number of departure delays by surface surveillance presence and flight data
type.
There was also a significant main effect of surface surveillance presence for the duration of
departure delays in that departure delays were 202 s shorter on average when surface
surveillance was present, F(1, 7) = 25.91. Departure delays were 43 s shorter in the I-TODDS
condition compared to the FPS + ASDE-X condition, but this difference was not statistically
significant (see Figure 11).

19
132 363175 348-100
0
100
200
300
400
500
600
700
Yes No
Surface Surveillance
Me
an
Du
rati
on
(s)
of
Dep
art
ure
Dela
ys TODDS
FPS
Figure 11. Mean duration of departure delays by surface surveillance presence and flight data
type.
In summary, both surface surveillance and use of the TODDS affected airport system metrics.
Surface surveillance had the largest effect on increasing the number of departures. I-TODDS
provided a small increase in departures in addition to that provided solely by surface
surveillance. Neither surface surveillance nor flight data type affected the number of arrivals or
missed approaches. Surface surveillance reduced the time that departure aircraft spent waiting
on the ramp, whereas the TODDS increased ramp waiting time, primarily due to the
communication delays inherent in data communications. The I-TODDS provided a significant
reduction in the duration of taxi-out operations compared to the other three experimental
conditions. Surface surveillance reduced the duration of taxi-in operations, but the I-TODDS
reduced the duration of taxi-in operations even further. Surface surveillance also decreased the
number and duration of departure delays. Although the I-TODDS provided an additional
reduction in departure delays compared to FPS + ASDE-X, this difference was not statistically
significant.
3.1.5 Operational Errors
An SME observed the simulated airport traffic during each run and recorded any operational
errors that occurred. The SME recorded five different types of operational errors, including
losses of separation between an arrival and a departure aircraft, two arrival aircraft, or two
departure aircraft, land overs (which occur when an arrival aircraft lands over a departure aircraft
that is holding-in-position on the runway), and runway incursions.
Table 7 shows the mean number of operational errors observed by type and condition. We
conducted a 2 (surface surveillance present – yes vs. no) x 2 (flight data type – TODDS vs. FPS)
repeated measures ANOVA for each type of operational error to determine whether operational
errors were more prevalent in any particular experimental condition.
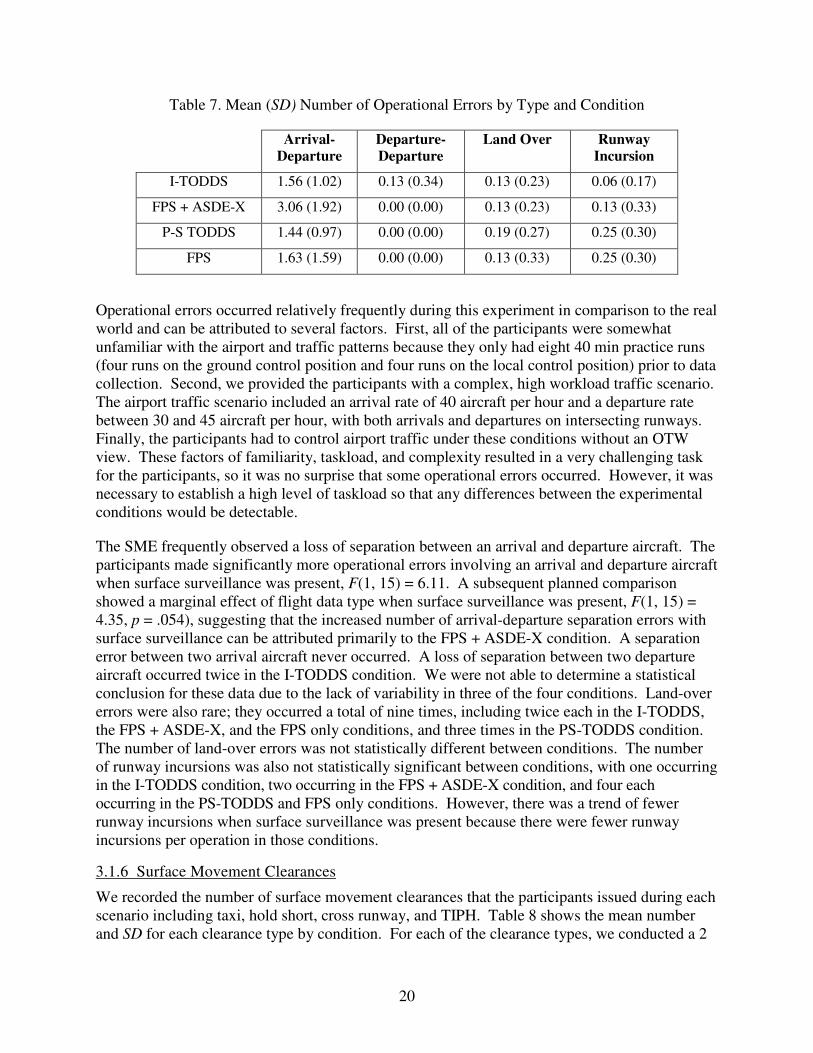
20
Table 7. Mean (SD) Number of Operational Errors by Type and Condition
Arrival-
Departure
Departure-
Departure
Land Over Runway
Incursion
I-TODDS 1.56 (1.02) 0.13 (0.34) 0.13 (0.23) 0.06 (0.17)
FPS + ASDE-X 3.06 (1.92) 0.00 (0.00) 0.13 (0.23) 0.13 (0.33)
P-S TODDS 1.44 (0.97) 0.00 (0.00) 0.19 (0.27) 0.25 (0.30)
FPS 1.63 (1.59) 0.00 (0.00) 0.13 (0.33) 0.25 (0.30)
Operational errors occurred relatively frequently during this experiment in comparison to the real
world and can be attributed to several factors. First, all of the participants were somewhat
unfamiliar with the airport and traffic patterns because they only had eight 40 min practice runs
(four runs on the ground control position and four runs on the local control position) prior to data
collection. Second, we provided the participants with a complex, high workload traffic scenario.
The airport traffic scenario included an arrival rate of 40 aircraft per hour and a departure rate
between 30 and 45 aircraft per hour, with both arrivals and departures on intersecting runways.
Finally, the participants had to control airport traffic under these conditions without an OTW
view. These factors of familiarity, taskload, and complexity resulted in a very challenging task
for the participants, so it was no surprise that some operational errors occurred. However, it was
necessary to establish a high level of taskload so that any differences between the experimental
conditions would be detectable.
The SME frequently observed a loss of separation between an arrival and departure aircraft. The
participants made significantly more operational errors involving an arrival and departure aircraft
when surface surveillance was present, F(1, 15) = 6.11. A subsequent planned comparison
showed a marginal effect of flight data type when surface surveillance was present, F(1, 15) =
4.35, p = .054), suggesting that the increased number of arrival-departure separation errors with
surface surveillance can be attributed primarily to the FPS + ASDE-X condition. A separation
error between two arrival aircraft never occurred. A loss of separation between two departure
aircraft occurred twice in the I-TODDS condition. We were not able to determine a statistical
conclusion for these data due to the lack of variability in three of the four conditions. Land-over
errors were also rare; they occurred a total of nine times, including twice each in the I-TODDS,
the FPS + ASDE-X, and the FPS only conditions, and three times in the PS-TODDS condition.
The number of land-over errors was not statistically different between conditions. The number
of runway incursions was also not statistically significant between conditions, with one occurring
in the I-TODDS condition, two occurring in the FPS + ASDE-X condition, and four each
occurring in the PS-TODDS and FPS only conditions. However, there was a trend of fewer
runway incursions when surface surveillance was present because there were fewer runway
incursions per operation in those conditions.
3.1.6 Surface Movement Clearances
We recorded the number of surface movement clearances that the participants issued during each
scenario including taxi, hold short, cross runway, and TIPH. Table 8 shows the mean number
and SD for each clearance type by condition. For each of the clearance types, we conducted a 2

21
(run number) x 2 (flight data type - TODDS vs. FPS) x 2 (surface surveillance presence - yes vs.
no) repeated measures ANOVA to determine whether the participants gave certain clearances
more or less often in the various conditions.
Table 8. Mean (SD) Number of Clearances by Type and Condition
Taxi
Voice
Taxi
Data Comm
Hold Short
Voice
Hold Short
Data Comm
Cross
Runway
TIPH
I-TODDS 29.8 (2.5) 40.4 (3.7) 3.8 (1.2) 37.3 (1.7) 36.4 (5.5) 31.1 (7.0)
FPS + ASDE-X 66.9 (2.0) NA 41.4 (2.4) NA 33.9 (5.7) 30.7 (6.2)
PS-TODDS 29.5 (1.6) 29.9 (5.7) 4.9 (2.5) 27.5 (5.9) 19.1 (7.2) 18.4 (6.9)
FPS 58.7 (4.6) NA 34.0 (6.7) NA 19.9 (5.3) 18.9 (4.0)
Note. NA = Not Applicable.
The participants issued taxi clearances via voice in the FPS conditions and via either voice or
data communications in the TODDS conditions. We only analyzed the total number of taxi
clearances issued because the number of taxi clearances were affected primarily by the number
of operations (i.e., number of departures and arrivals), and D-Taxi was only available in the
TODDS conditions. For the total number of taxi clearances, we found a significant main effect
of surface surveillance presence, indicating that the controllers issued more taxi clearances when
surface surveillance was available, F(1, 7) = 48.08.
The participants issued “hold short” instructions either via voice in the FPS conditions or via a
combination of voice and data communications in the TODDS conditions. As with the number
of taxi clearances, we only analyzed the total number of hold short clearances to avoid any
spurious interactions. We found a significant main effect of surface surveillance presence,
indicating that the controllers issued more hold short clearances when surface surveillance was
available, F(1, 7) = 47.73.
The participants issued all clearances to cross a runway by voice. The participants issued
significantly more clearances to cross a runway when surface surveillance was present, F(1, 7) =
169.31. Fight data type did not affect the number of clearances to cross a runway. Likewise, the
participants could only issue TIPH clearances by voice, and they issued significantly more TIPH
clearances when surface surveillance was present, F(1, 7) = 103.11.
The overall pattern of results for the number of commands supports the finding that it was easier
for the participants to move aircraft on the airport surface when surface surveillance was
available. Although the participants issued fewer voice clearances when a digital alternative was
available, the type of flight data they were using did not affect the overall number of clearances
they issued. The number of clearances issued was only affected by the presence of surface
surveillance. To provide a complete picture of controller communications, we also examined to
the PTT data to further understand how the experimental conditions affected voice
communications.

22
3.1.7 Push-To-Talk
The DESIREE simulator recorded PTT data for both controller positions and all of the simulation
pilots. The PTT data included information regarding who initiated each radio or landline
transmission, who received the transmission, and the duration of each transmission. No landline
transmissions took place during the experiment so the data reported here only concerns radio
transmissions between the participants at the local and ground controller positions and the
simulation pilots.
Due to a hardware problem, the DESIREE simulator failed to record PTT data for one group of
participants during five of the eight experimental runs. The missing data were from two runs of
the FPS + ASDE-X condition, two runs of the PS-TODDS condition, and one run of the FPS-
only condition. We replaced the missing data with the corresponding run number (first or
second) and condition means to facilitate data analysis. We conducted a 2 (run number – first vs.
second) x 2 (surface surveillance presence – yes vs. no) x 2 (flight data type – TODDS vs. FPS)
repeated measures ANOVA for each of the four controller-pilot combinations (ground
controller-to-pilot, pilot-to-ground controller, local controller-to-pilot, and pilot-to-local
controller), and considered both the number and duration of transmissions in each analysis to
determine whether or not voice communications were affected by the experimental conditions.
3.1.7.1 PTT – Ground Controller to Pilot
For the number of transmissions from the ground control position to a simulation pilot, there was
a significant main effect of surface surveillance presence, F(1, 7) = 38.96, and flight data type,
F(1, 7) = 17.93 (see Figure 12). The participants made two fewer transmissions per minute when
surface surveillance was present. The participants had to make more transmissions without
surface surveillance because they had to request numerous position reports from the pilots. The
participants also made two fewer transmissions per minute when using the TODDS compared to
FPSs. The TODDS provided D-Taxi clearance capability which reduced the need for radio
transmissions. Planned comparisons showed that the participants made fewer ground controller-
to-pilot transmissions in the I-TODDS condition than in the FPS + ASDE-X condition, F(1, 7) =
9.33. Planned comparisons also showed that the participants made fewer ground controller-to-
pilot transmissions in the PS-TODDS condition than in the FPS condition, F(1, 7) = 6.16.

23
135 180157 1980
50
100
150
200
250
Yes No
Surface Surveillance
Me
an
Nu
mb
er
of
Gro
un
d-P
ilo
t
Tra
nsm
issio
ns
TODDS
FPS
Figure 12. Mean number of ground controller-to-pilot transmissions by surface surveillance
presence and flight data type.
There was a significant main effect of flight data type for the duration of transmissions from the
ground controller position to a simulation pilot, F(1, 7) = 79.02 (see Figure 13). When using the
TODDS either with or without surface surveillance, the participants’ transmissions from the
ground control position were almost 1 s shorter on average. Planned comparisons showed that
the participants made shorter transmissions when they used the I-TODDS compared to when
they used FPS +ASDE-X, F(1, 7) = 41.7, and when they used the PS-TODDS compared to when
they used FPS, F(1, 7) = 35.04. Shorter transmissions from the ground controller were primarily
due to the D-Taxi clearance capability that was part of the TODDS. When using FPSs, the
participants had to give a full taxi clearance for departures (e.g., “United 1234, taxi to runway
two seven via Alpha and Echo; hold short, runway three-three-left”). In contrast, when the pilot
used the TODDS to acknowledge a D-Taxi clearance, the participants only had to tell the pilot
(via a radio transmission) to “resume taxi” to start an aircraft’s ground movement.
3.5 3.74.5 4.40.0
1.0
2.0
3.0
4.0
5.0
6.0
Yes No
Surface Surveillance
Mea
n D
ura
tio
n (
s)
of
Gro
un
d-P
ilo
t
Tra
nsm
iss
ion
s
TODDS
FPS
Figure 13. Mean duration of ground controller-to-pilot transmissions by surface surveillance
presence and flight data type.
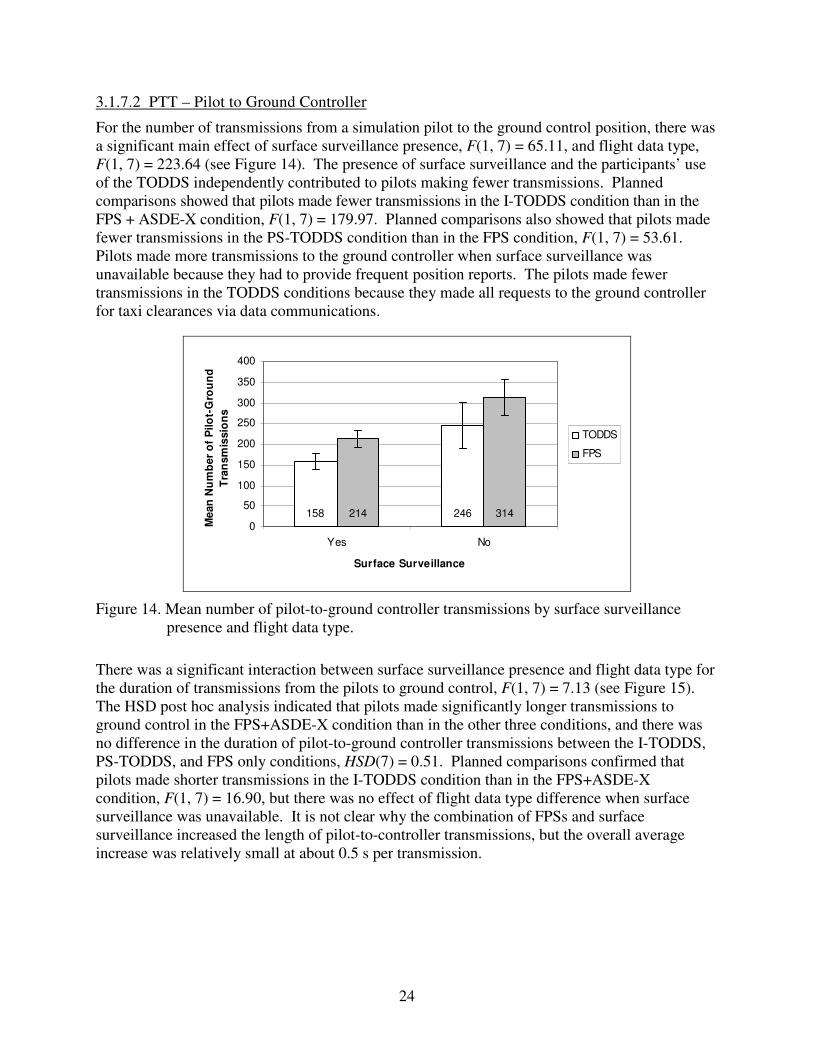
24
3.1.7.2 PTT – Pilot to Ground Controller
For the number of transmissions from a simulation pilot to the ground control position, there was
a significant main effect of surface surveillance presence, F(1, 7) = 65.11, and flight data type,
F(1, 7) = 223.64 (see Figure 14). The presence of surface surveillance and the participants’ use
of the TODDS independently contributed to pilots making fewer transmissions. Planned
comparisons showed that pilots made fewer transmissions in the I-TODDS condition than in the
FPS + ASDE-X condition, F(1, 7) = 179.97. Planned comparisons also showed that pilots made
fewer transmissions in the PS-TODDS condition than in the FPS condition, F(1, 7) = 53.61.
Pilots made more transmissions to the ground controller when surface surveillance was
unavailable because they had to provide frequent position reports. The pilots made fewer
transmissions in the TODDS conditions because they made all requests to the ground controller
for taxi clearances via data communications.
158 246214 3140
50
100
150
200
250
300
350
400
Yes No
Surface Surveillance
Me
an
Nu
mb
er
of
Pilo
t-G
rou
nd
Tra
nsm
issio
ns
TODDS
FPS
Figure 14. Mean number of pilot-to-ground controller transmissions by surface surveillance
presence and flight data type.
There was a significant interaction between surface surveillance presence and flight data type for
the duration of transmissions from the pilots to ground control, F(1, 7) = 7.13 (see Figure 15).
The HSD post hoc analysis indicated that pilots made significantly longer transmissions to
ground control in the FPS+ASDE-X condition than in the other three conditions, and there was
no difference in the duration of pilot-to-ground controller transmissions between the I-TODDS,
PS-TODDS, and FPS only conditions, HSD(7) = 0.51. Planned comparisons confirmed that
pilots made shorter transmissions in the I-TODDS condition than in the FPS+ASDE-X
condition, F(1, 7) = 16.90, but there was no effect of flight data type difference when surface
surveillance was unavailable. It is not clear why the combination of FPSs and surface
surveillance increased the length of pilot-to-controller transmissions, but the overall average
increase was relatively small at about 0.5 s per transmission.
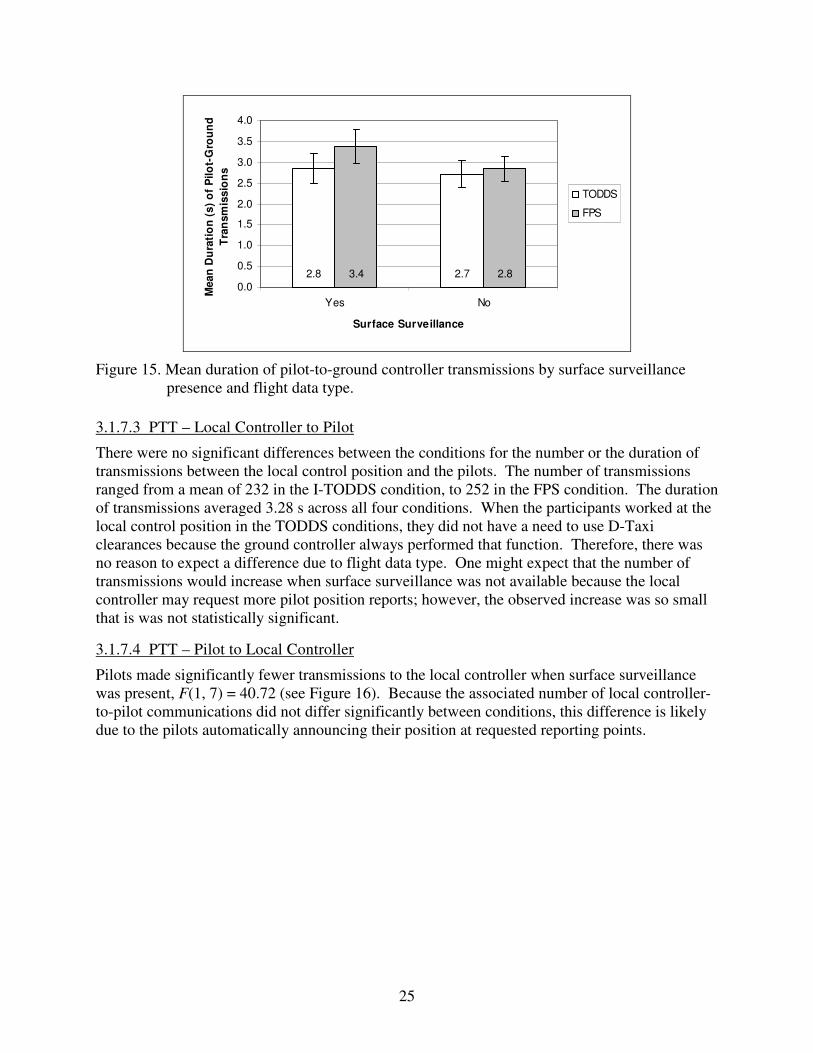
25
2.8 2.73.4 2.80.0
0.5
1.0
1.5
2.0
2.5
3.0
3.5
4.0
Yes No
Surface Surveillance
Mea
n D
ura
tio
n (
s)
of
Pilo
t-G
rou
nd
Tra
nsm
iss
ion
s
TODDS
FPS
Figure 15. Mean duration of pilot-to-ground controller transmissions by surface surveillance
presence and flight data type.
3.1.7.3 PTT – Local Controller to Pilot
There were no significant differences between the conditions for the number or the duration of
transmissions between the local control position and the pilots. The number of transmissions
ranged from a mean of 232 in the I-TODDS condition, to 252 in the FPS condition. The duration
of transmissions averaged 3.28 s across all four conditions. When the participants worked at the
local control position in the TODDS conditions, they did not have a need to use D-Taxi
clearances because the ground controller always performed that function. Therefore, there was
no reason to expect a difference due to flight data type. One might expect that the number of
transmissions would increase when surface surveillance was not available because the local
controller may request more pilot position reports; however, the observed increase was so small
that is was not statistically significant.
3.1.7.4 PTT – Pilot to Local Controller
Pilots made significantly fewer transmissions to the local controller when surface surveillance
was present, F(1, 7) = 40.72 (see Figure 16). Because the associated number of local controller-
to-pilot communications did not differ significantly between conditions, this difference is likely
due to the pilots automatically announcing their position at requested reporting points.

26
265 310268 3190
50
100
150
200
250
300
350
400
Yes No
Surface Surveillance
Mea
n N
um
ber
of
Pil
ot-
Lo
ca
l
Tra
nsm
issio
ns
TODDS
FPS
Figure 16. Mean number of pilot-to-local controller transmissions by surface surveillance
presence and flight data type.
For the duration of transmissions from the pilots to the local controller, there was a significant
interaction of surface surveillance presence and flight data type, F(1, 7) = 5.81 (see Figure 17).
The HSD post hoc analysis indicated that the pilot transmissions did not differ when surface
surveillance was available, but were longer in the I-TODDS condition than when surface
surveillance was unavailable in the PS-TODDS and FPS conditions, HSD(7) = 0.09. Although
statistically significant, the overall differences were small.
2.1 2.02.0 2.00.0
0.5
1.0
1.5
2.0
2.5
Yes No
Surface Surveillance
Me
an
Du
rati
on
(s)
of
Pilo
t-L
oca
l
Tra
nsm
iss
ion
s
TODDS
FPS
Figure 17. Mean duration of pilot-to-local controller transmissions by surface surveillance
presence and flight data type.
3.2 TODDS Usability
We collected objective and subjective usability measures for the TODDS interfaces. The
DESIREE simulation capability automatically recorded the participant’s interaction with the

27
TODDS. We analyzed the digital audio-video recordings to identify and count interface errors,
and then calculated an error rate (ER) percentage for each action type − by dividing the number
of successful actions (S) by the sum of successful actions (S) and failed actions (F), and then
multiplying the result by 100, so that ER% = S/(S+F) X 100.
3.2.1 Integrated TODDS
There were 29 distinct actions that the participants could perform with the I-TODDS. Of these
actions, they performed 18 of them at least once over the course of the experiment. Table 9
shows the mean number of times the participants performed each action at the ground and local
control positions and the error rate for each action. We do not report data for actions that the
participants completed less than once (on average) per scenario.
Table 9. Mean Number of Touchscreen Actions, Error Rates, and Percentage Change in Error
Rates for the Ground and Local Control Positions with the Integrated TODDS
Ground Local
Touchscreen
Action
Mean (SD)
Number of
Actions
Mean
Error
Rate
(%)
%
Change
Mean (SD)
Number of
Actions
Mean
Error
Rate
(%)
%
Change
Data Block Select
158.81 (73.19) 1 - 3 108.31 (63.29) 3 - 4
FDE Select
35.13 (45.35) 5 - 8 18.44 (21.61) 10 + 4
Data Block
Reposition
45.19 (3.31) 4 - 4 62.31 (49.96) 5 - 9
List Transfer
36.38 (2.19) 4 - 2 NA NA NA
Position Transfer
39.13 (4.11) 2 - 4 29.44 (2.28) 4 - 10
External Transfer
28.56 (1.93) 4 - 2 31.88 (6.23) 3 - 11
EDCT Blink
Acknowledgment
0.13 (0.34) 0 NA 0.00 (0.00) 0 NA
FDE ATIS Update
Acknowledgment
2.44 (5.27) 25 - 28 1.56 (5.21) 0 - 35
D-Taxi Clearance
40.44 (3.67) 6 NA NA NA NA
Total Actions
389.19 (99.44) 4 - 7 253.19 (101.64) 4 - 9
Deselect Error
1.88 (1.75) - - 1.19 (1.52) - -
Task Error
0.94 (1.18) - - 0.81 (0.66) - -
Task Failure
0.19 (0.40) - - 0.06 (0.25) - -
Note. NA = Not Applicable.

28
We recorded a task error whenever a participant took an action successfully, but that action was
inappropriate for the situation. For example, we would consider it a task error if the participant
at the ground control position instructed a pilot to contact the tower and then intended to transfer
the aircraft’s FDE to the local control position, but selected the Inbound button instead of the
Local button. This action successfully transferred the FDE from the ground control position’s
outbound list to the ground control position’s inbound list, but did not accomplish the desired
goal of transferring the FDE to the local control position. In other words, the I-TODDS
responded correctly to the participant’s actions, but those actions were incorrect. Task errors
occurred for a number of reasons, including the participant’s lack of familiarity with the interface
combined with a high taskload, and inadequate interface design. We recorded a task failure
whenever the participant tried to take an action that the I-TODDS could not accomplish. For
example, if the participant tried to drag an FDE from one list to another, we recorded this action
as a task failure. Table 10 summarizes the types and frequencies of task errors and task failures
that occurred at the ground and local control positions when the participants used the I-TODDS.
Task errors resulted mostly from the participants inadvertently transferring flight data to the
wrong list or control position. Task errors involving flight data transfer were possible due to the
flexibility of the I-TODDS regarding the movement of flight data, and this type of error should
become less frequent as controllers become more familiar with the I-TODDS. However, two of
the task error types involving flight data transfer (the ground controller transferring departure
flight data to the inbound list instead of the local control position, and the local controller
transferring departure flight data to the arrival list instead of the departure TRACON position)
were due to poor interface design. In these two task errors, the list/position transfer buttons are
in close proximity to each other, and it is possible to inadvertently select the wrong button. We
intend to redesign the shape of buttons that are closely spaced to reduce the probability of
selecting the wrong button. The participants could easily recover from task errors involving data
transfer by performing an aircraft data recall procedure as detailed in Truitt, 2008, but it would
be preferable if such task errors did not occur at all.
Task failures were extremely rare and occurred only four times, or an average of only 0.13 times
per run. The most common task failure with the I-TODDS occurred when the participants tried
to drag an FDE from one list to another. Although the participants could drag FDEs within a list
to resequence them, we prevented the dragging of FDEs between lists to improve efficiency and
to prevent other types of errors. One participant also tried to drag the system information area, to
no avail, as it can only be moved via the ASDE-X toolbar.

29
Table 10. Number of Task Errors and Task Failures by Type for I-TODDS
Error Description
Number of
Occurrences
Task Errors Ground Local
Transferred pending flight data to local control position instead of outbound list 5 NA
Transferred departure flight data to inbound list instead of local control positiona 3 NA
Transferred outbound flight data to outbound list instead of local control position 1 NA
Transferred arrival flight data to inbound list instead of ramp control position 2 NA
Transferred arrival flight data to outbound list instead of ramp control 1 NA
Transferred arrival flight data to local control position instead of ramp control
position
1 NA
Transferred arrival flight data to inbound list instead of ramp control position 1 NA
Selected arrival flight data and issued D-Taxi clearance 1 1
Transferred arrival flight data to departure (TRACON) position instead of ground
control position
NA 2
Transferred arrival flight data to departure list instead of ground control position NA 1
Transferred departure flight data to ground control position instead of departure
(TRACON) position
NA 6
Transferred departure flight data to arrival list instead of departure (TRACON)
positiona
NA 2
Transferred departure flight data to departure list instead of departure (TRACON)
position
NA 1
Task Failures Ground Local
Participant gives verbal “Resume Taxi” command and attempts to drag FDE from
Pending to Outbound List
3 NA
Participant attempts to drag the system information area
0 1
Note. NA = Not Applicable. aError was due to inadvertent selection of a nearby button.
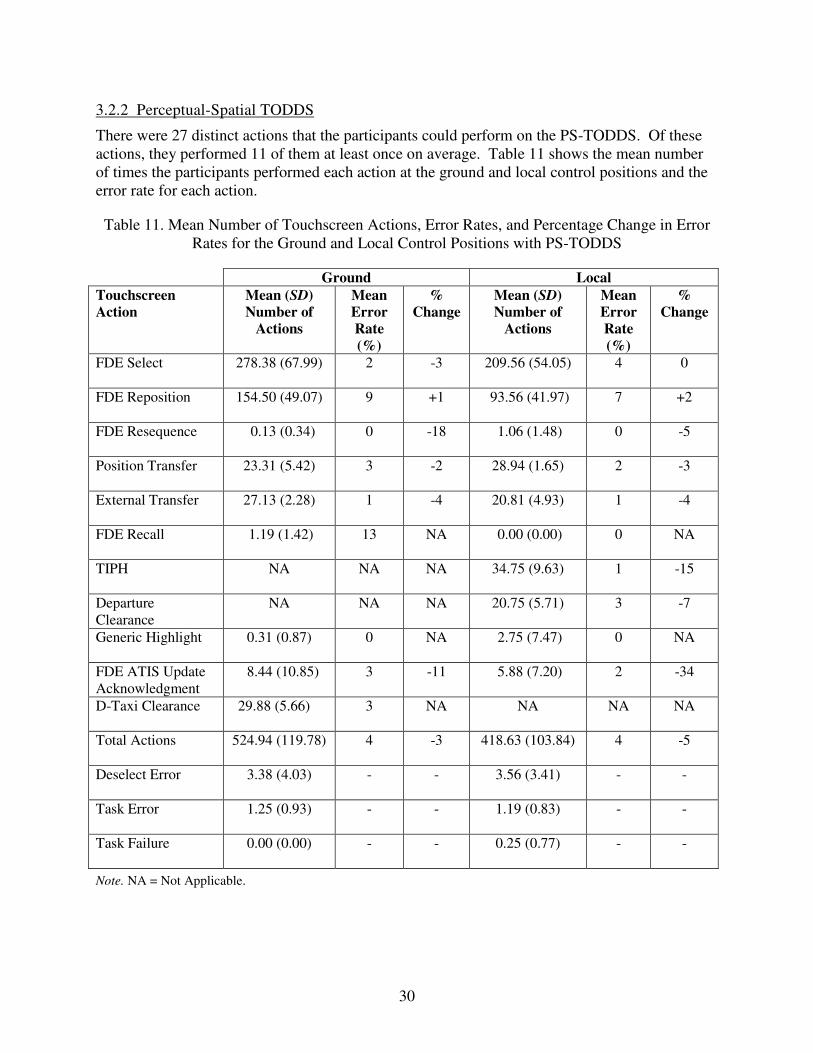
30
3.2.2 Perceptual-Spatial TODDS
There were 27 distinct actions that the participants could perform on the PS-TODDS. Of these
actions, they performed 11 of them at least once on average. Table 11 shows the mean number
of times the participants performed each action at the ground and local control positions and the
error rate for each action.
Table 11. Mean Number of Touchscreen Actions, Error Rates, and Percentage Change in Error
Rates for the Ground and Local Control Positions with PS-TODDS
Ground Local
Touchscreen
Action
Mean (SD)
Number of
Actions
Mean
Error
Rate
(%)
%
Change
Mean (SD)
Number of
Actions
Mean
Error
Rate
(%)
%
Change
FDE Select
278.38 (67.99) 2 -3 209.56 (54.05) 4 0
FDE Reposition
154.50 (49.07) 9 +1 93.56 (41.97) 7 +2
FDE Resequence
0.13 (0.34) 0 -18 1.06 (1.48) 0 -5
Position Transfer
23.31 (5.42) 3 -2 28.94 (1.65) 2 -3
External Transfer
27.13 (2.28) 1 -4 20.81 (4.93) 1 -4
FDE Recall
1.19 (1.42) 13 NA 0.00 (0.00) 0 NA
TIPH
NA NA NA 34.75 (9.63) 1 -15
Departure
Clearance
NA NA NA 20.75 (5.71) 3 -7
Generic Highlight
0.31 (0.87) 0 NA 2.75 (7.47) 0 NA
FDE ATIS Update
Acknowledgment
8.44 (10.85) 3 -11 5.88 (7.20) 2 -34
D-Taxi Clearance
29.88 (5.66) 3 NA NA NA NA
Total Actions
524.94 (119.78) 4 -3 418.63 (103.84) 4 -5
Deselect Error
3.38 (4.03) - - 3.56 (3.41) - -
Task Error
1.25 (0.93) - - 1.19 (0.83) - -
Task Failure
0.00 (0.00) - - 0.25 (0.77) - -
Note. NA = Not Applicable.

31
We do not report data for actions that the participants completed less than once on average per
scenario. The participants took 5 actions less than once (on average): reversing an FDE ATIS
acknowledgment, acknowledging a general ATIS update, closing a taxiway segment, placing a
Hold Short indicator, and removing a Hold Short indicator. The participants did not perform 11
of the possible actions: Amending an altitude assignment, amending a heading assignment,
amending the altitude and heading assignment simultaneously, acknowledging an altitude or
heading assignment change, setting a generic timer, setting an aircraft specific timer,
acknowledging an Expected Departure Clearance Time (EDCT) blink, assigning a departure
runway, assigning an intersection departure, canceling a D-Taxi clearance, and closing a runway
or runway segment. The participants did not take these actions because the airport traffic
situation did not require it or because they did not have the time to do so. Of the 11 actions that
the participants performed, there was variability in how often they performed each action, and
they performed some actions much more frequently than others. The actions that the participants
performed most often were selecting an FDE, repositioning an FDE, and transferring flight data.
The participant at the ground control position also issued D-Taxi clearances relatively frequently.
With the exception of FDE repositions, the error rates for the most commonly performed actions
decreased compared to the initial usability study (Truitt & Muldoon, 2007). The overall error
rate, calculated over all actions regardless of frequency, decreased from 7% to 4% at the ground
control position and from 9% to 4% at the local control position. As with the I-TODDS, we
attribute the reduction in error rates primarily to the touchscreen training protocol and to a slight
increase in familiarity with the PS-TODDS interface prior to data collection. We attribute the
dramatic reduction in the error rate for FDE ATIS update acknowledgments to a redesign of the
size of the touch sensitive area for this particular element. The participants performed the TIPH
clearance at the local control position with a lower error rate because the TIPH buttons were
locked in place so that the participants could not move (i.e., drag) them when selected. The
participants made more touchscreen actions and performed those actions with fewer errors in the
current study compared to the participants in the initial usability study.
On average, the participants made about 3.5 deselect errors at the ground and local control
positions during each run. These deselect errors typically occurred after the participant
dragged an FDE. When the participant completed an FDE drag, the FDE automatically
deselected. If the participant then tried to take an action on the same FDE without selecting it
again, a deselect error occurred. We also observed some task errors during the experiment, but
these were infrequent and occurred on average less than twice at each control position during
any given run. Table 12 summarizes the types and frequencies of task errors and task failures
that occurred at the ground and local control positions for the PS-TODDS. The most common
type of task error that occurred when the participants used the PS-TODDS was when they
attempted to drag an unowned FDE. By design, we prevented controllers from being able to
drag or otherwise affect unowned FDEs because the PS-TODDS links the ground and local
control positions so that FDEs appear in the same relative location at both positions. If
controllers could move or modify any FDE at any time, this would create the potential for
controllers to “fight” for control of an FDE when both controllers tried to move or edit the
same FDE at the same time. Other types of task errors were due primarily to the participants’
lack of familiarity with the interface and should be reduced or eliminated with increased
training and use. Task failures were also uncommon, but did occur four times for an average of
0.13 times per run. We attribute the task failures to the interface design in that the PS-TODDS

32
did not provide a means with which to remove FDEs from the departure list. The participants
tried several ways of moving the FDE from the departure list, but none of them worked − which
highlighted a design flaw that we must correct.
Table 12. Number of Task Errors by Type for PS-TODDS
Error Description
Number of
Occurrences
Task Errors Ground Local
Attempted to drag unowned FDE 12 8
Attempted to acknowledge ATIS Update indicators on unowned FDE 2 0
Attempted to issue D-Taxi clearance for unowned FDE 1 NA
Issued D-Taxi clearance for arrival aircraft instead of transferring FDE
to ramp position
2 NA
Transferred departure FDE to ramp instead of issuing D-Taxi
clearance
2 NA
Transferred departure FDE to local control position instead of issuing
D-Taxi clearance
1 NA
Attempted to transfer departure FDE to departure (TRACON) position
before selecting departure clearance button
NA 5
Attempted to transfer departure FDE to departure (TRACON) position
without selecting an FDE
NA 3
Attempted to transfer arrival FDE for an aircraft executing a missed
approach to departure (TRACON) position by selecting departure
clearance button
NA 1
Attempted to transfer arrival FDE for an aircraft executing a missed
approach to departure (TRACON) position prior to selecting the
missed approach button
NA 1
Attempted to select buttons obscured by unowned FDEs 0 1
Task Failures
Attempted to drag departure FDE out of departure list NA 2
Attempted to move departure FDE out of departure list by selecting
the TIPH button
NA 1
Attempted to move departure FDE out of departure list by selecting
the departure clearance button
NA 1
Note. NA = Not Applicable.

33
3.3 Post-Scenario Questionnaire
The participants completed the PSQ (Appendix E) after each test run to provide their opinions
about each condition and to provide their suggestions for changes and new features or
capabilities. We analyzed the Likert scale ratings for the ground and local controller positions
separately. For each of the 13 items, we performed a 2 (surface surveillance presence – yes vs.
no) x 2 (flight data type – TODDS vs. FPS) repeated measures ANOVA and the appropriate post
hoc tests to determine whether the participants’ perceptions differed across the experimental
conditions. Table 13 shows the mean PSQ ratings for the ground controller position by
condition. Table 14 shows the mean PSQ ratings for the local controller position by condition.
The participants’ comments on the PSQ appear in Appendix H.
Table 13. Mean (SD) Post-Scenario Questionnaire Ratings for the Ground Control Positions
by Experimental Condition
Ground Control
Surface Surveillance Presence Surface Surveillance
Yes
Surface Surveillance
No
Flight Data Type TODDS FPS TODDS FPS
Experimental Condition I-TODDS FPS+ ASDE-X PS-TODDS FPS Only
1. Effort needed to maintain flight
datass
2.9 (2.2) 3.6 (2.1) 5.3 (2.5) 5.9 (3.1)
2. Ability to find flight
informationss
9.2 (0.9) 8.3 (2.0) 6.9 (2.7) 7.1 (2.2)
3. Ability to find weather
information
6.9 (2.1) 7.4 (3.0) 6.6 (3.0) 8.9 (1.1)
4. Effort needed to issue taxi
clearancesss, fd
2.9 (2.3) 3.6 (2.3) 3.8 (2.8) 6.1 (3.0)
5. Ability to detect aircraft on the
runwayss
9.2 (0.7) 8.8 (2.0) 2.0 (1.4) 2.5 (2.3)
6. Awareness for current aircraft
locationsssXfd
9.0 (0.8) 9.1 (0.8) 5.3 (2.7) 6.8 (2.5)
7. Awareness for projected aircraft
locationsss
8.6 (0.9) 8.8 (0.8) 5.7 (2.3) 5.2 (2.6)
8. Awareness for potential runway
incursionsss
7.8 (2.0) 8.3 (1.7) 3.5 (2.8) 4.1 (3.4)
9. Awareness of the overall traffic
situationss
8.9 (0.8) 8.8 (1.7) 6.6 (2.1) 6.2 (2.2)
10. Workload due to controller-pilot
communicationss, fd
3.3 (2.3) 4.1 (2.1) 4.8 (2.7) 6.6 (2.9)
11. Overall workloadss
3.9 (2.3) 4.4 (2.4) 6.1 (2.3) 7.1 (2.4)
12. Safety of operationsss
9.1 (0.7) 9.1 (1.1) 5.8 (2.0) 6.1 (2.4)
13. Effectiveness of coordinationss
7.9 (1.8) 7.8 (1.5) 6.0 (2.4) 5.4 (2.6)
Note. ss = Significant main effect of surface surveillance; fd = Significant main effect of flight data type;
and ssXfd = Significant interaction of surface surveillance and flight data type.

34
Table 14. Mean (SD) Post-Scenario Questionnaire Ratings for the Local Control Position
by Experimental Condition
Ground Control
Surface Surveillance Presence Surface Surveillance
Yes
Surface Surveillance
No
Flight Data Type TODDS FPS TODDS FPS
Experimental Condition I-TODDS FPS+ ASDE-X PS-TODDS FPS Only
1. Effort needed to maintain flight
datass
6.3 (2.5) 5.3 (1.9) 7.4 (2.2) 7.8 (2.5)
2. Ability to find flight information
6.3 (2.2) 7.6 (1.3) 6.6 (2.5) 6.3 (2.5)
3. Ability to find weather
informationss
7.1 (2.5) 7.3 (2.6) 5.6 (2.9) 6.6 (2.6)
4. Effort needed to issue taxi
clearancesss, fd
2.9 (1.3) 5.6 (2.7) 6.1 (2.1) 6.9 (2.7)
5. Ability to detect aircraft on the
runwayss
9.3 (0.8) 8.6 (1.4) 2.8 (2.1) 3.1 (2.7)
6. Awareness for current aircraft
locationsss
8.3 (1.2) 8.2 (1.3) 3.9 (2.4) 5.1 (2.9)
7. Awareness for projected aircraft
locationsss
8.1 (1.6) 8.2 (1.1) 3.6 (2.2) 4.9 (2.7)
8. Awareness for potential runway
incursionsss,fd
8.6 (1.1) 7.1 (1.8) 6.1 (3.6) 4.8 (3.3)
9. Awareness of the overall traffic
situationss
8.4 (1.2) 8.1 (1.6) 5.5 (2.4) 6.3 (2.6)
10. Workload due to controller-pilot
communicationss
5.1 (2.8) 6.1 (2.6) 7.7 (2.5) 8.1 (2.1)
11. Overall workloadss
7.6 (1.9) 7.6 (2.0) 8.9 (1.3) 9.1 (0.9)
12. Safety of operationsss
8.5 (1.0) 7.7 (1.3) 4.3 (2.1) 4.3 (2.8)
13. Effectiveness of coordinationss
7.9 (1.3) 7.8 (1.4) 5.8 (2.7) 5.8 (2.2)
Note. ss = Significant main effect of surface surveillance; fd = Significant main effect of flight data type;
and ssXfd = Significant interaction of surface surveillance and flight data type.
Overall, the presence of surface surveillance had the largest effect on the PSQ ratings. The
participants thought that surface surveillance improved their abilities associated with the ground
control position for 11 of the 13 items and at the local control position for 12 of the 13 items.
There was a significant main effect of surface surveillance presence on the PSQ ratings for Item 1,
effort needed to maintain flight data at the ground, F(1, 15) = 41.38, and local, F(1, 15) = 14.35,
control positions; Item 2, ability to find flight information, at the ground control position, F(1,
15) = 13.36; Item 3, ability to find weather information, at the local control position, F(1, 15) =
10.79; Item 4, effort needed to issue taxi clearances, at the ground, F(1, 15) = 9.18, and local,
F(1, 14) = 22.56, control positions; Item 5, ability to detect aircraft on the runway, at the ground,
F(1, 14) = 127.47, and local F(1, 15) = 99.31, control positions; Item 6, awareness for current
35
aircraft locations, at the local control position, F(1, 15) = 50.37; Item 7, awareness for projected
aircraft locations, at the ground, F(1, 15) = 52.22, and local, F(1, 15) = 84.30, control positions;
Item 8, awareness for potential runway incursions, at the ground, F(1, 14) = 47.24, and local,
F(1, 15) = 15.42, control positions; Item 9, awareness of the overall traffic situation, at the
ground, F(1, 14) = 22.48, and local, F(1, 15) = 23.39, control positions; Item 10, workload due to
controller-pilot communications, at the ground, F(1, 15) = 13.16, and local, F(1, 15) = 8.34,
control positions; Item 11, overall workload, at the ground, F(1, 15) = 49.18, and local, F(1, 15)
= 17.84, control positions; Item 12, safety of operations, at the ground, F(1, 15) = 68.81, and
local, F(1, 14) = 80.67, control positions; and Item 13, effectiveness of coordination, at the
ground, F(1, 13) = 16.63, and local, F(1, 12) = 13.57, control positions. When the participants
worked at either the ground or local control positions and surface surveillance was available,
they reported that less effort was needed to maintain flight data and to issue taxi clearances; they
were better able to detect aircraft on a runway; they were more aware of projected aircraft
positions; they had a greater awareness of potential runway incursions; they were more aware of
the overall traffic situation; and they had lower workload due to controller-pilot communications.
Also, when working at the ground control position with surface surveillance, the participants
reported that they were better able to find flight information. When they worked at the local
position, they were better able to find weather information and had a better awareness of the
current location of aircraft when surface surveillance was available.
There was a significant main effect of flight data type for Item 4, effort needed to issue taxi
clearances at the ground, F(1, 15) = 7.94, and local, F(1, 14) = 10.85, control positions; Item 8,
awareness for potential runway incursions at the local control position, F(1, 15) = 6.45; and Item
10, workload due to controller-pilot communications at the ground control position, F(1, 15) =
10.65. When the controllers used the TODDS, the participants thought that it was easier to issue
taxi clearances from both the ground and local control positions. When they worked at the local
control position with the TODDS, they reported a greater awareness for potential runway
incursions. When working at the ground control position with the TODDS, the participants
reported lower workload due to controller-pilot communications.
A significant surface surveillance presence by flight data type interaction occurred for PSQ Item
6, awareness of current aircraft locations, at the ground controller position, F(1, 15) = 6.51. The
HSD post hoc analysis showed that when the participants worked at the ground control position,
they rated their awareness for current aircraft position as being low in the FPS only condition,
but rated it even lower in the PS-TODDS condition, HSD(15) = 1.56. The participants rated
their awareness of current aircraft locations equally high when surface surveillance was available
regardless of the flight data type they were using (TODDS or FPS). It is possible that lack of
experience with the PS-TODDS hindered the participants’ ability or their belief that they had a
grasp on current aircraft locations. The participants may have also felt somewhat misled by the
PS-TODDS FDEs, which the participants had to arrange spatially on the touchscreen. Although
the FDEs occupied a location on the airport surface map, aircraft were not necessarily at those
exact locations.

36
3.4 Post-Experiment Questionnaire
After finishing all of the experimental runs, the participants completed the PEQ to provide their
opinions about the experiment, in general, and the TODDS. As shown in Appendix F, the PEQ
items 1 through 5 and items 11 and 12 used a 10-point scale (a rating of 1 indicated extremely
low, and a rating of 10 indicated extremely high). The PEQ items 6 and 13 used a 9-point scale
(where a rating of 1 indicated negative effect, a rating of 9 indicated positive effect, and a rating
of 5 indicated no effect). Table 15 presents the participants’ mean PEQ ratings by item.
Table 15. Mean (SD) Post-Experimental Questionnaire Ratings by Item
PEQ Item Mean
(SD) 1. Rate the readability of the readout area when using the Integrated TODDS and the
Perceptual-Spatial TODDS.
8.7 (0.9)
2. Rate the readability of the weather information box when using the Integrated and
Perceptual-Spatial TODDS.
7.6 (2.2)
3. Rate the readability of the flight data elements when using the Integrated TODDS. 8.4 (1.6)
4. Rate the readability of the data blocks when using the Integrated TODDS. 8.8 (1.3)
5. Rate the overall effort needed to use the touchscreen when using the Integrated TODDS. 5.5 (2.5)
6. What effect do you think the Integrated TODDS will have on your ability to control
traffic in the tower?
7.1 (1.5)
11. Rate the readability of the flight data elements when using the Perceptual-Spatial
TODDS.
7.7 (1.3)
12. Rate the overall effort needed to use the touchscreen when using the Perceptual-Spatial
TODDS.
6.9 (2.3)
13. What effect do you think the Perceptual-Spatial TODDS will have on your ability to
control traffic in the tower?
5.8 (1.5)
The participants reported that the readout area, weather information, and FDEs of the I-TODDS
and the PS-TODDS were very readable. They also gave high ratings for the readability of data
blocks on the I-TODDS. The participants rated the effort to use the touchscreen with the I-TODDS
as moderate, whereas the touchscreen with the PS-TODDS took a little more effort. They
probably perceived that the PS-TODDS required more effort because they had to move each
FDE multiple times. The participants thought that the I-TODDS would have a positive effect
on their ability to control airport traffic, but they were less sure about the positive effects that the
PS-TODDS might have. Appendix I contains the participants’ open-ended responses for each
item of the PEQ.

37
4. RECOMMENDED DESIGN CHANGES
On the basis of the experiment, we recommend a number of design changes for both of the
TODDS designs. The overall usability of the TODDS should improve as controllers become
more familiar with the system. However, we need to make some design changes to improve the
initial level of usability and to improve the overall efficiency of the system. Given the usability
data, questionnaire data, participant comments, and experimenter observations, we make a
number of recommendations to improve the interfaces and to reduce the errors associated with
the I-TODDS and the PS-TODDS. Some recommendations apply only to one interface, whereas
other recommendations apply to both interfaces.
4.1 Recommended Design Changes for I-TODDS
We recommend four design changes and new features for the I-TODDS: (a) refine the automatic
data block offset, (b) modify the list header/button labels and layout, (c) improve the FDE recall
function, and (d) modify the algorithm for indicating when an aircraft is moving on a runway
surface. These changes should improve usability, reduce error rates, and provide controllers with
better information.
4.1.1 Improve Automatic Data Block Offset
The I-TODDS uses three different types of data block offsets to prevent data block overlap and
to ensure that important information is always visible: initial leader-line orientation, TIPH
leader-line orientation, and automatic data block offset. The system positions the data blocks
according to an initial leader-line orientation rule when departure aircraft first appear on I-TODDS.
Aircraft assigned to depart runway 27 had a leader-line pointing to the left, or the number four
position (imagine a telephone keypad). Aircraft assigned to runway 33L or 33R had a leader-line
pointing to the right, or the number six position. We designed these initial leader-line orientations
based on orientation of the surface surveillance map corresponding to a controller’s OTW view
for out simulated airport (as illustrated in Figures 1 and 2). By using the initial leader-line
orientation rules in this configuration, the data blocks are less likely to obscure the runways as
aircraft taxi for departure. However, because the current experiment did not have an OTW view,
some of the participants working at the local control position elected to rotate the I-TODDS
surface map to a North-up orientation to match the STARS display. We did not anticipate that
the participants would change the map orientation in this way. Rotating the I-TODDS map
reduced the participants need to perform a mental rotation when they transitioned their visual
scan from the I-TODDS to the STARS display and back, but it also interfered with the initial
leader-line orientation. The leader lines continued to appear according to the established rule,
but did not account for the map rotation. Therefore, the initial leader-line direction had a
tendency to create more initial clutter than desired. The map rotation also affected the leader-
line position for TIPH aircraft. When the I-TODDS detected that an aircraft had stopped on a
runway surface, the I-TODDS highlighted the aircraft’s flight data in orange and the leader line
moved to the up, or number two, position. Like the initial leader-line orientation, the TIPH
leader-line position did not account for the fact that the participant had rotated the map. We
recommend that the I-TODDS account for the map orientation when determining both initial and
TIPH leader-line orientations such that the leader-line positions are determined relative to the
map based on cardinal direction.

38
4.1.2 Redesign Proximal List Header/Button Labels
The I-TODDS FDE lists contain labeled headers and buttons. The headers double as buttons
because the controller can select an FDE or data block and then select a list header/button to
place the flight data in that list, or to transfer it to another control position. For example, when
the ground controller provides an initial taxi clearance to an aircraft, the controller selects the
aircraft’s FDE, or data block, and then selects the outbound list header/button to move the FDE
from the pending list to the outbound list. When the ground controller switches the aircraft to the
tower frequency, he selects the aircraft’s FDE, or data block, and then selects the local button to
pass the flight data to the local controller. During the experiment, we noticed that the FDE list
headers/buttons caused some confusion and led to some task errors. Occasionally, the header/
button labels confused the participants because the labels did not match their phraseology. As in
the previous example, when the ground controller transferred an aircraft to the local controller,
she told the pilot, “Contact tower 118.5,” and she selected the aircraft’s FDE or data block, and
then she selected the local button. The confusion occurred because of the mismatch between the
instruction to contact “tower” and the button used to transfer the flight data labeled LOCAL. The
same circumstance existed on the local controller’s display with the button labeled TRACON
which the controller used when instructing an aircraft to contact departure. Therefore, we
recommend changing the button label for the ground control position from LOCAL to TOWER,
and changing the header/button labels for the local control position from DEPARTURE to
OUTBOUND and from TRACON to DEPARTURE. These changes should reduce the
controller’s confusion and task error rate by making the labels match the controller’s
phraseology.
A second type of task error occurred when the participants used the I-TODDS due to header/
buttons that were stacked on top of one another. This arrangement caused the participants to
occasionally select the wrong header/button. As shown in Figures 1 and 2, this condition existed
on both the ground and local control positions. We recommend redesigning the stacked header/
buttons (see Figure 18) to reduce the number of task errors while still preserving the intent and
usability of the original design.
Figure 18. Recommended button/header design for the ground (left) and local (right) control
positions to prevent inadvertent selection of a proximal button.
4.1.3 Position of Recalled FDEs
The participants were able to recover from most task errors involving the transfer of flight data
by using the FDE recall procedure. Whenever the system or a participant placed an FDE in a list
or the participant recalled an FDE to a list or control position, the FDE always appeared at the
top of the list. Placing an FDE at the top of a list works for new flight data because the controller
expects that the oldest flight data is at the bottom of the list and the newest flight data is at the
top of the list. However, the I-TODDS violated this expectation whenever the participant
recalled an FDE and placed flight data out of sequence. The participant then had to resequence

39
the flight data by selecting the recalled FDE and dragging it to the proper position at or near the
bottom of the list. Placing a recalled FDE at the top of the list also caused problems on the local
control position’s departure list because if that list was full, then the recalled FDE was not
visible. The controller still had possession information available via the data block, leader line,
and position- symbol color coding (white for possession, gray for nonpossession), and could
perform flight data functions by selecting the data block; however, the controller could not select
or resequence the FDE if desired. Therefore, we recommend that all recalled FDEs be placed at
the bottom of the appropriate list, so that they remain in sequence and accessible.
4.1.4 Improve Runway Occupancy Indicator
The Runway Occupancy indicator highlighted an aircraft’s FDE, data block, leader line, and
position symbol in yellow whenever an aircraft was moving on a runway surface. Orange
highlighting occurred whenever an aircraft stopped on a runway surface. The participants
reported they also need to know when an aircraft is about to enter or has just exited a runway
surface. That is, the participants wanted to see the Runway Occupancy indicator activate when
an aircraft was inside the runway hold short lines and encroaching upon a runway even though
the aircraft may not be directly on the runway surface. Therefore, we recommend changing the
parameters of the Runway Occupancy indicator so that the highlighting turns on sooner and turns
off later to account for the aircraft’s position relative to the hold short lines. Adjusting the
Runway Occupancy indicator in this way will alert the controller to aircraft that are encroaching
on a runway and to aircraft that have yet to clear the runway even though they are not on the
runway itself. The yellow highlighting should appear whenever an aircraft is moving inside of
the hold short lines, and the orange highlighting should appear whenever an aircraft is stopped
inside of the hold short lines.
4.2 Recommended Design Changes for PS-TODDS
We recommend making the following changes to the PS-TODDS to improve overall usability:
add the ability to remove FDEs from the departure list, adjust the sensitivity of an FDE drag, and
simplify the FDE recall procedure.
4.2.1 Remove FDEs from the Departure List
Once the local controller cleared an aircraft for departure, the controller selected the aircraft’s
FDE and then selected the departure clearance button to place the FDE in the departure list.
When the FDE was in the departure list, there was no way of removing it. This caused a
problem in the experiment because occasionally a participant would place an FDE in the
departure list prematurely or they would place the wrong FDE in the departure list and then
wanted to remove it. The participants tried a number of ways to remove the FDE from the
departure list to no avail as shown by the task failures listed in Table 12. All four task failures
that we observed for the PS-TODDS resulted from the participant not being able to remove an
inadvertently placed FDE from the departure list. We recommend allowing the controller to drag
an FDE out of the departure list at any time.
4.2.2 Reduce FDE Drag Sensitivity
Controllers could either select or drag an FDE, and the PS-TODDS must be able to distinguish
between these two actions. When a controller selected an FDE, the FDE was highlighted in
green until the controller performed an action such as setting a timer, amending the flight data, or

40
dragging. Once the controller completed an action, the PS-TODDS automatically deselected the
FDE and removed the green highlighting. We designed the PS-TODDS to detect a drag
whenever the controller moved an FDE more than 10 pixels (about 0.094 in/0.037 cm). This
criterion for distinguishing between an FDE selection and an FDE drag may have been too
stringent, leading to an excessive number of inadvertent drags. Inadvertent drags may have
occurred because the participants had a tendency to use a ballistic movement, causing the
fingertip to move slightly when contacting the touchscreen, or because a participant held their
fingertip on the touchscreen too long and then made an inadvertent movement. Inadvertent drags
were most likely to lead to a deselect error where the participant thought that they had selected
an FDE to take some action, but the PS-TODDS detected a slight movement, recognized the
action as a drag, and automatically deselected the FDE. When the participant tried to take the
desired action, such as changing a runway assignment, nothing happened because the FDE had
been deselected. We recommend adjusting the criterion for distinguishing between an FDE
select and an FDE drag so that inadvertent drags occur less frequently.
4.2.3 Modify the FDE Recall Procedure
In the PS-TODDS, the participants could transfer an FDE to another list, controller position, or
facility by selecting an FDE and then selecting the appropriate list header or position button.
The participants could also recall a transferred FDE by selecting the list header or button where
the FDE was transferred to, thereby displaying a history of the most recently transferred FDEs in
the readout area, and then selecting the FDE they wish to recall followed by selecting the FDE
history list header. This recall procedure placed the FDE in its last state prior to transfer. For
example, when the local controller transferred an arrival FDE to the ground controller, the local
controller selected the arrival FDE, then selected the ground button, the FDE text and border
changed from white to gray (indicating lack of possession), and the controller would no longer
be able to move or otherwise control the FDE. To recall the FDE from the ground controller, the
local controller selected the ground button, selected the appropriate FDE from the history list in
the readout area, selected the history header/button, the FDE text changed from gray to white
(indicating possession), and the local controller would then have full control of the FDE.
The participants said that the FDE recall process was cumbersome and difficult to remember.
Therefore, we recommend simplifying the FDE recall process by providing a recall button. If
the transferred FDE is still visible on the controller’s display (as in the previous example of the
local controller transferring an FDE to the ground controller) the local controller could regain
possession of the FDE by selecting the unowned FDE and then selecting the recall button. If the
controller wishes to recall an FDE that was passed to another facility, such that the FDE was not
visible on the display, the controller would select the button used to transfer the FDE to activate
the history list in the readout area, select the FDE they wish to recall, and select the recall button
and then the FDE would return to the controller’s display in the same state as it existed before
being transferred. Although this new recall procedure adds a button to the display, it simplifies
the procedure for the most frequently used type of FDE recall.

41
4.3 Recommended Common Design Changes for the I-TODDS and the PS-TODDS
We recommend three changes that are common to both the I-TODDS and the PS-TODDS:
increase the salience of the Hold Short indicator, increase the salience of the ATIS update, and
add Aviation Routine Weather Report (METAR) information.
4.3.1 Increase Salience of Hold Short Indicator
The Hold Short indicator appeared as a dashed line on the left side of an FDE in the PS-TODDS,
and it appeared on the left side of a data block in the I-TODDS (as shown in Figures 1 through
4). The controller could place a Hold Short indicator either by giving a D-Taxi clearance that
included a hold short instruction or by selecting an aircraft’s FDE, or data block, and then
selecting the Hold Short button. However, some of the participants reported that the Hold Short
indicator lacked salience. We recommend increasing the salience of the hold short indicator by
increasing the line width.
4.3.2 Increase Salience of ATIS Update
The current ATIS code appeared in the moveable weather information area (as shown in the
upper right-hand corner of Figures 1 through 4). When the ATIS code updated, the ATIS letter
flashed between gray and yellow text for 15 s and then remained yellow until selected by the
participant. When the participant selected the updated ATIS code, it reverted to gray text. The
FDE and ATIS Update indicators also reappeared on the right side of the FDEs to remind the
participants to issue the new ATIS information to each pilot. Although the ATIS updated twice
during each 40 min scenario, the participants reported that the ATIS update was not very
noticeable, and they often forgot to perform the correct ATIS update procedure. Therefore, we
recommend increasing the salience of the ATIS Update indicator by using reverse highlighting
to highlight the ATIS code and its background field while flashing. Also, the ATIS code should
continue to flash until the controller selects it to acknowledge that an update has occurred. The
reverse highlighting and continuous flashing should improve the salience of the ATIS code
update.
4.3.3 Add METAR Information
The weather information area contained the current ATIS code, wind direction, wind speed,
gust speed, altimeter reading, and runway visual range for each active runway. When an ATIS
update occurred, the participants reported that they lacked information about what new weather
conditions existed, if any. We recommend making METAR information available on demand to
the controller by associating it with the ATIS code. Whenever the controller selects the ATIS
update code, the METAR information should appear in the readout area. This new feature will
provide controllers with on-demand access to the complete set of current weather information
without adding any additional information to the primary display.
5. CONCLUSION AND RECOMMENDATIONS
The current experiment compared the I-TODDS and the PS-TODDS to current FPS operations
with and without surface surveillance in a zero-visibility environment. We measured controller
performance, workload, and opinion; and we assessed the usability of the TODDS concepts.

42
The experiment presented an extreme test of the TODDS in that the controller participants had
relatively little familiarity with the airport layout, traffic patterns, and the TODDS. The
participants also experienced levels of traffic that were higher and more complex than what they
would normally experience during zero-visibility operations.
The presence of surface surveillance significantly improved airport efficiency by increasing the
participants’ awareness of the traffic situation and the number of departures; and by reducing
ramp waiting time, number and duration of departure delays, number of ground controller-to-
pilot transmissions, and controller effort. The TODDS increased time aircraft spent waiting on
the ramp, but decreased the number and duration of ground controller-to-pilot transmissions.
The I-TODDS decreased the duration of taxi-out and taxi-in operations. The I-TODDS also
provided an operational increase in the number of departures and a reduction in the number and
duration of departure delays, but these differences were not statistically significant. The overall
error rate for TODDS usage was 4% − a reduction from the initial design concept. The
participants found the TODDS useful and thought it would have a positive effect on ATCT
operations, especially when integrated with surface surveillance, as in the I-TODDS condition.
However, the participants had some reservations about the PS-TODDS because they thought it
required more effort and could mislead the ground controller regarding aircraft position. Based
on the results of this experiment, the I-TODDS may be able to support SNT operations as an
alternative to an OTW view.
On the basis of the usability results and the airport efficiency metrics, researchers should
continue to expand the scope of the TODDS to accommodate more tasks and to improve overall
usability. Adding new functions and capabilities will increase the time controllers need to learn
the TODDS, but it should also improve the overall system and bring it that much closer to being
a realistic tool that could support ATCT controllers and improve the efficiency of the NAS. We
recommend that future experiments continue to employ the touchscreen training protocol and
extend the training time for the TODDS to improve the participants overall familiarity with the
system. The commonly used functions should be well learned prior to data collection so that the
participants can focus their attention on the primary task of moving aircraft instead of on a new
interface that they have used for only a couple of hours. Increasing the participants’ familiarity
with the TODDS prior to data collection should improve their ability to use the TODDS and
result in better overall performance and airport efficiency.
Future experiments should focus on new and expanded capabilities such as data communications
and how the I-TODDS may support the SNT concept. In particular, researchers should examine
how much time controllers spend looking at the TODDS vs. looking out of the tower window.
We must have a better understanding of this heads-down time and the value of allocating visual
attention between the various sources of information in the ATCT environment. Future
experiments should also compare the TODDS with and without an OTW view to assess its
ability to support both current and future ATCT operations. Researchers must examine what
information ATCT controllers glean from looking out the window, and how or if that information
can be replaced by using an interface such as the TODDS. When controllers do not have an
OTW view and lose access to vital information (e.g., zero-visibility or SNT operations),
researchers must determine what costs, if any, this may impose on controllers, airport efficiency,
and safety.

43
References
Dayton, T., McFarland, A., & Kramer, J. (1998). Bridging user needs to object oriented GUI
prototype via task object design. In L. E. Wood (Ed.), User Interface Design. Boca
Raton, FL: CRC Press.
Geisser, S., & Greenhouse, S. W. (1958). An extension of Box’s results on the use of the F
distribution in multivariate analysis. Annals of Mathematical Statistics, 29, 885-891.
Hays, W. L. (1988). Statistics. New York: Holt, Rinehart, and Winston.
Huynh, H., & Feldt, L. S. (1970). Conditions under which mean square ratios in repeated
measures designs have exact F distributions. Journal of the American Statistical
Association, 65, 1582-1589.
Joint Economic Committee of the United States Senate. (2008). Your Flight Has Been Delayed
Again. Retrieved May 11, 2009, from http://jec.senate.gov
Joint Planning and Development Office. (2007). Concept of Operations for the Next Generation
Air Transportation System (Version 2.0).
Kirk, R. E. (1982). Experimental design: Procedures for the behavioral sciences (2nd
ed.).
Belmont, CA: Brooks-Cole.
Rouanet, H., & Lepine, D. (1970). Comparisons between treatments in a repeated measurement
design: ANOVA and multivariate methods. British Journal of Mathematics and Statistics
for Psychology, 23, 147-163.
Simmons, B., Boan, L., & Massimini, P. (2000). Simulation analysis of dual CRDA arrival
streams to runways 27 and 33L at Boston Logan International Airport (MTR
00W0000128). McLean, VA: The MITRE Corporation, Center for Advanced Aviation
System Development.
Truitt, T. R. (2006a). Concept development and design description of electronic flight data
interfaces for Airport Traffic Control Towers (DOT/FAA/TC-TN-06/17). Atlantic City
International Airport, NJ: FAA William J. Hughes Technical Center.
Truitt, T. R. (2006b). Electronic flight data in Airport Traffic Control Towers: Literature review
(DOT/FAA/CT-05/13). Atlantic City International Airport, NJ: FAA William J. Hughes
Technical Center.
Truitt, T. R. (2008). Tower Operations Digital Data System - Concept refinement and
description of new features (DOT/FAA/TC-08/09). Atlantic City International Airport,
NJ: FAA William J. Hughes Technical Center.
Truitt, T. R., & Muldoon, R. (2007). New electronic flight data interface designs for Airport
Traffic Control Towers: Initial usability test (DOT/FAA/TC-07/16). Atlantic City
International Airport, NJ: FAA William J. Hughes Technical Center.

44
Acronyms
ANOVA Analysis of Variance
ASDE-X Airport Surface Detection Equipment – Model X
ATCT Airport Traffic Control Tower
ATIS Automatic Terminal Information Service
BOS Boston Logan International Airport
DESIREE Distributed Environment for Simulation, Rapid Engineering, and Experimentation
D-Taxi Digital Taxi
EDCT Expected Departure Clearance Time
EFD Electronic Flight Data
EFDI Electronic Flight Data Interface
EVO Equivalent Visual Operations
FAA Federal Aviation Administration
FDE Flight Data Element
FPS Flight Progress Strip
HITL Human-In-The-Loop
HSD Tukey’s Honestly Significant Difference
IDS Information Display System
I-TODDS Integrated TODDS
JPDO Joint Planning and Development Office
METAR Aviation Routine Weather Report
NAS National Airspace System
NextGen Next Generation Air Transportation System
OTW Out-The-Window
PEQ Post-Experimental Questionnaire
PSQ Post-Scenario Questionnaire
PS-TODDS Perceptual-Spatial TODDS
PTT Push-To-Talk
RDHFL Research, Development, and Human Factors Laboratory
SD Standard Deviation
SME Subject Matter Expert
SNT Staffed NextGen Tower

45
STARS Standard Terminal Automation Replacement System
TGF Target Generation Facility
TIPH Taxi-Into-Position-and-Hold
TODDS Tower Operations Digital Data System
TRACON Terminal Radar Approach Control

Appendix A
Informed Consent Statement

A-1
Informed Consent Statement
I, ______________________________, understand that this study, entitled “An Empirical Test
of the Tower Operations Digital Data System in Zero-Visibility Conditions” is sponsored by the
Federal Aviation Administration and is being directed by Dr. Todd R. Truitt.
Nature and Purpose:
I have been recruited to volunteer as a participant in this project. The purpose of the study is to
determine the effects of alternative air traffic control procedures in a part-task simulation. The
results of the study will be used to establish the feasibility of implementing these alternative or
similar air traffic control procedures in an operational environment.
Experimental Procedures:
Each participant will possess skills at an ATCT facility rated as level 10 or higher. Because our
simulated ATCT environment is similar to a configuration of Boston Logan International Airport
(BOS), controllers from BOS may not participate to ensure valid results. All participants must
have normal, or corrected to normal, vision. All participants must be able to stand for up to 1.5
hours without a break.
ATCT controllers will arrive at the RDHFL in groups of two and will participate over 3 days.
Each participant will complete an airport traffic control tower task at both the ground and local
positions. The first day of the study will consist of a project briefing, equipment familiarization,
touchscreen training, and practice scenarios. During the second day, the participants will work
practice and experimental scenarios. During the third day, the participants will complete the
experimental scenarios and complete a final debriefing. The participants will work from about
8:30 AM to about 5:00 PM every day with a lunch break and at least two rest breaks.
The participants will control airport traffic under four different experimental conditions. After
each scenario, the participants will complete questionnaires to evaluate the impact of the
alternative procedures on participant workload and acceptance. In addition, an experimenter will
take notes during each scenario to further assess the Tower Operations and Digital Data System
concept. The simulation will be audio-video recorded so researchers can calculate objective
measures and reexamine any important events.
Discomfort and Risks:
I understand that I will not be exposed to any foreseeable risks or intrusive measurement
techniques.
Confidentiality:
My participation is strictly confidential, and I understand that no individual names or identities
will be recorded, associated with data, or released in any reports.
Benefits:
I understand that the only benefit to me is that I will be able to provide the researchers with
valuable feedback and insight into the effects of alternative methods and procedures for use in
airport traffic control towers. My data will help the FAA to establish the feasibility of these
methods and procedures within such an environment.

A-2
Participant Responsibilities:
I am aware that to participate in this study I must be a current or former certified professional
controller in the Terminal specialty. I will control traffic and answer any questions asked during
the study to the best of my abilities. I will not discuss the content of the experiment with anyone
until the study is completed.
Participant Assurances:
I understand that my participation in this study is completely voluntary and I can withdraw at any
time without penalty. I also understand that the researchers in this study may terminate my
participation if they believe it is in my best interest. I understand that if new findings develop
during the course of this research that may relate to my decision to continue participation, I will
be informed.
I have not given up any of my legal rights or released any individual or institution from liability
for negligence.
Dr. Truitt has adequately answered all the questions I have asked about this study, my
participation, and the procedures involved. I understand that Dr. Truitt or another member of the
research team will be available to answer any questions concerning procedures throughout this
study.
If I have questions about this study or need to report any adverse effects from the research
procedures, I will contact Dr. Truitt at (609) 485-4351.
Compensation and Injury:
I agree to immediately report any injury or suspected adverse effect to Dr. Todd R. Truitt at
(609) 485-4351. Local clinics and hospitals will provide any treatment, if necessary. I agree to
provide, if requested, copies of all insurance and medical records arising from any such care for
injuries/medical problems.
Signature Lines:
I have read this informed consent statement. I understand its contents, and I freely consent to
participate in this study under the conditions described. I understand that, if I want to, I may
have a copy of this form.
Research Participant:________________________________________Date:__________
Investigator:_______________________________________________Date:__________
Witness:__________________________________________________Date:__________

Appendix B
Biographical Questionnaire
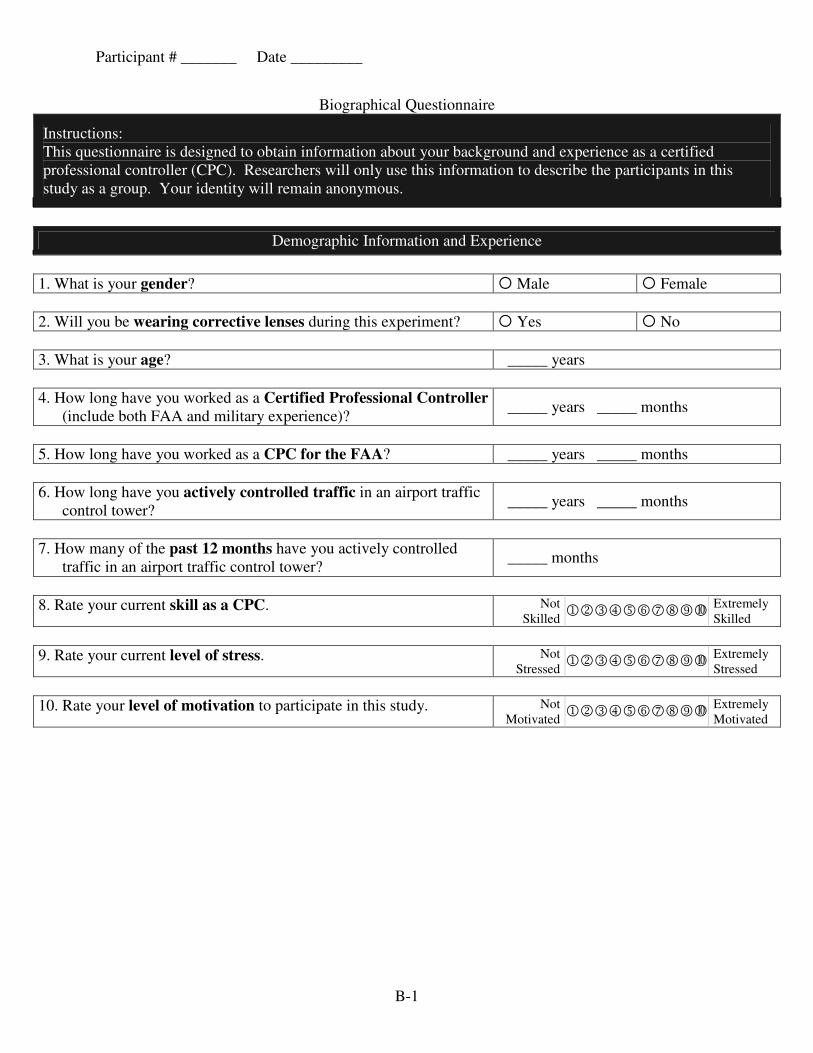
Participant # _______ Date _________
B-1
Biographical Questionnaire
Instructions:
This questionnaire is designed to obtain information about your background and experience as a certified
professional controller (CPC). Researchers will only use this information to describe the participants in this
study as a group. Your identity will remain anonymous.
Demographic Information and Experience
1. What is your gender? � Male � Female
2. Will you be wearing corrective lenses during this experiment? � Yes � No
3. What is your age? _____ years
4. How long have you worked as a Certified Professional Controller
(include both FAA and military experience)? _____ years _____ months
5. How long have you worked as a CPC for the FAA? _____ years _____ months
6. How long have you actively controlled traffic in an airport traffic
control tower? _____ years _____ months
7. How many of the past 12 months have you actively controlled
traffic in an airport traffic control tower? _____ months
8. Rate your current skill as a CPC. Not
Skilled 123456789�
Extremely
Skilled
9. Rate your current level of stress. Not
Stressed 123456789�
Extremely
Stressed
10. Rate your level of motivation to participate in this study. Not
Motivated 123456789�
Extremely
Motivated

Appendix C
Touchscreen Training Instructions
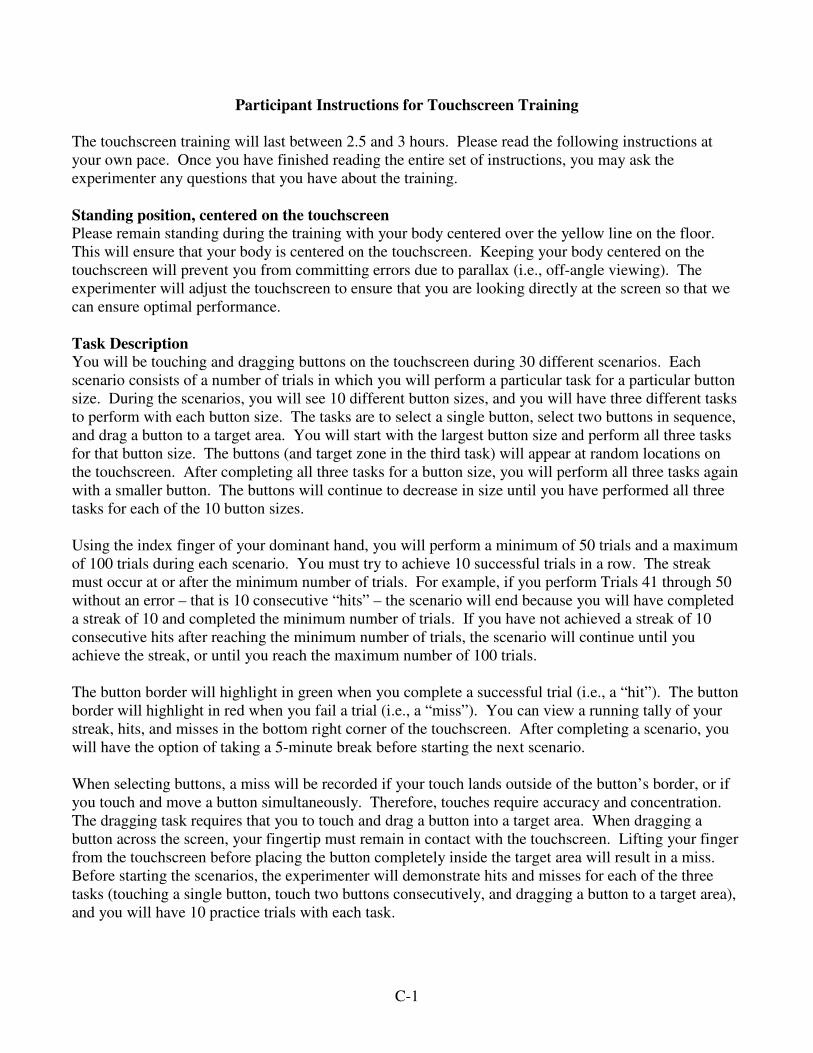
C-1
Participant Instructions for Touchscreen Training
The touchscreen training will last between 2.5 and 3 hours. Please read the following instructions at
your own pace. Once you have finished reading the entire set of instructions, you may ask the
experimenter any questions that you have about the training.
Standing position, centered on the touchscreen
Please remain standing during the training with your body centered over the yellow line on the floor.
This will ensure that your body is centered on the touchscreen. Keeping your body centered on the
touchscreen will prevent you from committing errors due to parallax (i.e., off-angle viewing). The
experimenter will adjust the touchscreen to ensure that you are looking directly at the screen so that we
can ensure optimal performance.
Task Description
You will be touching and dragging buttons on the touchscreen during 30 different scenarios. Each
scenario consists of a number of trials in which you will perform a particular task for a particular button
size. During the scenarios, you will see 10 different button sizes, and you will have three different tasks
to perform with each button size. The tasks are to select a single button, select two buttons in sequence,
and drag a button to a target area. You will start with the largest button size and perform all three tasks
for that button size. The buttons (and target zone in the third task) will appear at random locations on
the touchscreen. After completing all three tasks for a button size, you will perform all three tasks again
with a smaller button. The buttons will continue to decrease in size until you have performed all three
tasks for each of the 10 button sizes.
Using the index finger of your dominant hand, you will perform a minimum of 50 trials and a maximum
of 100 trials during each scenario. You must try to achieve 10 successful trials in a row. The streak
must occur at or after the minimum number of trials. For example, if you perform Trials 41 through 50
without an error – that is 10 consecutive “hits” – the scenario will end because you will have completed
a streak of 10 and completed the minimum number of trials. If you have not achieved a streak of 10
consecutive hits after reaching the minimum number of trials, the scenario will continue until you
achieve the streak, or until you reach the maximum number of 100 trials.
The button border will highlight in green when you complete a successful trial (i.e., a “hit”). The button
border will highlight in red when you fail a trial (i.e., a “miss”). You can view a running tally of your
streak, hits, and misses in the bottom right corner of the touchscreen. After completing a scenario, you
will have the option of taking a 5-minute break before starting the next scenario.
When selecting buttons, a miss will be recorded if your touch lands outside of the button’s border, or if
you touch and move a button simultaneously. Therefore, touches require accuracy and concentration.
The dragging task requires that you to touch and drag a button into a target area. When dragging a
button across the screen, your fingertip must remain in contact with the touchscreen. Lifting your finger
from the touchscreen before placing the button completely inside the target area will result in a miss.
Before starting the scenarios, the experimenter will demonstrate hits and misses for each of the three
tasks (touching a single button, touch two buttons consecutively, and dragging a button to a target area),
and you will have 10 practice trials with each task.

C-2
Accuracy vs. Speed
When selecting a button, use the index finger of your dominant hand and aim for the center of the
button. Please perform all of the tasks and trials as accurately as possible. Do not sacrifice accuracy to
increase speed.
If you have any questions, please ask the experimenter now. If you have questions during the training,
please feel free to ask.

Appendix D
TODDS Training Protocol

D-1
Integrated TODDS
1. General rules of operation
a. Orientation to screen
i. Screen is movable
ii. Position yourself directly in front of the screen to prevent parallax
b. Orientation of the airport surface map
i. North is not up
ii. ASDE-X functions preserved
a. Map rotation
b. Map zoom
c. Weather information box
d. Placement of the EFD lists (Ctrl-p)
e. Noun-Verb interaction style
i. Select object to act upon
ii. Select action to perform
iii. Automatic object deselect
f. How to select an EFD object
i. Tap screen instead of touch and hold
ii. Touch and hold may cause auto deselect if object is moved
g. Touch vs. Slew
i. Touch is for EFD interaction
ii. Slew if for ASDE-X interaction
h. Owned vs. Unowned
i. Owned is white, unowned is gray
ii. Can only change info on owned data
2. Flight Data Interaction
a. Automatic data block offset
i. Moving data block removes that data block from algorithm
ii. “5” ENTER returns all data blocks to the algorithm
b. Select FDE
c. Select Data Block
d. Readout Area
e. Change Runway/Intersection Assignment
f. Resequence FDE
g. Move Data Block
h. Highlight Flight Data
i. Change Assigned Heading
j. Change Assigned Altitude
k. Change Assigned Heading and Altitude
l. Acknowledge Heading/Altitude Change
m. ATIS update
n. Weather Information Box
o. Generic Timer
i. Set
ii. Monitor
iii. Acknowledge Expired Timer
p. Aircraft Specific Timer
i. Set
ii. Monitor
iii. Acknowledge

D-2
q. Transfer FDE r. Recall FDE s. Digital Taxi Clearance
i. Indicators ii. Canned routes
iii. Conformance monitoring iv. Cancel

D-3
Perceptual-Spatial TODDS
1. General rules of operation
a. Orientation to screen
i. Screen is movable
ii. Position yourself directly in front of the screen to prevent parallax
b. Orientation of the airport surface map
i. North is not up
ii. Map can’t be changed
c. Weather information box
d. Noun-Verb interaction style
i. Select object to act upon
ii. Select action to perform
iii. Automatic object deselect
e. How to select an EFD object
i. Tap screen instead of touch and hold
ii. Touch and hold may cause auto deselect if object is moved
f. Owned vs. Unowned
i. Owned is white, unowned is gray
ii. Can only change info on owned data
g. Ground & Local displays are linked
2. Flight Data Interaction
a. Select FDE
b. Readout Area
c. Operation of Zones
d. Resequence FDE
e. Highlight Flight Data
f. Change Runway/Intersection Assignment
g. Change Assigned Heading
h. Change Assigned Altitude
i. Change Assigned Heading and Altitude
j. Acknowledge Heading/Altitude Change
k. ATIS update
l. Weather Information Box
m. Generic Timer
i. Set
ii. Monitor
iii. Acknowledge Expired Timer
n. Aircraft Specific Timer
i. Set
ii. Monitor
iii. Acknowledge
o. TIPH
p. Departure Clearance
q. Transfer FDE
r. Recall FDE
s. Digital Taxi Clearance i. Canned routes
ii. Indicators iii. Conformance monitoring iv. Cancel

Appendix E
Post-Scenario Questionnaire
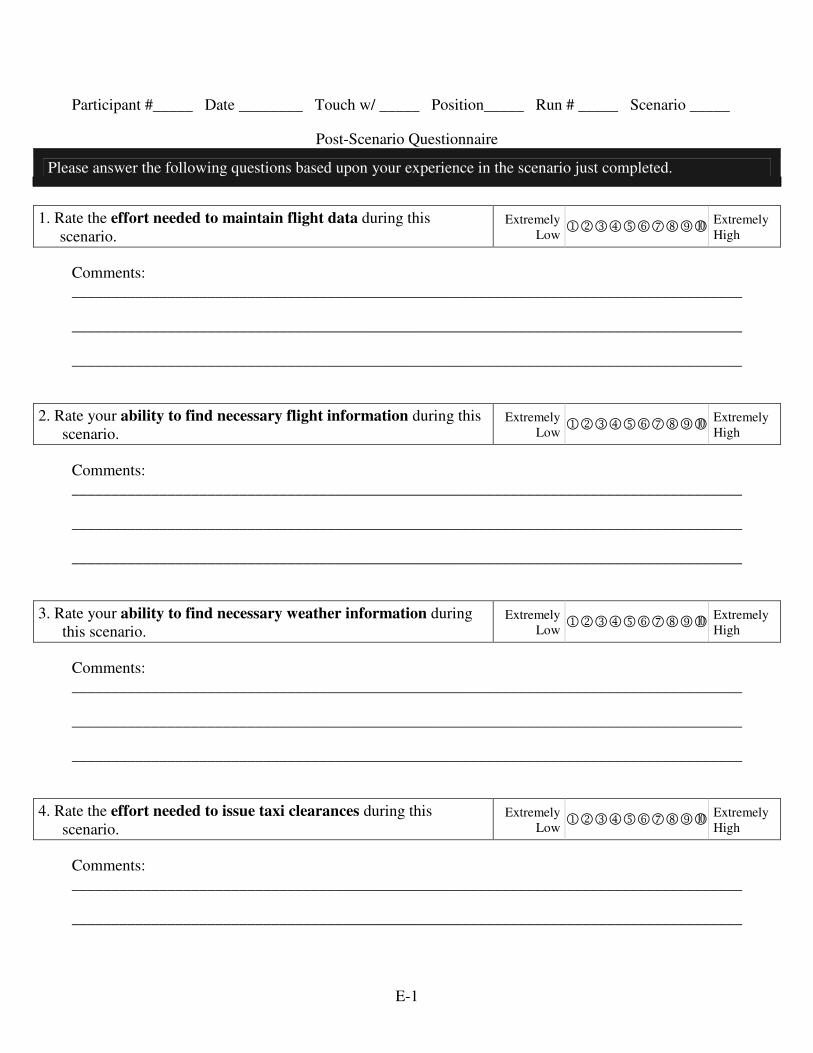
E-1
Participant #_____ Date ________ Touch w/ _____ Position_____ Run # _____ Scenario _____
Post-Scenario Questionnaire
Please answer the following questions based upon your experience in the scenario just completed.
1. Rate the effort needed to maintain flight data during this
scenario. Extremely
Low 123456789�
Extremely
High
Comments:
____________________________________________________________________________________
____________________________________________________________________________________
____________________________________________________________________________________
2. Rate your ability to find necessary flight information during this
scenario. Extremely
Low 123456789�
Extremely
High
Comments:
____________________________________________________________________________________
____________________________________________________________________________________
____________________________________________________________________________________
3. Rate your ability to find necessary weather information during
this scenario. Extremely
Low 123456789�
Extremely
High
Comments:
____________________________________________________________________________________
____________________________________________________________________________________
____________________________________________________________________________________
4. Rate the effort needed to issue taxi clearances during this
scenario. Extremely
Low 123456789�
Extremely
High
Comments:
____________________________________________________________________________________
____________________________________________________________________________________

E-2
____________________________________________________________________________________
5. Rate your ability to detect aircraft on the runway during this
scenario. Extremely
Low 123456789�
Extremely
High
Comments:
____________________________________________________________________________________
____________________________________________________________________________________
____________________________________________________________________________________
6. Rate your awareness for current aircraft locations during this
scenario. Extremely
Low 123456789�
Extremely
High
Comments:
____________________________________________________________________________________
____________________________________________________________________________________
____________________________________________________________________________________
7. Rate your awareness for projected aircraft locations during this
scenario. Extremely
Low 123456789�
Extremely
High
Comments:
____________________________________________________________________________________
____________________________________________________________________________________
____________________________________________________________________________________
8. Rate your awareness for potential runway incursions during this
scenario. Extremely
Low 123456789�
Extremely
High
Comments:
____________________________________________________________________________________
____________________________________________________________________________________
____________________________________________________________________________________

E-3
9. Rate your awareness of the overall traffic situation during this
scenario. Extremely
Low 123456789�
Extremely
High
Comments:
____________________________________________________________________________________
____________________________________________________________________________________
____________________________________________________________________________________
10. Rate your workload due to controller-pilot communication
during this scenario. Extremely
Low 123456789�
Extremely
High
Comments:
____________________________________________________________________________________
____________________________________________________________________________________
____________________________________________________________________________________
11. Rate your overall workload during this scenario. Extremely
Low 123456789�
Extremely
High
Comments:
____________________________________________________________________________________
____________________________________________________________________________________
____________________________________________________________________________________
12. Rate the safety of operations during this scenario. Extremely
Low 123456789�
Extremely
High
Comments:
____________________________________________________________________________________
____________________________________________________________________________________
____________________________________________________________________________________

E-4
13. Rate the effectiveness of coordination between the ground and
local positions during this scenario. Extremely
Low 123456789�
Extremely
High
Comments:
____________________________________________________________________________________
____________________________________________________________________________________
____________________________________________________________________________________
14. Do you have any additional comments or clarifications about your experience during this scenario?
_________________________________________________________________________________
_________________________________________________________________________________
_________________________________________________________________________________
_________________________________________________________________________________
_________________________________________________________________________________

Appendix F
Post-Experiment Questionnaire

F-1
Post-Experiment Questionnaire
Please answer the following questions based upon your overall experience in the experiment you just completed.
1. Rate the readability of the readout area when using the
Integrated and Perceptual-Spatial TODDS. Extremely
Low 123456789�
Extremely
High
Comments:
____________________________________________________________________________________
____________________________________________________________________________________
____________________________________________________________________________________
2. Rate the readability of the weather information box when using
the Integrated and Perceptual-Spatial TODDS. Extremely
Low 123456789�
Extremely
High
Comments:
____________________________________________________________________________________
____________________________________________________________________________________
____________________________________________________________________________________
3. Rate the readability of the flight data elements when using the
Integrated TODDS. Extremely
Low 123456789�
Extremely
High
Comments:
____________________________________________________________________________________
____________________________________________________________________________________
____________________________________________________________________________________
4. Rate the readability of the data blocks when using the Integrated
TODDS. Extremely
Low 123456789�
Extremely
High
Comments:
____________________________________________________________________________________
____________________________________________________________________________________
____________________________________________________________________________________

F-2
5. Rate the overall effort needed to use the touchscreen when using
the Integrated TODDS. Extremely
Low 123456789�
Extremely
High
Comments:
____________________________________________________________________________________
____________________________________________________________________________________
____________________________________________________________________________________
6. What effect do you think the Integrated TODDS will have on your
ability to control traffic in the tower? Negative
Effect
123456789
|
None
Positive
Effect
Comments:
____________________________________________________________________________________
____________________________________________________________________________________
____________________________________________________________________________________
7. What is the greatest benefit(s) of the Integrated TODDS?
____________________________________________________________________________________
____________________________________________________________________________________
____________________________________________________________________________________
____________________________________________________________________________________
8. What is the biggest problem(s) with the Integrated TODDS?
____________________________________________________________________________________
____________________________________________________________________________________
____________________________________________________________________________________
____________________________________________________________________________________

F-3
9. In order of preference, what additional features would you desire for the Integrated TODDS?
____________________________________________________________________________________
____________________________________________________________________________________
____________________________________________________________________________________
____________________________________________________________________________________
____________________________________________________________________________________
10. Do you have any additional comments regarding the Integrated TODDS?
_________________________________________________________________________________
_________________________________________________________________________________
_________________________________________________________________________________
_________________________________________________________________________________
_________________________________________________________________________________

F-4
11. Rate the readability of the flight data elements when using the
Perceptual-Spatial TODDS. Extremely
Low 123456789�
Extremely
High
Comments:
____________________________________________________________________________________
____________________________________________________________________________________
____________________________________________________________________________________
12. Rate the overall effort needed to use the touchscreen when
using the Perceptual-Spatial TODDS. Extremely
Low 123456789�
Extremely
High
Comments:
____________________________________________________________________________________
____________________________________________________________________________________
____________________________________________________________________________________
13. What effect do you think the Perceptual-Spatial TODDS will have
on your ability to control traffic in the tower? Negative
Effect
123456789
|
None
Positive
Effect
Comments:
____________________________________________________________________________________
____________________________________________________________________________________
____________________________________________________________________________________
14. What is the greatest benefit(s) of the Perceptual-Spatial TODDS?
____________________________________________________________________________________
____________________________________________________________________________________
____________________________________________________________________________________
____________________________________________________________________________________
____________________________________________________________________________________

F-5
15. What is the biggest problem(s) with the Perceptual-Spatial TODDS?
____________________________________________________________________________________
____________________________________________________________________________________
____________________________________________________________________________________
____________________________________________________________________________________
____________________________________________________________________________________
16. In order of preference, what additional features would you desire for the Perceptual-Spatial TODDS?
____________________________________________________________________________________
____________________________________________________________________________________
____________________________________________________________________________________
____________________________________________________________________________________
____________________________________________________________________________________
17. Do you have any additional comments regarding the Perceptual-Spatial TODDS?
____________________________________________________________________________________
____________________________________________________________________________________
____________________________________________________________________________________
____________________________________________________________________________________
____________________________________________________________________________________

Appendix G
Justification for Repeated Measures ANOVA Procedure

G-1
Experimenters often use a repeated measures design to control, and thereby reduce, the error
variability in the data due to differences between participants. Too much error variability may
prevent the researcher from detecting significant effects of experimental conditions (treatments).
However, we must consider some special statistical assumptions when analyzing data from a
repeated measures design. In a repeated measures design, the experimenter has set up the
conditions such that participants in certain parts of the experiment are more alike than
participants in other parts of the experiment. For example, participants who have expertise in
one technical specialty are more similar to one another than to participants in a different
technical specialty. Therefore, given repeated measurements, there is a correlation between the
scores of participants in the same group (i.e., similar technical specialty and area-specific
knowledge). The correlation of scores among participants also results in dependencies among
experimental conditions.
Researchers initially justified the use of the F test in a repeated measures design by assuming
that the condition of compound symmetry exists across conditions or participants. However, for
the condition of compound symmetry to be met, each treatment must have the same true variance
over all conditions (pooled within-group), and the covariance (across participants) for each pair
of treatments must be a constant. Although the assumption of compound symmetry is sufficient
to justify the use of the F test1 in a repeated measures design, it is not a necessary condition. In
fact, the compound symmetry assumption is very strict and not likely to hold true, especially in
experiments using a repeated measures design. The compound symmetry assumption does not
have to be met to justify use of the F test. Huynh and Feldt (1970) and Rouanet and Lepine
(1970), among others, have shown that the circularity assumption (or sphericity assumption),
which is both mathematically necessary and sufficient, can be made to support the use of the F
test in repeated measures designs. The circularity assumption simply states that the components
of the within-subjects model are orthogonal (independent) components. For more information
on the assumptions associated with repeated measures designs, refer to Hays (1988) and Kirk
(1982).
One way to ensure that the statistical assumptions associated with a repeated measures design are
satisfied is to analyze the data using the multivariate analysis of variance (MANOVA) method.
In the MANOVA method, the different scores from each participant are handled as if they are
actually scores from different variables. This method alleviates the necessity of the assumptions
associated with the analysis of variance (ANOVA) F test. Significant MANOVA effects are
then tested further by ANOVA F tests and particular post hoc comparisons. However, the
MANOVA approach may not be feasible for small sample designs where degrees of freedom are
insufficient.
Another way to analyze data from a repeated measures design while accounting for the
circularity assumption is to implement a three-step testing method, as suggested by Hays (1988)
and Kirk (1982). In this method, the data is first analyzed by an ANOVA. If the result is not
significant, then the analysis stops − and the researcher must conclude that there is no effect of
the independent variables in question. If the ANOVA is significant, then the Geisser-
Greenhouse (G-G) F test (or conservative F test) is conducted (Geisser & Greenhouse, 1958).
1 The F test is justified (i.e., valid) when the reported F values adhere to the F distribution.
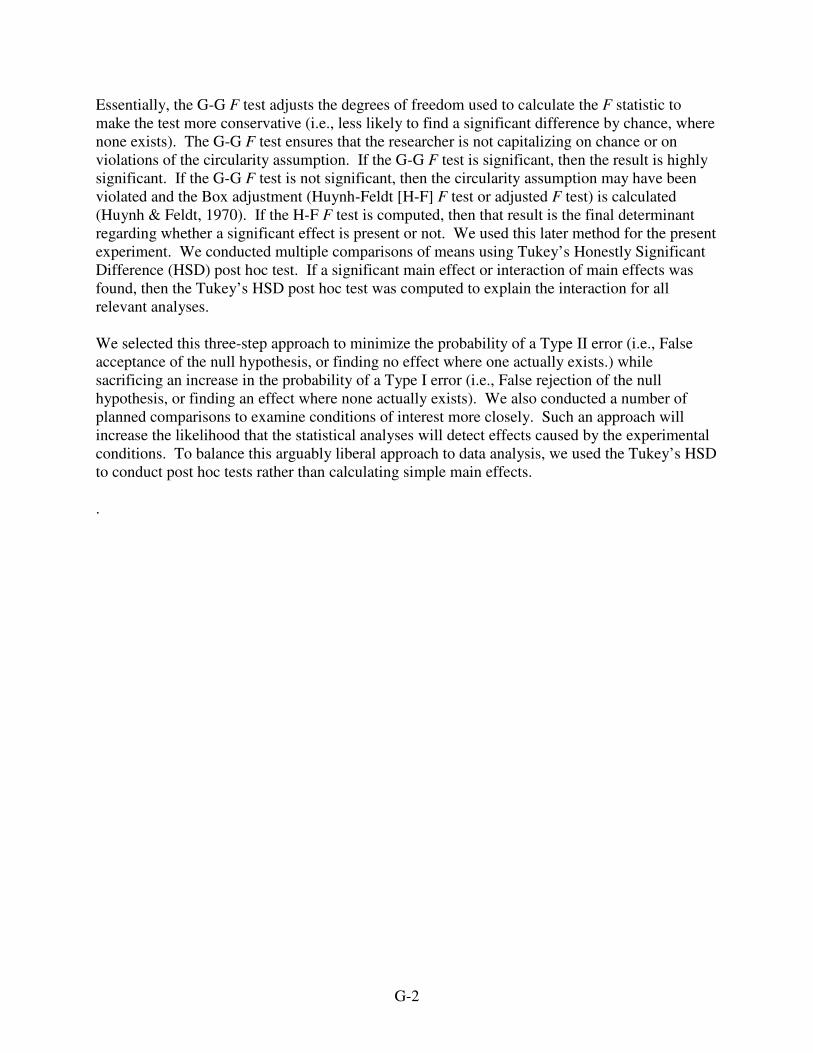
G-2
Essentially, the G-G F test adjusts the degrees of freedom used to calculate the F statistic to
make the test more conservative (i.e., less likely to find a significant difference by chance, where
none exists). The G-G F test ensures that the researcher is not capitalizing on chance or on
violations of the circularity assumption. If the G-G F test is significant, then the result is highly
significant. If the G-G F test is not significant, then the circularity assumption may have been
violated and the Box adjustment (Huynh-Feldt [H-F] F test or adjusted F test) is calculated
(Huynh & Feldt, 1970). If the H-F F test is computed, then that result is the final determinant
regarding whether a significant effect is present or not. We used this later method for the present
experiment. We conducted multiple comparisons of means using Tukey’s Honestly Significant
Difference (HSD) post hoc test. If a significant main effect or interaction of main effects was
found, then the Tukey’s HSD post hoc test was computed to explain the interaction for all
relevant analyses.
We selected this three-step approach to minimize the probability of a Type II error (i.e., False
acceptance of the null hypothesis, or finding no effect where one actually exists.) while
sacrificing an increase in the probability of a Type I error (i.e., False rejection of the null
hypothesis, or finding an effect where none actually exists). We also conducted a number of
planned comparisons to examine conditions of interest more closely. Such an approach will
increase the likelihood that the statistical analyses will detect effects caused by the experimental
conditions. To balance this arguably liberal approach to data analysis, we used the Tukey’s HSD
to conduct post hoc tests rather than calculating simple main effects.
.

Appendix H
Participants’ Responses for the Post-Scenario Questionnaire

H-1
PSQ Item 1 - Rate the effort needed to maintain flight data during this scenario.
Ground – Integrated TODDS
• I find it very easy to manipulate the data.
• Although not completely effortless, maintaining flight data was quite simple from the GC
perspective.
• Electronic - Easy.
Local – Integrated TODDS
• A lot of work involved in shipping the tags to other controllers
• Too many data tags overlap hard to determine without moving data tag
• It was very easy to maintain flight data awareness once I figured out a routine.
Developing a routine was relatively simple because everything (FDE) was the same for
every aircraft.
• A lot of effort to keep the data readable.
• It was a little difficult to see who was who holding short of the 2 runways - tags
overlapping and changing position.
• The data blocks got jumbled up at the ends of the runway. It was difficult at times to
figure out who was next.
• On local control it was intuitive and very nice to be able to move the tags around.
• Effort has to be made to separate the leader lines of targets. This can take attention away
from the operation.
• The requirement to progress departures and arrivals hinders the controllers’ ability to
scan the control environment effectively.
• Runway bay header in departure list necessary.
• TRACON button needs to be relocated or add another somewhere else near departure end
of runways.
• No problems with the data displayed, easily accessible.
Ground – FPS + ASDE-X
• Flight data was easily obtained.
• Moving strips into sequence is quite easy.
• Offsetting data blocks re runway 27 33L helped local but was very work intensive for
ground control.
• Strips/strip marking - No problem.
Local – FPS + ASDE-X
• A lot of strip management involved
• The equip being far apart, looking from one side to the other
• Knowledge of proven methods for sequencing and crossing aircraft would have made
maintaining data easier. Too much attention was given to moving aircraft, which made
looking at strips cumbersome.
• The strips are what I'm use to. Pretty much straight forward.
• Moving the strips to sequence takes time but since I do that at my current facility it seems
easier at this point.

H-2
• Working with strips is helpful; however the touch button has benefits.
• Strip board management came into play. I tried a little different from the practice and I
think it helped.
Ground – Perceptual Spatial TODDS
• A lot to keep up on with having to move data blocks with transmissions
• There was a lot of shuffling flight data around.
• Takes some getting used to but overall the digital taxi clearance is great for ground
control. Saves time and frequency congestion is low.
• The right side becomes cluttered with info. Should be a way to separate the arrivals and
the overflow departure lineup. Also 33R arrivals overlap aircraft on taxiway E. Still
very manageable.
• Flight progress strips are much easier to move around your position and to pick up as
opposed to the screen which takes a lot of getting used to.
• Hardly any effort for the ground controller. Digital clearances make it easy.
Local – Perceptual Spatial TODDS
• Very hard to keep track of moving boxes
• It take a lot to work a system to organize yourself
• Not as high as the strips. If I have no ground radar, I'll take the digital data (strips).
• Too much moving and tapping for me!
• The way the lists are set up didn't work very well for this level of traffic.
• Take some effort to keep up the flight progress strips as you need lots of position reports
with no ground radar or windows to see.
• Using the buttons takes time to get used to. However it is very user friendly once you get
familiar with the program.
• Moving the arrivals away from the arrival list is needed to keep track of them.
• Runway drop list on D-BRITE would be helpful.
• Not much effort at all - Once a technique is established (where you want to stack aircraft
info), it would be very easy.
Ground – FPS
• You had to dig through the strips to find anything.
• There is a concerted effort without an ASDE to monitor progress but I'm familiar with
this operation.
• Awareness of where aircraft are parked and where they are going is vital for this
operation.
• The flight data at ground control is very easy to obtain.
• Complete lack of automation forces every position to maintain a greater workload and
memory store.
• Regular strip marking - Just a couple memory joggers and it was easy.
• Not much of a problem - Jotting down the inbound or outbound spot is about it.
Local – FPS
• Strip marking and board management is huge
H-3
• Several extra transmissions
• I pretty much can tell who they are just don't know where the strips are.
• It was very hard to find a way to organize the strips - data was available however.
• All I needed to do was move the strips so it was not too hard.
• Knowing who is who and where they are going is the key to success during this problem.
If you loose track of the flight data, it is hard to get the picture back.
• The data was readily available. The ability to use it was very difficult due to lack of
position information.
• Extremely important, extra pair of eyes and ears are always needed. Local control and
ground control would be unable and/or extremely difficult to answer any questions that
may arise associated with weather and flight route.
• Not comfortable with my own strip board management. I would adjust something, I don't
know what, but I think the strips could be helpful with a better system.
PSQ Item 2 - Rate your ability to find necessary flight information during this scenario.
Ground – Integrated TODDS
• What I needed was there, anything extra I would have to use IDS4.
• Just learning where to look for what.
• Everything is readily available and the ATIS code is also highlighted making those
updates easily viewable.
• All available info good. No spot numbers for position correlation - only drawback (spots
3 and 4).
• Electronic flight data list is great but not as easy to use when sending D-taxi info because
of its separate location.
• Click and look.
Local – Integrated TODDS
• When sending aircraft to departure it is very hard to find them in the list
• There were a few flights that did not exist
• A bit tough to get the correct aircraft in departure list.
• See comment # 1 [It was a little difficult to see who was who holding short of the 2
runways - tags overlapping and changing position.] - everything else was just getting
used to what was to be done.
• See question 1. [The data blocks got jumbled up at the ends of the runway. It was
difficult at times to figure out who was next.]
• ASDE-X shows good info. I used the tags on the display more than in the list but I still
like having the proposal list to show if I'm behind on sending info.
• The one down-side is not being able to scroll down on the departure list. If you miss
highlighting the aircraft while on screen, it becomes difficult to locate aircraft to switch
to departure.
• It was difficult to see data tags to tell which aircraft were number one to cross.
• Click and look - Easy.
Ground – FPS + ASDE-X

H-4
• Flight information was obtained with very little effort using the ASDE-X.
• All information was readily available.
• Using strips, no real problem.
Local – FPS + ASDE-X
• Targets overlapping and try to look at two different screens and 2 different set of strips
• Aircraft information was in a familiar format.
• It was hard to see who was who holding short of the 2 runways of the overlapping tags.
If the leader lines could be split for different dep. fixes it would help.
• Arrival and departure information was extremely easy to find.
• It was easier to track what I had, clearing to land, or whether I was talking to them, based
on the strips.
Ground – Perceptual Spatial TODDS
• The floating tags are easy for ground control to utilize and place on the map for
reminders. Very nice system for ground control.
• Everything we need is easily presented.
• I never really needed to find flight information.
• Digital info - Very easy.
Local - Perceptual Spatial TODDS
• You need to constantly use reminders to organize
• The digital strips are right there in front of me, easy to manipulate.
• I guess it was there - it was hard for me to find.
• The screen can get very cluttered.
• Flight info is readily available.
• A lot of information to grasp and be aware of. This is the second run and the comfort
level is going up.
• Once aircraft is given departure clearance and moved to departure list aircraft is no longer
orange and does not stand out. This orange data block is replaced by small clock. Does
not deal with crossing runway conflicts.
• Clicking the aircraft on the TODDS gives everything you might want to know.
Ground – FPS
• Outbound aircraft no problem, inbounds had to be written down.
• Info was easily accessible and all information was presented to us.
• Only through intensive monitoring and constant position report, is one able to maintain
accurate flight information.
• It's on the strip - no problem.
Local - FPS
• Need to keep caught up and really have the picture
• On the strips or brite.
• Finding it was no problem.
• I had to remember too much and that made it distracting.

H-5
• Everything that is needed is on the flight strips.
• The information was right in front of me.
• Took about four problems to find a system that works.
• Only through thorough search.
• The strips are there.
PSQ Item 3 - Rate your ability to find necessary weather information during this scenario.
Ground – Integrated TODDS
• Different color text
• I have not observed the ATIS code flash during any scenario. I also did not notice the
square appear on the FDE when ATIS changes.
• The basics are there, wind and altimeter setting. Having the last weather sequence would
be helpful.
• With the IDS system most weather information was not available to the controllers with
the exception of the RVRs and the ATIS. It's very important to have the weather updates.
• Only ATIS code available
• It would be nice if there was some kind of alert for the controller that there was new
weather.
• Status area.
Local – Integrated TODDS
• Weather info should be in a different color text
• Again wind/altimeter is there. Weather sequence would be nice.
• No IDS 5 info for weather.
• Status area displayed - No problem.
Ground – FPS + ASDE-X
• IDS works great.
• Easily available on the IDS 5.
• Display is not in scan, doesn't stand out.
• On the status area - Easy to see.
Local – FPS + ASDE-X
• Not familiar with SIA layout.
• The IDS area is easy to use for weather information.
• Never thought about it. Too busy.
• Ability is there, information wasn't.
• On the information board - Very accessible.
Ground – Perceptual Spatial TODDS
• Most of the weather info not available although some limited info is available.
• The ATIS code box is wonderful.
• I do not believe there was any weather information.

H-6
• Becoming more familiar and comfortable with weather presentation area.
• The system area can be placed where you like it. No reason for it to not be easy.
Local - Perceptual Spatial TODDS
• No substitute for IDS-4 and weather readout.
• Wind was easy to find.
• Without the IDS 5 weather info seems non existent.
• It is there and the ATIS box helps to alert the controller to a change in weather.
• There is very little weather information displayed.
• No need.
• Needs to stand out more. Either color of larger alphanumerics.
• Familiar with searching the IDS for weather information. Not available. New placement
of weather information caused increased search time.
• Knowing where you place your system area information requires only a quick glance.
Ground – FPS
• IDS 5 displayed all weather.
• The weather info is available. Concentrating on the problem at first you do not look for
weather. However as the problem progresses and you become comfortable, you will
observe all data in you scan.
• Access to IDS information was immediately available and apparently current.
• On the information system.
Local - FPS
• IDS-4 is great.
• It was available, however did not have time to look at it.
• The weather was right in front of me, but when I looked for it I didn't see it because I was
too busy keeping a mental picture of my traffic.
• Too busy to look away from D-BRITE/strips.
• IDS weather information readily available.
• Easy to look at the information system.
PSQ Item 4 - Rate the effort needed to issue taxi clearances during this scenario.
Ground – Integrated TODDS
• I love resume taxi.
• Excellent - no effort required.
• The pre-taxi clearance is a very useful tool.
• Taxiing aircraft using the digital taxi is very user friendly and a nice feature to have. It
saves a lot of time and phraseology.
Local – Integrated TODDS
• Only runway crossings fairly easy.
• Same issue as #1.

H-7
• Easy to find the aircraft call signs on the map.
• Contract ground when clear - displayed on scope, easy to judge when to talk to the pilot.
Ground – FPS + ASDE-X
• Taxi instructions had to be issued but they were no real trouble.
• ASDE-X made this task very easy to complete.
• Some overload here with catching "hold short" read backs.
• Standard taxi routes.
• No problems.
Local – FPS + ASDE-X
• Not a problem
• I just needed to cross runways with the ASDE it was easy.
• There is some effort needed after crossing the runway but with the taxi routes already set
it was minimal.
• One aircraft assigned wrong runway.
• There is a delay from the time an arrival leaves the BRITE and then appears on the
ASDE. This delay causes second guessing when wanting to cross a runway.
• Overlapping data blocks on E/J [taxiways] required attention.
• Crossing the intersections or switching to ground, not a real problem.
Ground – Perceptual Spatial TODDS
• Very easy using pre-taxi clearances.
• Digital taxi instructions make ground a breeze to work.
• The "resume taxi" is a great tool. It cuts controller and pilot communications.
• Taxi clearances are delayed while I had to find out where everyone else was.
• During this scenario the traffic volume was unrealistic given the loss of surface detection
equipment and feeding two runways for arrivals and departures.
• D-Taxi sending was easy but constant position reports required keeping aircraft on
departure spots as we waited for aircraft further away to report.
• Digital - The way to go.
Local – Perceptual Spatial TODDS
• Have to keep track of where each aircraft is
• Too many buttons to push and drag
• Takes some extra thinking before crossing the runways without ground radar or windows.
• Numerous communication of position reports.
• Many position reports needed.
• Most aircraft need multiple position clear reports.
• No surface surveillance forced increased workload.
• Taxiing off the runway and switching to ground was easy, only complexity was getting
reports in zero-zero conditions.
Ground – FPS
• Had to rely on strip management and position reports

H-8
• The position reports add to work load and communications.
• There was too much talking.
• Lots of effort needed by both pilots reporting points, keeping track of progress, and
ability to keep the departure aircraft in sequence.
• The routes have become standard. The practice scenario helped to become familiar with
the layout.
• To issue a taxi clearance I had to ask multiple aircraft for position reports.
• Strip marking is essential with multiple position reports. Constant update from pilots are
necessary as they miss crossing reports.
• Again, only through extreme vigilance and constant position verification is one able to
provide for the safe movement of ground traffic.
• Even though I may have made it look easy, it was an extremely difficult effort.
• With just a few minor pilot reports the standard taxi clearances were very simple and
easy to use.
• Issuing is easy - Remembering the hold shorts before moving an aircraft (make sure of)
position of inbound aircraft.
Local – FPS
• Have to keep crossings and landing aircraft controlled at all times.
• To taxi an aircraft across a runway to get him ready for departure was very difficult and
mentally time consuming.
• Need crossing report from every departure and arrival.
• Constant confirmation of position reports.
• An extremely high level of difficulty is associated with any procedure that is not visible
from the tower.
• Not bad. Normal instruction is all that is necessary.
PSQ Item 5 - Rate your ability to detect aircraft on the runway during this scenario.
Ground – Integrated TODDS
• The changing of colors is very helpful
• Very easy to see the position of aircraft.
• The color change makes this very easy.
• Due to the change in color it was easy to see who is on the runways.
• Just a glance of the scope.
Local – Integrated TODDS
• Again, color change is very nice
• I can see where they all are.
• I didn't like that aircraft on the 22's turned color - it brought my attention to something I
didn't care about and away from the operation.
• No problems here.
• Very nice color display for aircraft on runways.
• The different colors help.

H-9
• Displayed - Very easy.
Ground – FPS + ASDE-X
• ASDE-X shows excellent displays for position verification.
• Easy with the surveillance mode.
Local – FPS + ASDE-X
• ASDE-X made this task easy.
• The ASDE-X provides excellent position information along with callsigns available.
• The ASDE is a great tool!
• It's a matter of looking at the scope - not a real problem.
Ground – Perceptual Spatial TODDS
• Only the position reports, can't use data blocks because they clog the display on taxiway.
• I had no idea if someone was on the runway.
• Other than pilot reports there was no way to detect aircraft on the runways.
• Unable to scan any runway.
• The surface detection equipment was lost.
• Ground control does not know arrival is rolling out/runway occupied.
• Completely reliant on pilot position reports.
• Not too good - Only though pilot reports.
Local – Perceptual Spatial TODDS
• Use reminders to keep track
• Not there
• Better than strips, obviously not as good as ground radar.
• No good way to keep traffic at all.
• There is no way.
• No way to tell other than position reports that may or may not be reliable.
• It would be good to have the arrivals change color or auto drop to the ground menu when
they land.
• Unless he tells you he is on the runway you do not know.
• Departure aircraft and arrival aircraft have no real way of being indicated near the active
runway.
• Completely reliant on pilot position reports.
• Much harder to anticipate because so many other things to think about.
• Actual location of aircraft is very difficult without constant update reports.
Ground – FPS
• Not a big concern to GC [ground control] but it would take a pilot report of not able to
clear or something of the sort.
• There was none.
• I could not see any aircraft nor did I have a display to detect aircraft on the runway.
• N/A
• Only way to tell is to ask the pilot his position.

H-10
• Ground has none.
• With no surface detection equipment, one must rely entirely on pilot reports.
• Very difficult to tell what local control had going on without ASDE.
• Only pilot reports.
Local – FPS
• As long as strips were kept up to date its possible
• Very difficult to keep track of the runways.
• I just had to remember the runway was being used.
• Keeping ahead of the scenario is key.
• Other than asking the pilot, I had no idea where a landing aircraft was.
• One miss placed strip and it's all over.
• Not very good, only pilot reports and knowing they may be somewhere on the runway.
PSQ Item 6 - Rate your awareness for current aircraft locations during this scenario.
Ground – Integrated TODDS
• Everything is right in front of me.
• Aircraft were very easy to keep track of.
• Because of the ASDE-X it was very easy to locate the aircraft both arriving and departing
as well as taxing aircraft.
• There is a constant congestion of tags where aircraft are lined up to depart. I took most
tags out of the auto offset mode which led to this. With auto offset, the constant shifting
of tags is distracting.
• Seem to be 100% accurate - No problems.
Local – Integrated TODDS
• Aircraft do bunch up but you can easily move the targets
• Display doesn't lie.
• See # 1 [It was a little difficult to see who was who holding short of the 2 runways - tags
overlapping and changing position.]
• Excluding the data block aircraft position was easy to obtain.
• Still a bit foggy on knowing the airport layout and crossing runways I'm not familiar with
but the AIRCRAFT locations on the ASDE-X are very informative.
• Need more room short final on ASDE. Tag drops from D-BRITE but not visible on
ASDE for several seconds.
• Very good except the "unknown zone" between STARS and ASDE.
• Check the scope.
Ground – FPS + ASDE-X
• After the second day, working ground control was easy and awareness was high.
• With strips and ASDE, it was easy.
Local – FPS + ASDE-X
• Except the aircraft 1 mile to the runway. They disappear for several seconds
H-11
• See # 2 [It was hard to see who was who holding short of the 2 runways of the
overlapping tags. If the leader lines could be split for different departure fixes it would
help.]
• Overall I was aware of the aircraft locations but had to send a couple aircraft around
because of not launching a departure in position.
• Kept aware of aircraft positions in regards to runway assignments due to communications
between pilot and controllers.
• The only problem is the BRITE to ASDE delay.
• Much better this time because of the strip board.
Ground – Perceptual Spatial TODDS
• With position reports coming its hard to know exactly where they are
• Pilot reports
• Data is helpful but pilot reports are required.
• I didn't know where anyone was unless I asked them.
• Pilot reporting points were necessary but not always reliable if pilots miss the call or turn
the wrong way and don't report in.
• The scenario allowed me to stay ahead of the game.
• I only know where I told them to go until I ask them for a position. Then I do not know
if they are stationary or not.
• You had to get positions due to no surface equipment.
• Transfer of data block is dependent on local control/ground control. Where he thinks
data block is not necessarily where aircraft is.
• Again, through pilot reports.
• Not sure where arrival aircraft were so was not able to anticipate when would be a good
time to coordinate a runway crossing.
• Easy to keep the line up - The only hard part is the pilot reports for their exact location.
Local – Perceptual Spatial TODDS
• Must use reminders
• Pilot reports only
• See #5 [Better than strips, obviously not as good as ground radar.]
• I found it very hard to keep track of aircraft using the runways.
• If the pilots report when they are asked to it would be a tiny bit better maybe a 3.
• My overall awareness was questionable due to no position verification by sight or ground
radar.
• Everything is a position report.
• Without pilot reports you have no way of knowing.
• Number one aircraft data block on "E" [taxiway] led me to believe aircraft was at runway
ready to cross and he wasn't.
• STARS display assisted airborne. Electronic flight data assisted on ground based targets.
Still reliant on pilot position reports.
• Harder to keep track of if you forget to move data tags.
• Using the TODDS made it a little easier. Knowing the aircraft waiting to cross, on final,
etc. was OK.

H-12
Ground – FPS
• Strip management
• Takes a little work.
• If I needed to know where an aircraft was I had to ask the pilot.
• Awareness maintained but many position reports.
• I kept up with aircraft location with reporting points.
• Constant update cause frequency congestion.
• Only available through constant monitoring of pilot position reports.
• Easy to anticipate knowing spot numbers.
• I felt I had a pretty good mental picture, strip marking helps.
Local – FPS
• Had to remember what was going on.
• Aircraft taxiing out were kept in line for a while, but they always got mixed up with other
runway departures.
• No surface detection equipment.
• Definitely aware of position with numerous reporting points.
• Should have a pretty good idea, reference STARS and strips, but pilot reports are critical.
PSQ Item 7 - Rate your awareness for projected aircraft locations during this scenario.
Ground – Integrated TODDS
• The tags jumping around are a bit distracting - but overall no real problem.
• Implementing a ground speed read out could make this an easier task.
• ASDE-X provided good accurate information. The digital taxi list shows the pre canned
taxi routes making this a valuable asset to the ground controller.
• Looking at the scope you can determine rate of speed and what might be a factor.
Local – Integrated TODDS
• Aircraft need to appear on final
• Good overall info on the runway they are taxiing to.
• Ditto as above.
• Watching the pace it easy, you can see the movement of all aircraft.
Ground – FPS + ASDE-X
• Good position verification via the ASDE-X.
• You can see the taxi speeds and judge.
Local – FPS + ASDE-X
• Short final
• It's hard to time the transition between the arrival dropping of the TDW and acquiring on
the local ground display.
• Aircraft on the ground was easy, but aircraft in the air transferring from the STARS to the
ASDE was a problem there was a delay.
H-13
• Overall, very good, lots of computer generated info available. Also, departure runway
was marked on the flight progress strips while holding short.
Ground – Perceptual Spatial TODDS
• Awaiting position reports, you know where they are going to be eventually
• See # 6 [Data is helpful but pilot reports are required.]
• See Q(6) [Data is helpful but pilot reports are required.]
• You had to project where aircraft were going to conflict.
• Based on spot locations and arrival aircraft on taxiways you could somewhat anticipant
locations/taxi speed of aircraft.
• You can guess, but again, pilot reports are mandatory.
Local – Perceptual Spatial TODDS
• See #5 [Better than strips, obviously not as good as ground radar.]
• See # 6 [I found it very hard to keep track of aircraft using the runways.]
• None.
• Again low due to no line of sight or ground radar.
• You can't project at all in this scenario.
• Continuously "lost" aircraft exiting the runway.
• Hard. Didn't feel comfortable crossing or clearing aircraft for take off even if aircraft
should have been well through intersection without report.
• Again - only with constant pilot reports would this be easy.
Ground – FPS
• There was no way for me to do this.
• Other than reporting points, you cannot project where aircraft will go and if they turn on
the wrong taxiway or runway and don't report it then there was no way to tell.
• Getting a better handle on how they taxi and where they should be.
• Given an awareness of aircraft operation characteristics, one can anticipate projected
locations with confirmation coming through potion reporting points.
• Assuming normal taxi rates, leaving the ramp in a timely fashion and pilot reports.
Local – FPS
• Only a little better than 6.
• There was none.
• Still getting used to how the arrivals roll out.
• As one gets accustomed to the airport characteristics, one's timing improves for
projections.
• Better than the beginning.
• Same as above [Should have a pretty good idea, reference STARS and strips, but pilot
reports are critical.] You can think they should be somewhere, but no way to know for
sure.
PSQ Item 8 - Rate your awareness for potential runway incursions during this scenario.

H-14
Ground – Integrated TODDS
• Low from Ground
• My scan doesn't have to be as wide. I can scan the display faster than an airport.
• It was a very good presentation - very easy to spot potential conflictions.
• Because of the color changes when the aircraft cross runways it was easy to divert
attention to those aircraft to ensure there were no problems.
• If the pilot follows instructions, verbally or electronically, shouldn't be a problem, but
you never know when something can happen.
Local – Integrated TODDS
• Keeping organized so the tags do not bunch up. I found myself using the wrong call sign
until I started moving the tags
• Everything is "closer" together less scan area.
• ? The presentation was very good and allows me to project possible conflictions.
• Due to color it was easy to see this potential.
• Although things can always happen, you're watching the movement of aircraft, so it's
easy to see.
Ground – FPS + ASDE-X
• Safety logic would make this easier.
• Because of the equipment being used my awareness for possible incursions was high.
• In this session it is easier to be an extra set of eyes for local because workload is low in
this scenario (less button pushing).
• Anything can always happen, but if instructions are followed, potential is minimal.
Local – FPS + ASDE-X
• Sometimes a lot is going on and can be confusing
• Keeping organized while looking at several things
• Because of not working with this runway configuration on a regular basis, I felt a bit
behind the power curve.
• Did not see an aircraft who went into position accidentally on wrong runway…too
focused on other tasks.
• I can only give an average because I missed the pilot rolling when he should have held.
It could happen in the real world.
Ground – Perceptual Spatial TODDS
• Better than strips but not great.
• See Q(5) [I had no idea if someone was on the runway.]
• No way to tell other than pilot reported locations.
• Without an ability to scan the surface of the airport, I have no way to see a runway
incursion.
• "Canned" taxi instructions ensure hold short instructions – read backs irrelevant.
• Hard to keep track or hear what local control was doing while moving my own aircraft.
• My awareness of them is low, but the likelihood should be rare, since they have a digital
clearance, should be no reason for them to miss it.

H-15
Local – Perceptual Spatial TODDS
• Easily forget somebody
• I would not do this for real!
• It was very difficult.
• Potential for incursions is very intense with this scenario.
• No way to scan for runway incursions.
• Heightened awareness due to no surface surveillance.
• Very aware.
• You’re betting on the aircraft rolling through the intersection not good.
Ground – FPS
• Very hard to detect or spot a confliction.
• I had no way to know on ground if there was a problem.
• Once again relying on reporting points makes potential incursions more susceptible due
to human error factors.
• N/A
• Unable to scan the runway.
• Zero safety equipment available.
• No time to keep track of arrivals on runway.
• The awareness is high for potential, like knowing when you cross an active, but pilot
reports are the only way to ensure clear.
Local – FPS
• Without going at an absolute crawl (1 for 1) there is a lot of luck involved - not good.
• This was hard to do.
• Safety first then moving the traffic.
• Since I could not see the runways or a radar display of the airport, I do not have any way
to scan the airfield.
• The awareness is there for potential, preventing them is another thing.
PSQ Item 9 - Rate your awareness of the overall traffic situation during this scenario.
Ground – Integrated TODDS
• No surprises.
• The display is very good.
• Excellent display of ASDE-X to provide aircraft locations.
• Final traffic hard to see due to location of STARS.
Local – Integrated TODDS
• PTL line on arrivals [on STARS TDW] obscured distance from runway. Once line
deleted things were better.
• I think!
• Overall good awareness but still working on being familiar (comfortable) with a new
airport.
H-16
• All data displayed.
Ground – FPS + ASDE-X
• With the ASDE-X there were no problems at all.
• No problems.
Local – FPS + ASDE-X
• A little confusion but with strip management and ASDE pretty easy to keep up
• As long as you kept a system but it was easy to lose your system
• The only issue was answered in Question 7 [Aircraft on the ground was easy, but aircraft
in the air transferring from the STARS to the ASDE was a problem there was a delay.]
• Still a bit uneasy as to using a new runway configuration but fairly aware of the situation.
• Movement of strips departures vs. arrivals helped, but took a lot to scan all three
ASDE/strips/D-BRITE.
• I felt more comfortable tracking the aircraft than in the practice.
Ground – Perceptual Spatial TODDS
• I didn't really know where anyone was unless I asked.
• If all reports were accurate then awareness was high but no way to verify this.
• Need to do better job of knowing what local has going on.
• I felt very comfortable progressing the aircraft.
Local – Perceptual Spatial TODDS
• You have to keep a system with no distractions, very difficult
• Using the data blocks gives me a visual of where they were last. Better than strips.
• The TODDS took a lot of time to work with the data blocks. Also very difficult figuring
out where the aircraft should be from the STARS to the TODDS when the map can't be
rotated.
• I slowed the traffic flow down to maintain a better awareness but the taxi times became
more than 30 minutes.
• I believe I may have had a handle on the traffic, but traffic would move much slower in a
real environment.
Ground – FPS
• Fairly easy for ground.
• You just had to react to what was going on. You couldn't be proactive at all.
• Good awareness because of good reports but no way to verify.
• After the first practice run, the picture is a lot clearer and able to keep up with the traffic
flow.
• Once an aircraft is sent to local I have no way to determine where he is since local is too
busy to coordinate with.
• Heightened awareness, reduced ability to confirm pilot actions.
• I thought it went well.
Local – FPS
• Must keep everything up to date
H-17
• I only have half the picture. Can't see airport surface.
• On the ground this was a difficult task.
• Kept ahead of the game. Doing so from the beginning of the scenario is important.
• I had a general idea of where everyone was, but no way to effectively separate aircraft
and still have an ability to move aircraft.
• Not as comfortable as on ground in the same equipment scenario.
PSQ Item 10 - Rate your workload due to controller-pilot communication during this
scenario.
Ground – Integrated TODDS
• Sometimes they miss the calls and you have to say it again
• Pre-taxi clearance reduces the communication needed to take place while reducing
chance of error.
• Because of the digital taxi instructions, workload was extremely low.
• Simple instructions - Very easy.
Local – Integrated TODDS
• Had to say transmissions over many times
• Pilots were unaware of what I was trying to do at times, then slow to react
• Average.
• No problem with frequency congestion.
• Normal communication, a little high only because of volume of transmissions.
Ground – FPS + ASDE-X
• Pilots were quite responsive which made communications easy.
• Workload based on volume, seemed easy.
Local – FPS + ASDE-X
• You need to talk nonstop to be effective
• Some pilots missed instructions but overall fairly low workload.
• Normal for the volume.
Ground – Perceptual Spatial TODDS
• Again position reports make extra work.
• The pre-taxi helped out with controller-pilot communications.
• Due to digital taxi instructions very nice.
• Automation was very helpful.
• Data comm. eliminates much communication necessity.
• D-clearance helped reduce verbiage while getting pilot reports.
• Only because it was busy did I keep them on my frequency, but the workload was not
bad.
Local – Perceptual Spatial TODDS
• Making an extra 2 transmissions

H-18
• Due to position reports, it on the high side.
• Very high! You have to rely on a pilot to give a reporting point that they don't always do,
so extra transmissions need to be made.
• I spent a lot of time verifying that the runway was clear and not enough time being
productive, i.e., launching departures, crossing arrivals who ran out of gas, etc.
• A lot of communication, however it is still basic air traffic procedures. Nothing really
changed.
• Again, pilot reports for everything, frequency congestion.
Ground – FPS
• A great deal of additional comms.
• Too much communication took place.
• Very high as there is lots of congestions on frequency.
• A lot of verifying information, reporting and numerous requests/information needed from
the pilots.
• Total lack of automation necessitated verbal affirmation of all movements.
• Normal.
Local – FPS
• Extra transmissions were needed
• Again position reports increase work load.
• Good pilot reports are a requirement.
• Too much communication took place.
• Constant position reports.
• Higher only because of pilot reports.
PSQ Item 11 - Rate your overall workload during this scenario.
Ground – Integrated TODDS
• This scenario runs pretty smoothly on Ground with all the data available
• Little effort was needed.
• Same as 10 [Because of the digital taxi instructions, workload was extremely low.]
except the moving of flight progress strips. Although being able to use the list or touch
the aircraft to do your work was invaluable.
• Outside of a few functions, it seemed very easy to handle any traffic.
Local – Integrated TODDS
• It is just a busy scenario
• Pressing "buttons" added to workload "tracon" "ground"
• This was very busy - the data helped when I got used to it and made it work for me.
• My workload still high only from unfamiliarity with airport. The digital displays were
excellent at helping to reduce workload. No physical strips to pass (very nice).
• Separating targets add to the workload.
• Volume.

H-19
• Busy, but not too difficult with the equipment available.
Ground – FPS + ASDE-X
• With strips and ASDE it is pretty easy on ground traffic keeps moving
• Ground control is probably my best position in ATC so my workload was light.
• Due to data tag offset.
• Again, no real work, only dealing with the volume.
Local – FPS + ASDE-X
• Things kept moving pretty good
• Crossing runways, crossing traffic, it’s a busy session.
• When I got into a rhythm workload was low.
• This is a complex runway configuration but still workable. This configuration is very
labor intensive.
• A lot of movement of strips vs. talking to aircraft.
• Runway crossing can be a lot of work and is distracting.
• Volume - A little extra because of the strip board.
Ground – Perceptual Spatial TODDS
• Ground was not too hard even without knowing where the aircraft was.
• Fairly low until traffic began to back up then it's a strip management situation with
limited space on the screen.
• Easy to sequence and keep in line without pilot reports, it could have been a [rating of] 1.
Local – Perceptual Spatial TODDS
• No way around it no ground radar, work load high.
• Very high with little ability to recover once picture got grey.
• I probably felt a lot busier than I really was.
Ground – FPS
• Moving constantly to keep up with traffic.
• A very nice mix of traffic.
• Ground control works hard asking pilots for position reports.
• Constant talking on frequency makes coordination between ground control/local control
difficult.
• No automation = higher workload.
• Seemed like a regular session without ASDE.
Local – FPS
• Very busy
• Complex, freq overload with extra transmissions. A lot of waiting for the pilots to report.
• If I'm trying to get aircraft across runways and airborne. Slowing down decreases
workload.
• Very nice traffic mix.
• This is a huge mental workload.
H-20
• So busy difficult to step away to double check/regroup.
• The concentration has to be higher.
PSQ Item 12 - Rate the safety of operations during this scenario.
Ground – Integrated TODDS
• Very safe.
• Overall provides a safe operation all around.
• Again, as long as pilots follow instructions, shouldn’t be any problems.
Local – Integrated TODDS
• Once you were use to the system, it would be a great tool
• Mostly due to unfamiliarity of intersecting runway operations.
• Low at beginning finish high.
• It seemed very good.
• Safe operations with the equipment should be extremely high as the information is
available to the user.
• Again, anything can happen, but I felt I could control the aircraft and keep safety high.
Ground – FPS + ASDE-X
• Safety was not compromised.
• As long as instruction are followed, very safe operation.
Local – FPS + ASDE-X
• Tough runway setup
• I felt behind but was happy with the safe execution of ATC instructions.
• The normal operations of intersecting runways was safe, right up until the guy rolled
when I was crossing.
Ground – Perceptual Spatial TODDS
• With no position verification then safety is compromised.
• Slow down the traffic is the only way you are going to achieve safety.
• Good concept incorporating the ability of moving aircraft (manually) over an airport
layout or map.
• Ground was much easier to maintain a high level of safety. Local appeared more difficult.
• I though it was good.
Local – Perceptual Spatial TODDS
• I felt a bit more safer with the data block. Something comforting about seeing data on the
surface even if I have to move them manually.
• Pilot reports were needed and without any radar or windows to verify their position,
safety is compromised.
• Keeping it simple is key. Trying to do too much is not a good idea. A few more scenarios
and the push buttons would become easier to work with.
• Without ground radar or the ability to scan, I am not used to the lack of information.

H-21
• I strive for safety, but could be missing something any where at any time - Slowing the
traffic down is probably the only way to increase safety.
Ground – FPS
• You just had to hope no one would make a mistake.
• Safety is questionable because of relying on pilot reports.
• Made sure to put safety over speed.
• If unable to scan, I am unable to see pilot or controller mistakes.
• Total reliance on pilot to comply.
• It could be higher, but you're dependent on the pilots adhering to the hold short
instructions.
Local – FPS
• This is a very unsafe operation!
• You have to slow the problem down to achieve any resemblance of safety.
• One aircraft doesn't report clear, or forgot to get an acknowledgement, and safety is
compromised.
PSQ Item 13 - Rate the effectiveness of coordination between the ground and local
positions during this scenario.
Ground – Integrated TODDS
• Able to communicate well with each other
• Just the crossing of the landers on 33R
• Almost none required.
• Little coordination needed to take place.
• Coordination was easy but the local controller was busy. Verbal communications. The
white or grey data blocks are very effective.
• I do not think we coordinated anything except for runway crossings.
• The crossings get done, just a matter of traffic.
Local – Integrated TODDS
• Very little required.
• Coordination with ground control was not needed as I crossed my own runways instead
of switching.
• No problem coordinating.
Ground – FPS + ASDE-X
• You have to wait for an opportunity to talk to local.
• Good coordination to cross runway 33L with 33R arrivals.
• I messed up and gave local an incorrect sequence causing him extra work.
• A few crossings, didn't seem to be a problem with surveillance equipment.
Local – FPS + ASDE-X
• Verbal coordination can be distracting at times.
H-22
• Ground didn't coordinate a lot but was very effective.
• Effective because of surveillance system.
Ground – Perceptual Spatial TODDS
• Very low as it relates to crossing GA aircraft between 33R and 33L (the PA31s).
• What little we had was effective.
• Local was too busy to even try and ask to cross a runway.
• Coordination was ineffective due to local control being so busy.
• Non existent.
• Both very busy with pilot reports. Coordination disrupts concentration.
• Very effective, just a little extra workload not knowing when the aircraft rolls out or
clears.
Local – Perceptual Spatial TODDS
• Not needed I cross my own runways.
• I didn't have time to deal with ground.
• Only somewhat effective due to workload.
• No problem. Click to transfer - Easy!
Ground – FPS
• Local has too much going on to talk to me unless absolutely necessary.
• Too much congestion on frequency for good coordination.
• We needed to do a better job of 33R crossings.
• Unable to coordinate with local control due to his heavy mental workload.
• Substantially reduced due to workload.
• Coordination is effective, meaning the request is made and understood, but timing
reference traffic could take extra time.
Local – FPS
• In this scenario basically non-existent.
• Ground had difficulty getting locals attention.
• Due to workload volume.
• Local and ground need to work better with runway crossings.
• Local control has no ability to coordinate because of his mental workload.
• Trying to get work in very difficult.
• Although I know there were opportunities to cross with ground, it was too distracting to
my concentration to un-focus until I was ready to cross myself.
• No problem, just finding the right gap to cross.
PSQ Item 14 - Do you have any additional comments or clarifications about your
experience during this scenario?
Ground – Integrated TODDS
• This is a good tool for Ground
H-23
• Not having to issue taxi instructions and verify read back of hold short instructions allows
more time to monitor aircraft movement.
• Local seemed very busy, ground was no trouble at all.
• Very nice setup just needs a way to expand the lists if needed or scroll to others.
• I do not understand why there was no weather information other than wind and altimeter.
Pilots ask for temperature and dew point every day. Also, controllers need to know cloud
height and visibility constantly.
• #1 Would be nice if auto offset resumed when control of tag is transferred to local
controller. #2 Data blocks on local moving cause a distraction and a lot of clutter for
ground. Would like to see data drop from ground at certain point.
• Seems very easy, if electronic clearances, including hold short, are useable.
Local – Integrated TODDS
• The pilots were slow to react to some of the commands
• I really like the ability to drag the FDEs around on display. I also liked the colors of
aircraft when moving or stopping on runway.
• Only thing to note - I grabbed the tags when I locked and loaded the runway. A couple
times they still jumped.
• Enjoyable compared to no surveillance.
Ground – FPS + ASDE-X
• This is very easy as a ground controller
• This is basically what we do now.
• Ground can be enjoyable, whether digital clearance or verbal. Having surveillance keeps
it enjoyable.
Local – FPS + ASDE-X
• Changing an instruction proved unsuccessful i.e., asking aircraft to hold position,
immediately following a TIPH instruction.
• This is a very complex scenario.
• It might be better if both local control and ground control could have an ASDE to use so
local control can place his/her display closer to the D Brite to keep more aware of the
traffic situation.
• Very difficult to preplan too much effort to maintain situational awareness.
• Strips were easier to use than the data tags when they overlap and you have to mess with
moving them.
• Based on strip board management for the arrivals, I was much more comfortable keeping
track of the aircraft.
Ground – Perceptual Spatial TODDS
• Considering I can't see the aircraft on the ground, not a bad experience. I think the data
blocks and not having to give taxi instructions or hold short instructions help
tremendously.
• Once again GC [ground control] is simple.
• Nice digital taxi system. Nice ATIS update system for advising aircraft of new ATIS.
Works well for ground control and may work well with local control with some practice.

H-24
• The size of the screen leads to smaller movable buttons. This makes it harder to move
flight information. Also, the size of the screen leads to problems finding spots to move
the boxes. It would need to be much bigger in my opinion.
• Aircraft arriving 33L hampered 33R arrival crossings.
• The ground controller should have the ability of continuing to slide the taxiing aircraft for
departure to the local controller's tab and only seeing the last four or five. Visa versa for
local control.
• A memory jogger for the local position to use while ground is crossing an active runway
would be helpful.
• It didn't seem bad at all. Maybe if ground develops a list - you could highlight it and
move/adjust the list all at once.
Local – Perceptual Spatial TODDS
• The digital strips are by far better than just strips. I can put traffic where last reported.
Seeing the data is a reminder.
• I was absolutely lost trying to figure out how to use the data to keep track of where
aircraft were.
• If you had an ASDE-X to verify info and alleviate position reports, then this might be
effective. Otherwise, you spend much of you time on flight progress updates.
• No.
• Would like to see this with one runway for arrivals (33L) and 27 for departures.
• When aircraft report "clear of runway" and local control instructs them to "contact
ground," it would be helpful if the electronic flight data dropped into a "ground tab"
similar to the departure tab. This cold ease congestion of tags, workload and confusion of
info. Also, arranging the arrival tab into three specific areas would greatly assist the
mental preplan of local control. Lastly, the loss of data and time between the aircraft
arriving (dropping off the STARS display) and the timing to cross the runway approach
end is deceptive.
• Both maps [TODDS and D-BRITE] need to be aligned in the same direction. Too much
and/or unnecessary hesitation due to reconfigure of brain.
• Working traffic like this would be an uncomfortable situation on a daily basis.
Ground – FPS
• Too much traffic for the equipment limitations.
• Not difficult for ground control.
• N/A
• In the real world, it would be better for local to cross 33L with the 33R arrivals. Overall I
think it went well.
Local – FPS
• This volume and complexity is really unrealistic for the conditions - arrival separation is
almost a given in the scenario but at WOXOF it can't be. Realistically this should be a
single arrival flow.
• Using position reports both launching and departing a crossing runway configuration is
an accident waiting to happen. Best to have a physical display such as ASDE or ASDE-X
for aircraft ground locations with no windows.

H-25
• No ability to double check or confirm positions. Very important to not miss a call. An
assistant local to mark strips would be very helpful!

Appendix I
Participants’ Responses for the Post-Experiment Questionnaire
I-1
Q1 - Rate the readability of the readout area when using the Integrated and Perceptual-
Spatial TODDS.
• Some overlap, but readout was fine.
• As long as you keep up with moving the boxes when you need them.
• The text, font size, and coloring was very easy to read.
• Had no problems.
• It's there, however did not have to look at it much. Also, the focus is also on the middle
and right side of the screen that any pop-ups on the left can be missed.
• Readability was ok but time to look at data did not exist. Had to focus away from rest of
info. On local, I never looked at it.
• Text size, configuration and content are good.
Q2 - Rate the readability of the weather information box when using the Integrated and
Perceptual-Spatial TODDS.
• Change the color of the text.
• Only the wind and altimeter setting. Weather sequence would be nice.
• see Q(1) [The text, font size, and coloring was very easy to read.]
• It might be available but I didn't use it much since I was not used to it even by the end of
the last test. Maybe needs a special area that’s a standard location to refer to.
• The IDS was very clear.
• Just didn't catch my eye as info changes.
• Very readable. Fails to attract attention when new information has been processed.
• Good except instead of just changing color when new ATIS comes out maybe it could
flash too?
Q3 - Rate the readability of the flight data elements when using the Integrated TODDS.
• Very easy and effective.
• They seemed quite readable.
• See Q(1) [The text, font size, and coloring was very easy to read.] except the data tags
would get jumbled up.
• No problems reading the data.
• All info is presented very clearly. I would add runways to landing aircraft.
• Need runway headers in between groups, not small blue line.
Q4 - Rate the readability of the data blocks when using the Integrated TODDS.
• They were all easy to read - #'s 3 & 4.
• see Q(1) [The text, font size, and coloring was very easy to read.]
• No problems.
• Data blocks are readable, however "overlap avoidance" is less than desirable as the
continuous movement is a distraction. Manual manipulation was an acceptable resolution.
• Data block offset sometimes hard to read because of overlap. Don't like trying to mess
with them when concentration needed elsewhere. Otherwise, no problems.
• Reference 1-4 - All readouts were very clear, easy to see, good contrast - what I would
expect for digital equipment.

I-2
Q5 - Rate the overall effort needed to use the touchscreen when using the Integrated
TODDS.
• Very easy to use when all is working for you.
• After working it twice, it was very easy to learn then use.
• For me, once I did it a few times little effort for the benefit I get.
• The touchscreen itself was easy - using it as required for moving aircraft will take some
getting used to be really efficient.
• With a bit of practice it was no problem at all.
• Touchscreen was very useable. Only problem was the sensitivity of a drag vs a tap or
select (maybe enlarge the pixel area of motion for the drag).
• Tapping is very easy, however dragging can take one or two times. Once someone
develops a feel for the touchscreen it is very friendly.
• I had trouble dragging tags across the airport.
• Found I had to disrupt scan/flow at times to chase a moving data block.
• After getting used to the technique, effort was minimal. However, ergonomic and
functional placement should be adjusted.
• Today, easier than yesterday but didn't like placement of TRACON button with the
departure button. Another button for D-ATIS with the electronic flight data list, so
movement can be smoother.
• It is not effortless. It definitely requires attention to select, or select and drag. Although it
was not difficult and it worked extremely well.
Q6 - What effect do you think the Integrated TODDS will have on your ability to control
traffic in the tower?
• It is very nice when it is all working to have all the information right in front of you.
• You eliminate part of your scan looking at strips. It gives you more time to look where
you NEED to.
• I don't think it will affect my ability but it will help in as far as safety with the aircraft.
• By manipulating the display I feel more engaged.
• It will have a positive impact when everything is working.
• If used properly by all positions and using the ASDE-X with the TODDS I think it would
have a very positive effect.
• I feel it would greatly improve my performance especially the digital taxi mechanism.
Having the ASDE-X as my whole work screen with ground radar was excellent.
• A basic rule of ATC is scanning multiple areas (D-BRITE, runways, taxiways, ASDE,
strip board, final, departure area). TODDS could be very helpful at my tower, but it might
require too much of my attention.
• The entries are too cumbersome to run a high level of traffic. I find that the more data
available equates to less spent separating traffic.
• Increased effectiveness at ground control. Minimal improvement at local control.
• May get too focused on screen and not look out windows as much. Workload reduced
considerably with data comm. and clearance delivery almost not needed.
• If we still have windows, it takes your attention to look at the scope, instead of the
aircraft. It could be positive, but it could be a negative.
I-3
Q7 - What is the greatest benefit(s) of the Integrated TODDS?
• The D-taxi is great, that would save a lot of time and read back errors. It would also be
very beneficial to the pilots in their taxi.
• Having everything in one place. This will allow you to focus on the important items.
• The runway color option when the aircraft change colors on or rolling on the runway.
• Replacing paper strips. (2) Organization of information on FDE. (3) Touchscreen ability
to drag FDE boxes to any area of monitor. (4) Color change to aircraft as they cross the
runway. (5) Not having to manually keep track of taxi and departure times.
• Having all the info directly in front of me. Scanning a display is easier than scanning an
airfield.
• In the best case it takes a lot of the data workload away.
• Having the ASDE-X and all info needed right in front of you on one display.
• Digital taxi mechanism. Ability to select aircraft by touching them instead of using a
mouse. Immediate updates of the ASDE-X was excellent. I feel the list on the integrated
needs work and a place for overflow of strips that are not managed properly.
• Puts information at your fingertips. If everything is working the info is presented right in
front of you.
• Most of your information is right in front of you. You don't have to worry about someone
in your way, or not being able to see out a window. All the flight info is there for you to
see.
• In tandem with ASDE-X, ASOS, & STARS, this system seem to be highly functional,
easy to use and very effective in information management.
• The flight plans, ACID and airport maps are integrated.
• Everything (info) is available to you on one screen.
• Digital communication - no chance of misinterpretations. Digital transfer of data from
local to ground or ground to ramp. Digital taxi clearances.
Q8 - What is the biggest problem(s) with the Integrated TODDS?
• Losing aircraft short final.
• The readability of the information (Flight Strip) Data Boxes.
• A bigger monitor might make it easier to spread out information to keep it from
overlapping.
• I didn't see much problem w/TODDS. It is the level of traffic. One improvement: when
aircraft are clear T.O. and dept. button hit, the data leave the "runway end". Aircraft still
there.
• Getting used to something new.
• Getting all controllers to use it correctly and not being able to rotate the map when not
combined with the ASDE-X.
• Integrated list filling up. Pos & hold aircraft tags jumping. Otherwise excellent system.
• Clutter can happen looking down and focusing on the screen can take attention away
from the operation. Would take a lot of getting used to.
• Most of your information is right in front of you. This can lead to tunnel vision and not
seeing out the tower window, not scanning the runway, and not being aware of what the
other controllers are doing and saying.
• Too much ground on local display and vice versa.
I-4
• Not problems, per se, however the layout of a few of the elements need adjustment.
Concept seems sound and valid.
• Too much dragging, pressing, pointing. Eliminate the contact ramp, ground and
TRACON buttons.
• Does not leave room for variables on ground many times situations dynamic and
instructions (taxi route, flow times, miles in trail) change many times before aircraft get
to runway.
• Only looking at the equipment instead of the aircraft out the windows.
Q9 - In order of preference, what additional features would you desire for the Integrated
TODDS?
• Color text for weather. Color text for different runway. Same for arrivals and departures.
• Aircraft that clear the runway, the data block switches to ground at certain points.
Aircraft that taxi for departure (Data Blocks) switch at certain points.
• #2 - Automatic switch to departure for the departures. #1 - runway occupancy bars (hold
bars) as they have on AMASS.
• A speed read out on all aircraft and the Integrated TODDS to have data blocks to move
into a pre-determined position for the first few that are at the runway waiting so they are
more easily recognized with out having to look at the leader lines.
• A redesigned list for flight strips. A better weather display that stands out (maybe a
different color background box with weather info to be placed where the user wants).
• Runway numbers for arrivals. A color or differentiation of some kind for aircraft that
have been issued a landing clearance. The arrivals drop down into a arrival list for the
local and ground controllers (a "p" or last to land list).
• Larger screen.
• Filter out arrival data block from offsetting the departure data blocks specifically at E
[taxiway E] on the center of airport. When ground control/local control releases the data
block to the other controller really the transferring controller doesn't need to the data
block.
• Better alignment or categorization of the "arrival" list. 2. Elimination of the "tracon"
button. 3. Storage area for overflow, outbound, taxi traffic.
• Additional data comm. button next to pending electronic flight data box. TRACON
button name changed. TRACON and "departure" header no located next to each other.
• Light adjustment settings - day/night etc. Being able to put aircraft in a list and move the
whole list. Mostly for sequencing - see previous scenario notes.
Q10 - Do you have any additional comments regarding the Integrated TODDS?
• I like the system a lot. Very easy to use and beneficial for ATC.
• Great concept.
• I never noticed the ATIS change, maybe a total screen flicker or an audible to catch may
attention. Maybe an audible that goes off when an aircraft is stopped on a runway for a
certain length of time. I'm sure audible alerts could be used in a variety of ways with this
system.
• It has great potential.
• Very nice system & should be implemented so as to reduce runway incursions.

I-5
• See above. [1. Better alignment or categorization of the "arrival" list. 2. Elimination of
the "TRACON" button. 3. Storage area for overflow, outbound, taxi traffic.]
• Very usable, excellent for transferring data from one position to another. Reference
touchscreen features - if it was to be used, I think the latest software or features (set
sensitivity) should be in place, meaning easier to select, easier to move, not such precise
moves as it is now.
Q11 - Rate the readability of the flight data elements when using the Perceptual-Spatial
TODDS
• It was easy to read, but the zones needed to be bigger.
• The color, font, size was very easy to read.
• Very readable.
• Run out of room too quickly and was lulled to believe aircraft were at certain positions by
position of data block but they weren't there yet.
• Digital screens, again, no less than expected.
Q12 - Rate the overall effort needed to use the touchscreen when using the Perceptual-
Spatial TODDS.
• A lot of work to drag the boxes around, seemed to add to the workload a lot.
• A lot of steps needed. It takes your focus off the runway and what you have going on.
• There was a lot of dragging the elements around. But if you don't have an ASDE and it's
IFR, it is a good option.
• No problems using the touchscreen.
• A lot of dragging and moving aircraft around.
• I had trouble moving the tags around the screen.
• A lot of effort - could be distracting of main responsibility of safety. Everything must be
slowed way down.
• See notes on previous page - some moves have to be very precise.
Q13 - What effect do you think the Perceptual-Spatial TODDS will have on your ability to
control traffic in the tower?
• I think it is too much work to be pushing buttons and dragging boxes with every
transmission.
• When you are busy you do not have time to push extra buttons.
• Depends on type of tower. A VFR tower would probably not benefit if it is writing down
aircraft call-signs on a pad. A VFR tower that requires aircraft call-signs to be entered
into a data system would benefit greatly.
• If it is slow traffic and IFR it can be a good visual cure of where aircraft are.
• This varies, after getting used to it, it might be effective but only with windows or ASDE.
Otherwise a bit cumbersome.
• This has the ability to distract from looking out the window. A lot of work with moving
targets around.
• It will be much easier controlling a VFR tower with this system.
• Too cumbersome.
I-6
• Departure line-up could be helpful for ground control and local control. Hard to track
arrivals on local control.
• Leaning toward negative only because of the use of the scope that takes your eyes off of
the aircraft.
Q14 - What is the greatest benefit(s) of the Perceptual-Spatial TODDS?
• Keep track of where aircraft are. It could be a lot more beneficial in lower traffic volume
areas.
• It eliminates strips.
• I think it would be great in VFR towers. Keeping track of aircraft.
• The pre-taxi was the best feature.
• Using digital taxi. Using electronic strips if you stat out training with it.
• It does help with having aircraft info readily available. Keeping up with the traffic picture
will make this tool an asset. User friendly.
• Using the data blocks instead of half strips and paper to keep track of multiple VFR
airplanes. Also passing info between controllers will be much easier.
• See previous. [1. Better alignment or categorization of the "arrival" list. 2. Elimination of
the "tracon" button. 3. Storage area for overflow, outbound, taxi traffic.]
• The manual dragging and placing aircraft (ACID) on map. When system is down.
• If zero visibility could be helpful to help keep an active picture in your mind.
• Probably on the digital information and the ability to transfer that data.
Q15 - What is the biggest problem(s) with the Perceptual-Spatial TODDS?
• Adds a lot of workload to both ground and tower.
• The extra steps needed to put an aircraft in TIPH then again to clear the aircraft for
takeoff.
• Zone(s) were not large enough to accommodate all of the data blocks.
• Not being able to rotate the map.
• Hard to tell since I use other systems primarily.
• More space is needed on the screen. Departure list can take a lot of attention from
operation.
• Dragging tags. Aircraft that land and go to ground control do not have the runway they
exited on their tag.
• Moving the "shrimp boats" for lack of space.
• Too much heads-down time.
• See previous. [1. Better alignment or categorization of the "arrival" list. 2. Elimination of
the "tracon" button. 3. Storage area for overflow, outbound, taxi traffic.]
• Too much pressing, recalling, dragging, etc.
• Delays harder to calculate when gate hold in effect. In reality, several aircraft could be
waiting to taxi on ramp or holding on gates.
• Probably the accuracy necessary to select on the screen, which to provide and have
accuracy, you have to look at it and that, as said before, (possibly) could be a detriment in
a cab with windows.
Q16 - In order of preference, what additional features would you desire for the Perceptual-
Spatial TODDS?

I-7
• Bigger zone areas. If data blocks overlap have them move automatically.
• Less steps for departures.
• Larger zones. Zones outlined on display.
• Same as integrated. [A bigger monitor might make it easier to spread out information to
keep it from overlapping. I never noticed the ATIS change, maybe a total screen flicker
or an audible to catch may attention. Maybe an audible that goes off when an aircraft is
stopped on a runway for a certain length of time. I'm sure audible alerts could be used in
a variety of ways with this system.]
• None
• Integrate a list to the right like the Integrated.
• A way to keep the departure list going up when local moves people. A lot of time we had
to take back tags or ask local to move someone up. This adds to overall workload.
• Easier screen/dragging ability. Runways on tags fro aircraft exiting a runway on ground
control screen.
• Enlarge the zone size for departure line-up.
• See previous. [1. Better alignment or categorization of the "arrival" list. 2. Elimination of
the "tracon" button. 3. Storage area for overflow, outbound, taxi traffic.]
• See all.
Q17 - Do you have any additional comments regarding the Perceptual-Spatial TODDS?
• You should be able to move and rotate the display.
• Same as integrated. [I never noticed the ATIS change, maybe a total screen flicker or an
audible to catch may attention. Maybe an audible that goes off when an aircraft is stopped
on a runway for a certain length of time. I'm sure audible alerts could be used in a variety
of ways with this system.]
• I think it would be good in a slow tower if they would use it.
• Should do fine at towers with no ASDE.
• N/A
• A data link button pilots could use to start the clock of when they were actually ready
even though they were held on ramp or gate because of delays.
• If digital data is the wave of the future, you're definitely on the right track. Unfortunately,
most people (human nature) resist change, controllers especially. Like anything, when
people get used to it, they probably love it.


![[William Hughes, John Brighton] Schaum's Outline o(Bookos.org)](https://static.fdocuments.us/doc/165x107/54962ce2ac7959aa678b45a9/william-hughes-john-brighton-schaums-outline-obookosorg.jpg)