Fidelity Investments Overview: NCCMT Cash and Term Portfolios

March 31, 2021
William Blair FundsPortfolios of Investments

Table of Contents
Portfolio of Investments
Growth Fund . . . . . . . . . . . . . . . . . . . . . . . . . . . . . . . . . . . . . . . . . . . . . . . . . . . . . . . . . . . . . . . . . . . . . . . . . . . . . . . . . . . . 1Large Cap Growth Fund . . . . . . . . . . . . . . . . . . . . . . . . . . . . . . . . . . . . . . . . . . . . . . . . . . . . . . . . . . . . . . . . . . . . . . . . . . . 3Mid Cap Growth Fund. . . . . . . . . . . . . . . . . . . . . . . . . . . . . . . . . . . . . . . . . . . . . . . . . . . . . . . . . . . . . . . . . . . . . . . . . . . . . 5Small-Mid Cap Core Fund . . . . . . . . . . . . . . . . . . . . . . . . . . . . . . . . . . . . . . . . . . . . . . . . . . . . . . . . . . . . . . . . . . . . . . . . . 7Small-Mid Cap Growth Fund. . . . . . . . . . . . . . . . . . . . . . . . . . . . . . . . . . . . . . . . . . . . . . . . . . . . . . . . . . . . . . . . . . . . . . . . 10Small-Mid Cap Value Fund . . . . . . . . . . . . . . . . . . . . . . . . . . . . . . . . . . . . . . . . . . . . . . . . . . . . . . . . . . . . . . . . . . . . . . . . . 13Small Cap Growth Fund . . . . . . . . . . . . . . . . . . . . . . . . . . . . . . . . . . . . . . . . . . . . . . . . . . . . . . . . . . . . . . . . . . . . . . . . . . . 16Small Cap Value Fund . . . . . . . . . . . . . . . . . . . . . . . . . . . . . . . . . . . . . . . . . . . . . . . . . . . . . . . . . . . . . . . . . . . . . . . . . . . . 19Global Leaders Fund . . . . . . . . . . . . . . . . . . . . . . . . . . . . . . . . . . . . . . . . . . . . . . . . . . . . . . . . . . . . . . . . . . . . . . . . . . . . . 22International Leaders Fund . . . . . . . . . . . . . . . . . . . . . . . . . . . . . . . . . . . . . . . . . . . . . . . . . . . . . . . . . . . . . . . . . . . . . . . . . 26International Growth Fund . . . . . . . . . . . . . . . . . . . . . . . . . . . . . . . . . . . . . . . . . . . . . . . . . . . . . . . . . . . . . . . . . . . . . . . . . 30Institutional International Growth Fund . . . . . . . . . . . . . . . . . . . . . . . . . . . . . . . . . . . . . . . . . . . . . . . . . . . . . . . . . . . . . . . . 37International Small Cap Growth Fund. . . . . . . . . . . . . . . . . . . . . . . . . . . . . . . . . . . . . . . . . . . . . . . . . . . . . . . . . . . . . . . . . 44Emerging Markets Leaders Fund . . . . . . . . . . . . . . . . . . . . . . . . . . . . . . . . . . . . . . . . . . . . . . . . . . . . . . . . . . . . . . . . . . . . 49Emerging Markets Growth Fund . . . . . . . . . . . . . . . . . . . . . . . . . . . . . . . . . . . . . . . . . . . . . . . . . . . . . . . . . . . . . . . . . . . . . 53Emerging Markets Small Cap Growth Fund . . . . . . . . . . . . . . . . . . . . . . . . . . . . . . . . . . . . . . . . . . . . . . . . . . . . . . . . . . . . 58Bond Fund . . . . . . . . . . . . . . . . . . . . . . . . . . . . . . . . . . . . . . . . . . . . . . . . . . . . . . . . . . . . . . . . . . . . . . . . . . . . . . . . . . . . . 63Income Fund . . . . . . . . . . . . . . . . . . . . . . . . . . . . . . . . . . . . . . . . . . . . . . . . . . . . . . . . . . . . . . . . . . . . . . . . . . . . . . . . . . . . 69Low Duration Fund . . . . . . . . . . . . . . . . . . . . . . . . . . . . . . . . . . . . . . . . . . . . . . . . . . . . . . . . . . . . . . . . . . . . . . . . . . . . . . . 74Macro Allocation Fund . . . . . . . . . . . . . . . . . . . . . . . . . . . . . . . . . . . . . . . . . . . . . . . . . . . . . . . . . . . . . . . . . . . . . . . . . . . . 79
Notes to Portfolios of Investments. . . . . . . . . . . . . . . . . . . . . . . . . . . . . . . . . . . . . . . . . . . . . . . . . . . . . . . . . . . . . . . . . . . . 86

Growth Fund
Portfolio of Investments, March 31, 2021 (all dollar amounts in thousands) (unaudited)
Issuer Shares Value
Common Stocks
Information Technology—38.1%* Adobe, Inc. 16,256 $ 7,728* Advanced Micro Devices, Inc. 76,929 6,039* Alarm.com Holdings, Inc. 14,360 1,240
Brooks Automation, Inc. 30,917 2,524Fidelity National Information Services, Inc. 50,903 7,157
* GoDaddy, Inc. 50,958 3,955* Grid Dynamics Holdings, Inc. 184,373 2,937
Mastercard, Inc. 37,958 13,515Microsoft Corporation 120,443 28,397
* MongoDB, Inc. 7,635 2,042National Instruments Corporation 99,314 4,289
* Nice, Ltd.—ADR 16,909 3,686* PayPal Holdings, Inc. 46,880 11,384* Pure Storage, Inc. 232,913 5,017
Texas Instruments, Inc. 40,066 7,572* Verra Mobility Corporation 254,570 3,446* Workday, Inc. 17,406 4,324
115,252
Consumer Discretionary—15.7%Advance Auto Parts, Inc. 21,784 3,997
* Amazon.com, Inc. 7,363 22,782* Bright Horizons Family Solutions, Inc. 19,595 3,360* Burlington Stores, Inc. 10,290 3,075* Etsy, Inc. 8,873 1,789* Grand Canyon Education, Inc. 16,692 1,788* Revolve Group, Inc. 46,413 2,085* Rush Street Interactive, Inc. 167,624 2,739* Skyline Champion Corporation 59,332 2,685* Ulta Beauty, Inc. 10,865 3,359
47,659
Health Care—14.7%Abbott Laboratories 32,385 3,881Agilent Technologies, Inc. 37,986 4,830
* Certara, Inc. 102,102 2,787* Horizon Therapeutics plc† 68,793 6,332* Ligand Pharmaceuticals, Inc. 10,618 1,619
STERIS plc† 17,022 3,242Stryker Corporation 32,168 7,836UnitedHealth Group, Inc. 26,601 9,897
* Veracyte, Inc. 18,965 1,019Zoetis, Inc. 20,115 3,168
44,611
Communication Services—9.7%Activision Blizzard, Inc. 39,401 3,664
* Alphabet, Inc. Class “A” 10,813 22,302* Take-Two Interactive Software, Inc. 10,783 1,905
Warner Music Group Corporation 46,530 1,59829,469
Industrials—8.8%BWX Technologies, Inc. 71,727 4,730
See accompanying Notes to Portfolio of Investments. 1

Growth Fund
Portfolio of Investments, March 31, 2021 (all dollar amounts in thousands) (unaudited)
Issuer
Shares orPrincipalAmount Value
Common Stocks—(continued)
Industrials — (continued)* Copart, Inc. 47,217 $ 5,128* CoStar Group, Inc. 4,647 3,819
Fortive Corporation 60,892 4,301* Kornit Digital, Ltd.† 18,318 1,816
The Brink’s Co. 60,922 4,827* Trex Co., Inc. 22,167 2,029
26,650
Consumer Staples—5.3%* BJ’s Wholesale Club Holdings, Inc. 58,470 2,623
The Coca-Cola Co. 137,829 7,265The Estee Lauder Cos., Inc. 20,826 6,057
15,945
Financials—2.6%Aon plc† 18,555 4,270Ares Management Corporation 62,589 3,507
7,777
Energy—1.9%Cameco Corporation† 225,274 3,742New Fortress Energy, Inc. 45,932 2,108
5,850
Materials—1.5%Ball Corporation 54,789 4,643
Real Estate—1.0%SBA Communications Corporation 10,837 3,008
Total Common Stocks—99.3%(cost $160,999) 300,864
Repurchase AgreementFixed Income Clearing Corporation, 0.000% dated 3/31/21, due 4/1/21, repurchase price $2,261, collateralized by U.S. Treasury
Bond, 2.000%, due 2/15/50, valued at $2,306 $ 2,261 2,261
Total Repurchase Agreement—0.8%(cost $2,261) 2,261
Total Investments—100.1%(cost $163,260) 303,125
Liabilities, plus cash and other assets—(0.1)% (167)
Net assets—100.0% $ 302,958
ADR = American Depository Receipt* = Non-income producing security† = U.S. listed foreign security
See accompanying Notes to Portfolio of Investments. 2

Large Cap Growth Fund
Portfolio of Investments, March 31, 2021 (all dollar amounts in thousands) (unaudited)
Issuer Shares Value
Common Stocks
Information Technology—43.2%Accenture plc† 89,020 $ 24,592
* Adobe, Inc. 46,500 22,105* Advanced Micro Devices, Inc. 232,328 18,238
Fidelity National Information Services, Inc. 88,780 12,483* Guidewire Software, Inc. 76,370 7,761
Intuit, Inc. 50,880 19,490Lam Research Corporation 39,380 23,441Mastercard, Inc. 100,360 35,733Microsoft Corporation 336,080 79,238
* PayPal Holdings, Inc. 134,120 32,570* salesforce.com, Inc. 71,900 15,233
Texas Instruments, Inc. 127,660 24,126315,010
Consumer Discretionary—16.6%* Amazon.com, Inc. 20,845 64,496* Marriott International, Inc. 88,280 13,075
NIKE, Inc. 177,300 23,562Starbucks Corporation 186,740 20,405
121,538
Health Care—13.4%Abbott Laboratories 103,170 12,364
* ABIOMED, Inc. 37,318 11,894* Illumina, Inc. 26,060 10,009
Stryker Corporation 76,370 18,602UnitedHealth Group, Inc. 78,930 29,367Zoetis, Inc. 101,020 15,909
98,145
Communication Services—12.2%Activision Blizzard, Inc. 163,650 15,219
* Alphabet, Inc. Class “A” 21,930 45,231* Alphabet, Inc. Class “C” 5,300 10,964* Live Nation Entertainment, Inc. 210,150 17,789
89,203
Industrials—5.6%* Copart, Inc. 142,060 15,429
Equifax, Inc. 65,030 11,779Fortive Corporation 194,930 13,770
40,978
Consumer Staples—5.1%Costco Wholesale Corporation 56,180 19,802The Estee Lauder Cos., Inc. 59,070 17,181
36,983
Financials—1.8%Apollo Global Management, Inc. 277,080 13,026
Materials—1.5%Linde plc† 38,800 10,869
See accompanying Notes to Portfolio of Investments. 3

Large Cap Growth Fund
Portfolio of Investments, March 31, 2021 (all dollar amounts in thousands) (unaudited)
IssuerPrincipalAmount Value
Common Stocks—(continued)
Total Common Stocks—99.4%(cost $498,832) 725,752
Repurchase AgreementFixed Income Clearing Corporation, 0.000% dated 3/31/21, due 4/1/21, repurchase price $6,222, collateralized by U.S. Treasury
Bond, 2.000%, due 2/15/50, valued at $6,346 $ 6,222 $ 6,222
Total Repurchase Agreement—0.9%(cost $6,222) 6,222
Total Investments—100.3%(cost $505,054) 731,974
Liabilities, plus cash and other assets—(0.3)% (2,043)
Net assets—100.0% $ 729,931
† = U.S. listed foreign security* = Non-income producing security
See accompanying Notes to Portfolio of Investments. 4

Mid Cap Growth Fund
Portfolio of Investments, March 31, 2021 (all dollar amounts in thousands) (unaudited)
Issuer Shares Value
Common Stocks
Information Technology—27.7%* Anaplan, Inc. 23,760 $ 1,279* Aspen Technology, Inc. 7,952 1,148* Cadence Design Systems, Inc. 19,090 2,615
Dolby Laboratories, Inc. 11,885 1,173* Dynatrace, Inc. 32,545 1,570* EPAM Systems, Inc. 3,010 1,194* Euronet Worldwide, Inc. 11,505 1,591* GoDaddy, Inc. 18,065 1,402* Guidewire Software, Inc. 7,037 715
Microchip Technology, Inc. 11,340 1,760* MongoDB, Inc. 4,985 1,333* Nice, Ltd.—ADR 6,680 1,456
Pegasystems, Inc. 12,695 1,452* Pure Storage, Inc. 71,865 1,548* RingCentral, Inc. 4,880 1,454* Zendesk, Inc. 8,030 1,065
22,755
Health Care—25.4%* 10X Genomics, Inc. 5,910 1,070* ABIOMED, Inc. 3,753 1,196
Agilent Technologies, Inc. 20,790 2,643* Align Technology, Inc. 4,310 2,334
Bio-Techne Corporation 2,782 1,063* Centene Corporation 12,280 785
Encompass Health Corporation 19,238 1,576* Exact Sciences Corporation 12,225 1,611* Horizon Therapeutics plc† 28,750 2,646* Insulet Corporation 6,390 1,667* Mettler-Toledo International, Inc. 960 1,109
STERIS plc† 6,565 1,251Teleflex, Inc. 4,545 1,888
20,839
Industrials—15.3%BWX Technologies, Inc. 36,264 2,391
* Clarivate plc† 47,880 1,264* Copart, Inc. 22,372 2,430* CoStar Group, Inc. 3,019 2,481
Equifax, Inc. 4,610 835Fortive Corporation 10,615 750Rockwell Automation, Inc. 4,085 1,084
* Teledyne Technologies, Inc. 3,190 1,31912,554
Consumer Discretionary—8.6%Advance Auto Parts, Inc. 8,168 1,499
* Aptiv plc† 9,560 1,318* Bright Horizons Family Solutions, Inc. 6,095 1,045* Burlington Stores, Inc. 4,510 1,347
Domino’s Pizza, Inc. 2,458 904* Etsy, Inc. 4,818 972
7,085
See accompanying Notes to Portfolio of Investments. 5

Mid Cap Growth Fund
Portfolio of Investments, March 31, 2021 (all dollar amounts in thousands) (unaudited)
Issuer
Shares orPrincipalAmount Value
Common Stocks—(continued)
Communication Services—7.5%Cable One, Inc. 310 $ 567
* Live Nation Entertainment, Inc. 11,164 945* Take-Two Interactive Software, Inc. 11,855 2,095
Warner Music Group Corporation 42,275 1,451* Zillow Group, Inc. 8,770 1,137
6,195
Materials—5.8%Ball Corporation 17,865 1,514FMC Corporation 8,675 960Vulcan Materials Co. 13,560 2,288
4,762
Financials—4.2%Arthur J Gallagher & Co. 15,275 1,906East West Bancorp, Inc. 21,345 1,575
3,481
Real Estate—1.4%SBA Communications Corporation 4,175 1,159
Consumer Staples—1.4%* BJ’s Wholesale Club Holdings, Inc. 24,759 1,111
Energy—0.9%New Fortress Energy, Inc. 16,838 773
Total Common Stocks—98.2%(cost $56,655) 80,714
Repurchase AgreementFixed Income Clearing Corporation, 0.000% dated 3/31/21, due 4/1/21, repurchase price $1,639, collateralized by U.S. Treasury
Bond, 2.000%, due 2/15/50, valued at $1,672 $ 1,639 1,639
Total Repurchase Agreement—2.0%(cost $1,639) 1,639
Total Investments—100.2%(cost $58,294) 82,353
Liabilities, plus cash and other assets—(0.2)% (139)
Net assets—100.0% $ 82,214
ADR = American Depository Receipt* = Non-income producing security† = U.S. listed foreign security
See accompanying Notes to Portfolio of Investments. 6

Small-Mid Cap Core Fund
Portfolio of Investments, March 31, 2021 (all dollar amounts in thousands) (unaudited)
Issuer Shares Value
Common Stocks
Health Care—16.9%* Acadia Healthcare Co., Inc. 7,443 $ 425* Butterfly Network, Inc. 10,718 180* Certara, Inc. 14,560 398* Codexis, Inc. 22,667 519
Encompass Health Corporation 5,689 466* Globus Medical, Inc. 4,219 260* Hanger, Inc. 20,373 465* HealthEquity, Inc. 3,767 256* Horizon Therapeutics plc† 6,018 554* LHC Group, Inc. 2,349 449* Ligand Pharmaceuticals, Inc. 1,723 263* Mednax, Inc. 20,262 516* Merit Medical Systems, Inc. 12,443 745
Owens & Minor, Inc. 21,856 822* Penumbra, Inc. 1,271 344
STERIS plc† 2,013 3837,045
Financials—16.1%Ares Management Corporation 9,285 520Columbia Banking System, Inc. 11,926 514East West Bancorp, Inc. 11,758 868
* Encore Capital Group, Inc. 8,091 325FirstCash, Inc. 3,255 214Glacier Bancorp, Inc. 10,914 623Hannon Armstrong Sustainable Infrastructure Capital, Inc. 4,968 279LPL Financial Holdings, Inc. 3,551 505
* Star Peak Energy Transition Corporation 13,153 350Virtu Financial, Inc. 17,159 533Voya Financial, Inc. 5,630 358Western Alliance Bancorp 10,838 1,023Wintrust Financial Corporation 8,157 618
6,730
Industrials—15.9%* Axon Enterprise, Inc. 2,290 326* Builders FirstSource, Inc. 15,847 735
BWX Technologies, Inc. 11,676 770* Casella Waste Systems, Inc. 3,665 233
Douglas Dynamics, Inc. 6,539 302* Generac Holdings, Inc. 1,026 336* IAA, Inc. 4,560 252* Kornit Digital, Ltd.† 3,182 315
Lincoln Electric Holdings, Inc. 3,828 471Luxfer Holdings plc† 29,687 632Owens Corning 6,224 573The Brink’s Co. 11,390 902
* Trex Co., Inc. 4,733 433* WillScot Mobile Mini Holdings Corporation 12,232 339
6,619
Information Technology—12.3%* Alarm.com Holdings, Inc. 4,798 415
Brooks Automation, Inc. 5,770 471
See accompanying Notes to Portfolio of Investments. 7

Small-Mid Cap Core Fund
Portfolio of Investments, March 31, 2021 (all dollar amounts in thousands) (unaudited)
Issuer Shares Value
Common Stocks—(continued)
Information Technology—12.3%—(continued)CMC Materials, Inc. 1,801 $ 318
* Cree, Inc. 3,469 375Dolby Laboratories, Inc. 4,395 434Entegris, Inc. 2,764 309
* Euronet Worldwide, Inc. 3,419 473* j2 Global, Inc. 3,589 430* Knowles Corporation 11,460 240* Nice, Ltd.—ADR 2,151 469* Pure Storage, Inc. 19,170 413* Verra Mobility Corporation 41,036 555* Vertex, Inc. 10,083 222
5,124
Consumer Discretionary—10.0%Advance Auto Parts, Inc. 2,467 453
* Boot Barn Holdings, Inc. 8,211 512* Bright Horizons Family Solutions, Inc. 2,228 382* Burlington Stores, Inc. 1,562 467* Grand Canyon Education, Inc. 6,792 727* National Vision Holdings, Inc. 7,326 321
Service Corporation International 7,937 405* Skyline Champion Corporation 12,510 566* Terminix Global Holdings, Inc. 6,723 320
4,153
Materials—6.6%Avery Dennison Corporation 2,359 433Crown Holdings, Inc. 6,794 659Eagle Materials, Inc. 3,898 524FMC Corporation 2,067 229Martin Marietta Materials, Inc. 1,222 410
* Orion Engineered Carbons S.A.† 25,151 4962,751
Real Estate—6.4%Acadia Realty Trust 5,021 95Americold Realty Trust 9,965 383CoreSite Realty Corporation 3,575 429Douglas Emmett, Inc. 4,472 141Equity LifeStyle Properties, Inc. 8,782 559Healthcare Realty Trust, Inc. 10,819 328
* Jones Lang LaSalle, Inc. 1,871 335Sunstone Hotel Investors, Inc. 32,132 400
2,670
Energy—5.6%Cameco Corporation† 41,267 685
* ChampionX Corporation 11,976 260* Denbury, Inc. 19,732 945
New Fortress Energy, Inc. 9,969 4582,348
Consumer Staples—4.7%* BJ’s Wholesale Club Holdings, Inc. 8,467 380
See accompanying Notes to Portfolio of Investments. 8

Small-Mid Cap Core Fund
Portfolio of Investments, March 31, 2021 (all dollar amounts in thousands) (unaudited)
Issuer
Shares orPrincipalAmount Value
Common Stocks—(continued)
Consumer Staples—4.7%—(continued)Inter Parfums, Inc. 4,413 $ 313
* Performance Food Group Co. 8,761 505Primo Water Corporation† 18,880 307Spectrum Brands Holdings, Inc. 5,576 474
1,979
Communication Services—2.2%Cable One, Inc. 166 303
* Live Nation Entertainment, Inc. 3,492 296* Zynga, Inc. 31,797 325
924
Utilities—1.2%IDACORP, Inc. 5,092 509
Total Common Stocks—97.9%(cost $30,264) 40,852
Repurchase AgreementFixed Income Clearing Corporation, 0.000% dated 3/31/21, due 4/1/21, repurchase price $905, collateralized by U.S. Treasury Note,
2.250%, due 11/15/27, valued at $924 $ 905 905
Total Repurchase Agreement—2.2%(cost $905) 905
Total Investments—100.1%(cost $31,169) 41,757
Liabilities, plus cash and other assets—(0.1)% (38)
Net assets—100.0% $ 41,719
ADR = American Depository Receipt* = Non-income producing security† = U.S. listed foreign security
See accompanying Notes to Portfolio of Investments. 9

Small-Mid Cap Growth Fund
Portfolio of Investments, March 31, 2021 (all dollar amounts in thousands) (unaudited)
Issuer Shares Value
Common Stocks
Health Care—27.9%* 10X Genomics, Inc. 257,215 $ 46,556* ABIOMED, Inc. 178,441 56,875* Acadia Healthcare Co., Inc. 923,824 52,787* Amedisys, Inc. 178,879 47,365
Bio-Techne Corporation 189,131 72,235* Blueprint Medicines Corporation 208,572 20,280* Butterfly Network, Inc. 859,159 14,460* Certara, Inc. 695,174 18,978* Charles River Laboratories International, Inc. 191,500 55,503
Encompass Health Corporation 901,872 73,863* Halozyme Therapeutics, Inc. 1,144,828 47,728* HealthEquity, Inc. 789,504 53,686* Horizon Therapeutics plc† 812,484 74,781* Insmed, Inc. 688,241 23,442* Inspire Medical Systems, Inc. 153,743 31,823* Insulet Corporation 170,190 44,406* Ligand Pharmaceuticals, Inc. 241,432 36,806* Masimo Corporation 104,713 24,048* Merit Medical Systems, Inc. 572,733 34,295* Penumbra, Inc. 195,798 52,979
Teleflex, Inc. 83,127 34,536* Twist Bioscience Corporation 137,706 17,056* Veracyte, Inc. 958,270 51,507
985,995
Information Technology—24.4%* Alarm.com Holdings, Inc. 500,779 43,257* Aspen Technology, Inc. 346,046 49,945* Avalara, Inc. 307,017 40,965
Brooks Automation, Inc. 743,798 60,731* Cree, Inc. 313,382 33,886* Dynatrace, Inc. 891,994 43,030
Entegris, Inc. 343,605 38,415* Euronet Worldwide, Inc. 387,141 53,542* GoDaddy, Inc. 522,818 40,581* Guidewire Software, Inc. 216,039 21,956* j2 Global, Inc. 361,841 43,370* LiveRamp Holdings, Inc. 590,386 30,629
National Instruments Corporation 961,876 41,539* Nice, Ltd.—ADR 241,980 52,744* Novanta, Inc.† 212,149 27,980
Pegasystems, Inc. 196,900 22,514* Proofpoint, Inc. 223,400 28,102* Pure Storage, Inc. 2,840,860 61,192* Q2 Holdings, Inc. 208,600 20,902* Varonis Systems, Inc. 768,831 39,472* Workiva, Inc. 280,509 24,758* Zendesk, Inc. 308,433 40,904
860,414
Industrials—15.7%* Axon Enterprise, Inc. 409,138 58,269* Builders FirstSource, Inc. 1,069,683 49,601
BWX Technologies, Inc. 1,377,280 90,818
See accompanying Notes to Portfolio of Investments. 10

Small-Mid Cap Growth Fund
Portfolio of Investments, March 31, 2021 (all dollar amounts in thousands) (unaudited)
Issuer Shares Value
Common Stocks—(continued)
Industrials — (continued)* Generac Holdings, Inc. 185,776 $ 60,832
HEICO Corporation 225,841 25,656Lincoln Electric Holdings, Inc. 220,358 27,091
* Mercury Systems, Inc. 715,257 50,533Ritchie Bros Auctioneers, Inc.† 846,047 49,536The Brink’s Co. 964,278 76,400
* Trex Co., Inc. 701,104 64,179552,915
Consumer Discretionary—12.0%Advance Auto Parts, Inc. 206,665 37,921
* Bright Horizons Family Solutions, Inc. 319,260 54,737* Burlington Stores, Inc. 142,989 42,725* Etsy, Inc. 262,630 52,965* Grand Canyon Education, Inc. 818,142 87,623* Helen of Troy, Ltd.† 203,158 42,797* Leslie’s, Inc. 1,425,100 34,901* National Vision Holdings, Inc. 738,930 32,387* Terminix Global Holdings, Inc. 813,686 38,788
424,844
Financials—5.2%Ares Management Corporation 764,133 42,814FirstCash, Inc. 398,890 26,195
* Star Peak Energy Transition Corporation 929,592 24,709Virtu Financial, Inc. 1,543,972 47,940Western Alliance Bancorp 427,075 40,333
181,991
Materials—4.2%Crown Holdings, Inc. 762,407 73,984Martin Marietta Materials, Inc. 223,902 75,191
149,175
Communication Services—3.7%Cable One, Inc. 23,727 43,382
* Live Nation Entertainment, Inc. 495,060 41,907* Zynga, Inc. 4,415,602 45,083
130,372
Consumer Staples—2.2%* BJ’s Wholesale Club Holdings, Inc. 1,276,631 57,269* Celsius Holdings, Inc. 381,950 18,353
75,622
Energy—2.1%Cameco Corporation† 2,715,120 45,098New Fortress Energy, Inc. 661,804 30,384
75,482
Real Estate—1.1%FirstService Corporation† 268,237 39,750
See accompanying Notes to Portfolio of Investments. 11

Small-Mid Cap Growth Fund
Portfolio of Investments, March 31, 2021 (all dollar amounts in thousands) (unaudited)
IssuerPrincipalAmount Value
Common Stocks—(continued)
Total Common Stocks—98.5%(cost $2,406,926) 3,476,560
Repurchase AgreementFixed Income Clearing Corporation, 0.000% dated 3/31/21, due 4/1/21, repurchase price $53,784, collateralized by U.S. Treasury
Bond, 2.000%, due 2/15/50, valued at $54,860 $ 53,784 $ 53,784
Total Repurchase Agreement—1.5%(cost $53,784) 53,784
Total Investments—100.0%(cost $2,460,710) 3,530,344
Cash and other assets, less liabilities—0.0% 789
Net assets—100.0% $ 3,531,133
ADR = American Depository Receipt* = Non-income producing security† = U.S. listed foreign security
See accompanying Notes to Portfolio of Investments. 12

Small-Mid Cap Value Fund
Portfolio of Investments, March 31, 2021 (all dollar amounts in thousands) (unaudited)
Issuer Shares Value
Common Stocks
Financials—22.5%American Financial Group, Inc. 145 $ 16CNO Financial Group, Inc. 518 13East West Bancorp, Inc. 278 20First American Financial Corporation 245 14FNB Corporation 1,076 14Hancock Whitney Corporation 351 15Home BancShares, Inc. 599 16National Bank Holdings Corporation 302 12PacWest Bancorp 543 21Radian Group, Inc. 567 13Selective Insurance Group, Inc. 232 17
* SVB Financial Group 49 24The Hanover Insurance Group, Inc. 126 16Umpqua Holdings Corporation 973 17Voya Financial, Inc. 297 19Western Alliance Bancorp 315 30
277
Industrials—18.6%Booz Allen Hamilton Holding Corporation 149 12Brady Corporation 359 19
* Chart Industries, Inc. 159 23Curtiss-Wright Corporation 148 18Fortune Brands Home & Security, Inc. 220 21
* FTI Consulting, Inc. 137 19Kansas City Southern 115 30Rexnord Corporation 408 19Simpson Manufacturing Co., Inc. 154 16The Toro Co. 256 27Westinghouse Air Brake Technologies Corporation 314 25
229
Consumer Discretionary—12.6%Churchill Downs, Inc. 83 19
* Deckers Outdoor Corporation 63 21* Helen of Troy, Ltd.† 89 19* LKQ Corporation 439 18
Murphy USA, Inc. 106 15PulteGroup, Inc. 425 22Service Corporation International 313 16
* TopBuild Corporation 118 25155
Real Estate—10.1%American Assets Trust, Inc. 437 14American Campus Communities, Inc. 263 11Americold Realty Trust 417 16CoreSite Realty Corporation 69 8Equity LifeStyle Properties, Inc. 308 20Healthcare Realty Trust, Inc. 551 17Highwoods Properties, Inc. 260 11Life Storage, Inc. 173 15
See accompanying Notes to Portfolio of Investments. 13

Small-Mid Cap Value Fund
Portfolio of Investments, March 31, 2021 (all dollar amounts in thousands) (unaudited)
Issuer Shares Value
Common Stocks—(continued)
Real Estate—(continued)Terreno Realty Corporation 210 $ 12
124
Materials—6.5%Avient Corporation 359 17FMC Corporation 187 21Sensient Technologies Corporation 146 11Silgan Holdings, Inc. 248 10Steel Dynamics, Inc. 393 20
79
Health Care—6.3%* Bio-Rad Laboratories, Inc. 18 10
CONMED Corporation 105 14Encompass Health Corporation 208 17
* Hologic, Inc. 234 18PerkinElmer, Inc. 150 19
78
Information Technology—5.8%* Arista Networks, Inc. 54 16* Cadence Design Systems, Inc. 125 17* Ciena Corporation 355 20
MAXIMUS, Inc. 205 1871
Energy—4.2%* CNX Resources Corporation 1,040 15
Diamondback Energy, Inc. 249 18Helmerich & Payne, Inc. 288 8Valero Energy Corporation 139 10
51
Communication Services—3.4%The Interpublic Group of Cos., Inc. 924 27
* Zynga, Inc. 1,489 1542
Consumer Staples—3.3%* BJ’s Wholesale Club Holdings, Inc. 229 10
Casey’s General Stores, Inc. 40 9J&J Snack Foods Corporation 69 11Lamb Weston Holdings, Inc. 145 11
41
Utilities—3.3%Alliant Energy Corporation 236 13Atmos Energy Corporation 134 13IDACORP, Inc. 146 15
41
Total Common Stocks—96.6%(cost $717) 1,188
See accompanying Notes to Portfolio of Investments. 14

Small-Mid Cap Value Fund
Portfolio of Investments, March 31, 2021 (all dollar amounts in thousands) (unaudited)
Issuer Value
Total Investments—96.6%(cost $717) 1,188
Cash and other assets, less liabilities—3.4% 42
Net assets—100.0% $ 1,230
* = Non-income producing security† = U.S. listed foreign security
See accompanying Notes to Portfolio of Investments. 15

Small Cap Growth Fund
Portfolio of Investments, March 31, 2021 (all dollar amounts in thousands) (unaudited)
Issuer Shares Value
Common Stocks
Information Technology—23.8%* Alarm.com Holdings, Inc. 97,620 $ 8,432
American Software, Inc. 273,100 5,653Brooks Automation, Inc. 140,595 11,480
* BTRS Holdings, Inc. 346,540 5,014CMC Materials, Inc. 39,230 6,935Computer Services, Inc. 111,509 6,579
* Euronet Worldwide, Inc. 60,170 8,322* Grid Dynamics Holdings, Inc. 826,965 13,174* j2 Global, Inc. 86,153 10,326* Knowles Corporation 292,570 6,121
Littelfuse, Inc. 28,313 7,487* LivePerson, Inc. 108,327 5,713* LiveRamp Holdings, Inc. 155,720 8,079* Novanta, Inc.† 38,930 5,134* PAR Technology Corporation 30,570 2,000* PDF Solutions, Inc. 218,872 3,892* PROS Holdings, Inc. 112,070 4,763* Pure Storage, Inc. 395,466 8,518* SiTime Corporation 40,935 4,036* Upland Software, Inc. 175,480 8,281* Varonis Systems, Inc. 139,710 7,173* Verra Mobility Corporation 719,159 9,734* Vertex, Inc. 151,243 3,324* WNS Holdings, Ltd.—ADR 138,612 10,041
170,211
Health Care—23.2%* Acadia Healthcare Co., Inc. 185,919 10,623* Aerie Pharmaceuticals, Inc. 469,851 8,396* Amicus Therapeutics, Inc. 332,980 3,290* AxoGen, Inc. 420,270 8,515* Blueprint Medicines Corporation 53,380 5,190* Butterfly Network, Inc. 188,029 3,165* CareDx, Inc. 99,357 6,765* Certara, Inc. 322,864 8,814* Codexis, Inc. 412,808 9,449* CryoLife, Inc. 273,252 6,170
Encompass Health Corporation 80,571 6,599* Halozyme Therapeutics, Inc. 156,900 6,541* Hanger, Inc. 435,520 9,939* Health Catalyst, Inc. 234,378 10,962* HealthEquity, Inc. 99,865 6,791* Insmed, Inc. 253,640 8,639* LHC Group, Inc. 39,433 7,540* Ligand Pharmaceuticals, Inc. 55,148 8,407* Merit Medical Systems, Inc. 176,660 10,578* Twist Bioscience Corporation 22,766 2,820
US Physical Therapy, Inc. 53,557 5,575* Veracyte, Inc. 149,230 8,021* Vericel Corporation 68,460 3,803
166,592
Industrials—23.0%Albany International Corporation 103,225 8,616
See accompanying Notes to Portfolio of Investments. 16

Small Cap Growth Fund
Portfolio of Investments, March 31, 2021 (all dollar amounts in thousands) (unaudited)
Issuer Shares Value
Common Stocks—(continued)
Industrials — (continued)* Builders FirstSource, Inc. 138,030 $ 6,400
BWX Technologies, Inc. 235,939 15,558* Casella Waste Systems, Inc. 189,050 12,018
Douglas Dynamics, Inc. 171,383 7,909* Ducommun, Inc. 266,059 15,964* Energy Recovery, Inc. 295,816 5,425
ESCO Technologies, Inc. 53,976 5,877* Forrester Research, Inc. 147,879 6,282* IAA, Inc. 101,750 5,610* Kornit Digital, Ltd.† 61,350 6,081
Lincoln Electric Holdings, Inc. 51,320 6,309Luxfer Holdings plc† 485,926 10,341
* Mercury Systems, Inc. 95,736 6,764* Montrose Environmental Group, Inc. 222,468 11,166* PAE, Inc. 1,004,938 9,065
Ritchie Bros Auctioneers, Inc.† 144,815 8,479The Brink’s Co. 210,136 16,649
164,513
Consumer Discretionary—11.7%* Boot Barn Holdings, Inc. 193,064 12,030
Dine Brands Global, Inc. 77,270 6,956* Grand Canyon Education, Inc. 110,772 11,864
Lithia Motors, Inc. 13,569 5,293* National Vision Holdings, Inc. 161,028 7,058* Porch Group, Inc. 477,048 8,444* Revolve Group, Inc. 200,933 9,028* Rush Street Interactive, Inc. 468,050 7,648* Skyline Champion Corporation 221,490 10,025
Winmark Corporation 28,310 5,27883,624
Financials—7.4%* Encore Capital Group, Inc. 207,803 8,360
FirstCash, Inc. 151,738 9,965Home BancShares, Inc. 332,388 8,991LPL Financial Holdings, Inc. 61,640 8,763
* Open Lending Corporation 173,507 6,146* Star Peak Energy Transition Corporation 264,224 7,023* Vesper Healthcare Acquisition Corporation 324,310 3,502
52,750
Energy—2.6%Cameco Corporation† 690,430 11,468
* Denbury, Inc. 148,699 7,12118,589
Real Estate—2.0%Colliers International Group, Inc.† 69,098 6,788
See accompanying Notes to Portfolio of Investments. 17
Small Cap Growth Fund
Portfolio of Investments, March 31, 2021 (all dollar amounts in thousands) (unaudited)
Issuer
Shares orPrincipalAmount Value
Common Stocks—(continued)
Real Estate — (continued)FirstService Corporation† 51,757 $ 7,670
14,458
Materials—1.4%Orion Engineered Carbons S.A.† 525,037 10,354
Communication Services—1.4%* QuinStreet, Inc. 509,075 10,334
Consumer Staples—1.0%* BJ’s Wholesale Club Holdings, Inc. 166,340 7,462
Total Common Stocks—97.5%(cost $482,718) 698,887
Exchange-Traded Funds
Exchange-Traded Fund—1.0%iShares Russell 2000 Growth ETF 23,170 6,968
Total Exchange-Traded Fund—1.0%(cost $7,237) 6,968
Repurchase AgreementFixed Income Clearing Corporation, 0.000% dated 3/31/21, due 4/1/21, repurchase price $11,492, collateralized by U.S. Treasury
Bond, 2.000%, due 2/15/50, valued at $11,722 $ 11,492 11,492
Total Repurchase Agreement—1.6%(cost $11,492) 11,492
Total Investments—100.1%(cost $501,447) 717,347
Liabilities, plus cash and other assets—(0.1)% (918)
Net assets—100.0% $ 716,429
ADR = American Depository Receipt* = Non-income producing security† = U.S. listed foreign security
See accompanying Notes to Portfolio of Investments. 18

Small Cap Value Fund
Portfolio of Investments, March 31, 2021 (all dollar amounts in thousands) (unaudited)
Issuer Shares Value
Common Stocks
Financials—28.6%Banc of California, Inc. 20,003 $ 362Banner Corporation 9,469 505Boston Private Financial Holdings, Inc. 28,967 386Cadence BanCorp 28,751 596CNO Financial Group, Inc. 28,199 685First American Financial Corporation 7,876 446FNB Corporation 50,304 639Glacier Bancorp, Inc. 13,119 749Hancock Whitney Corporation 22,279 936Home BancShares, Inc. 34,132 923Horace Mann Educators Corporation 12,236 529National Bank Holdings Corporation 14,435 573OceanFirst Financial Corporation 20,829 498PacWest Bancorp 18,289 698Radian Group, Inc. 35,039 815Renasant Corporation 14,077 582Sandy Spring Bancorp, Inc. 14,612 634
* Seacoast Banking Corporation of Florida 20,907 758Selective Insurance Group, Inc. 11,470 832The Hanover Insurance Group, Inc. 5,035 652Umpqua Holdings Corporation 35,231 618Western Alliance Bancorp 11,653 1,100
14,516
Industrials—16.6%Alamo Group, Inc. 1,500 234Brady Corporation 18,894 1,010
* Chart Industries, Inc. 5,360 763Curtiss-Wright Corporation 6,768 803ESCO Technologies, Inc. 4,320 470Federal Signal Corporation 9,306 356
* FTI Consulting, Inc. 4,930 691* Gibraltar Industries, Inc. 10,605 971
Rexnord Corporation 11,275 531* Saia, Inc. 2,449 565
Simpson Manufacturing Co., Inc. 5,152 534UniFirst Corporation 3,160 707Watts Water Technologies, Inc. 6,524 775
8,410
Consumer Discretionary—11.2%Carter’s, Inc. 5,892 524
* Cavco Industries, Inc. 1,607 363Churchill Downs, Inc. 2,670 607
* Deckers Outdoor Corporation 2,641 873* Helen of Troy, Ltd.† 3,202 674
KB Home 10,245 477* Monarch Casino & Resort, Inc. 10,418 632
Murphy USA, Inc. 4,700 679* TopBuild Corporation 4,156 870
5,699
Real Estate—7.6%Acadia Realty Trust 15,080 286
See accompanying Notes to Portfolio of Investments. 19

Small Cap Value Fund
Portfolio of Investments, March 31, 2021 (all dollar amounts in thousands) (unaudited)
Issuer Shares Value
Common Stocks—(continued)
Real Estate — (continued)Agree Realty Corporation 8,233 $ 554American Assets Trust, Inc. 15,814 513CoreSite Realty Corporation 2,516 301Healthcare Realty Trust, Inc. 19,946 605Highwoods Properties, Inc. 12,925 555Life Storage, Inc. 6,407 551Terreno Realty Corporation 8,775 507
3,872
Health Care—6.4%* Allscripts Healthcare Solutions, Inc. 14,365 216* Avanos Medical, Inc. 7,300 319
CONMED Corporation 7,832 1,023Encompass Health Corporation 10,623 870
* Integer Holdings Corporation 8,881 8183,246
Materials—5.8%Avient Corporation 13,587 642Carpenter Technology Corporation 12,915 531Minerals Technologies, Inc. 8,455 637Sensient Technologies Corporation 6,682 521Silgan Holdings, Inc. 14,837 624
2,955
Information Technology—5.5%Belden, Inc. 10,520 467
* j2 Global, Inc. 4,741 568* LiveRamp Holdings, Inc. 7,712 400
MAXIMUS, Inc. 6,394 569* Semtech Corporation 3,005 208* Viavi Solutions, Inc. 38,084 598
2,810
Energy—5.1%Archrock, Inc. 47,098 447Brigham Minerals, Inc. 26,344 386Cactus, Inc. 7,812 239
* CNX Resources Corporation 39,287 578HollyFrontier Corporation 8,609 308
* PDC Energy, Inc. 18,122 6232,581
Consumer Staples—4.9%* BJ’s Wholesale Club Holdings, Inc. 8,173 366
Casey’s General Stores, Inc. 2,442 528* Darling Ingredients, Inc. 14,076 1,036
J&J Snack Foods Corporation 3,373 5302,460
Utilities—4.3%Black Hills Corporation 8,632 576Chesapeake Utilities Corporation 4,140 480IDACORP, Inc. 5,068 507
See accompanying Notes to Portfolio of Investments. 20

Small Cap Value Fund
Portfolio of Investments, March 31, 2021 (all dollar amounts in thousands) (unaudited)
Issuer
Shares orPrincipalAmount Value
Common Stocks—(continued)
Utilities — (continued)ONE Gas, Inc. 7,994 $ 615
2,178
Communication Services—2.1%John Wiley & Sons, Inc. 6,825 370Nexstar Media Group, Inc. 2,515 360
* QuinStreet, Inc. 17,448 3541,084
Total Common Stocks—98.1%(cost $31,915) 49,811
Repurchase AgreementFixed Income Clearing Corporation, 0.000% dated 3/31/21, due 4/1/21, repurchase price $1,129, collateralized by U.S. Treasury Note,
2.250%, due 11/15/27, valued at $1,151 $ 1,129 1,129
Total Repurchase Agreement—2.2%(cost $1,129) 1,129
Total Investments—100.3%(cost $33,044) 50,940
Liabilities, plus cash and other assets—(0.3)% (168)
Net assets—100.0% $ 50,772
* = Non-income producing security† = U.S. listed foreign security
See accompanying Notes to Portfolio of Investments. 21
Global Leaders Fund
Portfolio of Investments, March 31, 2021 (all dollar amounts in thousands) (unaudited)
Issuer Shares Value
Common Stocks
Western Hemisphere—48.5%
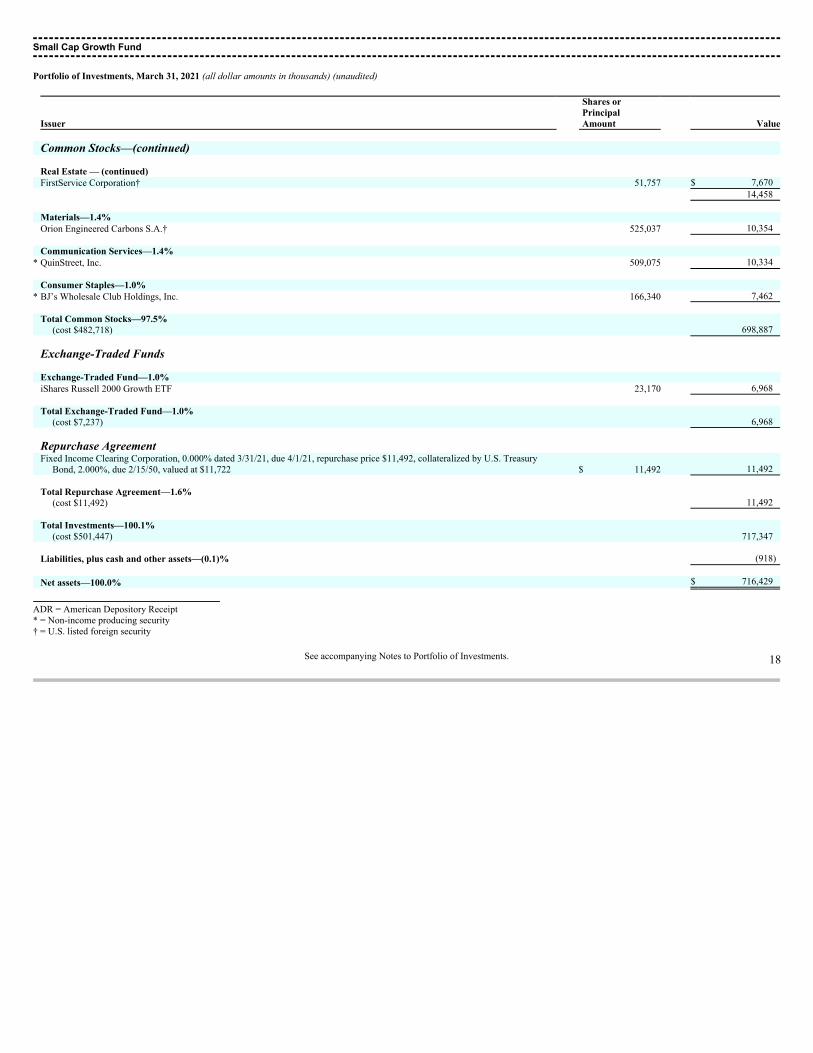
Canada—1.2%* Lululemon Athletica, Inc. (Textiles, apparel & luxury goods) 4,932 $ 1,512
United States—47.3%* Adobe, Inc. (Software) 3,154 1,499* Alphabet, Inc. Class “A” (Interactive Media & Services) 1,795 3,702* Amazon.com, Inc. (Internet & direct marketing retail) 1,109 3,431
BlackRock, Inc. (Capital markets) 2,600 1,960* Charles River Laboratories International, Inc. (Life sciences tools & services) 6,662 1,931* CoStar Group, Inc. (Professional services) 1,478 1,215
Ecolab, Inc. (Chemicals) 5,420 1,160* Edwards Lifesciences Corporation (Health care equipment & supplies) 15,123 1,265* Facebook, Inc. Class “A” (Interactive Media & Services) 9,902 2,916
Fidelity National Information Services, Inc. (IT services) 11,952 1,681* IDEXX Laboratories, Inc. (Health care equipment & supplies) 3,136 1,535
Intercontinental Exchange, Inc. (Capital markets) 14,678 1,639* Intuitive Surgical, Inc. (Health care equipment & supplies) 1,628 1,203
Lockheed Martin Corporation (Aerospace & defense) 5,719 2,113Mastercard, Inc. Class “A” (IT services) 9,355 3,331Microsoft Corporation (Software) 12,888 3,039NextEra Energy, Inc. (Electric utilities) 14,506 1,097NIKE, Inc. Class “B” (Textiles, apparel & luxury goods) 14,059 1,868
* PayPal Holdings, Inc. (IT services) 8,939 2,171Prologis, Inc. (Equity REIT) 10,967 1,163Roper Technologies, Inc. (Industrial conglomerates) 3,916 1,580
* salesforce.com, Inc. (Software) 12,167 2,578The Estee Lauder Cos., Inc. Class “A” (Personal products) 6,994 2,034Thermo Fisher Scientific, Inc. (Life sciences tools & services) 3,831 1,748
* Ulta Beauty, Inc. (Specialty retail) 7,661 2,369Union Pacific Corporation (Road & rail) 9,642 2,125UnitedHealth Group, Inc. (Health care providers & services) 6,293 2,341
* Veeva Systems, Inc. Class “A” (Health care technology) 2,981 779* Workday, Inc. Class “A” (Software) 7,829 1,945
Zoetis, Inc. (Pharmaceuticals) 9,788 1,54158,959
Europe—25.5%
Denmark—3.7%* Chr Hansen Holding A/S (Chemicals) 10,199 927
DSV PANALPINA A/S (Air freight & logistics) 11,252 2,208Novo Nordisk A/S Class “B” (Pharmaceuticals) 20,933 1,418
4,553
France—4.2%* Airbus SE (Aerospace & defense) 27,118 3,070
LVMH Moet Hennessy Louis Vuitton SE (Textiles, apparel & luxury goods) 3,323 2,2145,284
Germany—4.8%Infineon Technologies AG (Semiconductors & semiconductor equipment) 76,055 3,225MTU Aero Engines AG (Aerospace & defense) 8,741 2,057
See accompanying Notes to Portfolio of Investments. 22

Global Leaders Fund
Portfolio of Investments, March 31, 2021 (all dollar amounts in thousands) (unaudited)
Issuer Shares Value
Common Stocks—(continued)
Europe—(continued)
Germany — (continued)Rational AG (Machinery) 878 $ 682
5,964
Ireland—3.2%Allegion plc (Building products)† 7,573 951
* Aptiv plc (Auto components)† 15,580 2,149* Ryanair Holdings plc—ADR (Airlines) 7,958 915
4,015
Netherlands—1.0%* Adyen N.V. (IT services) 577 1,288
Sweden—5.6%Atlas Copco AB Class “A” (Machinery) 39,825 2,424Evolution Gaming Group AB (Hotels, restaurants & leisure) 7,091 1,044Hexagon AB Class “B” (Electronic equipment, instruments & components) 27,677 2,553
* Indutrade AB (Trading companies & distributors) 41,640 9616,982
Switzerland—3.0%Lonza Group AG (Life sciences tools & services) 2,760 1,543Partners Group Holding AG (Capital markets) 1,685 2,152
3,695
Emerging Asia—9.0%
China—4.8%* Alibaba Group Holding, Ltd. (Internet & direct marketing retail) 89,844 2,542
Shenzhou International Group Holdings, Ltd. (Textiles, apparel & luxury goods) 48,300 1,001Tencent Holdings, Ltd. (Interactive Media & Services) 30,300 2,378
5,921
India—1.7%* HDFC Bank, Ltd.—ADR (Banks) 27,718 2,153
Taiwan—2.5%Taiwan Semiconductor Manufacturing Co., Ltd.—ADR (Semiconductors & semiconductor equipment) 26,463 3,130
Asia—5.5%
Australia—3.5%Aristocrat Leisure, Ltd. (Hotels, restaurants & leisure) 76,791 2,003
* Atlassian Corporation plc Class “A” (Software)† 4,895 1,032CSL, Ltd. (Biotechnology) 6,313 1,269
4,304
Hong Kong—1.6%AIA Group, Ltd. (Insurance) 166,400 2,019
New Zealand—0.4%Fisher & Paykel Healthcare Corp., Ltd. (Health care equipment & supplies) 23,737 532
See accompanying Notes to Portfolio of Investments. 23

Global Leaders Fund
Portfolio of Investments, March 31, 2021 (all dollar amounts in thousands) (unaudited)
Issuer
Shares orPrincipalAmount Value
Common Stocks—(continued)
Japan—5.4%Daikin Industries, Ltd. (Building products) 9,500 $ 1,915Keyence Corporation (Electronic equipment, instruments & components) 3,400 1,544Nihon M&A Center, Inc. (Professional services) 70,400 1,903SMC Corporation (Machinery) 2,400 1,394
6,756
United Kingdom—3.7%* Compass Group plc (Hotels, restaurants & leisure) 118,004 2,378
Experian plc (Professional services) 27,015 930Halma plc (Electronic equipment, instruments & components) 15,396 504
* Rentokil Initial plc (Commercial services & supplies) 114,297 7634,575
Emerging Latin America—1.6%
Argentina—1.6%* Globant S.A. (IT services)† 5,662 1,175* MercadoLibre, Inc. (Internet & direct marketing retail) 586 863
2,038
Total Common Stocks—99.2%(cost $69,334) 123,680
Repurchase AgreementFixed Income Clearing Corporation, 0.000% dated 3/31/21, due 4/1/21, repurchase price $1,613, collateralized by U.S. Treasury Note,
2.250%, due 11/15/27, valued at $1,645 $ 1,613 1,613
Total Repurchase Agreement—1.3%(cost $1,613) 1,613
Total Investments—100.5%(cost $70,947) 125,293
Liabilities, plus cash and other assets—(0.5)% (651)
Net assets—100.0% $ 124,642
ADR = American Depository ReceiptREIT = Real Estate Investment Trust* = Non-income producing security† = U.S. listed foreign security
See accompanying Notes to Portfolio of Investments. 24

Global Leaders Fund
Portfolio of Investments, March 31, 2021 (unaudited)
At March 31, 2021, the Fund’s Portfolio of Investments includes the following industry categories (as a percentage of long-term investments):
Information Technology 24.9%Industrials 22.0%Consumer Discretionary 18.9%Health Care 13.8%Financials 8.0%Communication Services 7.3%Materials 1.7%Consumer Staples 1.6%Real Estate 0.9%Utilities 0.9%Total 100.0%
At March 31, 2021, the Fund’s Portfolio of Investments includes the following currency categories (as a percentage of long-term investments):
U.S. Dollar 58.9%Euro 10.1%Hong Kong Dollar 6.4%Swedish Krona 5.6%Japanese Yen 5.5%British Pound Sterling 3.7%Danish Krone 3.7%Swiss Franc 3.0%Australian Dollar 2.7%All Other Currencies 0.4%Total 100.0%
See accompanying Notes to Portfolio of Investments. 25

International Leaders Fund
Portfolio of Investments, March 31, 2021 (all dollar amounts in thousands) (unaudited)
Issuer Shares Value
Common Stocks
Europe—47.8%
Denmark—5.9%* Chr Hansen Holding A/S (Chemicals) 42,935 $ 3,902
Coloplast A/S Class “B” (Health care equipment & supplies) 106,396 15,998DSV PANALPINA A/S (Air freight & logistics) 76,201 14,950Novo Nordisk A/S Class “B” (Pharmaceuticals) 255,441 17,306Orsted A/S (Electric utilities) 90,211 14,570
66,726
Finland—1.3%Neste Oyj (Oil, gas & consumable fuels) 281,691 14,951
France—12.5%* Airbus SE (Aerospace & defense) 280,858 31,797
L’Oreal S.A. (Personal products) 44,365 17,002LVMH Moet Hennessy Louis Vuitton SE (Textiles, apparel & luxury goods) 58,379 38,893
* Safran S.A. (Aerospace & defense) 205,629 27,984Sartorius Stedim Biotech (Life sciences tools & services) 33,596 13,837Teleperformance (Professional services) 32,763 11,941
141,454
Germany—4.1%Infineon Technologies AG (Semiconductors & semiconductor equipment) 644,173 27,312Rational AG (Machinery) 16,743 13,008
* TeamViewer AG (Software) 156,395 6,68147,001
Ireland—2.8%Kingspan Group plc (Building products) 224,480 19,033
* Ryanair Holdings plc—ADR (Airlines) 115,495 13,28232,315
Netherlands—4.1%* Adyen N.V. (IT services) 9,511 21,231
ASML Holding N.V. (Semiconductors & semiconductor equipment) 42,307 25,65046,881
Norway—0.9%TOMRA Systems ASA (Commercial services & supplies) 224,019 9,699
Spain—2.0%* Amadeus IT Group S.A. (IT services) 316,888 22,438
Sweden—5.4%Atlas Copco AB Class “A” (Machinery) 413,698 25,181Hexagon AB Class “B” (Electronic equipment, instruments & components) 260,462 24,026Nibe Industrier AB Class “B” (Building products) 384,109 11,910
61,117
Switzerland—8.8%Lonza Group AG (Life sciences tools & services) 39,115 21,868Partners Group Holding AG (Capital markets) 16,134 20,604Sika AG (Chemicals) 62,187 17,765Straumann Holding AG (Health care equipment & supplies) 20,420 25,472
See accompanying Notes to Portfolio of Investments. 26

International Leaders Fund
Portfolio of Investments, March 31, 2021 (all dollar amounts in thousands) (unaudited)
Issuer Shares Value
Common Stocks—(continued)
Europe—47.8%—(continued)
Switzerland — (continued)Temenos AG (Software) 94,916 $ 13,663
99,372
Emerging Asia—18.2%
China—10.2%* Alibaba Group Holding, Ltd. (Internet & direct marketing retail) 980,356 27,743
Foshan Haitian Flavouring & Food Co., Ltd. Class “A” (Food products) 385,287 9,393Kweichow Moutai Co., Ltd. Class “A” (Beverages) 44,500 13,639NetEase, Inc. (Entertainment) 988,975 20,125
* TAL Education Group—ADR (Diversified consumer services) 291,409 15,692Tencent Holdings, Ltd. (Interactive Media & Services) 379,700 29,793
116,385
India—4.2%Housing Development Finance Corporation, Ltd. (Thrifts & mortgage finance) 658,438 22,551Reliance Industries, Ltd. (Oil, gas & consumable fuels) 941,048 25,253
47,804
Taiwan—2.8%Taiwan Semiconductor Manufacturing Co., Ltd. (Semiconductors & semiconductor equipment) 1,546,000 31,805
Thailand—1.0%* Sea, Ltd.—ADR (Entertainment) 49,786 11,114
United Kingdom—12.4%Ashtead Group plc (Trading companies & distributors) 508,416 30,328
* Compass Group plc (Hotels, restaurants & leisure) 685,497 13,811Experian plc (Professional services) 523,068 18,006Halma plc (Electronic equipment, instruments & components) 318,738 10,432London Stock Exchange Group plc (Capital markets) 192,190 18,388
* Rentokil Initial plc (Commercial services & supplies) 1,690,104 11,286Segro plc (Equity REIT) 1,139,102 14,724Spirax-Sarco Engineering plc (Machinery) 76,782 12,067
* Trainline plc (Internet & direct marketing retail) 1,852,900 11,725140,767
Japan—9.0%Asahi Intecc Co., Ltd. (Health care equipment & supplies) 233,500 6,432Daikin Industries, Ltd. (Building products) 101,400 20,440Hoya Corporation (Health care equipment & supplies) 150,200 17,642Keyence Corporation (Electronic equipment, instruments & components) 47,500 21,565M3, Inc. (Health care technology) 92,800 6,345Nihon M&A Center, Inc. (Professional services) 388,200 10,494SMC Corporation (Machinery) 32,300 18,760
101,678
Asia—6.5%
Australia—3.8%Aristocrat Leisure, Ltd. (Hotels, restaurants & leisure) 722,675 18,855
* Atlassian Corporation plc Class “A” (Software)† 42,467 8,950
See accompanying Notes to Portfolio of Investments. 27

International Leaders Fund
Portfolio of Investments, March 31, 2021 (all dollar amounts in thousands) (unaudited)
Issuer
Shares orPrincipalAmount Value
Common Stocks—(continued)
Asia—6.5%—(continued)
Australia — (continued)CSL, Ltd. (Biotechnology) 77,905 $ 15,660
43,465
Hong Kong—1.9%AIA Group, Ltd. (Insurance) 1,784,800 21,650
New Zealand—0.8%Fisher & Paykel Healthcare Corp., Ltd. (Health care equipment & supplies) 393,833 8,829
Canada—3.4%Canadian National Railway Co. (Road & rail) 226,752 26,315
* Lululemon Athletica, Inc. (Textiles, apparel & luxury goods) 39,009 11,96438,279
Emerging Latin America—1.2%
Argentina—1.2%* MercadoLibre, Inc. (Internet & direct marketing retail) 9,193 13,534
Total Common Stocks—98.5%(cost $814,433) 1,117,264
Repurchase AgreementFixed Income Clearing Corporation, 0.000% dated 3/31/21, due 4/1/21, repurchase price $18,773, collateralized by U.S. Treasury
Note, 2.250%, due 11/15/27, valued at $19,149 $ 18,773 18,773
Total Repurchase Agreement—1.7%(cost $18,773) 18,773
Total Investments—100.2%(cost $833,206) 1,136,037
Liabilities, plus cash and other assets—(0.2)% (2,121)
Net assets—100.0% $ 1,133,916
ADR = American Depository ReceiptREIT = Real Estate Investment Trust* = Non-income producing security† = U.S. listed foreign security
See accompanying Notes to Portfolio of Investments. 28
International Leaders Fund
Portfolio of Investments, March 31, 2021 (unaudited)
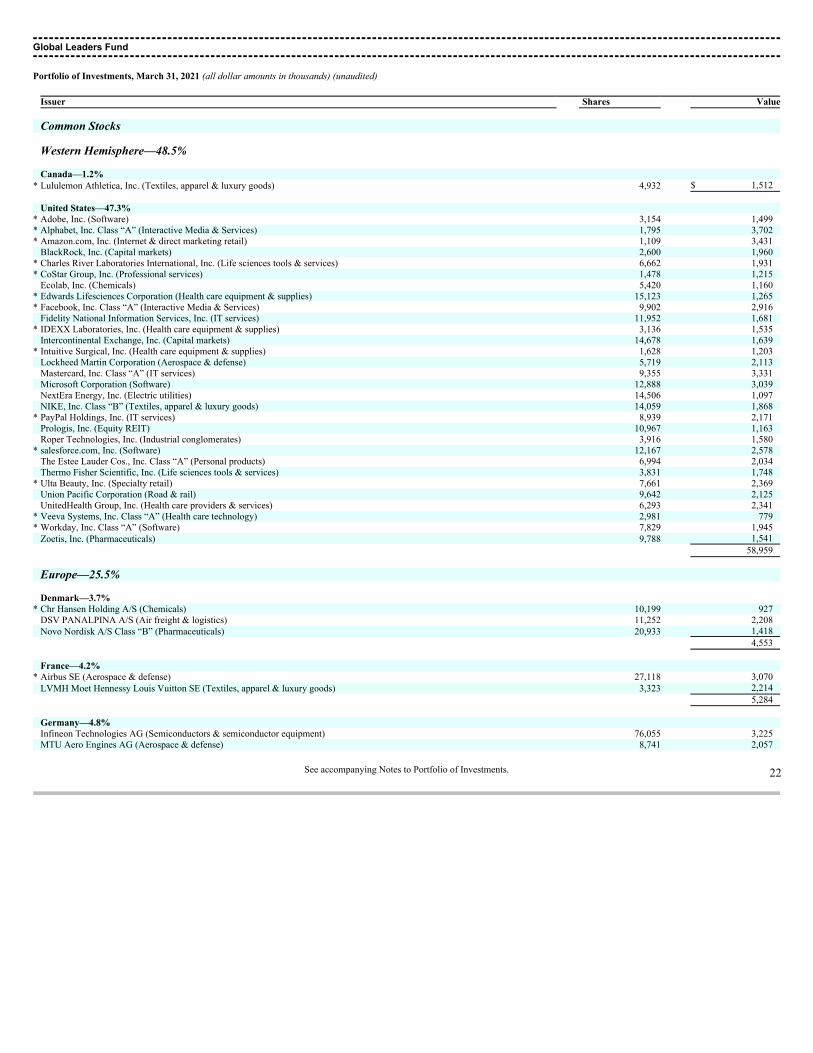
At March 31, 2021, the Fund’s Portfolio of Investments includes the following industry categories (as a percentage of long-term investments):
Industrials 29.3%Information Technology 19.1%Consumer Discretionary 13.6%Health Care 13.4%Financials 7.4%Communication Services 5.5%Energy 3.6%Consumer Staples 3.6%Materials 1.9%Real Estate 1.3%Utilities 1.3%Total 100.0%
At March 31, 2021, the Fund’s Portfolio of Investments includes the following currency categories (as a percentage of long-term investments):
Euro 26.1%British Pound Sterling 12.6%Japanese Yen 9.1%Swiss Franc 8.9%Hong Kong Dollar 8.9%U.S. Dollar 6.7%Danish Krone 6.0%Swedish Krona 5.5%Indian Rupee 4.3%Australian Dollar 3.1%New Taiwan Dollar 2.8%Canadian Dollar 2.3%Chinese Yuan Renminbi 2.1%All Other Currencies 1.6%Total 100.0%
See accompanying Notes to Portfolio of Investments. 29

International Growth Fund
Portfolio of Investments, March 31, 2021 (all dollar amounts in thousands) (unaudited)
Issuer Shares Value
Common Stocks
Europe, Mid-East—44.8%
Belgium—0.3%Warehouses De Pauw CVA (Equity REIT) 171,498 $ 5,668
Denmark—4.2%* Chr Hansen Holding A/S (Chemicals) 70,240 6,383
Coloplast A/S Class “B” (Health care equipment & supplies) 61,189 9,201DSV PANALPINA A/S (Air freight & logistics) 211,712 41,536
* Genmab A/S (Biotechnology) 38,643 12,714Netcompany Group A/S (Software) 53,626 5,106Orsted A/S (Electric utilities) 88,345 14,269Royal Unibrew A/S (Beverages) 40,637 4,250
93,459
Finland—0.9%Neste Oyj (Oil, gas & consumable fuels) 368,994 19,585
France—9.9%* Airbus SE (Aerospace & defense) 321,821 36,434
Dassault Systemes SE (Software) 80,796 17,282Hermes International (Textiles, apparel & luxury goods) 8,444 9,348Kering S.A. (Textiles, apparel & luxury goods) 37,777 26,076L’Oreal S.A. (Personal products) 56,516 21,659LVMH Moet Hennessy Louis Vuitton SE (Textiles, apparel & luxury goods) 52,011 34,650
* Safran S.A. (Aerospace & defense) 197,989 26,945Sartorius Stedim Biotech (Life sciences tools & services) 23,672 9,749Teleperformance (Professional services) 75,311 27,449
* Worldline S.A. (IT services) 103,925 8,707218,299
Germany—6.1%Carl Zeiss Meditec AG (Health care equipment & supplies) 57,857 8,719CompuGroup Medical SE & Co. KgaA (Health care technology) 60,951 5,150
* CTS Eventim AG & Co. KGaA (Entertainment) 99,408 5,763* HelloFresh SE (Internet & direct marketing retail) 145,012 10,816* Hypoport SE (Diversified financial services) 6,761 3,584
Infineon Technologies AG (Semiconductors & semiconductor equipment) 607,165 25,743KION Group AG (Machinery) 88,995 8,787MTU Aero Engines AG (Aerospace & defense) 128,967 30,354Nemetschek SE (Software) 51,764 3,302
* Puma SE (Textiles, apparel & luxury goods) 155,069 15,192* TeamViewer AG (Software) 105,093 4,490
Vonovia SE (Real estate management & development) 194,712 12,718134,618
Ireland—2.1%* ICON plc (Life sciences tools & services)† 68,200 13,392
Kingspan Group plc (Building products) 185,415 15,721* Ryanair Holdings plc—ADR (Airlines) 141,201 16,238
45,351
Israel—1.0%* CyberArk Software, Ltd. (Software)† 36,261 4,690* Inmode, Ltd. (Health care equipment & supplies)† 54,244 3,926
See accompanying Notes to Portfolio of Investments. 30

International Growth Fund
Portfolio of Investments, March 31, 2021 (all dollar amounts in thousands) (unaudited)
Issuer Shares Value
Common Stocks—(continued)
Europe, Mid-East—(continued)
Israel — (continued)* Wix.com, Ltd. (IT services)† 48,870 $ 13,645
22,261
Italy—0.6%* Amplifon SpA (Health care providers & services) 131,617 4,899* Brunello Cucinelli SpA (Textiles, apparel & luxury goods) 77,383 3,327* Moncler SpA (Textiles, apparel & luxury goods) 93,973 5,385
13,611
Luxembourg—0.6%* Eurofins Scientific SE (Life sciences tools & services) 144,572 13,819
Netherlands—3.7%* Adyen N.V. (IT services) 10,740 23,974
ASML Holding N.V. (Semiconductors & semiconductor equipment) 69,920 42,391BE Semiconductor Industries N.V. (Semiconductors & semiconductor equipment) 79,698 6,677Euronext N.V. (Capital markets) 41,143 4,145IMCD N.V. (Trading companies & distributors) 41,205 5,726
82,913
Norway—0.7%* Pexip Holding ASA (Software) 277,211 3,101
Scatec ASA (Independent power & renewable electricity producers) 138,861 4,199TOMRA Systems ASA (Commercial services & supplies) 185,982 8,052
15,352
Spain—1.8%* Amadeus IT Group S.A. (IT services) 416,424 29,486
EDP Renovaveis S.A. (Independent power & renewable electricity producers) 371,013 7,927* Solaria Energia y Medio Ambiente S.A. (Independent power & renewable electricity producers) 146,063 3,097
40,510
Sweden—6.1%AddTech AB Class “B” (Trading companies & distributors) 232,031 3,454Atlas Copco AB Class “A” (Machinery) 669,908 40,777Beijer Ref AB (Trading companies & distributors) 113,997 5,010Evolution Gaming Group AB (Hotels, restaurants & leisure) 126,974 18,697Hexagon AB Class “B” (Electronic equipment, instruments & components) 265,659 24,505
* Indutrade AB (Trading companies & distributors) 370,878 8,561Investment AB Latour Class “B” (Industrial conglomerates) 227,700 5,897Lifco AB Class “B” (Industrial conglomerates) 57,809 5,375Nibe Industrier AB Class “B” (Building products) 228,109 7,073
* Nolato AB Class “B” (Industrial conglomerates) 51,130 4,555Sweco AB Class “B” (Construction & engineering) 230,834 3,769
* Thule Group AB (Leisure products) 102,311 4,442* Vitrolife AB (Biotechnology) 94,762 2,782
134,897
Switzerland—6.8%Belimo Holding AG (Building products) 487 3,937Logitech International S.A. (Technology hardware, storage & peripherals) 77,937 8,175
See accompanying Notes to Portfolio of Investments. 31

International Growth Fund
Portfolio of Investments, March 31, 2021 (all dollar amounts in thousands) (unaudited)
Issuer Shares Value
Common Stocks—(continued)
Europe, Mid-East—(continued)
Switzerland — (continued)Lonza Group AG (Life sciences tools & services) 42,691 $ 23,867Partners Group Holding AG (Capital markets) 19,227 24,554
* Siegfried Holding AG (Life sciences tools & services) 6,235 5,136* SIG Combibloc Group AG (Containers & packaging) 289,848 6,704
Sika AG (Chemicals) 123,232 35,204Softwareone Holding AG (Electronic equipment, instruments & components) 143,260 3,698Straumann Holding AG (Health care equipment & supplies) 13,278 16,563Tecan Group AG (Life sciences tools & services) 13,310 5,906Temenos AG (Software) 46,889 6,749VAT Group AG (Machinery) 24,536 6,874
* Zur Rose Group AG (Food & staples retailing) 9,841 3,696151,063
Emerging Asia—23.6%
China—12.6%A-Living Smart City Services Co., Ltd. Class “H” (Commercial services & supplies) 670,750 2,977Aier Eye Hospital Group Co., Ltd. Class “A” (Health care providers & services) 753,416 6,810AK Medical Holdings, Ltd. (Health care equipment & supplies) 782,000 996
* Alibaba Group Holding, Ltd. (Internet & direct marketing retail) 1,061,084 30,028Centre Testing International Group Co., Ltd. Class “A” (Professional services) 1,200,800 5,221Chacha Food Co., Ltd. Class “A” (Food products) 435,242 3,254Country Garden Services Holdings Co., Ltd. (Commercial services & supplies) 838,000 8,494Foshan Haitian Flavouring & Food Co., Ltd. Class “A” (Food products) 308,059 7,510Hangzhou Tigermed Consulting Co., Ltd. Class “A” (Life sciences tools & services) 347,270 7,952
* JD.com, Inc. Class “A” (Internet & direct marketing retail) 308,250 12,767Kweichow Moutai Co., Ltd. Class “A” (Beverages) 28,353 8,690Li Ning Co., Ltd. (Textiles, apparel & luxury goods) 2,020,000 13,122
* Meituan Class “B” (Internet & direct marketing retail) 337,200 12,934NAURA Technology Group Co., Ltd. Class “A” (Semiconductors & semiconductor equipment) 166,113 3,637NetEase, Inc. (Entertainment) 689,725 14,036Offcn Education Technology Co., Ltd. Class “A” (Diversified consumer services) 883,921 3,799Ping An Insurance Group Co. of China, Ltd. Class “H” (Insurance) 2,532,000 30,143Proya Cosmetics Co., Ltd. Class “A” (Personal products) 164,999 4,011Shenzhen Mindray Bio-Medical Electronics Co., Ltd. Class “A” (Health care equipment & supplies) 92,750 5,647Silergy Corporation (Semiconductors & semiconductor equipment) 78,000 6,301
* TAL Education Group—ADR (Diversified consumer services) 177,289 9,547Tencent Holdings, Ltd. (Interactive Media & Services) 446,700 35,051
* Tencent Music Entertainment Group—ADR (Entertainment) 231,518 4,744* Topchoice Medical Corporation Class “A” (Health care providers & services) 165,539 6,326* Venus MedTech Hangzhou, Inc. Class “H” (Health care equipment & supplies) 406,500 3,297* Weimob, Inc. (Software) 1,409,000 3,150
Will Semiconductor Co., Ltd. Shanghai Class “A” (Semiconductors & semiconductor equipment) 77,077 3,019WuXi AppTec Co., Ltd. Class “A” (Life sciences tools & services) 271,414 5,805
* Wuxi Biologics Cayman, Inc. (Life sciences tools & services) 1,543,500 19,328278,596
India—4.0%Crompton Greaves Consumer Electricals, Ltd. (Household durables) 801,058 4,239Dr. Lal PathLabs, Ltd. (Health care providers & services) 148,462 5,482
See accompanying Notes to Portfolio of Investments. 32

International Growth Fund
Portfolio of Investments, March 31, 2021 (all dollar amounts in thousands) (unaudited)
Issuer Shares Value
Common Stocks—(continued)
Emerging Asia—(continued)
India — (continued)Havells India, Ltd. (Electrical equipment) 307,237 $ 4,424
* HDFC Bank, Ltd. (Banks) 1,185,297 24,227Info Edge India, Ltd. (Interactive Media & Services) 65,940 3,860
* InterGlobe Aviation, Ltd. (Airlines) 293,367 6,504Ipca Laboratories, Ltd. (Pharmaceuticals) 111,702 2,921
* Pidilite Industries, Ltd. (Chemicals) 149,204 3,694Reliance Industries, Ltd. (Oil, gas & consumable fuels) 1,245,215 33,594
88,945
Indonesia—1.2%Bank Central Asia Tbk PT (Banks) 12,046,700 25,773
South Korea—1.0%Kakao Corporation (Interactive Media & Services) 25,828 11,365Samsung SDI Co., Ltd. (Electronic equipment, instruments & components) 20,438 11,919
23,284
Taiwan—3.8%Advantech Co., Ltd. (Technology hardware, storage & peripherals) 373,000 4,628Airtac International Group (Machinery) 130,000 4,579ASMedia Technology, Inc. (Semiconductors & semiconductor equipment) 62,000 3,238Globalwafers Co., Ltd. (Semiconductors & semiconductor equipment) 243,000 6,387MediaTek, Inc. (Semiconductors & semiconductor equipment) 767,000 26,048Taiwan Semiconductor Manufacturing Co., Ltd.—ADR (Semiconductors & semiconductor equipment) 322,913 38,194
83,074
Thailand—1.0%Airports of Thailand PCL (Transportation infrastructure) 1,321,000 2,917Carabao Group PCL Class “F” (Beverages) 744,700 3,074
* Sea, Ltd.—ADR (Entertainment) 77,071 17,20423,195
United Kingdom—11.3%3i Group plc (Capital markets) 497,854 7,917
* Abcam plc (Biotechnology) 126,792 2,431Ashtead Group plc (Trading companies & distributors) 586,004 34,956Avast plc (Software) 1,236,207 7,771AVEVA Group plc (Software) 142,556 6,725Big Yellow Group plc (Equity REIT) 267,522 4,112
* boohoo Group plc (Internet & direct marketing retail) 903,317 4,234* Ceres Power Holdings plc (Electrical equipment) 137,659 2,384* Compass Group plc (Hotels, restaurants & leisure) 1,261,305 25,413
Croda International plc (Chemicals) 186,947 16,360Diploma plc (Trading companies & distributors) 133,634 4,694Experian plc (Professional services) 500,350 17,224Halma plc (Electronic equipment, instruments & components) 483,257 15,816Intermediate Capital Group plc (Capital markets) 385,257 9,783Intertek Group plc (Professional services) 115,883 8,950London Stock Exchange Group plc (Capital markets) 205,469 19,658Renishaw plc (Electronic equipment, instruments & components) 57,101 5,046
* Rentokil Initial plc (Commercial services & supplies) 1,920,322 12,824
See accompanying Notes to Portfolio of Investments. 33

International Growth Fund
Portfolio of Investments, March 31, 2021 (all dollar amounts in thousands) (unaudited)
Issuer Shares Value
Common Stocks—(continued)
United Kingdom—(continued)Rotork plc (Machinery) 1,555,115 $ 7,645Segro plc (Equity REIT) 975,336 12,607Softcat plc (IT services) 194,918 4,872Spirax-Sarco Engineering plc (Machinery) 87,303 13,721
* Trainline plc (Internet & direct marketing retail) 734,675 4,649249,792
Japan—10.5%Asahi Intecc Co., Ltd. (Health care equipment & supplies) 266,000 7,327
* BASE, Inc. (IT services) 247,500 3,561Benefit One, Inc. (Professional services) 180,200 4,783
* Bengo4.com, Inc. (Interactive Media & Services) 31,200 2,454Daikin Industries, Ltd. (Building products) 115,500 23,283Disco Corporation (Semiconductors & semiconductor equipment) 18,800 5,900GMO Payment Gateway, Inc. (IT services) 46,000 6,099Harmonic Drive Systems, Inc. (Machinery) 76,300 5,154Hoya Corporation (Health care equipment & supplies) 127,100 14,928Keyence Corporation (Electronic equipment, instruments & components) 49,700 22,564M3, Inc. (Health care technology) 192,500 13,162MISUMI Group, Inc. (Machinery) 196,000 5,691MonotaRO Co., Ltd. (Trading companies & distributors) 350,400 9,475Nihon M&A Center, Inc. (Professional services) 398,800 10,780Nomura Research Institute, Ltd. (IT services) 233,900 7,235Olympus Corporation (Health care equipment & supplies) 882,700 18,264Omron Corporation (Electronic equipment, instruments & components) 214,300 16,722Rakus Co., Ltd. (Software) 204,100 3,934
* SHIFT, Inc. (IT services) 30,500 3,606SMC Corporation (Machinery) 47,800 27,763Sushiro Global Holdings, Ltd. (Hotels, restaurants & leisure) 137,300 6,064TechnoPro Holdings, Inc. (Professional services) 79,300 6,603TIS, Inc. (IT services) 326,700 7,792
233,144
Canada—3.2%* Canada Goose Holdings, Inc. (Textiles, apparel & luxury goods)† 151,947 5,964
Canadian National Railway Co. (Road & rail) 341,448 39,625Enghouse Systems, Ltd. (Software) 62,261 2,888
* Kinaxis, Inc. (Software) 32,401 3,781* Lululemon Athletica, Inc. (Textiles, apparel & luxury goods) 52,203 16,011
Toromont Industries, Ltd. (Trading companies & distributors) 47,142 3,60971,878
Asia—3.2%
Australia—1.3%Aristocrat Leisure, Ltd. (Hotels, restaurants & leisure) 421,825 11,006
* Atlassian Corporation plc Class “A” (Software)† 60,376 12,725Netwealth Group, Ltd. (Capital markets) 227,135 2,325Pro Medicus, Ltd. (Health care technology) 102,508 3,218
29,274
See accompanying Notes to Portfolio of Investments. 34

International Growth Fund
Portfolio of Investments, March 31, 2021 (all dollar amounts in thousands) (unaudited)
Issuer
Shares orPrincipalAmount Value
Common Stocks—(continued)
Asia—(continued)
Hong Kong—1.9%AIA Group, Ltd. (Insurance) 3,430,200 $ 41,608
Emerging Latin America—2.3%
Argentina—0.9%* Globant S.A. (IT services)† 29,182 6,059* MercadoLibre, Inc. (Internet & direct marketing retail) 9,377 13,804
19,863
Brazil—1.2%B3 S.A. - Brasil Bolsa Balcao (Capital markets) 811,100 7,871Locaweb Servicos de Internet S.A. (IT services) 1,556,493 6,319Magazine Luiza S.A. (Multiline retail) 1,805,200 6,491Notre Dame Intermedica Participacoes S.A. (Health care providers & services) 344,800 5,072
25,753
Mexico—0.2%* Grupo Aeroportuario del Sureste S.A.B. de C.V.—ADR (Transportation infrastructure) 24,180 4,299
Emerging Europe—1.0%
Poland—0.5%* Allegro.eu S.A. (Internet & direct marketing retail) 424,617 5,971* InPost S.A. (Air freight & logistics) 259,113 4,244
10,215
Russia—0.5%* Yandex N.V. Class “A” (Interactive Media & Services)† 171,565 10,990
Total Common Stocks—99.9%(cost $1,381,577) 2,211,089
Repurchase AgreementFixed Income Clearing Corporation, 0.000% dated 3/31/21, due 4/1/21, repurchase price $10,476, collateralized by U.S. Treasury
Bond—U.S. Treasury Note, 2.000%—2.250%, due 11/15/27—2/15/50, valued at $10,685 $ 10,476 10,476
Total Repurchase Agreement—0.5%(cost $10,476) 10,476
Total Investments—100.4%(cost $1,392,053) 2,221,565
Liabilities, plus cash and other assets—(0.4)% (8,481)
Net assets—100.0% $ 2,213,084
ADR = American Depository ReceiptREIT = Real Estate Investment Trust* = Non-income producing security† = U.S. listed foreign security
See accompanying Notes to Portfolio of Investments. 35

International Growth Fund
Portfolio of Investments, March 31, 2021 (unaudited)
At March 31, 2021, the Fund’s Portfolio of Investments includes the following industry categories (as a percentage of long-term investments):
Industrials 26.9%Information Technology 22.1%Consumer Discretionary 14.2%Health Care 12.0%Financials 9.1%Communication Services 4.8%Materials 3.1%Consumer Staples 2.5%Energy 2.4%Real Estate 1.6%Utilities 1.3%Total 100.0%
At March 31, 2021, the Fund’s Portfolio of Investments includes the following currency categories (as a percentage of long-term investments):
Euro 24.8%British Pound Sterling 11.3%Japanese Yen 10.5%Hong Kong Dollar 10.3%U.S. Dollar 8.7%Swiss Franc 6.8%Swedish Krona 6.1%Danish Krone 4.2%Indian Rupee 4.0%Chinese Yuan Renminbi 3.2%New Taiwan Dollar 2.3%Canadian Dollar 2.3%Indonesian Rupiah 1.2%Brazilian Real 1.2%South Korean Won 1.1%All Other Currencies 2.0%Total 100.0%
See accompanying Notes to Portfolio of Investments. 36

Institutional International Growth Fund
Portfolio of Investments, March 31, 2021 (all dollar amounts in thousands) (unaudited)
Issuer Shares Value
Common Stocks
Europe, Mid-East—44.3%
Belgium—0.3%Warehouses De Pauw CVA (Equity REIT) 96,787 $ 3,198
Denmark—4.2%* Chr Hansen Holding A/S (Chemicals) 39,641 3,602
Coloplast A/S Class “B” (Health care equipment & supplies) 34,533 5,193DSV PANALPINA A/S (Air freight & logistics) 120,200 23,582
* Genmab A/S (Biotechnology) 21,809 7,175Netcompany Group A/S (Software) 30,264 2,882Orsted A/S (Electric utilities) 49,858 8,053Royal Unibrew A/S (Beverages) 22,934 2,398
52,885
Finland—0.9%Neste Oyj (Oil, gas & consumable fuels) 208,246 11,053
France—9.7%* Airbus SE (Aerospace & defense) 182,000 20,605
Dassault Systemes SE (Software) 45,598 9,753Hermes International (Textiles, apparel & luxury goods) 4,766 5,276Kering S.A. (Textiles, apparel & luxury goods) 21,364 14,747L’Oreal S.A. (Personal products) 31,895 12,223LVMH Moet Hennessy Louis Vuitton SE (Textiles, apparel & luxury goods) 29,353 19,555
* Safran S.A. (Aerospace & defense) 111,737 15,207Sartorius Stedim Biotech (Life sciences tools & services) 13,360 5,502Teleperformance (Professional services) 42,590 15,523
* Worldline S.A. (IT services) 58,773 4,924123,315
Germany—6.0%Carl Zeiss Meditec AG (Health care equipment & supplies) 32,652 4,920CompuGroup Medical SE & Co. KgaA (Health care technology) 34,398 2,906
* CTS Eventim AG & Co. KGaA (Entertainment) 56,259 3,262* HelloFresh SE (Internet & direct marketing retail) 82,009 6,116* Hypoport SE (Diversified financial services) 3,816 2,023
Infineon Technologies AG (Semiconductors & semiconductor equipment) 344,718 14,616KION Group AG (Machinery) 50,226 4,959MTU Aero Engines AG (Aerospace & defense) 73,221 17,233Nemetschek SE (Software) 29,214 1,864
* Puma SE (Textiles, apparel & luxury goods) 87,515 8,574* TeamViewer AG (Software) 59,433 2,539
Vonovia SE (Real estate management & development) 109,888 7,17876,190
Ireland—2.0%* ICON plc (Life sciences tools & services)† 38,489 7,558
Kingspan Group plc (Building products) 104,641 8,872* Ryanair Holdings plc—ADR (Airlines) 80,247 9,229
25,659
Israel—1.0%* CyberArk Software, Ltd. (Software)† 20,464 2,647* Inmode, Ltd. (Health care equipment & supplies)† 30,397 2,200
See accompanying Notes to Portfolio of Investments. 37

Institutional International Growth Fund
Portfolio of Investments, March 31, 2021 (all dollar amounts in thousands) (unaudited)
Issuer Shares Value
Common Stocks—(continued)
Europe, Mid-East—(continued)
Israel — (continued)* Wix.com, Ltd. (IT services)† 27,746 $ 7,747
12,594
Italy—0.6%* Amplifon SpA (Health care providers & services) 74,280 2,765* Brunello Cucinelli SpA (Textiles, apparel & luxury goods) 43,672 1,877* Moncler SpA (Textiles, apparel & luxury goods) 53,234 3,051
7,693
Luxembourg—0.6%* Eurofins Scientific SE (Life sciences tools & services) 82,081 7,846
Netherlands—3.7%* Adyen N.V. (IT services) 6,074 13,559
ASML Holding N.V. (Semiconductors & semiconductor equipment) 39,697 24,068BE Semiconductor Industries N.V. (Semiconductors & semiconductor equipment) 44,978 3,768Euronext N.V. (Capital markets) 23,219 2,339IMCD N.V. (Trading companies & distributors) 23,254 3,231
46,965
Norway—0.7%* Pexip Holding ASA (Software) 158,756 1,776
Scatec ASA (Independent power & renewable electricity producers) 78,368 2,370TOMRA Systems ASA (Commercial services & supplies) 104,961 4,544
8,690
Spain—1.8%* Amadeus IT Group S.A. (IT services) 235,500 16,675
EDP Renovaveis S.A. (Independent power & renewable electricity producers) 210,643 4,501* Solaria Energia y Medio Ambiente S.A. (Independent power & renewable electricity producers) 82,432 1,748
22,924
Sweden—6.0%AddTech AB Class “B” (Trading companies & distributors) 130,949 1,949Atlas Copco AB Class “A” (Machinery) 380,341 23,151Beijer Ref AB (Trading companies & distributors) 64,335 2,827Evolution Gaming Group AB (Hotels, restaurants & leisure) 71,807 10,574Hexagon AB Class “B” (Electronic equipment, instruments & components) 150,239 13,859
* Indutrade AB (Trading companies & distributors) 209,309 4,832Investment AB Latour Class “B” (Industrial conglomerates) 128,505 3,328Lifco AB Class “B” (Industrial conglomerates) 32,625 3,033Nibe Industrier AB Class “B” (Building products) 128,736 3,992
* Nolato AB Class “B” (Industrial conglomerates) 28,856 2,571Sweco AB Class “B” (Construction & engineering) 130,274 2,127
* Thule Group AB (Leisure products) 58,087 2,522* Vitrolife AB (Biotechnology) 53,480 1,570
76,335
Switzerland—6.8%Belimo Holding AG (Building products) 275 2,223Logitech International S.A. (Technology hardware, storage & peripherals) 44,249 4,641
See accompanying Notes to Portfolio of Investments. 38

Institutional International Growth Fund
Portfolio of Investments, March 31, 2021 (all dollar amounts in thousands) (unaudited)
Issuer Shares Value
Common Stocks—(continued)
Europe, Mid-East—(continued)
Switzerland — (continued)Lonza Group AG (Life sciences tools & services) 24,093 $ 13,470Partners Group Holding AG (Capital markets) 10,873 13,885
* Siegfried Holding AG (Life sciences tools & services) 3,564 2,936* SIG Combibloc Group AG (Containers & packaging) 163,579 3,783
Sika AG (Chemicals) 69,691 19,909Softwareone Holding AG (Electronic equipment, instruments & components) 80,850 2,087Straumann Holding AG (Health care equipment & supplies) 7,494 9,348Tecan Group AG (Life sciences tools & services) 7,512 3,333Temenos AG (Software) 26,518 3,817VAT Group AG (Machinery) 13,847 3,880
* Zur Rose Group AG (Food & staples retailing) 5,554 2,08685,398
Emerging Asia—23.4%
China—12.5%A-Living Smart City Services Co., Ltd. (Commercial services & supplies) 378,500 1,680Aier Eye Hospital Group Co., Ltd. Class “A” (Health care providers & services) 427,730 3,866AK Medical Holdings, Ltd. (Health care equipment & supplies) 442,000 563
* Alibaba Group Holding, Ltd. (Internet & direct marketing retail) 600,100 16,982Centre Testing International Group Co., Ltd. Class “A” (Professional services) 679,100 2,953Chacha Food Co., Ltd. Class “A” (Food products) 245,600 1,836Country Garden Services Holdings Co., Ltd. (Commercial services & supplies) 476,000 4,825Foshan Haitian Flavouring & Food Co., Ltd. Class “A” (Food products) 173,840 4,238Hangzhou Tigermed Consulting Co., Ltd. Class “A” (Life sciences tools & services) 197,200 4,516
* JD.com, Inc. Class “A” (Internet & direct marketing retail) 174,450 7,226Kweichow Moutai Co., Ltd. Class “A” (Beverages) 16,017 4,909Li Ning Co., Ltd. (Textiles, apparel & luxury goods) 1,142,000 7,418
* Meituan Class “B” (Internet & direct marketing retail) 190,300 7,300NAURA Technology Group Co., Ltd. Class “A” (Semiconductors & semiconductor equipment) 93,700 2,052NetEase, Inc. (Entertainment) 390,100 7,938Offcn Education Technology Co., Ltd. Class “A” (Diversified consumer services) 498,900 2,144Ping An Insurance Group Co. of China, Ltd. Class “H” (Insurance) 1,432,000 17,048Proya Cosmetics Co., Ltd. Class “A” (Personal products) 93,100 2,263Shenzhen Mindray Bio-Medical Electronics Co., Ltd. Class “A” (Health care equipment & supplies) 52,300 3,184Silergy Corporation (Semiconductors & semiconductor equipment) 44,000 3,555
* TAL Education Group—ADR (Diversified consumer services) 100,656 5,420Tencent Holdings, Ltd. (Interactive Media & Services) 253,600 19,899
* Tencent Music Entertainment Group—ADR (Entertainment) 130,660 2,677* Topchoice Medical Corporation Class “A” (Health care providers & services) 94,000 3,592* Venus MedTech Hangzhou, Inc. Class “H” (Health care equipment & supplies) 232,500 1,886* Weimob, Inc. (Software) 795,000 1,777
Will Semiconductor Co., Ltd. Shanghai Class “A” (Semiconductors & semiconductor equipment) 43,470 1,702WuXi AppTec Co., Ltd. Class “A” (Life sciences tools & services) 153,164 3,276
* Wuxi Biologics Cayman, Inc. (Life sciences tools & services) 876,500 10,976157,701
India—4.0%Crompton Greaves Consumer Electricals, Ltd. (Household durables) 452,085 2,392Dr. Lal PathLabs, Ltd. (Health care providers & services) 83,786 3,094
See accompanying Notes to Portfolio of Investments. 39

Institutional International Growth Fund
Portfolio of Investments, March 31, 2021 (all dollar amounts in thousands) (unaudited)
Issuer Shares Value
Common Stocks—(continued)
Emerging Asia—(continued)
India — (continued)Havells India, Ltd. (Electrical equipment) 173,393 $ 2,497
* HDFC Bank, Ltd. (Banks) 670,322 13,701Info Edge India, Ltd. (Interactive Media & Services) 37,214 2,178
* InterGlobe Aviation, Ltd. (Airlines) 166,559 3,693Ipca Laboratories, Ltd. (Pharmaceuticals) 63,040 1,649
* Pidilite Industries, Ltd. (Chemicals) 84,205 2,085Reliance Industries, Ltd. (Oil, gas & consumable fuels) 704,635 19,004
50,293
Indonesia—1.2%Bank Central Asia Tbk PT (Banks) 6,812,806 14,575
South Korea—1.0%Kakao Corporation (Interactive Media & Services) 14,693 6,465Samsung SDI Co., Ltd. (Electronic equipment, instruments & components) 11,636 6,786
13,251
Taiwan—3.7%Advantech Co., Ltd. (Technology hardware, storage & peripherals) 211,000 2,618Airtac International Group (Machinery) 75,000 2,642ASMedia Technology, Inc. (Semiconductors & semiconductor equipment) 36,000 1,880Globalwafers Co., Ltd. (Semiconductors & semiconductor equipment) 138,000 3,627MediaTek, Inc. (Semiconductors & semiconductor equipment) 435,000 14,773Taiwan Semiconductor Manufacturing Co., Ltd.—ADR (Semiconductors & semiconductor equipment) 183,334 21,685
47,225
Thailand—1.0%Airports of Thailand PCL (Transportation infrastructure) 745,500 1,646Carabao Group PCL Class “F” (Beverages) 420,300 1,735
* Sea, Ltd.—ADR (Entertainment) 43,585 9,73013,111
United Kingdom—11.2%3i Group plc (Capital markets) 280,969 4,468
* Abcam plc (Biotechnology) 71,557 1,372Ashtead Group plc (Trading companies & distributors) 331,404 19,769Avast plc (Software) 701,857 4,412AVEVA Group plc (Software) 80,936 3,818Big Yellow Group plc (Equity REIT) 150,979 2,321
* boohoo Group plc (Internet & direct marketing retail) 509,797 2,390* Ceres Power Holdings plc (Electrical equipment) 78,281 1,355* Compass Group plc (Hotels, restaurants & leisure) 713,306 14,372
Croda International plc (Chemicals) 105,724 9,252Diploma plc (Trading companies & distributors) 75,418 2,649Experian plc (Professional services) 282,378 9,721Halma plc (Electronic equipment, instruments & components) 272,731 8,926Intermediate Capital Group plc (Capital markets) 217,424 5,521Intertek Group plc (Professional services) 65,400 5,051London Stock Exchange Group plc (Capital markets) 116,889 11,183Renishaw plc (Electronic equipment, instruments & components) 32,225 2,848
* Rentokil Initial plc (Commercial services & supplies) 1,083,753 7,237
See accompanying Notes to Portfolio of Investments. 40

Institutional International Growth Fund
Portfolio of Investments, March 31, 2021 (all dollar amounts in thousands) (unaudited)
Issuer Shares Value
Common Stocks—(continued)
United Kingdom—(continued)Rotork plc (Machinery) 880,075 $ 4,327Segro plc (Equity REIT) 550,441 7,115Softcat plc (IT services) 110,004 2,749Spirax-Sarco Engineering plc (Machinery) 49,270 7,743
* Trainline plc (Internet & direct marketing retail) 414,622 2,624141,223
Japan—10.4%Asahi Intecc Co., Ltd. (Health care equipment & supplies) 150,100 4,135
* BASE, Inc. (IT services) 140,000 2,014Benefit One, Inc. (Professional services) 101,700 2,699
* Bengo4.com, Inc. (Interactive Media & Services) 17,600 1,385Daikin Industries, Ltd. (Building products) 65,200 13,143Disco Corporation (Semiconductors & semiconductor equipment) 10,600 3,327GMO Payment Gateway, Inc. (IT services) 26,000 3,447Harmonic Drive Systems, Inc. (Machinery) 43,100 2,912Hoya Corporation (Health care equipment & supplies) 71,700 8,421Keyence Corporation (Electronic equipment, instruments & components) 28,200 12,803M3, Inc. (Health care technology) 108,600 7,426MISUMI Group, Inc. (Machinery) 110,600 3,211MonotaRO Co., Ltd. (Trading companies & distributors) 197,800 5,349Nihon M&A Center, Inc. (Professional services) 225,000 6,082Nomura Research Institute, Ltd. (IT services) 132,200 4,089Olympus Corporation (Health care equipment & supplies) 499,700 10,339Omron Corporation (Electronic equipment, instruments & components) 121,200 9,457Rakus Co., Ltd. (Software) 115,200 2,220
* SHIFT, Inc. (IT services) 17,200 2,033SMC Corporation (Machinery) 27,000 15,682Sushiro Global Holdings, Ltd. (Hotels, restaurants & leisure) 77,500 3,423TechnoPro Holdings, Inc. (Professional services) 45,000 3,747TIS, Inc. (IT services) 184,400 4,398
131,742
Canada—3.2%* Canada Goose Holdings, Inc. (Textiles, apparel & luxury goods)† 85,931 3,373
Canadian National Railway Co. (Road & rail) 193,100 22,409Enghouse Systems, Ltd. (Software) 35,138 1,630
* Kinaxis, Inc. (Software) 18,286 2,134* Lululemon Athletica, Inc. (Textiles, apparel & luxury goods) 29,462 9,036
Toromont Industries, Ltd. (Trading companies & distributors) 26,605 2,03640,618
Asia—3.2%
Australia—1.3%Aristocrat Leisure, Ltd. (Hotels, restaurants & leisure) 239,491 6,248
* Atlassian Corporation plc Class “A” (Software)† 34,074 7,181Netwealth Group, Ltd. (Capital markets) 128,512 1,316Pro Medicus, Ltd. (Health care technology) 57,871 1,817
16,562
See accompanying Notes to Portfolio of Investments. 41

Institutional International Growth Fund
Portfolio of Investments, March 31, 2021 (all dollar amounts in thousands) (unaudited)
Issuer
Shares orPrincipalAmount Value
Common Stocks—(continued)
Asia—(continued)
Hong Kong—1.9%AIA Group, Ltd. (Insurance) 1,939,863 $ 23,531
Emerging Latin America—2.2%
Argentina—0.9%* Globant S.A. (IT services)† 16,469 3,419* MercadoLibre, Inc. (Internet & direct marketing retail) 5,292 7,791
11,210
Brazil—1.1%B3 S.A. - Brasil Bolsa Balcao (Capital markets) 457,800 4,442Locaweb Servicos de Internet S.A. (IT services) 878,386 3,566Magazine Luiza S.A. (Multiline retail) 1,018,800 3,663Notre Dame Intermedica Participacoes S.A. (Health care providers & services) 194,600 2,863
14,534
Mexico—0.2%* Grupo Aeroportuario del Sureste S.A.B. de C.V.—ADR (Transportation infrastructure) 13,646 2,426
Emerging Europe—1.0%
Poland—0.5%* Allegro.eu S.A. (Internet & direct marketing retail) 241,090 3,390* InPost S.A. (Air freight & logistics) 146,233 2,395
5,785
Russia—0.5%* Yandex N.V. Class “A” (Interactive Media & Services)† 96,825 6,203
Total Common Stocks—98.9%(cost $776,940) 1,250,735
Repurchase AgreementFixed Income Clearing Corporation, 0.000% dated 3/31/21, due 4/1/21, repurchase price $14,756, collateralized by U.S. Treasury
Note, 2.250%, due 11/15/27, valued at $15,051 $ 14,756 14,756
Total Repurchase Agreement—1.1%(cost $14,756) 14,756
Total Investments—100.0%(cost $791,696) 1,265,491
Liabilities, plus cash and other assets—(0.0)% (503)
Net assets—100.0% $ 1,264,988
ADR = American Depository ReceiptREIT = Real Estate Investment Trust* = Non-income producing security† = U.S. listed foreign security
See accompanying Notes to Portfolio of Investments. 42

Institutional International Growth Fund
Portfolio of Investments, March 31, 2021 (unaudited)
At March 31, 2021, the Fund’s Portfolio of Investments includes the following industry categories (as a percentage of long-term investments):
Industrials 26.9%Information Technology 22.1%Consumer Discretionary 14.2%Health Care 12.0%Financials 9.1%Communication Services 4.8%Materials 3.1%Consumer Staples 2.5%Energy 2.4%Real Estate 1.6%Utilities 1.3%Total 100.0%
At March 31, 2021, the Fund’s Portfolio of Investments includes the following currency categories (as a percentage of long-term investments):
Euro 24.8%British Pound Sterling 11.3%Japanese Yen 10.5%Hong Kong Dollar 10.3%U.S. Dollar 8.7%Swiss Franc 6.8%Swedish Krona 6.1%Danish Krone 4.2%Indian Rupee 4.0%Chinese Yuan Renminbi 3.2%New Taiwan Dollar 2.3%Canadian Dollar 2.3%Indonesian Rupiah 1.2%Brazilian Real 1.2%South Korean Won 1.1%All Other Currencies 2.0%Total 100.0%
See accompanying Notes to Portfolio of Investments. 43

International Small Cap Growth Fund
Portfolio of Investments, March 31, 2021 (all dollar amounts in thousands) (unaudited)
Issuer Shares Value
Common Stocks
Europe, Mid-East—38.1%
Belgium—2.1%Melexis N.V. (Semiconductors & semiconductor equipment) 40,312 $ 4,267Warehouses De Pauw CVA (Equity REIT) 77,143 2,549
6,816
Denmark—0.6%Netcompany Group A/S (Software) 22,342 2,127
Germany—4.5%Carl Zeiss Meditec AG (Health care equipment & supplies) 24,539 3,698CompuGroup Medical SE & Co. KgaA (Health care technology) 35,090 2,965
* CTS Eventim AG & Co. KGaA (Entertainment) 37,000 2,145* Hypoport SE (Diversified financial services) 5,165 2,737
Siltronic AG (Semiconductors & semiconductor equipment) 20,180 3,19514,740
Israel—1.0%* Inmode, Ltd. (Health care equipment & supplies)† 39,651 2,870* NEOGAMES S.A. (Hotels, restaurants & leisure)† 11,242 402
3,272
Italy—2.4%* Amplifon SpA (Health care providers & services) 126,677 4,715* Brunello Cucinelli SpA (Textiles, apparel & luxury goods) 38,022 1,635
Carel Industries SpA (Electronic equipment, instruments & components) 83,905 1,7088,058
Netherlands—1.7%BE Semiconductor Industries N.V. (Semiconductors & semiconductor equipment) 66,751 5,592
Norway—1.4%* Pexip Holding ASA (Software) 136,659 1,529
TOMRA Systems ASA (Commercial services & supplies) 71,057 3,0764,605
Spain—2.5%EDP Renovaveis S.A. (Independent power & renewable electricity producers) 247,377 5,286
* Solaria Energia y Medio Ambiente S.A. (Independent power & renewable electricity producers) 146,115 3,0988,384
Sweden—14.8%AddTech AB Class “B” (Trading companies & distributors) 240,470 3,579Arjo AB Class “B” (Health care equipment & supplies) 444,658 3,312Beijer Ref AB (Trading companies & distributors) 135,639 5,961BioGaia AB Class “B” (Biotechnology) 24,272 1,140
* Biotage AB (Life sciences tools & services) 115,093 2,030* Indutrade AB (Trading companies & distributors) 201,715 4,656
Investment AB Latour Class “B” (Industrial conglomerates) 201,171 5,210Lifco AB Class “B” (Industrial conglomerates) 58,268 5,418MIPS AB (Leisure products) 82,290 5,889
* Nolato AB Class “B” (Industrial conglomerates) 43,503 3,875Paradox Interactive AB (Entertainment) 61,396 1,385
See accompanying Notes to Portfolio of Investments. 44

International Small Cap Growth Fund
Portfolio of Investments, March 31, 2021 (all dollar amounts in thousands) (unaudited)
Issuer Shares Value
Common Stocks—(continued)
Europe, Mid-East—(continued)
Sweden — (continued)Sweco AB Class “B” (Construction & engineering) 190,165 $ 3,105
* Vitrolife AB (Biotechnology) 109,420 3,21248,772
Switzerland—7.1%Belimo Holding AG (Building products) 353 2,853Kardex Holding AG (Machinery) 15,341 3,129
* Siegfried Holding AG (Life sciences tools & services) 4,486 3,695Softwareone Holding AG (Electronic equipment, instruments & components) 146,174 3,774Tecan Group AG (Life sciences tools & services) 6,681 2,965VAT Group AG (Machinery) 11,874 3,327
* Zur Rose Group AG (Food & staples retailing) 9,769 3,66923,412
Emerging Asia—18.8%
Cambodia—1.2%NagaCorp, Ltd. (Hotels, restaurants & leisure) 3,324,000 3,925
China—5.9%A-Living Smart City Services Co., Ltd. (Commercial services & supplies) 469,000 2,081AK Medical Holdings, Ltd. (Health care equipment & supplies) 1,568,000 1,997Centre Testing International Group Co., Ltd. Class “A” (Professional services) 804,890 3,500Chacha Food Co., Ltd. Class “A” (Food products) 349,900 2,616Changzhou Xingyu Automotive Lighting Systems Co., Ltd. Class “A” (Auto components) 52,562 1,516
* iClick Interactive Asia Group, Ltd.—ADR (Media) 64,651 761Proya Cosmetics Co., Ltd. Class “A” (Personal products) 89,644 2,179Silergy Corporation (Semiconductors & semiconductor equipment) 22,000 1,777
* Venus MedTech Hangzhou, Inc. Class “H” (Health care equipment & supplies) 363,000 2,94419,371
India—7.0%* Affle India, Ltd. (Media) 19,113 1,425* AU Small Finance Bank, Ltd. (Banks) 365,303 6,175* IndiaMart InterMesh, Ltd. (Trading companies & distributors) 18,177 1,928
Info Edge India, Ltd. (Interactive Media & Services) 43,253 2,532Ipca Laboratories, Ltd. (Pharmaceuticals) 142,094 3,716
* Motherson Sumi Systems, Ltd. (Auto components) 2,648,944 7,28223,058
Indonesia—0.4%Ace Hardware Indonesia Tbk PT (Specialty retail) 14,711,600 1,545
South Korea—1.0%Koh Young Technology, Inc. (Semiconductors & semiconductor equipment) 31,438 3,194
Taiwan—3.3%ASPEED Technology, Inc. (Semiconductors & semiconductor equipment) 35,000 2,116Globalwafers Co., Ltd. (Semiconductors & semiconductor equipment) 160,000 4,206momo.com, Inc. (Internet & direct marketing retail) 35,000 1,214
See accompanying Notes to Portfolio of Investments. 45

International Small Cap Growth Fund
Portfolio of Investments, March 31, 2021 (all dollar amounts in thousands) (unaudited)
Issuer Shares Value
Common Stocks—(continued)
Emerging Asia—(continued)
Taiwan — (continued)Voltronic Power Technology Corporation (Electrical equipment) 86,451 $ 3,348
10,884
Japan—15.1%* BASE, Inc. (IT services) 187,500 2,698
BayCurrent Consulting, Inc. (Professional services) 11,600 2,645Benefit One, Inc. (Professional services) 179,500 4,764
* Bengo4.com, Inc. (Interactive Media & Services) 24,700 1,943GMO Payment Gateway, Inc. (IT services) 23,000 3,049Harmonic Drive Systems, Inc. (Machinery) 57,400 3,878
* Hennge KK (IT services) 33,500 2,236Japan Elevator Service Holdings Co., Ltd. (Commercial services & supplies) 111,900 2,405JINS Holdings, Inc. (Specialty retail) 66,600 4,734Nihon Unisys, Ltd. (IT services) 37,400 1,152Rakus Co., Ltd. (Software) 198,100 3,818
* SHIFT, Inc. (IT services) 19,200 2,270SMS Co., Ltd. (Professional services) 109,900 3,355Sushiro Global Holdings, Ltd. (Hotels, restaurants & leisure) 130,700 5,772TechnoPro Holdings, Inc. (Professional services) 63,200 5,263
49,982
United Kingdom—13.4%AVEVA Group plc (Software) 96,101 4,534
* Beazley plc (Insurance) 530,890 2,575* boohoo Group plc (Internet & direct marketing retail) 861,153 4,036* Burford Capital, Ltd. (Diversified financial services) 191,078 1,654* Ceres Power Holdings plc (Electrical equipment) 27,480 476* CVS Group plc (Health care providers & services) 50,156 1,294
Diploma plc (Trading companies & distributors) 163,840 5,755dotdigital group plc (Software) 359,243 827IntegraFin Holdings plc (Capital markets) 228,109 1,594
* Moonpig Group plc (Internet & direct marketing retail) 136,099 797Renishaw plc (Electronic equipment, instruments & components) 37,855 3,345Rotork plc (Machinery) 987,587 4,855Safestore Holdings plc (Equity REIT) 479,890 5,263Softcat plc (IT services) 148,152 3,703
* Trainline plc (Internet & direct marketing retail) 536,667 3,39644,104
Canada—4.3%* Canada Goose Holdings, Inc. (Textiles, apparel & luxury goods)† 48,114 1,889
Enghouse Systems, Ltd. (Software) 68,175 3,162* Kinaxis, Inc. (Software) 29,686 3,464
Parkland Corporation (Oil, gas & consumable fuels) 110,247 3,313Toromont Industries, Ltd. (Trading companies & distributors) 32,756 2,507
14,335
Emerging Latin America—3.5%
Brazil—1.8%Arezzo Industria e Comercio S.A. (Textiles, apparel & luxury goods) 204,000 2,550
See accompanying Notes to Portfolio of Investments. 46

International Small Cap Growth Fund
Portfolio of Investments, March 31, 2021 (all dollar amounts in thousands) (unaudited)
Issuer
Shares orPrincipalAmount Value
Common Stocks—(continued)
Emerging Latin America—(continued)
Brazil — (continued)Locaweb Servicos de Internet S.A. (IT services) 316,000 $ 1,283Pet Center Comercio e Participacoes S.A. (Specialty retail) 563,600 1,981
5,814
Mexico—1.7%* Grupo Aeroportuario del Centro Norte S.A.B. de C.V. (Transportation infrastructure) 902,700 5,695
Asia—2.7%
Australia—1.8%* Nanosonics, Ltd. (Health care equipment & supplies) 401,176 1,737
Netwealth Group, Ltd. (Capital markets) 112,203 1,149Pro Medicus, Ltd. (Health care technology) 97,978 3,075
5,961
New Zealand—0.9%Ryman Healthcare, Ltd. (Health care providers & services) 260,709 2,786
Emerging Mid-East, Africa—2.1%
South Africa—1.0%Clicks Group, Ltd. (Food & staples retailing) 199,497 3,249
United Arab Emirates—1.1%* Network International Holdings plc (IT services) 657,799 3,751
Total Common Stocks—98.0%(cost $258,180) 323,432
Repurchase AgreementFixed Income Clearing Corporation, 0.000% dated 3/31/21, due 4/1/21, repurchase price $3,609, collateralized by U.S. Treasury Note,
2.250%, due 11/15/27, valued at $3,682 $ 3,609 3,609
Total Repurchase Agreement—1.1%(cost $3,609) 3,609
Total Investments—99.1%(cost $261,789) 327,041
Cash and other assets, less liabilities—0.9% 2,914
Net assets—100.0% $ 329,955
ADR = American Depository ReceiptREIT = Real Estate Investment Trust* = Non-income producing security† = U.S. listed foreign security
See accompanying Notes to Portfolio of Investments. 47

International Small Cap Growth Fund
Portfolio of Investments, March 31, 2021 (unaudited)
At March 31, 2021, the Fund’s Portfolio of Investments includes the following industry categories (as a percentage of long-term investments):
Industrials 29.9%Information Technology 22.5%Consumer Discretionary 15.0%Health Care 14.9%Financials 4.9%Consumer Staples 3.6%Communication Services 3.2%Utilities 2.6%Real Estate 2.4%Energy 1.0%Total 100.0%
At March 31, 2021, the Fund’s Portfolio of Investments includes the following currency categories (as a percentage of long-term investments):
Japanese Yen 15.5%Swedish Krona 15.1%British Pound Sterling 14.8%Euro 13.5%Swiss Franc 7.2%Indian Rupee 7.1%New Taiwan Dollar 3.9%Canadian Dollar 3.9%Hong Kong Dollar 3.4%Chinese Yuan Renminbi 3.0%Australian Dollar 1.8%U.S. Dollar 1.8%Brazilian Real 1.8%Mexican Peso 1.8%Norwegian Krone 1.4%South African Rand 1.0%All Other Currencies 3.0%Total 100.0%
See accompanying Notes to Portfolio of Investments. 48

Emerging Markets Leaders Fund
Portfolio of Investments, March 31, 2021 (all dollar amounts in thousands) (unaudited)
Issuer Shares Value
Common Stocks
Emerging Asia—78.1%
China—36.9%* Alibaba Group Holding, Ltd. (Internet & direct marketing retail) 724,628 $ 20,506
China Tourism Group Duty Free Corporation, Ltd. Class “A” (Specialty retail) 104,756 4,892Foshan Haitian Flavouring & Food Co., Ltd. Class “A” (Food products) 99,600 2,428Jiangsu Hengrui Medicine Co., Ltd. Class “A” (Pharmaceuticals) 141,970 1,995Kweichow Moutai Co., Ltd. Class “A” (Beverages) 13,159 4,033Midea Group Co., Ltd. Class “A” (Household durables) 452,500 5,676NetEase, Inc. (Entertainment) 451,950 9,197Ping An Insurance Group Co. of China, Ltd. Class “H” (Insurance) 856,500 10,197Shenzhou International Group Holdings, Ltd. (Textiles, apparel & luxury goods) 105,200 2,180
* TAL Education Group—ADR (Diversified consumer services) 48,105 2,590Tencent Holdings, Ltd. (Interactive Media & Services) 294,000 23,069
* Tencent Music Entertainment Group—ADR (Entertainment) 331,241 6,787TravelSky Technology, Ltd. Class “H” (IT services) 1,491,000 3,487Zhangzhou Pientzehuang Pharmaceutical Co., Ltd. Class “A” (Pharmaceuticals) 81,000 3,546
100,583
India—19.0%Asian Paints, Ltd. (Chemicals) 76,617 2,659
* Bajaj Finance, Ltd. (Consumer finance) 35,221 2,475Britannia Industries, Ltd. (Food products) 49,255 2,432
* HDFC Bank, Ltd. (Banks) 332,080 6,787Housing Development Finance Corporation, Ltd. (Thrifts & mortgage finance) 116,094 3,976Infosys, Ltd. (IT services) 344,405 6,441
* InterGlobe Aviation, Ltd. (Airlines) 126,311 2,800Maruti Suzuki India, Ltd. (Automobiles) 21,094 1,981
* Motherson Sumi Systems, Ltd. (Auto components) 2,174,424 5,978Reliance Industries, Ltd. (Oil, gas & consumable fuels) 372,852 10,012UPL, Ltd. (Chemicals) 708,389 6,200
51,741
Indonesia—1.5%Bank Central Asia Tbk PT (Banks) 1,977,100 4,230
South Korea—7.6%* Coupang, Inc. (Internet & direct marketing retail) 61,579 3,039
Douzone Bizon Co., Ltd. (Software) 32,826 2,848Kakao Corporation (Interactive Media & Services) 7,525 3,311LG Household & Health Care, Ltd. (Personal products) 4,150 5,757NAVER Corporation (Interactive Media & Services) 16,974 5,654
20,609
Taiwan—11.4%E.Sun Financial Holding Co., Ltd. (Banks) 2,770,301 2,534MediaTek, Inc. (Semiconductors & semiconductor equipment) 191,000 6,486Taiwan Semiconductor Manufacturing Co., Ltd.—ADR (Semiconductors & semiconductor equipment) 185,609 21,954
30,974
Thailand—1.7%* Sea, Ltd.—ADR (Entertainment) 20,870 4,659
See accompanying Notes to Portfolio of Investments. 49

Emerging Markets Leaders Fund
Portfolio of Investments, March 31, 2021 (all dollar amounts in thousands) (unaudited)
Issuer
Shares orPrincipalAmount Value
Common Stocks—(continued)
Emerging Latin America—14.2%
Argentina—3.8%* Globant S.A. (IT services)† 21,045 $ 4,369* MercadoLibre, Inc. (Internet & direct marketing retail) 4,173 6,143
10,512
Brazil—5.5%B3 S.A. - Brasil Bolsa Balcao (Capital markets) 544,300 5,282Raia Drogasil S.A. (Food & staples retailing) 390,200 1,737
* Rumo S.A. (Road & rail) 1,421,800 5,115TOTVS S.A. (Software) 547,300 2,813
14,947
Mexico—3.3%* Grupo Aeroportuario del Pacifico S.A.B. de C.V. Class “B” (Transportation infrastructure) 502,200 5,242
Wal-Mart de Mexico S.A.B. de C.V. (Food & staples retailing) 1,188,800 3,7558,997
Peru—1.6%Credicorp, Ltd. (Banks)† 31,563 4,311
Emerging Europe, Mid-East, Africa—6.9%
Poland—0.7%* Allegro.eu S.A. (Internet & direct marketing retail) 144,592 2,033
Russia—2.8%HeadHunter Group plc—ADR (Professional services) 59,353 2,013
* Yandex N.V. Class “A” (Interactive Media & Services)† 87,201 5,5867,599
South Africa—2.8%* Capitec Bank Holdings, Ltd. (Banks) 47,847 4,603
Clicks Group, Ltd. (Food & staples retailing) 181,084 2,9497,552
United Arab Emirates—0.6%* Network International Holdings plc (IT services) 300,191 1,712
Total Common Stocks—99.2%(cost $192,896) 270,459
Repurchase AgreementFixed Income Clearing Corporation, 0.000% dated 3/31/21, due 4/1/21, repurchase price $994, collateralized by U.S. Treasury Note,
2.250%, due 11/15/27, valued at $1,014 $ 994 994
Total Repurchase Agreement—0.4%(cost $994) 994
See accompanying Notes to Portfolio of Investments. 50

Emerging Markets Leaders Fund
Portfolio of Investments, March 31, 2021 (all dollar amounts in thousands) (unaudited)
Issuer Value
Total Investments—99.6%(cost $193,890) $ 271,453
Cash and other assets, less liabilities—0.4% 1,026
Net assets—100.0% $ 272,479
ADR = American Depository Receipt* = Non-income producing security† = U.S. listed foreign security
See accompanying Notes to Portfolio of Investments. 51

Emerging Markets Leaders Fund
Portfolio of Investments, March 31, 2021 (unaudited)
At March 31, 2021, the Fund’s Portfolio of Investments includes the following industry categories (as a percentage of long-term investments):
Communication Services 21.5%Consumer Discretionary 20.5%Information Technology 18.5%Financials 16.4%Consumer Staples 8.5%Industrials 5.6%Energy 3.7%Materials 3.3%Health Care 2.0%Total 100.0%
At March 31, 2021, the Fund’s Portfolio of Investments includes the following currency categories (as a percentage of long-term investments):
Hong Kong Dollar 25.4%U.S. Dollar 22.7%Indian Rupee 19.1%Chinese Yuan Renminbi 8.4%South Korean Won 6.5%Brazilian Real 5.5%New Taiwan Dollar 3.3%Mexican Peso 3.3%South African Rand 2.8%Indonesian Rupiah 1.6%All Other Currencies 1.4%Total 100.0%
See accompanying Notes to Portfolio of Investments. 52

Emerging Markets Growth Fund
Portfolio of Investments, March 31, 2021 (all dollar amounts in thousands) (unaudited)
Issuer Shares Value
Common Stocks
Emerging Asia—86.8%
China—31.5%Aier Eye Hospital Group Co., Ltd. Class “A” (Health care providers & services) 256,709 $ 2,320
* Alibaba Group Holding, Ltd. (Internet & direct marketing retail) 1,691,932 47,880* Alibaba Health Information Technology, Ltd. (Health care technology) 1,384,000 3,917* BeiGene, Ltd. (Biotechnology) 117,800 3,049
Beijing Oriental Yuhong Waterproof Technology Co., Ltd. Class “A” (Construction materials) 576,330 4,498Centre Testing International Group Co., Ltd. Class “A” (Professional services) 987,900 4,295China Education Group Holdings, Ltd. (Diversified consumer services) 1,243,000 2,210China Meidong Auto Holdings, Ltd. (Specialty retail) 1,096,000 5,082China Merchants Bank Co., Ltd. Class “H” (Banks) 1,444,000 11,024China Tourism Group Duty Free Corporation, Ltd. Class “A” (Specialty retail) 174,158 8,132Chongqing Zhifei Biological Products Co., Ltd. Class “A” (Biotechnology) 137,900 3,629Contemporary Amperex Technology Co., Ltd. Class “A” (Electrical equipment) 93,700 4,605Country Garden Services Holdings Co., Ltd. (Commercial services & supplies) 1,149,000 11,647Foshan Haitian Flavouring & Food Co., Ltd. Class “A” (Food products) 175,981 4,290Hangzhou Tigermed Consulting Co., Ltd. Class “A” (Life sciences tools & services) 171,666 3,931
* Hua Hong Semiconductor, Ltd. (Semiconductors & semiconductor equipment) 631,000 3,437* JD.com, Inc. Class “A” (Internet & direct marketing retail) 344,200 14,257
Jiangsu Hengrui Medicine Co., Ltd. Class “A” (Pharmaceuticals) 241,751 3,396* Jiumaojiu International Holdings, Ltd. (Hotels, restaurants & leisure) 1,329,000 5,317
Kingdee International Software Group Co., Ltd. (Software) 802,000 2,486Kweichow Moutai Co., Ltd. Class “A” (Beverages) 28,742 8,809Li Ning Co., Ltd. (Textiles, apparel & luxury goods) 1,133,500 7,363
* Meituan Class “B” (Internet & direct marketing retail) 544,600 20,890Midea Group Co., Ltd. Class “A” (Household durables) 567,433 7,118NetEase, Inc. (Entertainment) 762,200 15,510Offcn Education Technology Co., Ltd. Class “A” (Diversified consumer services) 600,090 2,579Shenzhen Inovance Technology Co., Ltd. Class “A” (Machinery) 441,743 5,763Shenzhen Mindray Bio-Medical Electronics Co., Ltd. Class “A” (Health care equipment & supplies) 109,168 6,647Silergy Corporation (Semiconductors & semiconductor equipment) 156,000 12,602Tencent Holdings, Ltd. (Interactive Media & Services) 922,060 72,350
* Topchoice Medical Corporation Class “A” (Health care providers & services) 69,100 2,641Topsports International Holdings, Ltd. (Specialty retail) 430,000 641
* Weimob, Inc. (Software) 1,287,000 2,877Wuliangye Yibin Co., Ltd. Class “A” (Beverages) 208,894 8,540WuXi AppTec Co., Ltd. Class “H” (Life sciences tools & services) 366,400 7,206
* Wuxi Biologics Cayman, Inc. (Life sciences tools & services) 1,109,500 13,894Yifeng Pharmacy Chain Co., Ltd. Class “A” (Food & staples retailing) 193,360 2,616
* Yihai International Holding, Ltd. (Food products) 140,000 1,450Zhangzhou Pientzehuang Pharmaceutical Co., Ltd. Class “A” (Pharmaceuticals) 140,229 6,139Zhongsheng Group Holdings, Ltd. (Specialty retail) 1,003,000 7,070
362,107
India—15.2%* Affle India, Ltd. (Media) 40,279 3,002* Amber Enterprises India, Ltd. (Household durables) 72,343 3,285* APL Apollo Tubes, Ltd. (Metals & mining) 138,621 2,645
Apollo Hospitals Enterprise, Ltd. (Health care providers & services) 90,999 3,603Asian Paints, Ltd. (Chemicals) 198,241 6,879Astral Poly Technik, Ltd. (Building products) 117,675 2,614
* Bajaj Finance, Ltd. (Consumer finance) 74,757 5,254Crompton Greaves Consumer Electricals, Ltd. (Household durables) 790,593 4,184
See accompanying Notes to Portfolio of Investments. 53

Emerging Markets Growth Fund
Portfolio of Investments, March 31, 2021 (all dollar amounts in thousands) (unaudited)
Issuer Shares Value
Common Stocks—(continued)
Emerging Asia—(continued)
India — (continued)Dabur India, Ltd. (Personal products) 557,669 $ 4,119
* Divi’s Laboratories, Ltd. (Life sciences tools & services) 79,057 3,894* Dixon Technologies India, Ltd. (Household durables) 89,815 4,519
Dr. Lal PathLabs, Ltd. (Health care providers & services) 67,431 2,490Escorts, Ltd. (Machinery) 152,041 2,680Havells India, Ltd. (Electrical equipment) 367,731 5,295
* HDFC Bank, Ltd. (Banks) 917,527 18,754* HDFC Life Insurance Co., Ltd. (Insurance) 271,958 2,584
Hindustan Unilever, Ltd. (Household products) 110,590 3,660Housing Development Finance Corporation, Ltd. (Thrifts & mortgage finance) 429,885 14,723
* IndiaMart InterMesh, Ltd. (Trading companies & distributors) 28,551 3,028Indraprastha Gas, Ltd. (Gas utilities) 409,445 2,867Info Edge India, Ltd. (Interactive Media & Services) 84,500 4,947
* JK Cement, Ltd. (Construction materials) 72,451 2,844Kajaria Ceramics, Ltd. (Building products) 230,460 2,919Larsen & Toubro Infotech, Ltd. (IT services) 53,034 2,954
* MakeMyTrip, Ltd. (Internet & direct marketing retail)† 80,368 2,538Nestle India, Ltd. (Food products) 14,133 3,306PI Industries, Ltd. (Chemicals) 106,423 3,266
* Pidilite Industries, Ltd. (Chemicals) 219,788 5,441Reliance Industries, Ltd. (Oil, gas & consumable fuels) 770,511 20,256SRF, Ltd. (Chemicals) 55,836 4,124Tata Consultancy Services, Ltd. (IT services) 279,173 12,124Tata Consumer Products, Ltd. (Food products) 461,224 4,015Tata Elxsi, Ltd. (Software) 88,976 3,270Varun Beverages, Ltd. (Beverages) 217,101 3,001
175,084
Indonesia—1.3%Bank Central Asia Tbk PT (Banks) 4,253,399 9,100Bank Rakyat Indonesia Persero Tbk PT (Banks) 17,783,900 5,387
14,487
South Korea—14.4%Hansol Chemical Co., Ltd. (Chemicals) 23,854 5,080JYP Entertainment Corporation (Entertainment) 64,197 2,019Kakao Corporation (Interactive Media & Services) 60,295 26,531LEENO Industrial, Inc. (Semiconductors & semiconductor equipment) 32,112 4,441LG Household & Health Care, Ltd. (Personal products) 6,153 8,536NAVER Corporation (Interactive Media & Services) 60,552 20,171NCSoft Corporation (Entertainment) 7,255 5,596
* NHN KCP Corporation (IT services) 57,859 2,561NICE Information Service Co., Ltd. (Professional services) 135,497 3,035PI Advanced Materials Co., Ltd. (Chemicals) 62,017 2,504Samsung Electronics Co., Ltd. (Technology hardware, storage & peripherals) 849,021 61,065Samsung SDI Co., Ltd. (Electronic equipment, instruments & components) 13,339 7,779SK Hynix, Inc. (Semiconductors & semiconductor equipment) 109,747 12,849WONIK IPS Co., Ltd. (Semiconductors & semiconductor equipment) 83,017 3,792
165,959
Taiwan—22.5%Accton Technology Corporation (Communications equipment) 368,000 3,560
See accompanying Notes to Portfolio of Investments. 54

Emerging Markets Growth Fund
Portfolio of Investments, March 31, 2021 (all dollar amounts in thousands) (unaudited)
Issuer Shares Value
Common Stocks—(continued)
Emerging Asia—(continued)
Taiwan — (continued)Advantech Co., Ltd. (Technology hardware, storage & peripherals) 442,766 $ 5,493Airtac International Group (Machinery) 357,000 12,574Alchip Technologies, Ltd. (Semiconductors & semiconductor equipment) 127,000 4,006ASMedia Technology, Inc. (Semiconductors & semiconductor equipment) 106,000 5,535ASPEED Technology, Inc. (Semiconductors & semiconductor equipment) 122,000 7,376Bizlink Holding, Inc. (Electrical equipment) 293,000 2,731Chailease Holding Co., Ltd. (Diversified financial services) 809,000 5,586E.Sun Financial Holding Co., Ltd. (Banks) 4,323,313 3,955Elite Material Co., Ltd. (Electronic equipment, instruments & components) 497,000 2,944Globalwafers Co., Ltd. (Semiconductors & semiconductor equipment) 174,000 4,574Hiwin Technologies Corporation (Machinery) 396,000 5,586Lotes Co., Ltd. (Electronic equipment, instruments & components) 213,000 3,729MediaTek, Inc. (Semiconductors & semiconductor equipment) 1,204,000 40,889momo.com, Inc. (Internet & direct marketing retail) 153,000 5,309Parade Technologies, Ltd. (Semiconductors & semiconductor equipment) 142,000 6,096Poya International Co., Ltd. (Multiline retail) 100,000 2,089Realtek Semiconductor Corporation (Semiconductors & semiconductor equipment) 380,000 6,579RichWave Technology Corporation (Semiconductors & semiconductor equipment) 205,000 4,555Sinbon Electronics Co., Ltd. (Electronic equipment, instruments & components) 555,000 5,135Taiwan Semiconductor Manufacturing Co., Ltd. (Semiconductors & semiconductor equipment) 1,656,000 34,068Taiwan Semiconductor Manufacturing Co., Ltd.—ADR (Semiconductors & semiconductor equipment) 642,472 75,992Voltronic Power Technology Corporation (Electrical equipment) 120,586 4,670Win Semiconductors Corporation (Semiconductors & semiconductor equipment) 167,000 2,288Wiwynn Corporation (Technology hardware, storage & peripherals) 131,000 3,870
259,189
Thailand—1.4%Com7 PCL Class “F” (Specialty retail) 1,589,900 3,256
* Sea, Ltd.—ADR (Entertainment) 55,498 12,38915,645
Vietnam—0.5%Hoa Phat Group JSC (Metals & mining) 2,816,060 5,711
Emerging Europe, Africa—6.1%
Kenya—0.3%Safaricom plc (Wireless telecommunication services) 9,010,054 2,999
Poland—1.2%* Allegro.eu S.A. (Internet & direct marketing retail) 352,438 4,956* Dino Polska S.A. (Food & staples retailing) 94,565 6,236* InPost S.A. (Air freight & logistics) 196,588 3,219
14,411
Russia—2.5%TCS Group Holding plc—GDR (Banks) 202,324 11,735
See accompanying Notes to Portfolio of Investments. 55

Emerging Markets Growth Fund
Portfolio of Investments, March 31, 2021 (all dollar amounts in thousands) (unaudited)
Issuer
Shares orPrincipalAmount Value
Common Stocks—(continued)
Emerging Europe, Africa—(continued)
Russia — (continued)* Yandex N.V. Class “A” (Interactive Media & Services)† 260,882 $ 16,712
28,447
South Africa—2.1%* Capitec Bank Holdings, Ltd. (Banks) 44,689 4,299
Clicks Group, Ltd. (Food & staples retailing) 232,933 3,794Naspers, Ltd. Class “N” (Internet & direct marketing retail) 67,782 16,218
24,311
Emerging Latin America—6.6%
Argentina—2.0%* Globant S.A. (IT services)† 29,732 6,173* MercadoLibre, Inc. (Internet & direct marketing retail) 11,451 16,857
23,030
Brazil—4.2%B3 S.A. - Brasil Bolsa Balcao (Capital markets) 621,200 6,028Localiza Rent a Car S.A. (Road & rail) 443,500 4,706Locaweb Servicos de Internet S.A. (IT services) 873,000 3,544Magazine Luiza S.A. (Multiline retail) 2,058,300 7,402
* Patria Investments, Ltd. Class “A” (Capital markets)† 209,163 3,644* StoneCo, Ltd. Class “A” (IT services)† 126,803 7,763
TOTVS S.A. (Software) 935,300 4,807* Vinci Partners Investments, Ltd. Class “A” (Capital markets)† 235,828 3,101
WEG S.A. (Electrical equipment) 512,220 6,78547,780
Mexico—0.4%Wal-Mart de Mexico S.A.B. de C.V. (Food & staples retailing) 1,496,300 4,726
Total Common Stocks—99.5%(cost $790,274) 1,143,886
Repurchase AgreementFixed Income Clearing Corporation, 0.000% dated 3/31/21, due 4/1/21, repurchase price $4,706, collateralized by U.S. Treasury
Bond, 2.000%, due 2/15/50, valued at $4,800 $ 4,706 4,706
Total Repurchase Agreement—0.4%(cost $4,706) 4,706
Total Investments—99.9%(cost $794,980) 1,148,592
Cash and other assets, less liabilities—0.1% 1,422
Net assets—100.0% $ 1,150,014
ADR = American Depository ReceiptGDR = Global Depository Receipt* = Non-income producing security† = U.S. listed foreign security
See accompanying Notes to Portfolio of Investments. 56

Emerging Markets Growth Fund
Portfolio of Investments, March 31, 2021 (unaudited)
At March 31, 2021, the Fund’s Portfolio of Investments includes the following industry categories (as a percentage of long-term investments):
Information Technology 32.4%Consumer Discretionary 17.4%Communication Services 15.9%Financials 9.2%Industrials 7.5%Consumer Staples 5.9%Health Care 5.8%Materials 3.8%Energy 1.8%Utilities 0.3%Total 100.0%
At March 31, 2021, the Fund’s Portfolio of Investments includes the following currency categories (as a percentage of long-term investments):
Hong Kong Dollar 22.7%New Taiwan Dollar 17.1%Indian Rupee 15.1%South Korean Won 14.5%U.S. Dollar 13.7%Chinese Yuan Renminbi 7.9%Brazilian Real 2.9%South African Rand 2.1%Indonesian Rupiah 1.3%All Other Currencies 2.7%Total 100.0%
See accompanying Notes to Portfolio of Investments. 57

Emerging Markets Small Cap Growth Fund
Portfolio of Investments, March 31, 2021 (all dollar amounts in thousands) (unaudited)
Issuer Shares Value
Common Stocks
Emerging Asia—81.4%
Cambodia—0.4%NagaCorp, Ltd. (Hotels, restaurants & leisure) 1,094,000 $ 1,292
China—14.1%A-Living Smart City Services Co., Ltd. (Commercial services & supplies) 108,750 483By-health Co., Ltd. Class “A” (Personal products) 106,700 466Centre Testing International Group Co., Ltd. Class “A” (Professional services) 1,623,205 7,057Chacha Food Co., Ltd. Class “A” (Food products) 117,673 880Changzhou Xingyu Automotive Lighting Systems Co., Ltd. Class “A” (Auto components) 91,747 2,645China Lesso Group Holdings, Ltd. (Building products) 803,000 1,727China Meidong Auto Holdings, Ltd. (Specialty retail) 506,000 2,346
* Estun Automation Co., Ltd. Class “A” (Machinery) 214,800 848Ever Sunshine Lifestyle Services Group, Ltd. (Commercial services & supplies) 1,254,000 3,155
* iClick Interactive Asia Group, Ltd.—ADR (Media) 133,859 1,576Jiangsu Hengshun Vinegar Industry Co., Ltd. Class “A” (Food products) 107,000 311
* Jiumaojiu International Holdings, Ltd. (Hotels, restaurants & leisure) 1,411,000 5,645JNBY Design, Ltd. (Textiles, apparel & luxury goods) 536,500 959
* Kingsoft Cloud Holdings, Ltd.—ADR (IT services) 95,287 3,747Ovctek China, Inc. Class “A” (Health care equipment & supplies) 64,577 888Proya Cosmetics Co., Ltd. Class “A” (Personal products) 111,324 2,706Shanghai M&G Stationery, Inc. Class “A” (Commercial services & supplies) 104,219 1,358Silergy Corporation (Semiconductors & semiconductor equipment) 17,000 1,373Topsports International Holdings, Ltd. (Specialty retail) 524,000 781
* Weimob, Inc. (Software) 1,994,000 4,458Zhejiang Dingli Machinery Co., Ltd. Class “A” (Machinery) 260,271 3,824
47,233
India—35.8%Aarti Industries, Ltd. (Chemicals) 170,022 3,070
* Affle India, Ltd. (Media) 56,279 4,195* Amber Enterprises India, Ltd. (Household durables) 93,882 4,263
Apollo Hospitals Enterprise, Ltd. (Health care providers & services) 41,931 1,660Astral Poly Technik, Ltd. (Building products) 258,282 5,737
* Atul, Ltd. (Chemicals) 50,804 4,924* AU Small Finance Bank Ltd. (Banks) 514,001 8,689
Balkrishna Industries, Ltd. (Auto components) 237,768 5,483Berger Paints India, Ltd. (Chemicals) 169,966 1,778Cholamandalam Investment and Finance Co., Ltd. (Consumer finance) 520,714 3,984
* City Union Bank, Ltd. (Banks) 552,133 1,178Coforge, Ltd. (IT services) 61,549 2,458Computer Age Management Services, Ltd. (IT services) 70,283 1,773Crompton Greaves Consumer Electricals, Ltd. (Household durables) 449,644 2,379
* Dixon Technologies India, Ltd. (Household durables) 67,786 3,411Dr. Lal PathLabs, Ltd. (Health care providers & services) 70,091 2,588
* Endurance Technologies, Ltd. (Auto components) 44,731 869Escorts, Ltd. (Machinery) 250,095 4,408
* Godrej Properties, Ltd. (Real estate management & development) 207,670 3,991Havells India, Ltd. (Electrical equipment) 56,795 818HDFC Asset Management Co., Ltd. (Capital markets) 38,713 1,545
* IndiaMart InterMesh Ltd. (Trading companies & distributors) 41,819 4,436Indraprastha Gas, Ltd. (Gas utilities) 272,020 1,905
* JK Cement, Ltd. (Construction materials) 71,319 2,800Kajaria Ceramics, Ltd. (Building products) 68,037 862
See accompanying Notes to Portfolio of Investments. 58

Emerging Markets Small Cap Growth Fund
Portfolio of Investments, March 31, 2021 (all dollar amounts in thousands) (unaudited)
Issuer Shares Value
Common Stocks—(continued)
Emerging Asia—(continued)
India — (continued)Kansai Nerolac Paints, Ltd. (Chemicals) 231,860 $ 1,912
* KEC International, Ltd. (Construction & engineering) 280,482 1,573Larsen & Toubro Infotech Ltd. (IT services) 74,981 4,177
* MakeMyTrip, Ltd. (Internet & direct marketing retail)† 44,533 1,406Metropolis Healthcare, Ltd. (Health care providers & services) 32,404 986
* Motherson Sumi Systems, Ltd. (Auto components) 927,132 2,549Navin Fluorine International, Ltd. (Chemicals) 65,031 2,467
* Oberoi Realty, Ltd. (Real estate management & development) 273,582 2,170PI Industries, Ltd. (Chemicals) 91,148 2,797
* Pidilite Industries, Ltd. (Chemicals) 38,159 945Radico Khaitan, Ltd. (Beverages) 94,832 722
* RBL Bank, Ltd. (Banks) 262,945 746* Relaxo Footwears, Ltd. (Textiles, apparel & luxury goods) 241,255 2,910
SRF, Ltd. (Chemicals) 56,608 4,181Sundram Fasteners, Ltd. (Auto components) 124,295 1,377Tata Elxsi, Ltd. (Software) 67,563 2,483Trent, Ltd. (Multiline retail) 259,146 2,652
* V-Mart Retail, Ltd. (Multiline retail) 22,228 839Varun Beverages, Ltd. (Beverages) 307,121 4,245
120,341
Indonesia—0.9%PT Bank Tabungan Pensiunan Nasional Syariah Tbk (Banks) 12,377,000 2,965
Malaysia—1.0%Inari Amertron Bhd (Electronic equipment, instruments & components) 4,464,100 3,531
Philippines—0.6%Wilcon Depot, Inc. (Specialty retail) 5,817,700 2,134
South Korea—8.7%* Doosan Fuel Cell Co., Ltd. (Electrical equipment) 40,882 1,853
Douzone Bizon Co., Ltd. (Software) 37,411 3,246F&F Co., Ltd. (Textiles, apparel & luxury goods) 15,617 1,759Hansol Chemical Co., Ltd. (Chemicals) 22,464 4,784LEENO Industrial, Inc. (Semiconductors & semiconductor equipment) 38,027 5,259
* NHN KCP Corporation (IT services) 58,601 2,594NICE Information Service Co., Ltd. (Professional services) 192,161 4,304PI Advanced Materials Co., Ltd. (Chemicals) 22,197 896WONIK IPS Co., Ltd. (Semiconductors & semiconductor equipment) 98,651 4,507
29,202
Taiwan—16.5%Airtac International Group (Machinery) 252,000 8,876Alchip Technologies, Ltd. (Semiconductors & semiconductor equipment) 82,000 2,587ASMedia Technology, Inc. (Semiconductors & semiconductor equipment) 68,000 3,551ASPEED Technology, Inc. (Semiconductors & semiconductor equipment) 93,000 5,622Bizlink Holding, Inc. (Electrical equipment) 158,000 1,473Elite Material Co., Ltd. (Electronic equipment, instruments & components) 258,000 1,528Hiwin Technologies Corporation (Machinery) 120,106 1,694Lotes Co., Ltd. (Electronic equipment, instruments & components) 284,000 4,972momo.com, Inc. (Internet & direct marketing retail) 77,000 2,672Parade Technologies, Ltd. (Semiconductors & semiconductor equipment) 83,000 3,563
See accompanying Notes to Portfolio of Investments. 59

Emerging Markets Small Cap Growth Fund
Portfolio of Investments, March 31, 2021 (all dollar amounts in thousands) (unaudited)
Issuer Shares Value
Common Stocks—(continued)
Emerging Asia—(continued)
Taiwan — (continued)Poya International Co., Ltd. (Multiline retail) 55,000 $ 1,149RichWave Technology Corporation (Semiconductors & semiconductor equipment) 237,000 5,266Sinbon Electronics Co., Ltd. (Electronic equipment, instruments & components) 842,000 7,791Sporton International, Inc. (Professional services) 197,000 1,698Voltronic Power Technology Corporation (Electrical equipment) 77,507 3,002
55,444
Thailand—2.9%Carabao Group PCL Class “F” (Beverages) 207,100 855Com7 PCL Class “F” (Specialty retail) 2,652,500 5,432
* Muangthai Capital PCL (Consumer finance) 1,465,500 3,3189,605
Vietnam—0.5%Hoa Phat Group JSC (Metals & mining) 825,126 1,673
Emerging Latin America—9.4%
Brazil—7.2%* Aeris Industria E Comercio De Equipamentos Para Geracao De Energia S.A. (Electrical equipment) 494,100 776
Arezzo Industria e Comercio S.A. (Textiles, apparel & luxury goods) 77,600 970Cyrela Brazil Realty S.A. Empreendimentos e Participacoes (Household durables) 191,200 838Locaweb Servicos de Internet S.A. (IT services) 2,013,078 8,172Pet Center Comercio e Participacoes S.A. (Specialty retail) 926,300 3,257
* Sequoia Logistica e Transportes S.A. (Air freight & logistics) 504,100 2,375Tegma Gestao Logistica S.A. (Road & rail) 378,800 1,267TOTVS S.A. (Software) 970,500 4,988
* Vinci Partners Investments, Ltd. Class “A” (Capital markets)† 120,900 1,59024,233
Mexico—2.2%* Grupo Aeroportuario del Centro Norte S.A.B. de C.V. (Transportation infrastructure) 525,699 3,316* Grupo Aeroportuario del Sureste S.A.B. de C.V. Class “B” (Transportation infrastructure) 226,710 4,026
7,342
Emerging Europe, Mid-East, Africa—7.0%
Greece—1.3%JUMBO S.A. (Specialty retail) 37,751 692Terna Energy S.A. (Independent power & renewable electricity producers) 240,451 3,553
4,245
Kenya—0.5%Safaricom plc (Wireless telecommunication services) 5,534,100 1,842
Poland—1.7%* Dino Polska S.A. (Food & staples retailing) 85,624 5,646
Russia—1.9%HeadHunter Group plc—ADR (Professional services) 62,976 2,136
See accompanying Notes to Portfolio of Investments. 60

Emerging Markets Small Cap Growth Fund
Portfolio of Investments, March 31, 2021 (all dollar amounts in thousands) (unaudited)
Issuer Shares Value
Common Stocks—(continued)
Emerging Europe, Mid-East, Africa—(continued)
Russia — (continued)TCS Group Holding plc—GDR (Banks) 72,556 $ 4,209
6,345
South Africa—1.2%Clicks Group, Ltd. (Food & staples retailing) 52,979 863
* Transaction Capital, Ltd. (Consumer finance) 1,593,631 3,3424,205
United Arab Emirates—0.4%Abu Dhabi National Oil Co. for Distribution PJSC (Specialty retail) 1,145,467 1,400
Total Common Stocks—97.8%(cost $253,596) 328,678
Preferred Stock
Brazil—1.1%Randon S.A. Implementos e Participacoes (Machinery) 1,489,050 3,624
Total Preferred Stock—1.1%(cost $3,391) 3,624
Total Investments—98.9%(cost $256,987) 332,302
Cash and other assets, less liabilities—1.1% 3,669
Net assets—100.0% $ 335,971
ADR = American Depository ReceiptGDR = Global Depository Receipt* = Non-income producing security† = U.S. listed foreign security
See accompanying Notes to Portfolio of Investments. 61

Emerging Markets Small Cap Growth Fund
Portfolio of Investments, March 31, 2021 (unaudited)
At March 31, 2021, the Fund’s Portfolio of Investments includes the following industry categories (as a percentage of long-term investments):
Information Technology 26.4%Industrials 23.1%Consumer Discretionary 18.7%Materials 9.7%Financials 9.5%Consumer Staples 5.0%Communication Services 2.3%Real Estate 1.9%Health Care 1.8%Utilities 1.6%Total 100.0%
At March 31, 2021, the Fund’s Portfolio of Investments includes the following currency categories (as a percentage of long-term investments):
Indian Rupee 35.8%New Taiwan Dollar 17.1%South Korean Won 8.8%Brazilian Real 7.9%Chinese Yuan Renminbi 6.3%Hong Kong Dollar 6.3%U.S. Dollar 4.4%Thai Baht 2.9%Mexican Peso 2.2%Polish Zloty 1.7%Euro 1.3%South African Rand 1.3%Malaysian Ringgit 1.0%All Other Currencies 3.0%Total 100.0%
See accompanying Notes to Portfolio of Investments. 62

Bond Fund
Portfolio of Investments, March 31, 2021 (all dollar amounts in thousands) (unaudited)
IssuerPrincipalAmount Value
U.S. Government and U.S. Government Agency—58.4%
U.S. Treasury Inflation Indexed Notes/Bonds—6.1%U.S. Treasury Inflation Indexed Bond, 1.375%, due 2/15/44 $ 2,806 $ 3,654U.S. Treasury Inflation Indexed Bond, 3.875%, due 4/15/29 11,137 15,630
Total U.S. Treasury Inflation Indexed Notes/Bonds 19,284
U.S. Treasury—9.7%U.S. Treasury Bill, 0.103%, due 4/22/21 1,500 1,500U.S. Treasury Bill, 0.107%, due 7/15/21(a) 1,000 1,000U.S. Treasury Bill, 0.123%, due 10/7/21(a) 3,000 3,000U.S. Treasury Note, 0.315%, due 10/31/21 7,500 7,509U.S. Treasury Note, 1.125%, due 2/28/27 2,250 2,243U.S. Treasury Strip Principal, 0.000%, due 8/15/27 4,750 4,378U.S. Treasury Note, 0.625%, due 5/15/30 2,100 1,910U.S. Treasury Note, 0.625%, due 8/15/30 4,300 3,894U.S. Treasury Bond, 1.125%, due 5/15/40 2,000 1,628U.S. Treasury Bond, 2.375%, due 11/15/49 2,267 2,247U.S. Treasury Bond, 1.250%, due 5/15/50 1,500 1,128
Total U.S. Treasury 30,437
Federal Home Loan Mortgage Corp. (FHLMC)—10.3%#J02986, 6.500%, due 7/1/21 — —(b)
#G30255, 7.000%, due 7/1/21 — —(b)
#G02210, 7.000%, due 12/1/28 25 28#G02183, 6.500%, due 3/1/30 3 3#G01400, 7.000%, due 4/1/32 322 381#G01728, 7.500%, due 7/1/32 50 60#C01385, 6.500%, due 8/1/32 39 46#ZT1221, 5.500%, due 1/1/33 447 520#C01623, 5.500%, due 9/1/33 45 53#A15039, 5.500%, due 10/1/33 2 2#A17603, 5.500%, due 1/1/34 1,180 1,378#G01843, 6.000%, due 6/1/35 9 11#A62858, 6.500%, due 7/1/37 55 63#G03170, 6.500%, due 8/1/37 99 118#A78138, 5.500%, due 6/1/38 122 141#G04466, 5.500%, due 7/1/38 8,324 9,860#G60366, 6.000%, due 10/1/39 8,018 9,586#G61450, 6.000%, due 4/1/40 8,496 10,203#C03665, 9.000%, due 4/1/41 168 205
Total FHLMC Mortgage Obligations 32,658
Federal National Mortgage Association (FNMA)—32.3%#900725, 6.000%, due 8/1/21 1 1#893325, 7.000%, due 9/1/21 — —(b)
#735104, 7.000%, due 5/1/22 — —(b)
#255956, 5.500%, due 10/1/25 5 5#AL2853, 4.500%, due 6/1/26 1,791 1,896#252925, 7.500%, due 12/1/29 — 1#AD0729, 7.500%, due 12/1/30 2,153 2,516#535977, 6.500%, due 4/1/31 3 4#253907, 7.000%, due 7/1/31 1 1#587849, 6.500%, due 11/1/31 4 4#545437, 7.000%, due 2/1/32 24 27
See accompanying Notes to Portfolio of Investments. 63

Bond Fund
Portfolio of Investments, March 31, 2021 (all dollar amounts in thousands) (unaudited)
IssuerPrincipalAmount Value
U.S. Government and U.S. Government Agency—(continued)
Federal National Mortgage Association (FNMA) — (continued)#545869, 6.500%, due 7/1/32 $ 703 $ 825#545759, 6.500%, due 7/1/32 201 234#670385, 6.500%, due 9/1/32 297 352#AD0725, 7.000%, due 12/1/32 999 1,184#254548, 5.500%, due 12/1/32 19 22#555340, 5.500%, due 4/1/33 150 175#741850, 5.500%, due 9/1/33 234 273#555800, 5.500%, due 10/1/33 22 25#AL3455, 5.500%, due 11/1/33 3,323 3,876#CA2754, 4.500%, due 11/1/33 574 629#756153, 5.500%, due 11/1/33 228 266#AL3401, 5.500%, due 2/1/34 653 762#763798, 5.500%, due 3/1/34 41 48#725228, 6.000%, due 3/1/34 2,148 2,524#725611, 5.500%, due 6/1/34 49 58#745563, 5.500%, due 8/1/34 282 329#AL6413, 8.000%, due 8/1/34 257 295#794474, 6.000%, due 10/1/34 25 30#745092, 6.500%, due 7/1/35 161 186#AL6412, 7.500%, due 9/1/35 430 494#357944, 6.000%, due 9/1/35 7 8#AD0979, 7.500%, due 10/1/35 29 35#CA8368, 2.000%, due 12/1/35 4,878 5,040#888305, 7.000%, due 3/1/36 5 6#895637, 6.500%, due 5/1/36 31 37#831540, 6.000%, due 6/1/36 12 15#893318, 6.500%, due 8/1/36 7 8#831926, 6.000%, due 12/1/36 336 402#902974, 6.000%, due 12/1/36 92 110#AB0265, 6.000%, due 2/1/37 6,577 7,900#938440, 6.000%, due 7/1/37 51 61#948689, 6.000%, due 8/1/37 65 75#AL6411, 7.000%, due 12/1/37 1,048 1,202#AL0904, 5.500%, due 1/1/38 59 69#986856, 6.500%, due 9/1/38 49 58#FM1735, 6.500%, due 10/1/38 3,848 4,684#991911, 7.000%, due 11/1/38 71 81#995076, 6.000%, due 11/1/38 2,976 3,588#FM2467, 6.000%, due 1/1/39 3,654 4,412#AD0752, 7.000%, due 1/1/39 334 413#AC1619, 5.500%, due 8/1/39 165 192#FM1736, 6.500%, due 10/1/39 6,288 7,569#BM5204, 6.500%, due 6/1/40 3,877 4,662#AD7137, 5.500%, due 7/1/40 2,250 2,628#BM1689, 5.500%, due 8/1/40 1,826 2,138#AL5815, 5.500%, due 4/1/41 2,225 2,601#BM3525, 6.000%, due 4/1/41 7,996 9,573#AL9226, 5.500%, due 12/1/41 9,385 11,075#AL9225, 6.000%, due 1/1/42 4,097 4,903#BM5121, 5.500%, due 12/1/48 9,585 11,466
Total FNMA Mortgage Obligations 102,053
See accompanying Notes to Portfolio of Investments. 64

Bond Fund
Portfolio of Investments, March 31, 2021 (all dollar amounts in thousands) (unaudited)
IssuerPrincipalAmount Value
Asset-Backed Securities—1.5%Tesla Auto Lease Trust—144A, 2019-A, Tranche D,
3.370%, 1/20/23 $ 650 $ 675Tesla Auto Lease Trust—144A, 2019-A, Tranche E,
5.480%, 5/22/23 1,000 1,056GM Financial Automobile Leasing Trust, 2020-1, Tranche D,
2.280%, 6/20/24 3,050 3,116
Total Asset-Backed Securities 4,847
Corporate Obligations—39.5%Fresenius Medical Care US Finance II, Inc.—144A,
5.875%, due 1/31/22 1,000 1,043Jones Lang LaSalle, Inc.,
4.400%, due 11/15/22 2,500 2,619Ford Motor Credit Co. LLC,
3M USD LIBOR + 1.235%, 1.429%, due 2/15/23, VRN 700 693Toll Brothers Finance Corporation,
4.375%, due 4/15/23 1,250 1,309CNH Industrial Capital LLC,
1.950%, due 7/2/23 2,500 2,568Wells Fargo & Co.,
4.480%, due 1/16/24 1,500 1,651AT&T, Inc.,
SOFR + 0.640%, 0.650%, due 3/25/24, VRN 750 751Lennar Corporation,
4.500%, due 4/30/24 2,450 2,670Banco Inbursa S.A. Institucion de Banca Multiple—144A,
4.125%, due 6/6/24 2,000 2,135Grupo Bimbo S.A.B. de C.V.—144A,
3.875%, due 6/27/24 2,000 2,157JPMorgan Chase & Co.,
SOFR + 3.125%, 4.600%, due 2/1/25, VRN 3,000 3,038Ford Motor Co.,
9.000%, due 4/22/25 700 849American Tower Corporation,
4.000%, due 6/1/25 2,500 2,750Simon Property Group L.P.,
3.300%, due 1/15/26 2,750 2,945Royal Bank of Canada,
SOFR + 0.525%, 0.554%, due 1/20/26, VRN 3,100 3,095The Bank of Nova Scotia,
SOFR + 0.545%, 0.557%, due 3/2/26, VRN 3,100 3,093Verizon Communications, Inc.,
SOFR + 0.790%, 0.800%, due 3/20/26, VRN 3,000 3,020Republic Services, Inc.,
2.900%, due 7/1/26 2,500 2,667Xylem, Inc.,
3.250%, due 11/1/26 2,225 2,419Fibria Overseas Finance, Ltd.,
5.500%, due 1/17/27 2,000 2,277Gilead Sciences, Inc.,
1.200%, due 10/1/27 1,600 1,535Motorola Solutions, Inc.,
4.600%, due 2/23/28 2,750 3,131
See accompanying Notes to Portfolio of Investments. 65

Bond Fund
Portfolio of Investments, March 31, 2021 (all dollar amounts in thousands) (unaudited)
IssuerPrincipalAmount Value
Corporate Obligations—(continued)TreeHouse Foods, Inc.,
4.000%, due 9/1/28 $ 1,400 $ 1,412Roper Technologies, Inc.,
4.200%, due 9/15/28 2,500 2,816TransDigm, Inc.—144A,
4.625%, due 1/15/29 500 493ACCO Brands Corp.—144A,
4.250%, due 3/15/29 2,000 1,949The Kroger Co.,
8.000%, due 9/15/29 2,000 2,735Toll Brothers Finance Corporation,
3.800%, due 11/1/29 1,500 1,588United Rentals North America, Inc.,
5.250%, due 1/15/30 1,250 1,360Omnicom Group, Inc.,
2.450%, due 4/30/30 2,800 2,771Abbott Laboratories,
1.400%, due 6/30/30 2,000 1,870Intuit, Inc.,
1.650%, due 7/15/30 1,200 1,139FLIR Systems, Inc.,
2.500%, due 8/1/30 2,500 2,449Alphabet, Inc.,
1.100%, due 8/15/30 2,620 2,410Johnson Controls International plc,
1.750%, due 9/15/30 2,100 1,970Fresenius Medical Care U.S. Finance III, Inc.—144A,
2.375%, due 2/16/31 1,800 1,718Goodyear Tire & Rubber Co.,
5.250%, due 4/30/31 2,000 2,000Boston Properties L.P.,
2.550%, due 4/1/32 1,585 1,520Costco Wholesale Corporation,
1.750%, due 4/20/32 2,500 2,390Owens Corning,
7.000%, due 12/1/36 2,250 3,078Yum! Brands, Inc.,
6.875%, due 11/15/37 1,250 1,518ConocoPhillips,
6.500%, due 2/1/39 2,000 2,852Citigroup, Inc.,
5.875%, due 1/30/42 2,000 2,715Bank of America Corporation,
5.875%, due 2/7/42 2,000 2,735Orbia Advance Corp S.A.B. de C.V. —144A,
5.875%, due 9/17/44 2,250 2,636AbbVie, Inc.,
4.700%, due 5/14/45 2,250 2,675ERP Operating L.P.,
4.500%, due 6/1/45 2,500 2,916Apple, Inc.,
4.650%, due 2/23/46 2,250 2,797PepsiCo, Inc.,
4.450%, due 4/14/46 2,250 2,723
See accompanying Notes to Portfolio of Investments. 66

Bond Fund
Portfolio of Investments, March 31, 2021 (all dollar amounts in thousands) (unaudited)
IssuerPrincipalAmount Value
Corporate Obligations—(continued)Activision Blizzard, Inc.,
2.500%, due 9/15/50 $ 2,600 $ 2,181AT&T, Inc.,
5.700%, due 3/1/57 2,000 2,549Comcast Corporation,
4.950%, due 10/15/58 2,000 2,613Altria Group, Inc.,
6.200%, due 2/14/59 2,250 2,742Amazon.com, Inc.,
2.700%, due 6/3/60 2,500 2,214Microsoft Corporation,
3.041%, due 3/17/62 2,032 1,992Corning, Inc.,
5.850%, due 11/15/68 2,150 2,840
Total Corporate Obligations 124,781
Total Long-Term Investments—98.4%(cost $303,205) 314,060
Repurchase Agreement—0.1%Fixed Income Clearing Corporation, 0.000% dated 3/31/21, due 4/1/21, repurchase price $163, collateralized by U.S. Treasury Note,
2.250%, due 11/15/27, valued at $167 163 163
Total Repurchase Agreement—0.1%(cost $163) 163
Commercial Paper—0.7%Ameren Corporation,
0.112%, due 4/1/21 2,200 2,200
Total Commercial Paper—0.7%(cost $2,200) 2,200
Total Investments—100.2%(cost $305,568) 316,423
Securities Sold , Not Yet Purchased
U.S. Government Agency—(1.7)%
Federal National Mortgage Association (FNMA)—(1.7)% TBA, 4.000%, due 5/1/51 (5,000) (5,372)
Total Securities Sold , Not Yet Purchased—(1.7)%(proceeds $5,373) (5,372)
Cash and other assets, less liabilities—1.5% 4,895
Net assets—100.0% $ 315,946
The obligations of certain U.S. Government-sponsored securities are neither issued nor guaranteed by the U.S. Treasury.
See accompanying Notes to Portfolio of Investments. 67

Bond Fund
Portfolio of Investments, March 31, 2021 (all dollar amounts in thousands) (unaudited)
144A = Security exempt from registration under Rule 144A of the Securities Act of 1933. These securities may be resold in transactions exempt from registration, normally to qualified institutional buyers.SOFR = Secured Overnight Financing RateTBA = To Be Announced—TBAs are mortgage-backed securities traded under delayed delivery commitments, settling after March 31, 2021. The term TBA comes from the fact that the specific mortgage-backed security that will be delivered to fulfill a TBA trade is not designated at the time the trade is made.VRN = Variable Rate Note(a) Security, or a portion of security, is segregated as collateral for the centrally cleared credit default swaps, aggregating a total of $1,119 (in thousands).(b) Amount is less than the minimum amount disclosed.
Centrally Cleared Credit Default Swaps
Reference Entity
Buy/Sell Protection
Fixed Deal Pay Rate
PaymentFrequency
MaturityDate
Cleared Exchange
NotionalAmount
(in thousands)
UpfrontPayment
Paid(Received) Value
UnrealizedAppreciation
(Depreciation)CDX.NA.HY- 34 Buy 5.000% 3M June 2025 ICE $ 9,200 $ (221) $ (863) $ (642)CDX.NA.HY- 35 Buy 5.000% 3M December 2025 ICE 5,000 (241) (463) (222)CDX.NA.IG- 35 Buy 1.000% 3M December 2030 ICE 15,000 (103) (116) (13)Total net unrealized appreciation (depreciation) on swaps $ (877)
See accompanying Notes to Portfolio of Investments. 68

Income Fund
Portfolio of Investments, March 31, 2021 (all dollar amounts in thousands) (unaudited)
IssuerPrincipalAmount Value
U.S. Government and U.S. Government Agency—57.5%
U.S. Treasury Inflation Indexed Notes/Bonds—3.7%U.S. Treasury Inflation Indexed Bond, 2.375%, due 1/15/27 $ 324 $ 397U.S. Treasury Inflation Indexed Bond, 3.875%, due 4/15/29 1,432 2,009
Total U.S. Treasury Inflation Indexed Notes/Bonds 2,406
U.S. Treasury—6.9%U.S. Treasury Note, 0.235%, due 7/31/21 175 175U.S. Treasury Note, 0.315%, due 10/31/21 1,000 1,001U.S. Treasury Note, 2.500%, due 2/15/22(a) 470 480U.S. Treasury Note, 0.064%, due 1/31/23 500 500U.S. Treasury Note, 0.250%, due 7/31/25 1,000 978U.S. Treasury Note, 1.125%, due 2/28/27 600 598U.S. Treasury Strip Principal, 0.000%, due 8/15/27 775 715
Total U.S. Treasury 4,447
Federal Home Loan Mortgage Corp. (FHLMC)—6.4%#E02490, 6.000%, due 4/1/23 10 11#J13022, 4.000%, due 9/1/25 137 146#G14150, 4.500%, due 4/1/26 43 46#J16051, 4.500%, due 7/1/26 347 373#G15030, 4.000%, due 3/1/29 254 275#A17603, 5.500%, due 1/1/34 342 399#G01705, 5.500%, due 6/1/34 611 716#A45790, 7.500%, due 5/1/35 60 68#G04126, 6.000%, due 6/1/37 140 168#G04564, 6.000%, due 12/1/37 108 129#G05566, 5.500%, due 12/1/38 78 92#G05875, 5.500%, due 2/1/40 53 63#G61450, 6.000%, due 4/1/40 1,273 1,529#C03665, 9.000%, due 4/1/41 82 100
Total FHLMC Mortgage Obligations 4,115
Federal National Mortgage Association (FNMA)—40.5%FNR G93-19 SH, 1M USD LIBOR + 56.169%, 11.234%, due 4/25/23, VRN 5 5#982885, 5.000%, due 5/1/23 65 69#933985, 5.500%, due 8/1/23 38 39#255956, 5.500%, due 10/1/25 15 16#AH0971, 4.000%, due 12/1/25 156 166#AL2853, 4.500%, due 6/1/26 232 245#AJ6954, 4.000%, due 11/1/26 75 80#256639, 5.000%, due 2/1/27 4 4#806458, 8.000%, due 6/1/28 55 62#AL9857, 4.000%, due 2/1/29 3,008 3,212#880155, 8.500%, due 7/1/29 87 99#797846, 7.000%, due 3/1/32 3 3#745519, 8.500%, due 5/1/32 39 42#654674, 6.500%, due 9/1/32 26 30#AD0725, 7.000%, due 12/1/32 426 506#254693, 5.500%, due 4/1/33 3 4#711736, 5.500%, due 6/1/33 49 58#555531, 5.500%, due 6/1/33 31 36#555591, 5.500%, due 7/1/33 5 6#CA2754, 4.500%, due 11/1/33 314 344
See accompanying Notes to Portfolio of Investments. 69

Income Fund
Portfolio of Investments, March 31, 2021 (all dollar amounts in thousands) (unaudited)
IssuerPrincipalAmount Value
U.S. Government and U.S. Government Agency—(continued)
Federal National Mortgage Association (FNMA) — (continued)#AL3455, 5.500%, due 11/1/33 $ 976 $ 1,138#725424, 5.500%, due 4/1/34 34 39#AL6413, 8.000%, due 8/1/34 125 144#CA5931, 4.000%, due 5/1/35 3,985 4,405#AL6412, 7.500%, due 9/1/35 322 371#888884, 5.500%, due 12/1/35 79 92#CA8368, 2.000%, due 12/1/35 976 1,008#928658, 6.500%, due 9/1/37 13 15#889371, 6.000%, due 1/1/38 1,430 1,711#FM1735, 6.500%, due 10/1/38 1,089 1,325#991911, 7.000%, due 11/1/38 46 52#995076, 6.000%, due 11/1/38 397 478#FM2467, 6.000%, due 1/1/39 406 490#FM1736, 6.500%, due 10/1/39 1,040 1,252#BM5204, 6.500%, due 6/1/40 113 136#BM1689, 5.500%, due 8/1/40 247 289#BM3525, 6.000%, due 4/1/41 — —(b)
#AL9226, 5.500%, due 12/1/41 2,966 3,500#BM1328, 6.000%, due 1/1/42 1,220 1,465#AL9225, 6.000%, due 1/1/42 1,127 1,348#BM5121, 5.500%, due 12/1/48 1,576 1,885
Total FNMA Mortgage Obligations 26,169
Asset-Backed Securities—4.3%Verizon Owner Trust 2018-1—144A, 2018-1A, Tranche A1A,
2.820%, 9/20/22 33 33Citibank Credit Card Issuance Trust, 2016-A3, Tranche A3,
1M USD LIBOR + 0.490%, 0.594%, 12/7/23, VRN 800 803GM Financial Automobile Leasing Trust, 2020-1, Tranche C,
2.040%, 12/20/23 950 969Verizon Owner Trust, 2020-A, Tranche C,
2.060%, 7/22/24 425 436Carmax Auto Owner Trust, 2021-1, Tranche C,
0.940%, 12/15/26 550 543
Total Asset-Backed Securities 2,784
Corporate Obligations—37.9%Banco Santander Mexico S.A. Institucion de Banca Multiple Grupo Financiero Santand—144A,
4.125%, due 11/9/22 475 495Bank of Montreal,
SOFR + 0.680%, 0.690%, due 3/10/23, VRN 600 606Canadian Imperial Bank of Commerce,
SOFR + 0.800%, 0.810%, due 3/17/23, VRN 750 756Toll Brothers Finance Corporation,
4.375%, due 4/15/23 250 262Shell International Finance BV,
0.375%, due 9/15/23 500 499GlaxoSmithKline Capital plc,
0.534%, due 10/1/23 300 301Ally Financial, Inc.,
1.450%, due 10/2/23 525 533
See accompanying Notes to Portfolio of Investments. 70

Income Fund
Portfolio of Investments, March 31, 2021 (all dollar amounts in thousands) (unaudited)
IssuerPrincipalAmount Value
Corporate Obligations—(continued)Royal Bank of Canada,
SOFR + 0.450%, 0.474%, due 10/26/23, VRN $ 350 $ 351KeyBank NA,
SOFR + 0.340%, 0.350%, due 1/3/24, VRN 700 700Toyota Motor Credit Corporation,
SOFR + 0.330%, 0.367%, due 1/11/24, VRN 650 652Wells Fargo & Co.,
4.480%, due 1/16/24 650 716Mitsubishi UFJ Financial Group, Inc.,
3.407%, due 3/7/24 550 589The Charles Schwab Corporation,
SOFR + 0.500%, 0.510%, due 3/18/24, VRN 600 604BMW US Capital LLC Co.—144A,
SOFR + 53.000%, 0.540%, due 4/1/24, VRN 110 110Citigroup, Inc.,
SOFR + 1.667%, 1.678%, due 5/15/24, VRN 500 510Grupo Bimbo S.A.B. de C.V.—144A,
3.875%, due 6/27/24 500 539JPMorgan Chase & Co.,
SOFR + 3.125%, 4.600%, due 2/1/25, VRN 450 456United Parcel Service, Inc.,
3.900%, due 4/1/25 500 554The Hershey Co.,
0.900%, due 6/1/25 525 521American Honda Finance Corporation,
1.200%, due 7/8/25 450 448Intuit, Inc.,
0.950%, due 7/15/25 450 447Skandinaviska Enskilda Banken AB—144A,
0.850%, due 9/2/25 500 489Bank of America Corporation,
SOFR + 0.910%, 0.981%, due 9/25/25, VRN 700 699Comcast Corporation,
3.950%, due 10/15/25 600 670Morgan Stanley,
SOFR + 0.745%, 0.864%, due 10/21/25, VRN 550 547Capital One Financial Corporation,
4.200%, due 10/29/25 500 554Intercontinental Exchange, Inc.,
3.750%, due 12/1/25 450 495Simon Property Group L.P.,
3.300%, due 1/15/26 550 589Tencent Holdings Ltd.—144A,
1.810%, due 1/26/26 700 702AT&T, Inc.,
4.125%, due 2/17/26 600 672Merck & Co., Inc.,
0.750%, due 2/24/26 700 689The Bank of Nova Scotia,
SOFR + 0.545%, 0.557%, due 3/2/26, VRN 675 674ConocoPhillips Co.,
4.950%, due 3/15/26 600 696Verizon Communications, Inc.,
SOFR + 0.790%, 0.800%, due 3/20/26, VRN 600 604
See accompanying Notes to Portfolio of Investments. 71

Income Fund
Portfolio of Investments, March 31, 2021 (all dollar amounts in thousands) (unaudited)
IssuerPrincipalAmount Value
Corporate Obligations—(continued)Brookfield Finance, Inc.,
4.250%, due 6/2/26 $ 550 $ 620Fibria Overseas Finance, Ltd.,
5.500%, due 1/17/27 500 569The Goldman Sachs Group, Inc.,
SOFR + 0.810%, 0.821%, due 3/9/27, VRN 600 596Costco Wholesale Corporation,
1.375%, due 6/20/27 500 499Gilead Sciences, Inc.,
1.200%, due 10/1/27 400 384Abbott Laboratories,
1.150%, due 1/30/28 600 576Motorola Solutions, Inc.,
4.600%, due 2/23/28 450 512Roper Technologies, Inc.,
4.200%, due 9/15/28 375 422The Kroger Co.,
8.000%, due 9/15/29 450 615Toll Brothers Finance Corporation,
3.800%, due 11/1/29 250 265Amazon.com, Inc.,
1.500%, due 6/3/30 450 429Johnson Controls International plc,
1.750%, due 9/15/30 350 328
Total Corporate Obligations 24,544
Total Long-Term Investments—99.7%(cost $63,395) 64,465
Repurchase Agreement—0.3%Fixed Income Clearing Corporation, 0.000% dated 3/31/21, due 4/1/21, repurchase price $170, collateralized by U.S. Treasury Note,
2.250%, due 11/15/27, valued at $173 170 170
Total Repurchase Agreement—0.3%(cost $170) 170
Total Investments—100.0%(cost $63,565) 64,635
Securities Sold , Not Yet Purchased
U.S. Government Agency—(1.7)%
Federal National Mortgage Association (FNMA)—(1.7)%TBA, 4.000%, due 5/1/51 (1,000) (1,075)
Total Securities Sold , Not Yet Purchased—(1.7)%(proceeds $1,075) (1,075)
See accompanying Notes to Portfolio of Investments. 72

Income Fund
Portfolio of Investments, March 31, 2021 (all dollar amounts in thousands) (unaudited)
Issuer Value
Cash and other assets, less liabilities—1.7% $ 1,114
Net assets—100.0% $ 64,674
The obligations of certain U.S. Government-sponsored securities are neither issued nor guaranteed by the U.S. Treasury.
144A = Security exempt from registration under Rule 144A of the Securities Act of 1933. These securities may be resold in transactions exempt from registration, normally to qualified institutional buyers.SOFR = Secured Overnight Financing RateTBA = To Be Announced—TBAs are mortgage-backed securities traded under delayed delivery commitments, settling after March 31, 2021. The term TBA comes from the fact that the specific mortgage-backed security that will be delivered to fulfill a TBA trade is not designated at the time the trade is made.VRN = Variable Rate Note(a) Security, or a portion of security, is segregated as collateral for the centrally cleared credit default swap, aggregating a total of $357 (in thousands).(b) Amount is less than the minimum amount disclosed.
Centrally Cleared Credit Default Swap
Reference Entity
Buy/Sell Protection
Fixed Deal Pay Rate
PaymentFrequency
MaturityDate
Cleared Exchange
NotionalAmount
(in thousands)
UpfrontPayment
Paid(Received) Value
UnrealizedAppreciation
(Depreciation)CDX.NA.HY- 34 Buy 5.000% 3M June 2025 ICE $4,600 $(110) $(431) $(321)
See accompanying Notes to Portfolio of Investments. 73

Low Duration Fund
Portfolio of Investments, March 31, 2021 (all dollar amounts in thousands) (unaudited)
IssuerPrincipalAmount Value
U.S. Government and U.S. Government Agency—55.1%
U.S. Treasury—13.4%U.S. Treasury Strip Principal, 0.000%, due 8/15/21 $ 3,000 $ 2,999U.S. Treasury Note, 0.315%, due 10/31/21 3,950 3,955U.S. Treasury Note, 0.169%, due 1/31/22 4,750 4,756U.S. Treasury Note, 2.500%, due 1/15/22 4,000 4,077U.S. Treasury Note, 0.129%, due 4/30/22 4,500 4,505U.S. Treasury Note, 0.064%, due 1/31/23 2,000 2,001
Total U.S. Treasury 22,293
Federal Home Loan Mortgage Corp. (FHLMC)—9.8%#E02322, 5.500%, due 5/1/22 2 2#G12725, 6.000%, due 6/1/22 12 12#G13225, 5.000%, due 6/1/23 310 325#J08450, 5.500%, due 7/1/23 5 5#J08703, 5.500%, due 9/1/23 3 3#C00351, 8.000%, due 7/1/24 15 16#J11208, 5.000%, due 11/1/24 13 14#G00363, 8.000%, due 6/1/25 27 29#C80329, 8.000%, due 8/1/25 5 5#G14643, 4.000%, due 8/1/26 68 73#G14550, 4.500%, due 9/1/26 402 423#G15360, 4.500%, due 11/1/26 153 163#G14402, 4.000%, due 2/1/27 114 122#G04821, 8.500%, due 7/1/31 1,068 1,266#G02454, 6.500%, due 7/1/32 485 546#ZT1221, 5.500%, due 1/1/33 443 516#A81372, 6.000%, due 8/1/38 125 145#G04687, 6.000%, due 9/1/38 37 43#G04745, 6.000%, due 9/1/38 123 142#G06085, 6.500%, due 9/1/38 35 41#G60681, 7.000%, due 2/1/39 4,531 5,552#G07480, 6.000%, due 5/1/39 570 676#G60680, 6.500%, due 9/1/39 542 644#G07058, 6.000%, due 9/1/39 567 696#G61450, 6.000%, due 4/1/40 3,820 4,588#G61050, 5.500%, due 3/1/41 265 312
Total FHLMC Mortgage Obligations 16,359
Federal National Mortgage Association (FNMA)—31.9%#831497, 6.000%, due 4/1/21 1 1#879607, 5.500%, due 4/1/21 — —(a)
#831525, 5.500%, due 6/1/21 — —(a)
#880993, 6.000%, due 1/1/22 — —(a)
#888982, 6.000%, due 12/1/22 16 17#972934, 5.500%, due 2/1/23 20 20#889670, 5.500%, due 6/1/23 4 4#AE0011, 5.500%, due 9/1/23 2 2#995395, 6.000%, due 12/1/23 7 8#995253, 5.500%, due 12/1/23 158 161#190988, 9.000%, due 6/1/24 1 1#AL8529, 6.000%, due 11/1/24 1,892 1,966#AL2853, 4.500%, due 6/1/26 734 777#AI4748, 4.000%, due 7/1/26 150 160#AL9730, 4.500%, due 2/1/27 1,238 1,319#BM3382, 5.000%, due 3/1/27 761 800#AL3388, 4.000%, due 9/1/27 259 277
See accompanying Notes to Portfolio of Investments. 74

Low Duration Fund
Portfolio of Investments, March 31, 2021 (all dollar amounts in thousands) (unaudited)
IssuerPrincipalAmount Value
U.S. Government and U.S. Government Agency—(continued)
Federal National Mortgage Association (FNMA) — (continued)#AL9870, 6.500%, due 2/1/28 $ 612 $ 687#AL4502, 4.000%, due 11/1/28 333 361#AL9857, 4.000%, due 2/1/29 3,073 3,281#323933, 7.000%, due 9/1/29 209 245#555933, 7.000%, due 6/1/32 272 310#555866, 7.500%, due 3/1/33 159 187#745409, 7.000%, due 4/1/33 386 437#CA2408, 4.000%, due 10/1/33 151 166#CA2754, 4.500%, due 11/1/33 94 103#725228, 6.000%, due 3/1/34 689 809#AL6413, 8.000%, due 8/1/34 145 167#AD0720, 5.500%, due 12/1/34 193 225#CA5298, 4.000%, due 2/1/35 4,151 4,588#AL6412, 7.500%, due 9/1/35 537 618#CA8368, 2.000%, due 12/1/35 1,463 1,512#886762, 7.000%, due 9/1/36 176 212#888530, 7.500%, due 8/1/37 1,413 1,731#AD0731, 7.500%, due 8/1/37 3,864 4,633#AL6411, 7.000%, due 12/1/37 1,048 1,202#889219, 6.000%, due 3/1/38 1,000 1,234#FM1735, 6.500%, due 10/1/38 1,944 2,366#995076, 6.000%, due 11/1/38 1,811 2,183#AD0100, 7.000%, due 12/1/38 391 468#FM2467, 6.000%, due 1/1/39 1,624 1,961#FM1736, 6.500%, due 10/1/39 2,512 3,024#BM5204, 6.500%, due 6/1/40 2,197 2,642#AL0515, 6.000%, due 7/1/40 443 542#BM3525, 6.000%, due 4/1/41 2,271 2,719#AL9226, 5.500%, due 12/1/41 2,081 2,455#BM1328, 6.000%, due 1/1/42 1,173 1,409#AL9225, 6.000%, due 1/1/42 1,844 2,206#AL6276, 5.500%, due 10/1/43 150 173#BM5121, 5.500%, due 12/1/48 1,040 1,244#CA5837, 6.000%, due 7/1/49 1,347 1,614
Total FNMA Mortgage Obligations 53,227
Asset-Backed Securities—10.2%Tesla Auto Lease Trust 2018-B—144A, 2018-B, Tranche A,
3.710%, 8/20/21 165 165Honda Auto Receivables Owner Trust, 2019-3, Tranche A2,
1.900%, 4/15/22 170 171Ford Credit Auto Lease Trust 2019-B, 2019-B, Tranche A4,
2.270%, 11/15/22 329 333Toyota Auto Receivables 2020-B Owner Trust, 2020-B, Tranche A2,
1.380%, 12/15/22 736 739Tesla Auto Lease Trust—144A, 2019-A, Tranche C,
2.680%, 1/20/23 675 694Mercedes-Benz Auto Lease Trust 2020-B, 2020-B, Tranche A2,
0.310%, 2/15/23 488 488GM Financial Automobile Leasing Trust, 2019-2, Tranche C,
3.120%, 3/20/23 425 432Verizon Owner Trust 2018-A, 2018-A, Tranche A1A,
3.230%, 4/20/23 904 913
See accompanying Notes to Portfolio of Investments. 75

Low Duration Fund
Portfolio of Investments, March 31, 2021 (all dollar amounts in thousands) (unaudited)
IssuerPrincipalAmount Value
Asset-Backed Securities—(continued)Kubota Credit Owner Trust—144A, 2020-2A, Tranche A2,
0.410%, 6/15/23 $ 1,486 $ 1,488BA Credit Card Trust, 2018-A2, Tranche A2,
3.000%, 9/15/23 1,000 1,001GM Financial Consumer Automobile Receivables Trust, 2018-4, Tranche A3,
3.210%, 10/16/23 448 454Nissan Auto Lease Trust 2020-B, 2020-B, Tranche A3,
0.430%, 10/16/23 550 551Citibank Credit Card Issuance Trust, 2016-A3, Tranche A3,
1M USD LIBOR + 0.490%, 0.594%, 12/7/23, VRN 1,150 1,154Discover Card Execution Note Trust, 2019-A2, Tranche A,
1M USD LIBOR + 0.270%, 0.376%, 12/15/23, VRN 647 648Discover Card Execution Note Trust, 2018-A3, Tranche A3,
1M USD LIBOR + 0.230%, 0.336%, 12/15/23, VRN 920 922GM Financial Automobile Leasing Trust, 2020-1, Tranche C,
2.040%, 12/20/23 1,400 1,427Chase Issuance Trust, 2017-A2, Tranche A,
1M USD LIBOR + 0.400%, 0.506%, 3/15/24, VRN 1,545 1,552Verizon Owner Trust 2019-C, 2019-C, Tranche C,
2.160%, 4/22/24 60 62Verizon Owner Trust, 2020-A, Tranche C,
2.060%, 7/22/24 1,250 1,283Nissan Auto Receivables 2020-A Owner Trust, 2020-A, Tranche A3,
1.380%, 12/16/24 1,126 1,143American Express Credit Account Master Trust, 2017-5, Tranche B,
1M USD LIBOR + 0.580%, 0.686%, 2/18/25, VRN 450 452CNH Equipment Trust 2020-A, 2020-A, Tranche A3,
1.160%, 6/16/25 300 303CarMax Auto Owner Trust, 2020-1, Tranche C,
2.340%, 11/17/25 600 622
Total Asset-Backed Securities 16,997
Corporate Obligations—33.6%Mizuho Financial Group, Inc.—144A,
3M USD LIBOR + 1.480%, 1.704%, due 4/12/21, VRN 2,000 2,001Bank of America Corporation,
3M USD LIBOR + 1.420%, 1.643%, due 4/19/21, VRN 1,200 1,201American Express Credit Corporation,
2.250%, due 5/5/21 1,500 1,500JPMorgan Chase & Co.,
4.625%, due 5/10/21 951 955Chevron Corporation,
3M USD LIBOR + 0.950%, 1.144%, due 5/16/21, VRN 500 501American Express Co.,
3M USD LIBOR + 0.525%, 0.717%, due 5/17/21, VRN 1,225 1,225American Honda Finance Corporation,
3M USD LIBOR + 0.350%, 0.527%, due 6/11/21, VRN 2,893 2,895Citibank NA,
3.400%, due 7/23/21 525 529Wells Fargo & Co.,
2.100%, due 7/26/21 3,000 3,017Citigroup, Inc.,
3M USD LIBOR + 1.190%, 1.392%, due 8/2/21, VRN 1,305 1,310
See accompanying Notes to Portfolio of Investments. 76

Low Duration Fund
Portfolio of Investments, March 31, 2021 (all dollar amounts in thousands) (unaudited)
IssuerPrincipalAmount Value
Corporate Obligations—(continued)Toyota Motor Credit Corporation,
SOFR + 0.340%, 0.371%, due 10/14/22, VRN $ 200 $ 200Met Tower Global Funding—144A,
SOFR + 0.550%, 0.580%, due 1/17/23, VRN 1,481 1,489Morgan Stanley,
SOFR + 0.700%, 0.725%, due 1/20/23, VRN 3,900 3,912Capital One Bank USA NA,
SOFR + 0.616%, 2.014%, due 1/27/23, VRN 1,400 1,417Bank of Montreal,
SOFR + 0.680%, 0.690%, due 3/10/23, VRN 2,900 2,926Canadian Imperial Bank of Commerce,
SOFR + 0.800%, 0.810%, due 3/17/23, VRN 1,000 1,009The Bank of Nova Scotia,
SOFR + 0.550%, 0.560%, due 9/15/23, VRN 2,000 2,010Royal Bank of Canada,
SOFR + 0.450%, 0.474%, due 10/26/23, VRN 1,500 1,504Canadian Imperial Bank of Commerce,
SOFR + 0.400%, 0.410%, due 12/14/23, VRN 1,900 1,900KeyBank NA,
SOFR + 0.340%, 0.350%, due 1/3/24, VRN 2,900 2,900Metropolitan Life Global Funding I—144A,
SOFR + 0.320%, 0.358%, due 1/7/24, VRN 1,500 1,504Toyota Motor Credit Corporation,
SOFR + 0.330%, 0.367%, due 1/11/24, VRN 2,800 2,809The Toronto-Dominion Bank,
SOFR + 0.355%, 0.367%, due 3/4/24, VRN 2,900 2,901Roche Holdings, Inc.—144A,
SOFR + 0.240%, 0.251%, due 3/5/24, VRN 1,150 1,151JPMorgan Chase & Co.,
SOFR + 0.580%, 0.590%, due 3/16/24, VRN 1,825 1,832The Charles Schwab Corporation,
SOFR + 0.500%, 0.510%, due 3/18/24, VRN 2,700 2,718BMW US Capital LLC Co.—144A,
SOFR + 53.000%, 1.000%, due 4/1/24, VRN 500 501Royal Bank of Canada,
SOFR + 0.525%, 0.554%, due 1/20/26, VRN 1,500 1,497The Bank of Nova Scotia,
SOFR + 0.545%, 0.557%, due 3/2/26, VRN 925 923Verizon Communications, Inc.,
SOFR + 0.790%, 0.800%, due 3/20/26, VRN 2,900 2,919The Goldman Sachs Group, Inc.,
SOFR + 0.810%, 0.821%, due 3/9/27, VRN 2,900 2,882
Total Corporate Obligations 56,038
Total Long-Term Investments—98.9%(cost $164,525) 164,914
Repurchase Agreement—1.0%Fixed Income Clearing Corporation, 0.000% dated 3/31/21, due 4/1/21, repurchase price $1,630, collateralized by U.S. Treasury
Bond, 2.000%, due 2/15/50, valued at $1,663 1,630 1,630
Total Repurchase Agreement—1.0%(cost $1,630) 1,630
See accompanying Notes to Portfolio of Investments. 77

Low Duration Fund
Portfolio of Investments, March 31, 2021 (all dollar amounts in thousands) (unaudited)
IssuerPrincipalAmount Value
Total Investments—99.9%(cost $166,155) $ 166,544
Securities Sold , Not Yet Purchased
U.S. Government Agency—(14.0)%
Federal National Mortgage Association (FNMA)—(14.0)%TBA, 2.500%, due 5/1/36 $ (10,000) (10,402)TBA, 4.000%, due 5/1/51 (12,000) (12,893)
Total Securities Sold , Not Yet Purchased—(14.0)%(proceeds $23,402) (23,296)
Cash and other assets, less liabilities—14.1% 23,442
Net assets—100.0% $ 166,690
The obligations of certain U.S. Government-sponsored securities are neither issued nor guaranteed by the U.S. Treasury.
144A = Security exempt from registration under Rule 144A of the Securities Act of 1933. These securities may be resold in transactions exempt from registration, normally to qualified institutional buyers.SOFR = Secured Overnight Financing RateTBA = To Be Announced —TBAs are mortgage-backed securities traded under delayed delivery commitments, settling after March 31, 2021. The term TBA comes from the fact that the specific mortgage-backed security that will be delivered to fulfill a TBA trade is not designated at the time the trade is made.VRN = Variable Rate Note(a) Amount is less than the minimum amount disclosed.
See accompanying Notes to Portfolio of Investments. 78

Macro Allocation Fund
Portfolio of Investments, March 31, 2021 (all dollar amounts in thousands) (unaudited)
Issuer Shares Value
Exchange-Traded Funds—65.3%
Equity Exchange-Traded Funds—61.3%Energy Select Sector SPDR Fund 53,700 $ 2,635Financial Select Sector SPDR Fund 83,000 2,826iShares MSCI Brazil ETF 99,800 3,338iShares MSCI India ETF 10,200 430SPDR S&P 500 ETF Trust 393,200 155,837Utilities Select Sector SPDR Fund 11,100 711Vietnam Enterprise Investments, Ltd. Class “C” 696,748 5,744
Total Equity Exchange-Traded Funds 171,521
Fixed Income Exchange-Traded Funds—4.0%iShares iBoxx $ Investment Grade Corporate Bond ETF 64,500 8,388SPDR Bloomberg Barclays High Yield Bond ETF 27,200 2,960
Total Fixed Income Exchange-Traded Funds 11,348
Total Exchange-Traded Funds—65.3%(cost $137,643) 182,869
Common Stocks—4.3%
Emerging Asia—1.5%
Philippines—1.5%Aboitiz Equity Ventures, Inc. (Industrial conglomerates) 185,163 132Ayala Corporation (Industrial conglomerates) 24,300 370Ayala Land, Inc. (Real estate management & development) 666,910 472Bank of the Philippine Islands (Banks) 155,006 260BDO Unibank, Inc. (Banks) 165,123 347Globe Telecom, Inc. (Wireless telecommunication services) 3,163 122GT Capital Holdings, Inc. (Diversified financial services) 7,975 86International Container Terminal Services, Inc. (Transportation infrastructure) 88,154 220JG Summit Holdings, Inc. (Industrial conglomerates) 260,594 321Jollibee Foods Corporation (Hotels, restaurants & leisure) 35,005 128Manila Electric Co. (Electric utilities) 19,247 108Megaworld Corporation (Real estate management & development) 1,002,038 74Metro Pacific Investments Corporation (Diversified financial services) 1,146,973 88Metropolitan Bank & Trust Co. (Banks) 152,967 140PLDT, Inc. (Wireless telecommunication services) 8,056 203Puregold Price Club, Inc. (Food & staples retailing) 107,530 87SM Investments Corporation (Industrial conglomerates) 20,851 412SM Prime Holdings, Inc. (Real estate management & development) 824,474 594Universal Robina Corporation (Food products) 78,434 215
4,379
Emerging Latin America—2.8%
Chile—2.8%Banco de Chile (Banks) 8,648,503 1,020Banco de Credito e Inversiones S.A. (Banks) 10,111 535Banco Santander Chile (Banks) 12,392,049 774Cencosud S.A. (Food & staples retailing) 313,755 671Cencosud Shopping S.A. 102,518 213Cia Cervecerias Unidas S.A. (Beverages) 32,976 289Colbun S.A. (Independent power & renewable electricity producers) 1,677,888 327
See accompanying Notes to Portfolio of Investments. 79

Macro Allocation Fund
Portfolio of Investments, March 31, 2021 (all dollar amounts in thousands) (unaudited)
Issuer
Shares orPrincipalAmount Value
Common Stocks—(continued)
Emerging Latin America — (continued)Empresas CMPC S.A. (Paper & forest products) 225,122 $ 723Empresas COPEC S.A. (Oil, gas & consumable fuels) 73,462 907Enel Americas S.A. (Electric utilities) 6,760,566 1,127
*Enel Chile S.A. (Electric utilities) 5,867,452 457Falabella S.A. (Multiline retail) 158,200 718
7,761Total Common Stocks—4.3%
(cost $9,807) 12,140
Foreign Government Bonds—12.6%
Brazil—3.9%Brazil Notas do Tesouro Nacional Serie F, 10.000%, due 1/1/25 BRL 58,370 10,941
Malaysia—3.8%Malaysia Government Bond, 3.480%, due 3/15/23 MYR 42,610 10,543
South Africa—4.9%Republic of South Africa Government Bond, 8.000%, due 1/31/30 ZAR 65,055 4,017Republic of South Africa Government Bond, 7.000%, due 2/28/31 ZAR 177,645 9,825
13,842Total Foreign Government Bonds—12.6%
(cost $35,934) 35,326
Preferred Stocks—0.5%
Emerging Latin America—0.5%
Chile—0.5%Embotelladora Andina S.A. Class “B” (Beverages) 79,237 210Sociedad Quimica y Minera de Chile S.A. Class “B” (Chemicals) 21,391 1,146
1,356
Total Preferred Stocks—0.5%(cost $936) 1,356
Rights—0.0%
Emerging Latin America—0.0%
Chile—0.0%Sociedad Quimica y Minera de Chile S.A. (Chemicals) 3,997 16
Total Rights—0.0%(cost $0) 16
See accompanying Notes to Portfolio of Investments. 80

Macro Allocation Fund
Portfolio of Investments, March 31, 2021 (all dollar amounts in thousands) (unaudited)
IssuerPrincipalAmount Value
Repurchase Agreement—1.8%Fixed Income Clearing Corporation, 0.000% dated 3/31/21, due 4/1/21, repurchase price $4,890, collateralized by U.S. Treasury Note,
2.250%, due 11/15/27, valued at $4,988 $ 4,890 $ 4,890
Total Repurchase Agreement—1.8%(cost $4,890) 4,890
U.S. Government—15.2%U.S. Treasury Bill, 0.153%, due 7/15/21 2,275 2,275U.S. Treasury Bill, 0.133%, due 8/12/21(a) 4,225 4,225U.S. Treasury Bill, 0.128%, due 9/9/21 3,500 3,500U.S. Treasury Bill, 0.104%, due 10/7/21(a)(b) 5,500 5,499U.S. Treasury Bill, 0.098%, due 11/4/21(b) 5,500 5,499U.S. Treasury Bill, 0.096%, due 12/2/21(a) 5,500 5,498U.S. Treasury Bill, 0.101%, due 12/30/21(a) 5,500 5,498U.S. Treasury Bill, 0.086%, due 1/27/22(b) 5,500 5,498U.S. Treasury Bill, 0.074%, due 2/24/22(a) 3,000 2,998U.S. Treasury Bill, 0.068%, due 3/24/22 2,000 1,999
Total U.S. Government—15.2%(cost $42,474) 42,489
Total Investments in Securities—99.7%(cost $231,684) 279,086
Total Written Options—(0.0)%(premiums received $218) (78)
Cash and other assets, less liabilities—0.3% 920
Net assets—100.0% $ 279,928
* = Non-income producing security
(a) Security, or portion of security, is segregated as collateral for centrally cleared swaps and to cover initial margin requirements on open futures contracts aggregating a total value of $18,147 (in thousands).(b) Security, or portion of security, is pledged as collateral for OTC swap contracts and foreign forward currency contracts aggregating a total value of $3,822 (in thousands).
Written Options Contracts
Description CounterpartyExercise
PriceExpiration
DateNumber ofContracts
NotionalAmount
MarketValue
PremiumsPaid
(Received)by Fund
UnrealizedAppreciation/(Depreciation)
Calls
Energy Select Sector SPDR ETFCredit Suisse
International 52 04/16/21 1,688 $ 16,880 $ (78) $ (218) $ 140
See accompanying Notes to Portfolio of Investments. 81

Macro Allocation Fund
Portfolio of Investments, March 31, 2021 (all dollar amounts in thousands) (unaudited)
Forward Foreign Currency Contracts
SettlementDate Deliver/Receive Counterparty
Local Currency (in thousands)
USD (Base)Purchased
or SoldCurrent
Value
NetUnrealized
Appreciation(Depreciation)
Purchased
4/21/21 Australian Dollar Citibank N.A. London 1,171 $ 893 $ 889 $ (4)4/21/21 British Pound Sterling Citibank N.A. London 9,257 12,917 12,762 (155)4/21/21 Chilean Peso Citibank N.A. London 423,421 589 588 (1)4/21/21 Chinese Yuan Renminbi Citibank N.A. London 4,177 639 636 (3)4/21/21 Colombian Peso Citibank N.A. London 63,641,792 17,987 17,377 (610)4/21/21 Czech Koruna Citibank N.A. London 12,345 555 555 —4/21/21 Euro Citibank N.A. London 843 995 989 (6)4/21/21 Hong Kong Dollar Citibank N.A. London 4,515 581 581 —4/21/21 Indonesian Rupiah Citibank N.A. London 7,093,392 486 486 —4/21/21 Israeli Shekel Citibank N.A. London 2,924 884 875 (9)4/21/21 Japanese Yen Citibank N.A. London 1,832,311 16,859 16,551 (308)4/21/21 Mexican Peso Citibank N.A. London 504,523 24,226 24,643 4174/21/21 New Turkish Lira Citibank N.A. London 285,109 37,046 34,029 (3,017)4/21/21 New Zealand Dollar Citibank N.A. London 1,036 723 724 14/21/21 Philippine Peso Citibank N.A. London 813,454 16,732 16,732 —4/21/21 Russian Ruble Citibank N.A. London 1,631,640 22,098 21,538 (560)4/21/21 Singapore Dollar Citibank N.A. London 36,967 27,538 27,478 (60)4/21/21 South African Rand Citibank N.A. London 92,558 6,155 6,258 1034/21/21 South Korean Won Citibank N.A. London 448,366 398 398 —4/21/21 Swedish Krona Citibank N.A. London 59,765 7,034 6,844 (190)4/21/21 Swiss Franc Citibank N.A. London 528 559 559 —4/21/21 Taiwan Dollar Citibank N.A. London 21,603 769 760 (9)4/22/21 Brazilian Real Citibank N.A. London 117,252 21,032 20,810 (222)4/22/21 Indian Rupee Citibank N.A. London 557,379 7,619 7,593 (26)
$ (4,659)
Sold
4/21/21 Australian Dollar Citibank N.A. London 41,167 31,922 31,272 6504/21/21 British Pound Sterling Citibank N.A. London 455 624 627 (3)4/21/21 Canadian Dollar Citibank N.A. London 10,818 8,605 8,609 (4)4/21/21 Chilean Peso Citibank N.A. London 6,686,719 9,324 9,283 414/21/21 Chinese Yuan Renminbi Citibank N.A. London 135,162 20,755 20,566 1894/21/21 Colombian Peso Citibank N.A. London 2,605,901 709 711 (2)4/21/21 Czech Koruna Citibank N.A. London 300,377 13,695 13,497 1984/21/21 Euro Citibank N.A. London 23,195 27,714 27,209 5054/21/21 Hong Kong Dollar Citibank N.A. London 110,422 14,231 14,204 274/21/21 Indonesian Rupiah Citibank N.A. London 173,614,173 12,030 11,892 1384/21/21 Israeli Shekel Citibank N.A. London 80,791 24,440 24,170 2704/21/21 Mexican Peso Citibank N.A. London 14,040 686 686 —4/21/21 New Turkish Lira Citibank N.A. London 196,655 23,363 23,472 (109)4/21/21 New Zealand Dollar Citibank N.A. London 37,109 26,717 25,916 8014/21/21 Philippine Peso Citibank N.A. London 28,891 594 594 —4/21/21 Russian Ruble Citibank N.A. London 54,013 705 713 (8)4/21/21 Singapore Dollar Citibank N.A. London 1,503 1,116 1,117 (1)4/21/21 South African Rand Citibank N.A. London 153,475 10,285 10,376 (91)
See accompanying Notes to Portfolio of Investments. 82

Macro Allocation Fund
Portfolio of Investments, March 31, 2021 (all dollar amounts in thousands) (unaudited)
Forward Foreign Currency Contracts - (continued)
SettlementDate Deliver/Receive Counterparty
Local Currency (in thousands)
USD (Base)Purchased
or SoldCurrent
Value
NetUnrealized
Appreciation(Depreciation)
Sold — (continued)
4/21/21 South Korean Won Citibank N.A. London 6,878,264 $ 6,074 $ 6,100 $ (26)4/21/21 Swiss Franc Citibank N.A. London 14,671 15,828 15,529 2994/21/21 Thai Baht Citibank N.A. London 514,725 16,797 16,470 3274/22/21 Brazilian Real Citibank N.A. London 61,946 11,089 10,994 954/22/21 Indian Rupee Citibank N.A. London 60,174 820 820 —
$ 3,296Total net unrealized appreciation (depreciation) on forward foreign currency contracts $ (1,363)
Futures Contracts
Number ofContracts Description
ExpirationDate
LocalCurrency
Notional Value(Local, in
Thousands)Notional
Amount (USD)Notional
Value (USD)
Net UnrealizedAppreciation
(Depreciation)
Long
58 CAC 40 Index April 2021 Euro 3,518 $ 4,113 $ 4,126 $ 1357 IBEX 35 Index April 2021 Euro 4,894 5,790 5,740 (50)16 FTSE Taiwan Index April 2021 U.S. Dollar 927 895 927 32
314 MSCI Singapore ETS Index April 2021 Singapore Dollar 11,240 8,282 8,355 73143 FTSE KLCI Index April 2021 Malaysian Ringgit 11,240 2,759 2,711 (48)16 KOSPI 200 Index June 2021 South Korean Won 1,658,600 1,464 1,465 1
2 NIKKEI 225 Index June 2021 Japanese Yen 29,220 261 264 362 10YR Aust Bond June 2021 Australian Dollar 8,563 6,523 6,504 (19)
117 5YR Aust Bond June 2021 Australian Dollar 12,363 9,401 9,390 (11)66 SPI 200 Index June 2021 Australian Dollar 11,164 8,485 8,479 (6)11 DAX Index June 2021 Euro 4,133 4,694 4,847 153
262 FTSE 100 Index June 2021 British Pound Sterling 17,500 24,226 24,126 (100)20 FTSE MIB Index June 2021 Euro 2,439 2,815 2,861 4645 MSCI China Index June 2021 U.S. Dollar 2,677 2,736 2,677 (59)
328 MSCI Indonesia Index June 2021 U.S. Dollar 4,871 5,082 4,871 (211)324 MSCI World Energy Index June 2021 U.S. Dollar 8,657 9,041 8,657 (384)
$ (567)
Short
5 Amsterdam Index April 2021 Euro 699 $ 796 $ 820 $ (24)21 OMXS 30 Index April 2021 Swedish Krona 4,593 518 526 (8)39 FTSE/JSE Top 40 Index June 2021 South African Rand 23,860 1,633 1,617 16
See accompanying Notes to Portfolio of Investments. 83

Macro Allocation Fund
Portfolio of Investments, March 31, 2021 (all dollar amounts in thousands) (unaudited)
Number of Contracts Description
ExpirationDate
LocalCurrency
Notional Value(Local, in
Thousands)
NotionalAmount (USD)
NotionalValue (USD)
Net UnrealizedAppreciation
(Depreciation)
Short — (continued)
322 EURO STOXX 50 Index June 2021 Euro 12,449 $ 14,259 $ 14,598 $ (339)82 MSCI Emerging Markets Index June 2021 U.S. Dollar 5,422 5,527 5,422 105
136 MSCI Mexico Index June 2021 U.S. Dollar 3,319 3,339 3,319 2011 MSCI Philippines Index June 2021 U.S. Dollar 243 247 243 422 NASDAQ 100 E Mini Index June 2021 U.S. Dollar 5,759 5,686 5,759 (73)
652 S&P 500 E Mini Index June 2021 U.S. Dollar 129,337 128,909 129,337 (428)15 S&P E Mini Index June 2021 U.S. Dollar 1,440 1,488 1,440 4833 SWISS Markets Index June 2021 Swiss Franc 3,606 3,726 3,816 (90)11 XAK Technology June 2021 U.S. Dollar 1,471 1,452 1,471 (19)17 XAY Cons Discret June 2021 U.S. Dollar 2,886 2,866 2,886 (20)44 10YR Can Bond June 2021 Canadian Dollar 6,106 4,980 4,859 121
$ (687)Total net unrealized appreciation (depreciation) on futures contracts $ (1,254)
Centrally Cleared Interest Rate Swaps
Floating RateReference
Pay/ReceiveFloating Rate
FixedRates
Pay/ReceivePayment
FrequencyMaturity
DatesCleared
Exchange
NotionalAmount
(in thousands)
Upfront Payment
Paid(Received) Value
UnrealizedAppreciation
(Depreciation)Brazil CDI ON
Deposit Rate Pay 6.010% 3M January 2023 CME BRL 128,068 $ — $ (118) $ (118)China 1-Week
Repo Rate Pay 2.800% 3MDecember
2025 LCH CNY 53,420 1 13 12Total centrally cleared interest rate swaps $ (106)
Total Return Swaps
Reference Entity
Pay/ReceiveFloating Rate
Floating/Fixed Rates
MaturityDates Counterparty
NotionalAmount
(in thousands)MarketValue
UnrealizedAppreciation
(Depreciation)10YR T-Note Future
Pay 0 bp Jun 2021Credit Suisse
International $ 4,029 $ (101) $ (101)
5YR T-Note Future Pay 0 bp Jun 2021Credit Suisse
International 16,747 (212) (212)CSI 500 Net Total
Return Index Pay (1,305) bp Sep 2021Credit Suisse
International 6,324 323 323
Euro-Bund Future Receive 0 bp Jun 2021Credit Suisse
International EUR 1,029 2 2
See accompanying Notes to Portfolio of Investments. 84

Macro Allocation Fund
Portfolio of Investments, March 31, 2021 (all dollar amounts in thousands) (unaudited)
Total Return Swaps - (continued)
Reference Entity
Pay/ReceiveFloating
Rate Floating/Fixed RatesMaturity
Dates Counterparty
NotionalAmount
(in thousands)MarketValue
UnrealizedAppreciation
(Depreciation)
RTS Index Future Pay 0 bp Jun 2021Credit Suisse International $ 3,450 $ (141) $ (141)
$ (129)
Centrally Cleared Credit Default Swap
Reference Entity
Buy/Sell Protection
Fixed Deal Pay Rate
PaymentFrequency
MaturityDate
Cleared Exchange
NotionalAmount
(in thousands)
UpfrontPayment
Paid(Received) Value
UnrealizedAppreciation
(Depreciation)iTRAXX Europe
S34 Sell 1.000% 3MDecember
2025 ICE EUR 4,843 $ 122 $ 152 $ 30
Total net unrealized appreciation (depreciation) on swaps $ (205)
See accompanying Notes to Portfolio of Investments. 85

Notes to Portfolios of Investments (1) Significant Accounting Policies
(a) Description of the Trust
William Blair Funds (the “Trust”) is a Delaware statutory trust registered under the Investment Company Act of 1940, as amended (“the 1940 Act”), as an open-end management investment company. As of March 31, 2021, the Trust had the following twenty funds (the “Funds”) available for sale, each with its own investment objective and policies. For each Fund, the number of shares authorized is unlimited.
U.S. Equity Funds International Equity FundsGrowth International LeadersLarge Cap Growth International GrowthMid Cap Growth Institutional International GrowthSmall-Mid Cap Core International Small Cap GrowthSmall-Mid Cap Growth Emerging Markets LeadersSmall-Mid Cap Value1 Emerging Markets GrowthSmall Cap Growth Emerging Markets Small Cap GrowthSmall Cap Value
Global Equity Fund Fixed Income FundsGlobal Leaders Bond
IncomeMulti-Asset and Alternative Fund Low DurationMacro Allocation
The investment objectives of the Funds are as follows:
U.S. Equity Funds Long-term capital appreciation.Global Equity Fund Long-term capital appreciation.International Equity Funds Long-term capital appreciation.Bond Fund Outperform the Bloomberg Barclays U.S. Aggregate Index by maximizing total return through a combination of
income and capital appreciation.Income Fund High level of current income with relative stability of principal.Low Duration Fund Maximize total return. Total return includes both income and capital appreciation.Macro Allocation Fund Maximize long-term risk-adjusted total return.
1 Effective April 15, 2021, the Small-Mid Cap Value Fund liquidated.
86

(b) Repurchase Agreements
In a repurchase agreement, a Fund buys a security at one price and at the time of sale, the seller agrees to repurchase the security at a mutually agreed upon time and price (usually within seven days). The repurchase agreement thereby determines the yield during the purchaser’s holding period, while the seller’s obligation to repurchase is secured by the value of the underlying collateral. William Blair Investment Management, LLC (“the Adviser”) monitors, on an ongoing basis, the value of the underlying collateral to ensure that the value always equals or exceeds the repurchase price plus accrued interest. Repurchase agreements may involve certain risks in the event of a default or insolvency of the other party to the agreement, including possible delays or restrictions upon a Fund’s ability to dispose of the underlying collateral. The risk to a Fund is limited to the ability of the seller to pay the agreed upon sum on the delivery date. In the event of default, a repurchase agreement provides that a Fund is entitled to sell the underlying collateral. The loss, if any, to a Fund will be the difference between the proceeds from the sale and the repurchase price. However, if bankruptcy proceedings are commenced with respect to the seller of the security, disposition of the collateral by the Fund may be delayed or limited. The Funds have master repurchase agreements which allow the Funds to offset amounts owed to a counterparty with amounts owed from the same counterparty, including any collateral, in the event the counterparty defaults. Each Fund’s outstanding repurchase agreements, if any, and related collateral, are shown on the Fund’s Portfolio of Investments. Although no definitive creditworthiness criteria are used, the Adviser reviews the creditworthiness of the banks and non-bank dealers with which a Fund enters into repurchase agreements to evaluate those risks. A Fund may, for tax purposes, deem repurchase agreements collateralized by U.S. Government securities to be investments in U.S. Government securities.
(c) TBA Securities
The Fixed Income Funds may invest in mortgage pass-through securities eligible to be sold in the “to-be announced” market (“TBAs”). TBAs provide for the forward or delayed delivery of the underlying instrument with settlement in up to 180 days. The term TBA comes from the fact that the specific mortgage-backed security that will be delivered to fulfill a TBA trade is not designated at the time the trade is made, but rather is generally announced 48 hours before the settlement date. A Fund generally has the ability to close out a TBA obligation on or before the settlement date, rather than take delivery of the security. When a Fund sells TBAs, it incurs risks similar to those incurred in short sales. For example, when a Fund sells TBAs without owning or having the right to obtain the deliverable securities it incurs a risk of loss because it could have to purchase the securities at a price that is higher than the price at which it sold the securities.
(d) Securities Sold, Not Yet Purchased
A Fund may sell a security it does not own (known as selling a security short) in anticipation of a decline in the fair value of that security. When a fund sells a security short, it must borrow the security sold short and deliver it to the broker through which it made the short sale. A gain, limited to the price at which the fund sold the security short, or a loss, unlimited in size, will be recognized upon the termination of the short sale. A fund is also subject to the risk that it may be unable to reacquire a security to terminate a short position except at a price substantially in excess of the price at which it sold the security short.
(2) Valuation
(a) Investment Valuation
The value of U.S. equity securities, including exchange-traded funds, is determined by valuing securities traded on national securities markets or in the over-the-counter markets at the last sale price or, if applicable, the official closing price or, in the absence of a recent sale on the date of determination, at the mean between the last reported bid and ask prices.
The value of foreign equity securities is generally determined based upon the last sale price on the foreign exchange or market on which it is primarily traded and in the currency of that market as of the close of the appropriate exchange or, if there have been no sales during that day, at the mean between the last reported bid and ask prices. The Board of Trustees has determined that the passage of time between when the foreign exchanges or markets close and when the Funds compute their net asset values could cause the value of foreign equity securities to no longer be representative or accurate and, as a result, may necessitate that such securities be fair valued. Accordingly, for foreign equity securities, the Funds may use an independent pricing service to fair value price the security as of the close of regular trading on the NYSE. As a result, a Fund’s value for a foreign security may be different from the last sale price (or the mean between the last reported bid and ask prices). As of March 31, 2021, fair valuation estimates for foreign equity securities were not obtained.
Fixed income securities are generally valued using evaluated prices provided by an independent pricing service. The evaluated prices are formed using various market inputs that the pricing service believes accurately represent the market value of a security at a particular point in time. The pricing service determines evaluated prices for fixed income securities using inputs including, but not limited to, recent transaction prices for such securities, dealer quotes, transaction prices for other securities with similar characteristics, collateral characteristics, credit quality, payment history, liquidity and market conditions.
Repurchase agreements are valued at cost, which approximates fair value.
Option contracts on securities, currencies and other financial instruments traded on one or more exchanges are valued at their most recent sale price on the exchange on which they are traded most extensively. Option contracts on foreign indices are valued at the settlement price. If there were no sales that day or if no settlement price is available, such option contracts are valued at the mean between the last reported bid and ask prices. Option contracts traded in the Over-the-Counter (“OTC”) market shall be valued by an independent pricing service. Futures contracts are valued at the most recent settlement price on the exchange on which they are traded most extensively, or if no settlement price is available, at the last sale price as of the close of the exchange. Forward foreign currency contracts are valued on the basis of the value of the underlying currencies at the prevailing currency exchange rate as supplied by an independent pricing service.
Swaps that are centrally cleared through an exchange are valued at the most recent settlement price provided by the exchange on which they are cleared. Total return swaps on equities, equity baskets, indices and other financial instruments are valued by an independent pricing service, or if unavailable, based on the security’s or instrument’s underlying reference asset. All other swap contracts are valued by an independent pricing service.

Depending on the product and the terms of the transaction, the independent pricing service may use a series of techniques, including simulation pricing models. The pricing models use inputs that are observed from actively quoted markets such as issuer details, indices, spreads, interest rates, yield curves, dividends and exchange rates.
Securities, and other assets, for which a market price is not available or is deemed unreliable (e.g., securities affected by unusual or extraordinary events, such as natural disasters or securities affected by market or economic events, such as bankruptcy filings), or the value of which is affected by a significant valuation event, are valued at a fair value as determined in good faith by, or under the direction of, the Board of Trustees and in accordance with the Valuation Procedures approved by the Board of Trustees. The value of these fair valued securities may be different from the last sale price (or the mean between the last reported bid and ask prices), and there is no guarantee that a fair valued security will be sold at the price at which a Fund is carrying the security.
87

(b) Fair Value Measurements
Fair value is defined as the price that a Fund would receive upon selling a security in an orderly transaction to an independent buyer in the principal or most advantageous market for the investment. Various inputs are used in determining the value of a Fund’s investments. A three-tier hierarchy of inputs is used to classify fair value measurements for disclosure purposes. The three-tier hierarchy of inputs is summarized in the three broad levels listed below:
• Level 1—Quoted prices (unadjusted) in active markets for an identical security.
• Level 2—Prices determined using other significant observable inputs. Observable inputs are inputs that other market participants would use in pricing a security. These may include quoted prices for similar securities, interest rates, prepayment speeds, credit risk, and others. In addition, other observable inputs such as foreign exchange rates, benchmark securities indices and foreign futures contracts may be utilized in the valuation of certain foreign securities when significant events occur between the last sale on the foreign securities exchange and the time at which the net asset value of the Fund is calculated.
• Level 3—Prices determined using significant unobservable inputs. In situations where quoted prices or observable inputs are unavailable (for example, when there is little or no market activity for an investment), unobservable inputs may be used. Unobservable inputs reflect the Fund’s own assumptions about the factors market participants would use in pricing an investment, and are based on the best information available.
The inputs or methodology used for valuing an investment are not necessarily an indication of the risk associated with investing in those securities.
A description of the valuation methodologies applied to the Funds’ major categories of assets and liabilities measured at fair value on a recurring basis is as follows:
Exchange-Traded Securities
Securities traded on a national securities exchange (or reported on the NASDAQ national market), including exchange-traded funds, are stated at the last reported sales price on the day of valuation. Other securities traded in the over-the-counter market and listed securities for which no sale was reported on that date are stated at the mean between the last reported bid and ask prices. To the extent these securities are actively traded and valuation adjustments are not applied, they are categorized as Level 1 of the fair value hierarchy. Securities traded on inactive markets or valued by reference to similar instruments are generally categorized as Level 2 of the fair value hierarchy.
Fixed Income Securities
Fixed income securities including corporate, convertible and municipal bonds and notes, U.S. government agency obligations, U.S. treasury obligations, sovereign issues, bank loans, convertible preferred securities, asset-backed securities, non-U.S. bonds and commercial paper are generally valued using evaluated prices provided by an independent pricing service. The evaluated prices are formed using various market inputs that the pricing service believes accurately represent the fair value of a security at a particular point in time. The pricing service determines evaluated prices for fixed income securities using inputs including, but not limited to, recent transaction prices for such securities, dealer quotes, transaction prices for other securities with similar characteristics, collateral characteristics, credit quality, payment history, liquidity and market conditions. Securities that use similar valuation techniques and observable inputs as described above are categorized as Level 2 of the fair value hierarchy.
Repurchase Agreements
Repurchase agreements are valued at cost, which approximates fair value. Repurchase agreements are categorized as Level 2 of the fair value hierarchy.
Derivative Instruments
Listed derivatives, such as certain options and futures contracts, that are actively traded are valued based on quoted prices from the exchange on which they are traded most extensively and are categorized as Level 1 of the fair value hierarchy. OTC derivative contracts include forward foreign currency contracts, swap and certain option contracts related to interest rates, foreign currencies, the credit standing of reference entities, equity prices, or commodity prices. Depending on the product and the terms of the transaction, the fair value of OTC derivative products can be modeled by independent pricing services taking into account the counterparties’ creditworthiness and using a series of techniques, including simulation models. Many pricing models do not entail material subjectivity because the methodologies employed do not necessitate significant judgments and the pricing inputs are observed from actively quoted markets, as is the case of forward foreign currency contracts and interest rate swaps. A substantial majority of OTC derivative products valued by a Fund using pricing models fall into this category and are categorized within Level 2 of the fair value hierarchy.
As of March 31, 2021, the value of investments in securities and other financial instruments, segregated by their hierarchical input levels used in determining fair value and by security class or other financial instruments, are shown below (in thousands).
88

Investments in securities GrowthLarge Cap
GrowthMid CapGrowth
Small-MidCap Core
Level 1 - Quoted pricesCommon Stocks $ 300,864 $ 725,752 $ 80,714 $ 40,852
Level 2 - Other significant observable inputsRepurchase Agreements 2,261 6,222 1,639 905
Level 3 - Significant unobservable inputsNone — — — —
Total investments in securities $ 303,125 $ 731,974 $ 82,353 $ 41,757
Investments in securitiesSmall-Mid
Cap GrowthSmall-MidCap Value
Small CapGrowth
Small CapValue
Level 1 - Quoted pricesCommon Stocks $ 3,476,560 $ 1,188 $ 698,887 $ 49,811Exchange-Traded Funds 6,968 —
Level 2 - Other significant observable inputsRepurchase Agreements 53,784 — 11,492 1,129
Level 3 - Significant unobservable inputsNone — — — —
Total investments in securities $ 3,530,344 $ 1,188 $ 717,347 $ 50,940
Investments in securitiesGlobal
LeadersInternational
LeadersInternational
Growth
InstitutionalInternational
GrowthLevel 1 - Quoted prices
Common Stocks $ 123,680 $ 1,117,264 $ 2,205,098 $ 1,247,354Level 2 - Other significant observable inputs
Common Stocks — — 5,991 3,381Repurchase Agreements 1,613 18,773 10,476 14,756
Level 3 - Significant unobservable inputsNone — — — —
Total investments in securities $ 125,293 $ 1,136,037 $ 2,221,565 $ 1,265,491
Investments in securities
InternationalSmall Cap
Growth
EmergingMarketsLeaders
EmergingMarketsGrowth
EmergingMarkets
Small CapGrowth
Level 1 - Quoted pricesCommon Stocks $ 323,432 $ 270,459 $ 1,140,630 $ 319,073Preferred Stocks — — — 3,624
Level 2 - Other significant observable inputsCommon Stocks — — 3,256 9,605Repurchase Agreements 3,609 994 4,706 —
Level 3 - Significant unobservable inputsNone — — — —
Total investments in securities $ 327,041 $ 271,453 $ 1,148,592 $ 332,302
89

Investments in securities Bond IncomeLow
DurationMacro
AllocationAssetsLevel 1 - Quoted Prices
Common Stocks $ — $ — $ — $ 12,140Preferred Stocks — — — 1,356Rights — — — 16Exchange-Traded Funds — — — 182,869
Level 2 - Other significant observable inputsAsset-Backed Securities 4,847 2,784 16,997 —Commercial Paper 2,200 — — —Corporate Obligations 124,781 24,544 56,038 —Foreign Government Bonds — — — 35,326Repurchase Agreements 163 170 1,630 4,890U.S. Government and U.S. Government Agency 184,432 37,137 91,879 42,489
Level 3 - Significant unobservable inputsNone — — — —
LiabilitiesLevel 1 - Quoted Prices
None — — — —Level 2 - Other significant observable inputs
None — — — —Level 3 - Significant unobservable inputs
None — — — —Total investments in securities $ 316,423 $ 64,635 $ 166,544 $ 279,086Other financial instrumentsAssetsLevel 1 - Quoted Prices
Futures Contracts $ — $ — $ — $ 635Level 2 - Other significant observable inputs
Forward Foreign Currency Contracts — — — 4,061Swaps — — — 367
Level 3 - Significant unobservable inputsNone — — — —
LiabilitiesLevel 1 - Quoted Prices
Futures Contracts — — — (1,889)Level 2 - Other significant observable inputs
Forward Foreign Currency Contracts — — — (5,424)Swaps (877) (321) — (572)Written Options (78)U.S. Government Agency (5,372) (1,075) (23,296) —
Level 3 - Significant unobservable inputsNone — — — —
Total other financial instruments $ (6,249) $ (1,396) $ (23,296) $ (2,900)
See Portfolio of Investments for Sector Classification.
90

(3) Financial Derivative Instruments
Each Fund may use derivative instruments to maintain liquidity, to provide hedging, or in anticipation of changes in the composition of its portfolio holdings or as otherwise provided in each Fund’s prospectus. Macro Allocation Fund may also use derivative instruments to obtain investment exposures.
Derivative transactions carry counterparty risk as they are based on contracts between a Fund and the applicable counterparty. For exchange-traded or cleared derivative contracts, such counterparty risk is limited due to the role of the exchange or clearinghouse. OTC derivative contracts, however, are exposed to counterparty risk in the amount of unrealized gains, net of collateral held, for the duration of the contract.
Macro Allocation Fund is subject to certain netting arrangements through International Swaps and Derivatives Association, Inc. Master Agreements and Credit Support Annexes (“ISDAs”). The ISDAs maintain provisions for general obligations, representations, agreements, collateral and events of default or termination. The ISDAs cover certain OTC derivative securities entered into by Macro Allocation Fund with various counterparties and allow Macro Allocation Fund to close out and net its total exposure to a counterparty in the event of a default.
Futures Contracts
A futures contract provides for the future sale by one party and purchase by another party of a specified amount of a specific financial instrument for a specified price at a designated date, time and place. An index futures contract is an agreement pursuant to which the parties agree to take or make delivery of an amount of cash equal to the difference between the value of the index at the close of the last trading day of the contract and the price at which the index futures contract was originally written. A futures contract can be closed out prior to delivery by entering into an offsetting transaction in a matching futures contract. Although the value of an index might be a function of the value of certain specified securities, no physical delivery of those securities is made. If the offsetting purchase price is less than the original sale price, a Fund realizes a gain; if it is more, a Fund realizes a loss. Conversely, if the offsetting sale price is more than the original purchase price, a Fund realizes a gain; if it is less, a Fund realizes a loss. The transaction costs must also be included in these calculations. There can be no assurance, however, that a Fund will be able to enter into an offsetting transaction with respect to a particular futures contract at a particular time. If a Fund is not able to enter into an offsetting transaction, a Fund will continue to be required to maintain the margin deposits on the futures contract.
Upon entering into a futures contract, a Fund is required to pledge to the broker an amount of cash, U.S. government securities, or other liquid assets equal to a certain percentage of the contract amount (“initial margin deposit”). Futures contracts are marked to market daily and an appropriate payable or receivable for the change in value (“variation margin”) is recorded by a Fund and a cash payment is either made to or received from the broker each day. Gains or losses on futures contracts are recognized but not considered realized until the contracts expire or are closed.
Options
The purchase or sale of an option by a Fund involves the payment or receipt of a premium by the investor and the corresponding right or obligation, as the case may be, either to purchase or sell the underlying security, commodity, or other instrument for a specific price at a certain time or during a certain period. Purchasing options involves the risk that the underlying instrument will not change price in the manner expected, so the investor loses its premium. Writing options involves potentially greater risk because the investor is exposed to the extent of the actual price movement in the underlying security rather than only the amount of the premium paid (which could result in a potentially unlimited loss). OTC options also involve counterparty credit risk.
Forward Foreign Currency Contracts
The Global Equity, International Equity and Multi-Asset and Alternative Funds may enter into forward foreign currency contracts. When entering into a forward foreign currency contract, a Fund agrees to receive or deliver a fixed quantity of foreign currency for an agreed-upon price on an agreed future date. A Fund’s net equity therein, representing unrealized gain or loss on the contracts as measured by the difference between the forward foreign exchange rates at the dates of entry into the contracts and the forward rates at the reporting date. These instruments may involve market risk, credit risk, or both kinds of risks in excess of the amount recognized in the Portfolio of Investments. Risks arise from the possible inability of counterparties to meet the terms of their contracts and from the price movements in currencies.
91

Swap Contracts
Swap agreements may include total return, interest rate, securities index, commodity, security, currency exchange rate, credit default index, volatility and variance swaps. Cleared swaps are transacted through futures commission merchants that are members of central clearing houses with the clearing house serving as a central counterparty similar to transactions in futures contracts. In a standard “swap” transaction, two parties agree to exchange the returns (or differentials in rates of return) earned or realized on particular predetermined investments or instruments. The gross returns to be exchanged or “swapped” between the parties are calculated with respect to a “notional amount” (i.e., the change in the value of a particular dollar amount invested, for example, at a particular interest rate, in a particular foreign currency, or in a “basket” of securities representing a particular index). Swap agreements are subject to the risk that the counterparty to the swap will default on its obligation to pay a Fund and the risk that a Fund will not be able to meet its obligations to pay the counterparty to the swap. Swap agreements may also involve fees, commissions or other costs that may reduce a Fund’s gains from a swap agreement or may cause a Fund to lose money. To the extent permitted by its investment policies and restrictions, a Fund may invest in the following types of swaps:
Credit Default Swaps—A Fund may invest in credit default swaps as a means of “buying” credit protection (i.e., attempting to mitigate the risk of default or credit quality deterioration in some portion of a Fund’s holdings) or “selling” credit protection (i.e., attempting to gain exposure to an underlying issuer’s credit quality characteristics without directly investing in that issuer). A credit default swap is a contract between a buyer and a seller of protection against a pre-defined credit event (e.g., a ratings downgrade or default) on an underlying reference obligation, which may be a single debt instrument or baskets or indices of securities. A Fund may be a buyer or seller of a credit default swap. As a seller of protection on credit default swap agreements, a Fund will generally receive from the buyer of protection a fixed rate of income throughout the term of the swap provided that there is no credit event. A Fund adds leverage to its portfolio because the Fund is subject to investment exposure on the notional amount of the swap. The maximum potential amount of future payments that a Fund as a seller of protection could be required to make under a credit default swap agreement equals the notional amount of the agreement. Notional amounts of each individual credit default swap agreement outstanding as of the period end for which a Fund is the seller of protection are disclosed in the Fund’s Portfolio of Investments. These potential amounts would be partially offset by any recovery values of the respective referenced obligations, upfront payments received upon entering into the agreement, or net amounts received from the settlement of buy protection credit default swap agreements entered into by the same Fund for the same referenced entity or entities. For credit default swap contracts on credit indices, the quoted market prices and resulting values serve as an indicator of the payment performance risk. Increasing market values, in absolute terms when compared to the notional amount of the swap, typically represent deterioration of the referenced entities’ credit soundness and a greater likelihood or risk of default or other credit event occurring as defined under the terms of the swap.
Interest Rate Swap—A Fund may invest in interest rate swaps to gain or mitigate exposure to changes in interest rates. Interest rate swap agreements involve a commitment between parties to pay either a fixed interest rate or a floating interest rate based on a notional amount of principal. The parties make payments at predetermined intervals throughout the life of the swap. As a payer, a Fund would make the fixed payment and receive the floating payment. As a receiver, a Fund would make the floating payment and receive the fixed payment.
Total Return Swap—A Fund may invest in total return swaps to gain or mitigate exposure to an underlying security, or securities. Total return swap agreements may involve commitments to pay interest in exchange for the return on the underlying security, or securities. At maturity, a net cash flow is exchanged between the parties based on the total return of the underlying security, or securities, less a financing rate. As a receiver in the transaction, a Fund would receive a payment for a positive return and would make a payment for a negative return. As a payer in the transaction, a Fund would make a payment for a positive return and would receive a payment for a negative return.
Variance Swap—A Fund may invest in variance swaps in order to gain or mitigate its exposure to an underlying reference entity such as a broad based index. A variance swap is an agreement between two parties to exchange cash flows based on the measured variance of a reference entity. The payer agrees to exchange the fixed rate, which is the variance strike price of the reference entity, to the receiver for the floating rate, which is the realized variance price of the reference entity. At the time the trade is originated, the agreed upon variance strike price is generally set so that the fair value of the swap is near zero. At maturity, a net cash flow is exchanged between the parties based on the difference between the final realized variance price of the swap and the variance strike price multiplied by the notional, or vega amount. As a receiver of the floating rate, a Fund would receive a payment if the final realized variance price is greater than the variance strike price and would make a payment if the final realized variance price is less than the variance strike price. As a payer of the floating rate, a Fund would receive a payment if the final realized variance price is less than the variance strike price and would make a payment if the final realized variance price is greater than the variance strike price.
92

William Blair Funds
+1 800 742 7272williamblairfunds.com
©William Blair & Company, L.L.C., distributor150 North Riverside PlazaChicago, Illinois 60606
U.S. EQUITYGrowth Fund
Large Cap Growth Fund
Mid Cap Growth Fund
Small-Mid Cap Core Fund
Small-Mid Cap Growth Fund
Small-Mid Cap Value Fund
Small Cap Growth Fund
Small Cap Value Fund
GLOBAL EQUITYGlobal Leaders Fund
INTERNATIONAL EQUITYInternational Leaders Fund
International Growth Fund
Institutional International Growth Fund
International Small Cap Growth Fund
Emerging Markets Leaders Fund
Emerging Markets Growth Fund
Emerging Markets Small Cap Growth Fund
FIXED INCOMEBond Fund
Income Fund
Low Duration Fund
MULTI-ASSET ANDALTERNATIVEMacro Allocation Fund