online grocery Shop / Online Grocery Store /Grocery Shopping Store
Overview
Willard BishopTotal Grocery Store
SuperStudy™
March 2013
Prepared for

TitleSuperStudy™
Overview& ABC
Methodology
Copyright © 2013. All Rights Reserved.
SuperStudy™ Overview
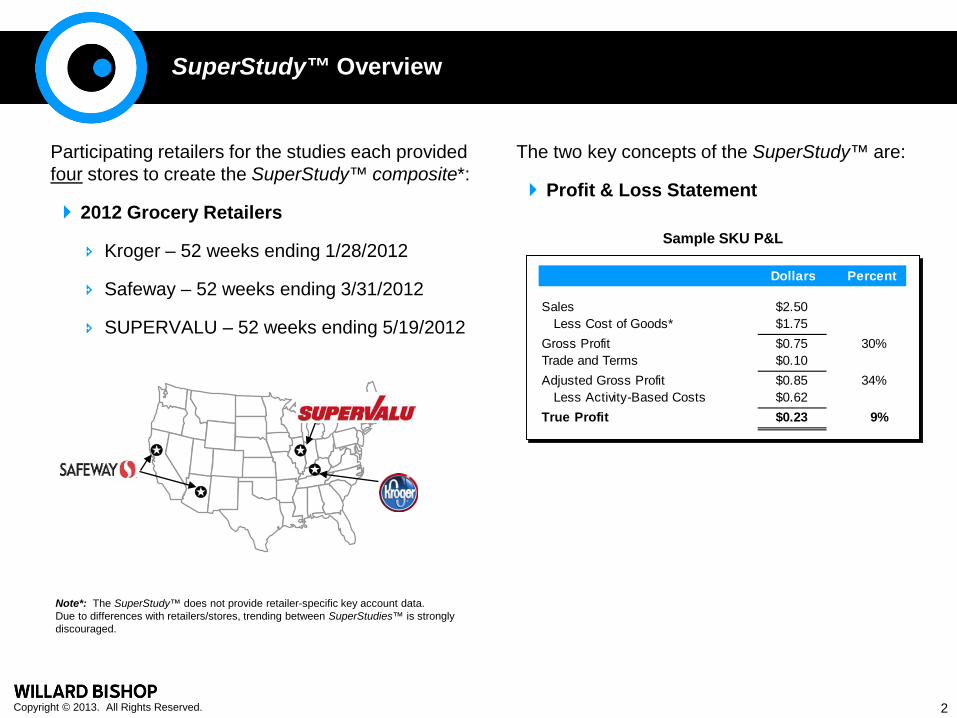
The two key concepts of the SuperStudy™ are:
Profit & Loss Statement
Participating retailers for the studies each provided four stores to create the SuperStudy™ composite*:
2012 Grocery Retailers
Kroger – 52 weeks ending 1/28/2012
Safeway – 52 weeks ending 3/31/2012
SUPERVALU – 52 weeks ending 5/19/2012
Dollars Percent
Sales $2.50 Less Cost of Goods* $1.75 Gross Profit $0.75 30% Trade and Terms $0.10 Adjusted Gross Profit $0.85 34% Less Activity-Based Costs $0.62 True Profit $0.23 9%
Sample SKU P&L
Note*: The SuperStudy™ does not provide retailer-specific key account data.Due to differences with retailers/stores, trending between SuperStudies™ is strongly discouraged.
2
Copyright © 2013. All Rights Reserved.
ABC Methodology
Activity-based costing (ABC) is a process that fairly assigns operating costs to individual products based on how products "consume" costs throughout the supply chain.
ABC identifies work processes in the warehouse, during transportation, and at the store, and then allocates these costs to products based on their "fair share."
To gather the activity-based costs and calculate profitability in this study, Willard Bishop multiple sources:
Observations and Time Studies – Willard Bishop studied the department-level operation at each chain to fully understand and map department activities and calculate department space utilization.
Interviews – Willard Bishop interviewed key individuals at each retailer to collect several important pieces of information, including distribution center procedures as well as store operating and merchandising information.
Internal Reports – Willard Bishop collected operating reports to document several key warehouse and store-level costs, including wages, rent, taxes, utilities, insurance, etc.
Performance Data – Each retailer provided Willard Bishop with retail, cost, and movement data for each item in the study covering the entire 52-week period of 2012. Each retailer also provided vendor-specific payment terms and trade funds data for the same time period. The trade and terms funds data were used to calculate the adjusted gross profit contribution of each study SKU.
3
Copyright © 2013. All Rights Reserved.
ABC Methodology
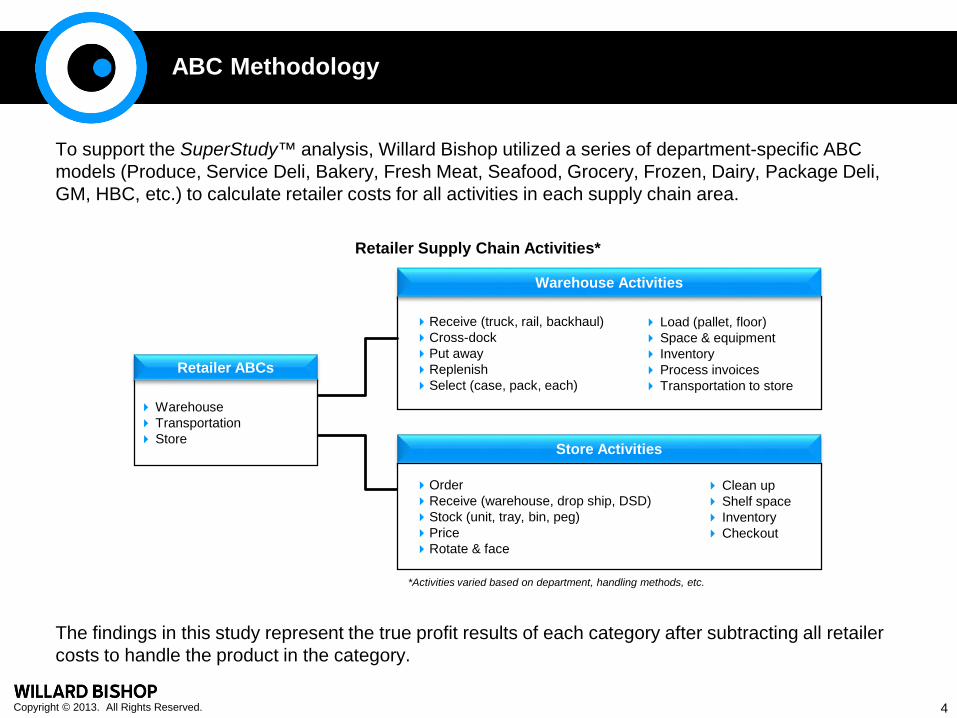
To support the SuperStudy™ analysis, Willard Bishop utilized a series of department-specific ABC models (Produce, Service Deli, Bakery, Fresh Meat, Seafood, Grocery, Frozen, Dairy, Package Deli, GM, HBC, etc.) to calculate retailer costs for all activities in each supply chain area.
The findings in this study represent the true profit results of each category after subtracting all retailer costs to handle the product in the category.
Retailer Supply Chain Activities*
Receive (truck, rail, backhaul) Cross-dock Put away Replenish Select (case, pack, each)
Load (pallet, floor) Space & equipment Inventory Process invoices Transportation to store
Warehouse Transportation Store
Warehouse Activities
Store Activities
Order Receive (warehouse, drop ship, DSD) Stock (unit, tray, bin, peg) Price Rotate & face
Clean up Shelf space Inventory Checkout
Retailer ABCs
*Activities varied based on department, handling methods, etc.
4

TitleDepartment Highlights
Copyright © 2013. All Rights Reserved.
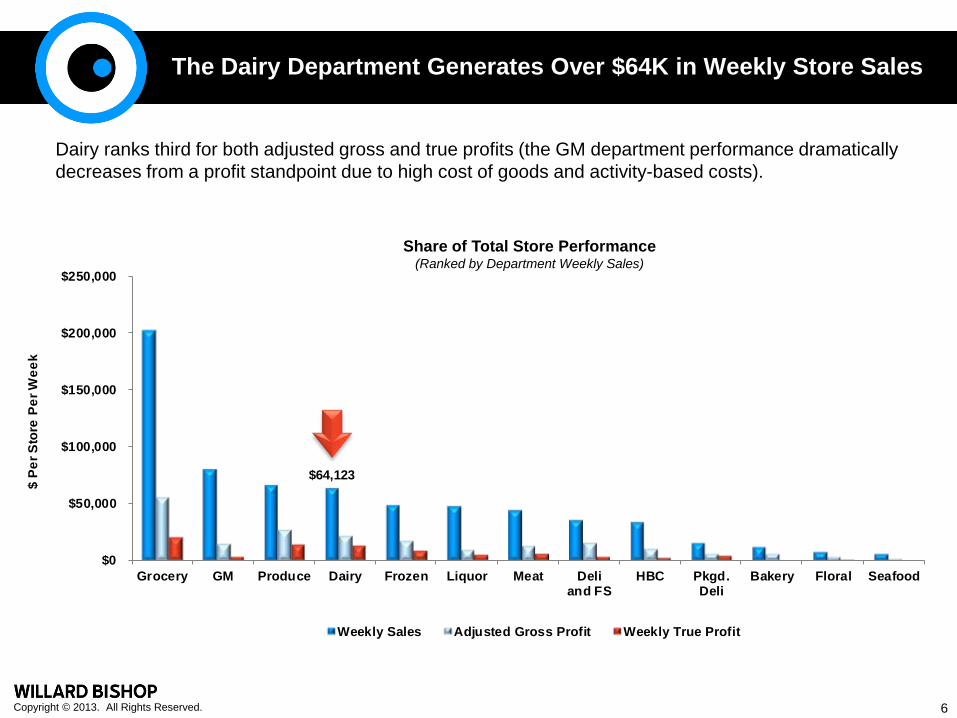
$64,123
$0
$50,000
$100,000
$150,000
$200,000
$250,000
Grocery GM Produce Dairy Frozen Liquor Meat Deliand FS
HBC Pkgd.Deli
Bakery Floral Seafood
$ Pe
r Sto
re P
er W
eek
Weekly Sales Adjusted Gross Profit Weekly True Profit
The Dairy Department Generates Over $64K in Weekly Store Sales
Dairy ranks third for both adjusted gross and true profits (the GM department performance dramatically decreases from a profit standpoint due to high cost of goods and activity-based costs).
Share of Total Store Performance(Ranked by Department Weekly Sales)
6
Copyright © 2013. All Rights Reserved.
3%
10%11%
17%
Share ofSquareFoot ofFacing
Share ofWeeklySales
Share ofAdjusted
GrossProfit
Share ofWeekly
TrueProfit
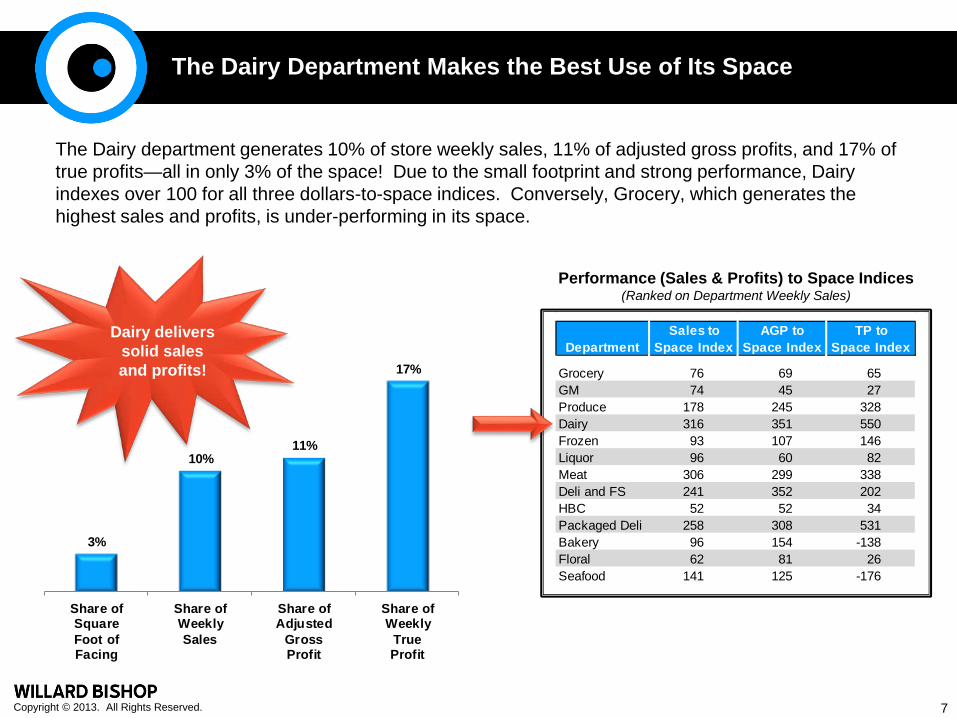
The Dairy Department Makes the Best Use of Its Space
The Dairy department generates 10% of store weekly sales, 11% of adjusted gross profits, and 17% of true profits—all in only 3% of the space! Due to the small footprint and strong performance, Dairy indexes over 100 for all three dollars-to-space indices. Conversely, Grocery, which generates the highest sales and profits, is under-performing in its space.
Performance (Sales & Profits) to Space Indices(Ranked on Department Weekly Sales)
Dairy delivers solid sales and profits!
DepartmentSales to
Space IndexAGP to
Space IndexTP to
Space Index
Grocery 76 69 65 GM 74 45 27 Produce 178 245 328 Dairy 316 351 550 Frozen 93 107 146 Liquor 96 60 82 Meat 306 299 338 Deli and FS 241 352 202 HBC 52 52 34 Packaged Deli 258 308 531 Bakery 96 154 -138 Floral 62 81 26 Seafood 141 125 -176
7
Copyright © 2013. All Rights Reserved.
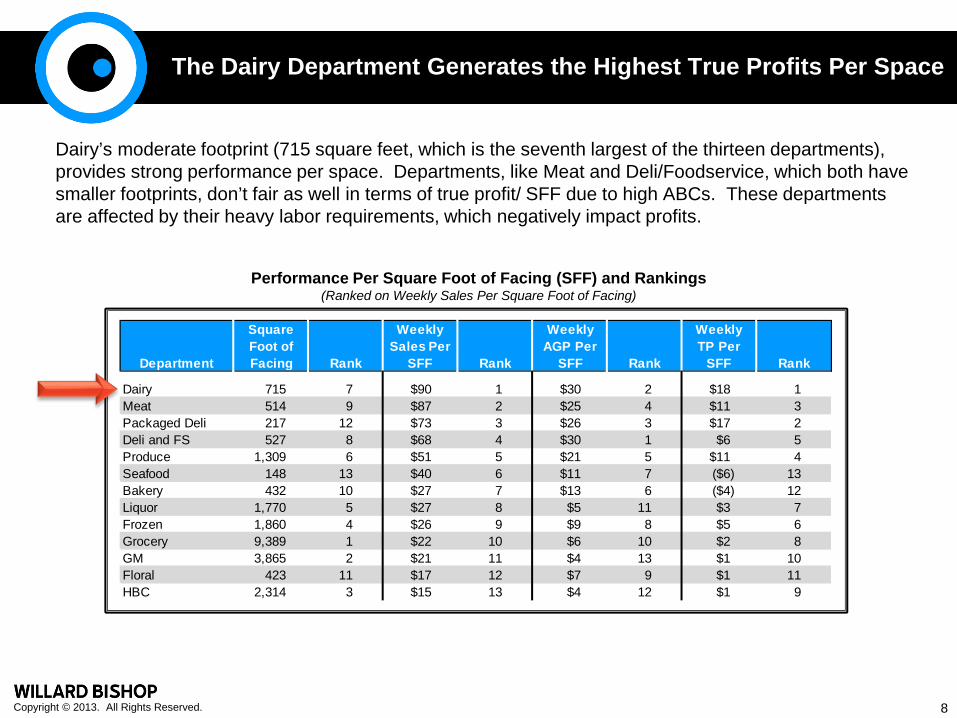
The Dairy Department Generates the Highest True Profits Per Space
Dairy’s moderate footprint (715 square feet, which is the seventh largest of the thirteen departments), provides strong performance per space. Departments, like Meat and Deli/Foodservice, which both have smaller footprints, don’t fair as well in terms of true profit/ SFF due to high ABCs. These departments are affected by their heavy labor requirements, which negatively impact profits.
Performance Per Square Foot of Facing (SFF) and Rankings(Ranked on Weekly Sales Per Square Foot of Facing)
Department
Square Foot of Facing Rank
Weekly Sales Per
SFF Rank
Weekly AGP Per
SFF Rank
Weekly TP Per
SFF Rank
Dairy 715 7 $90 1 $30 2 $18 1 Meat 514 9 $87 2 $25 4 $11 3 Packaged Deli 217 12 $73 3 $26 3 $17 2 Deli and FS 527 8 $68 4 $30 1 $6 5 Produce 1,309 6 $51 5 $21 5 $11 4 Seafood 148 13 $40 6 $11 7 ($6) 13 Bakery 432 10 $27 7 $13 6 ($4) 12 Liquor 1,770 5 $27 8 $5 11 $3 7 Frozen 1,860 4 $26 9 $9 8 $5 6 Grocery 9,389 1 $22 10 $6 10 $2 8 GM 3,865 2 $21 11 $4 13 $1 10 Floral 423 11 $17 12 $7 9 $1 11 HBC 2,314 3 $15 13 $4 12 $1 9
8

TitleDairy Highlights
Copyright © 2013. All Rights Reserved.
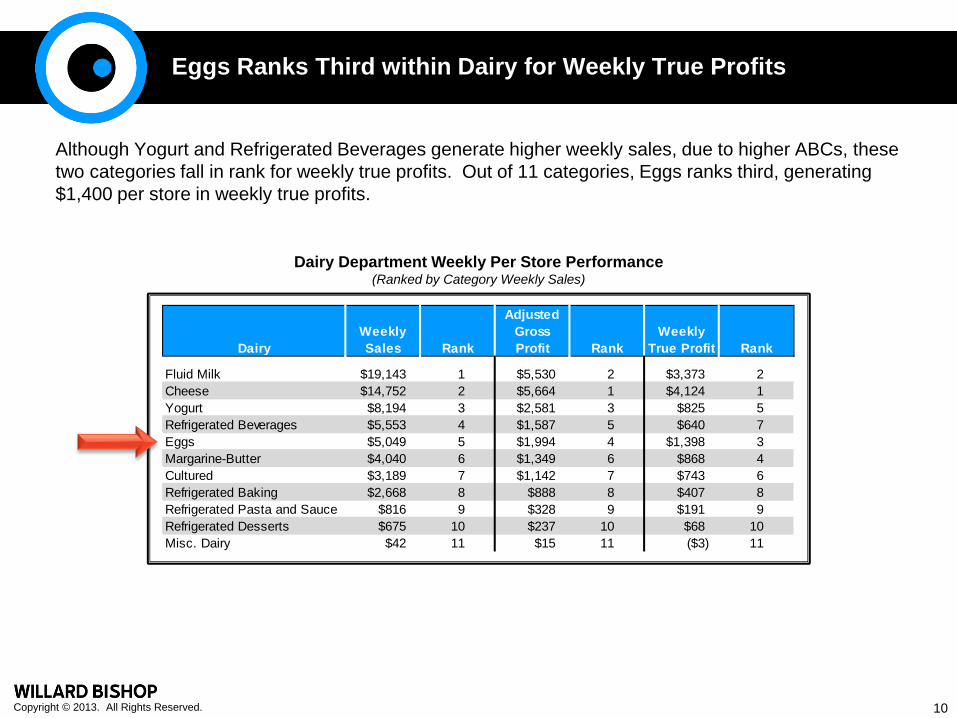
Eggs Ranks Third within Dairy for Weekly True Profits
Although Yogurt and Refrigerated Beverages generate higher weekly sales, due to higher ABCs, these two categories fall in rank for weekly true profits. Out of 11 categories, Eggs ranks third, generating $1,400 per store in weekly true profits.
Dairy Department Weekly Per Store Performance(Ranked by Category Weekly Sales)
DairyWeekly Sales Rank
Adjusted Gross Profit Rank
Weekly True Profit Rank
Fluid Milk $19,143 1 $5,530 2 $3,373 2 Cheese $14,752 2 $5,664 1 $4,124 1 Yogurt $8,194 3 $2,581 3 $825 5 Refrigerated Beverages $5,553 4 $1,587 5 $640 7 Eggs $5,049 5 $1,994 4 $1,398 3 Margarine-Butter $4,040 6 $1,349 6 $868 4 Cultured $3,189 7 $1,142 7 $743 6 Refrigerated Baking $2,668 8 $888 8 $407 8 Refrigerated Pasta and Sauce $816 9 $328 9 $191 9 Refrigerated Desserts $675 10 $237 10 $68 10 Misc. Dairy $42 11 $15 11 ($3) 11
10
Copyright © 2013. All Rights Reserved.
7% 8%9%
11%
Share ofSquareFoot ofFacing
Share ofWeeklySales
Share ofAdjusted
GrossProfit
Share ofWeekly
TrueProfit
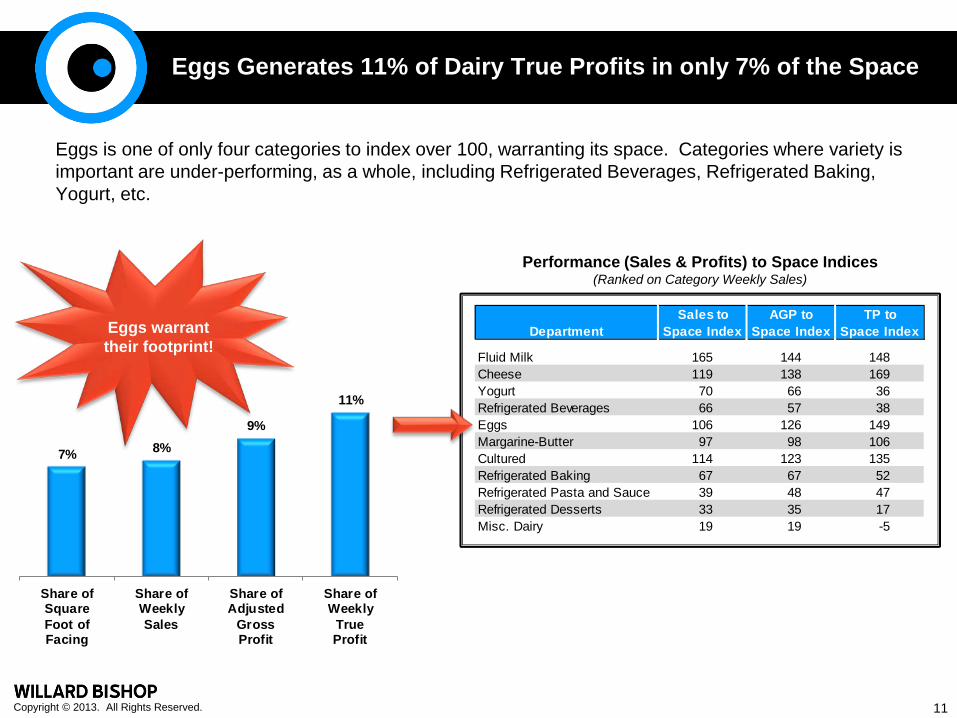
Eggs Generates 11% of Dairy True Profits in only 7% of the Space
Eggs is one of only four categories to index over 100, warranting its space. Categories where variety is important are under-performing, as a whole, including Refrigerated Beverages, Refrigerated Baking, Yogurt, etc.
Performance (Sales & Profits) to Space Indices(Ranked on Category Weekly Sales)
Eggs warrant their footprint!
DepartmentSales to
Space IndexAGP to
Space IndexTP to
Space Index
Fluid Milk 165 144 148 Cheese 119 138 169 Yogurt 70 66 36 Refrigerated Beverages 66 57 38 Eggs 106 126 149 Margarine-Butter 97 98 106 Cultured 114 123 135 Refrigerated Baking 67 67 52 Refrigerated Pasta and Sauce 39 48 47 Refrigerated Desserts 33 35 17 Misc. Dairy 19 19 -5
11
Copyright © 2013. All Rights Reserved.
0
20
40
60
80
100
120
140
160
$0
$20
$40
$60
$80
$100
$120
$140
$160
FluidMilk
Cheese Yogurt Refrig.Bev.
Eggs Marg.-Butter
Cultured Refrig.Baking
Refrig.Pasta and
Sauce
Refrig.Desserts
Misc.Dairy
Tota
l Squ
are
Foot
of F
acin
g
$ Pe
r Squ
are
Foot
of F
acin
g
Weekly Salesper SFF Weekly AGP per SFF Weekly TP per SFF Square Foot Facing
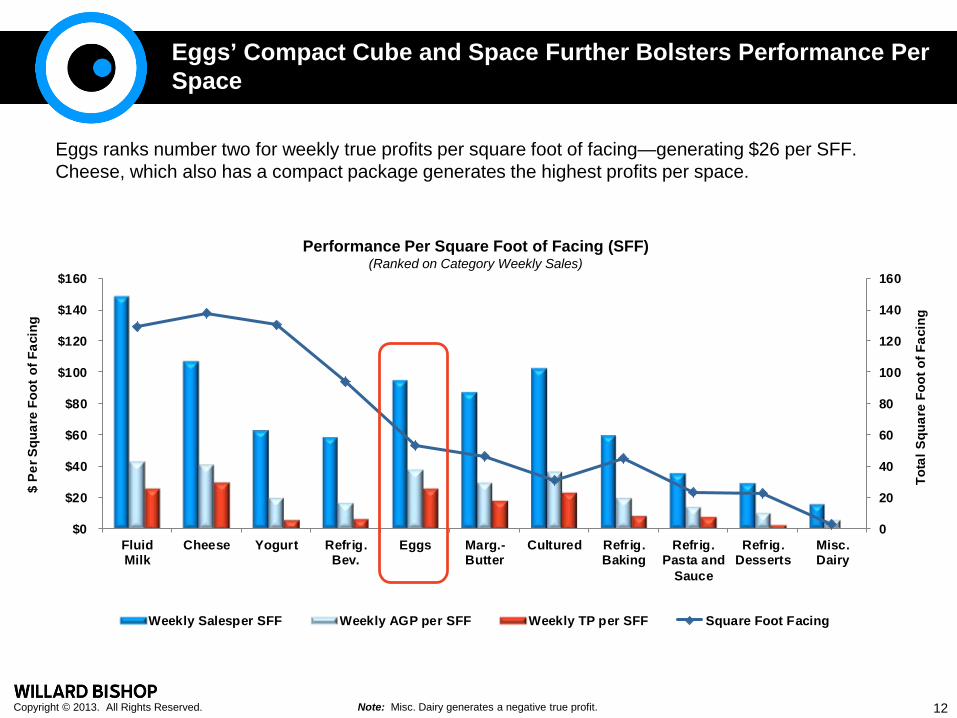
Eggs’ Compact Cube and Space Further Bolsters Performance Per Space
Eggs ranks number two for weekly true profits per square foot of facing—generating $26 per SFF. Cheese, which also has a compact package generates the highest profits per space.
Performance Per Square Foot of Facing (SFF)(Ranked on Category Weekly Sales)
Note: Misc. Dairy generates a negative true profit. 12
Copyright © 2013. All Rights Reserved.
18%28%
10% 12%
28%22% 23%
15%23%
10%
11%
10%
21% 17%
12%
12% 13%18%
17%
25% 42%
FluidMilk
Cheese Yogurt Refrig.Bev.
Eggs Marg.-Butter
Cultured Refrig.Baking
Refrig.Pasta and
Sauce
Refrig.Desserts
Misc.Dairy
ABCs as a % of Sales True Margin
29%
36%
35%40%
33%36%
33%
39%
29%32%
38%
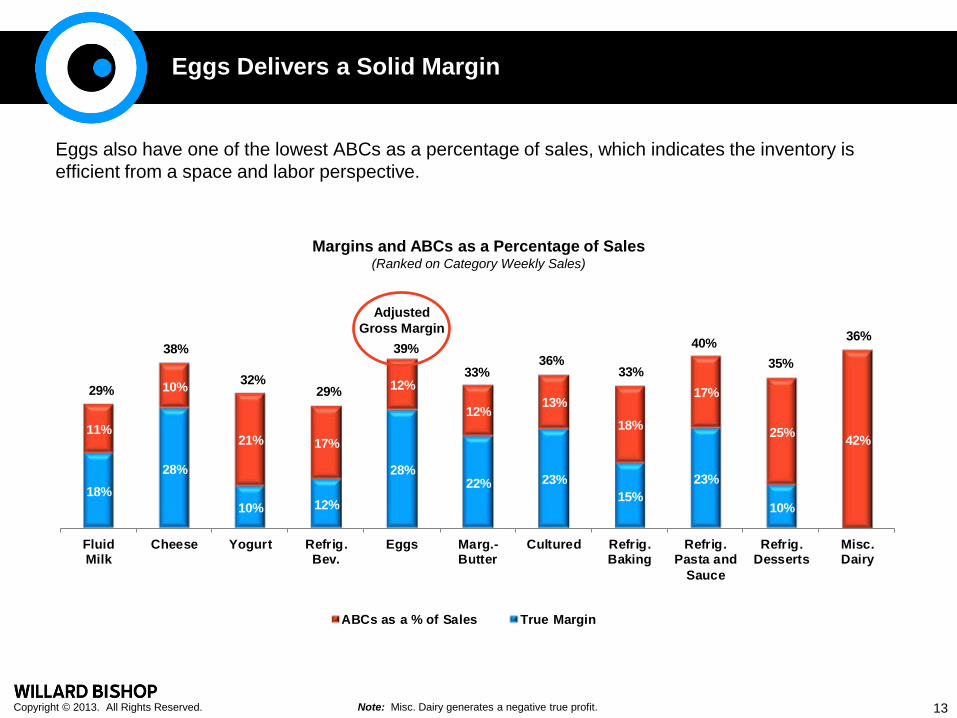
Eggs Delivers a Solid Margin
Eggs also have one of the lowest ABCs as a percentage of sales, which indicates the inventory is efficient from a space and labor perspective.
Margins and ABCs as a Percentage of Sales(Ranked on Category Weekly Sales)
Adjusted Gross Margin
Note: Misc. Dairy generates a negative true profit. 13
Copyright © 2013. All Rights Reserved.
$0.51 $0.85
$0.13 $0.34 $0.67 $0.61 $0.55 $0.33
$1.06 $0.30
($0.16)
$0.33 $0.32
$0.27 $0.50
$0.28 $0.34 $0.29 $0.39
$0.76
$0.75 $1.10
$2.08 $1.88
$0.86
$2.09 $1.45
$1.89 $1.51
$1.43
$2.69
$1.95 $1.70
FluidMilk
Cheese Yogurt Refrig.Bev.
Eggs Marg.-Butter
Cultured Refrig.Baking
Refrig.Pasta and
Sauce
Refrig.Desserts
Misc.Dairy
Unit Cost Unit ABCs Unit True Profit
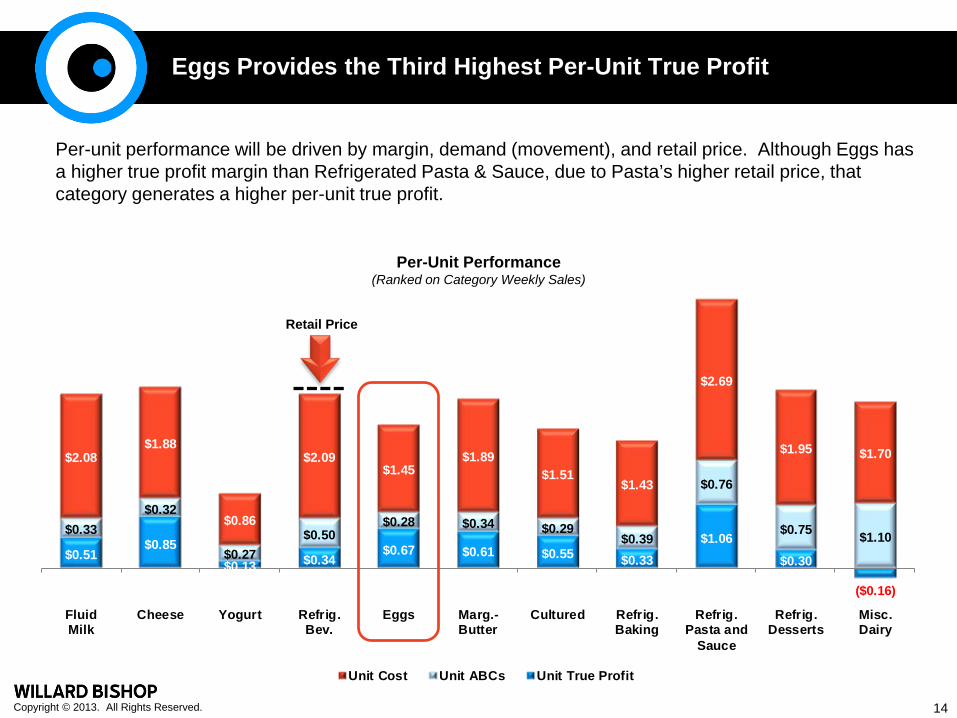
Eggs Provides the Third Highest Per-Unit True Profit
Per-unit performance will be driven by margin, demand (movement), and retail price. Although Eggs has a higher true profit margin than Refrigerated Pasta & Sauce, due to Pasta’s higher retail price, that category generates a higher per-unit true profit.
Per-Unit Performance(Ranked on Category Weekly Sales)
Retail Price
14
Copyright © 2013. All Rights Reserved.
FluidMilk Cheese Yogurt Refrig.
Bev. Eggs Marg.-Butter Cultured Refrig.
Baking
Refrig.Pastaand
Sauce
Refrig.Desserts
Misc.Dairy
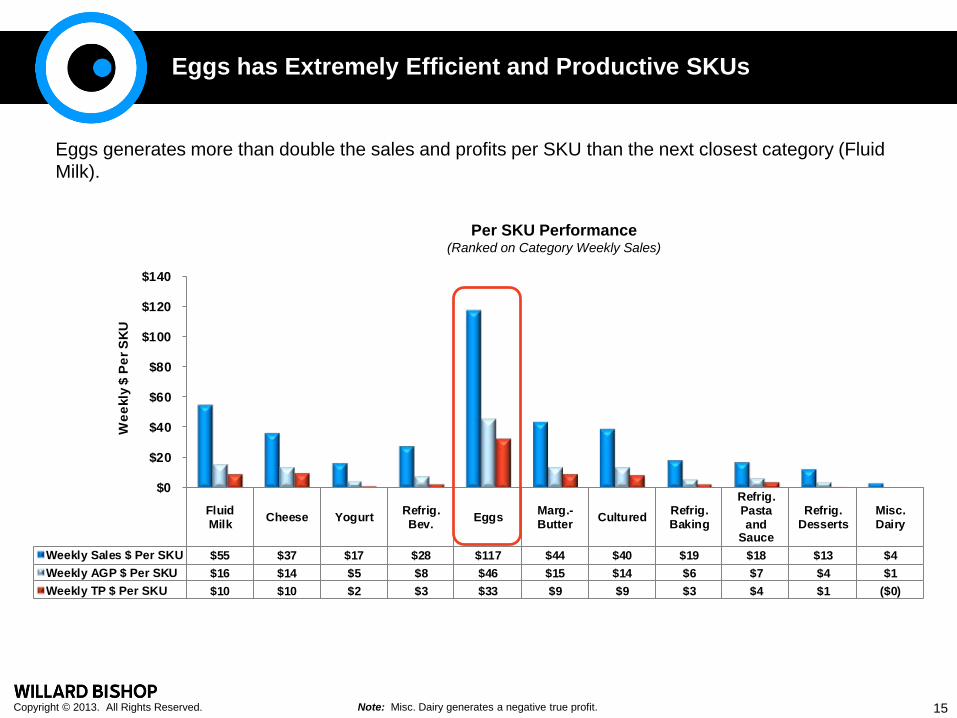
Weekly Sales $ Per SKU $55 $37 $17 $28 $117 $44 $40 $19 $18 $13 $4Weekly AGP $ Per SKU $16 $14 $5 $8 $46 $15 $14 $6 $7 $4 $1Weekly TP $ Per SKU $10 $10 $2 $3 $33 $9 $9 $3 $4 $1 ($0)
$0
$20
$40
$60
$80
$100
$120
$140
Wee
kly
$ Pe
r SKU
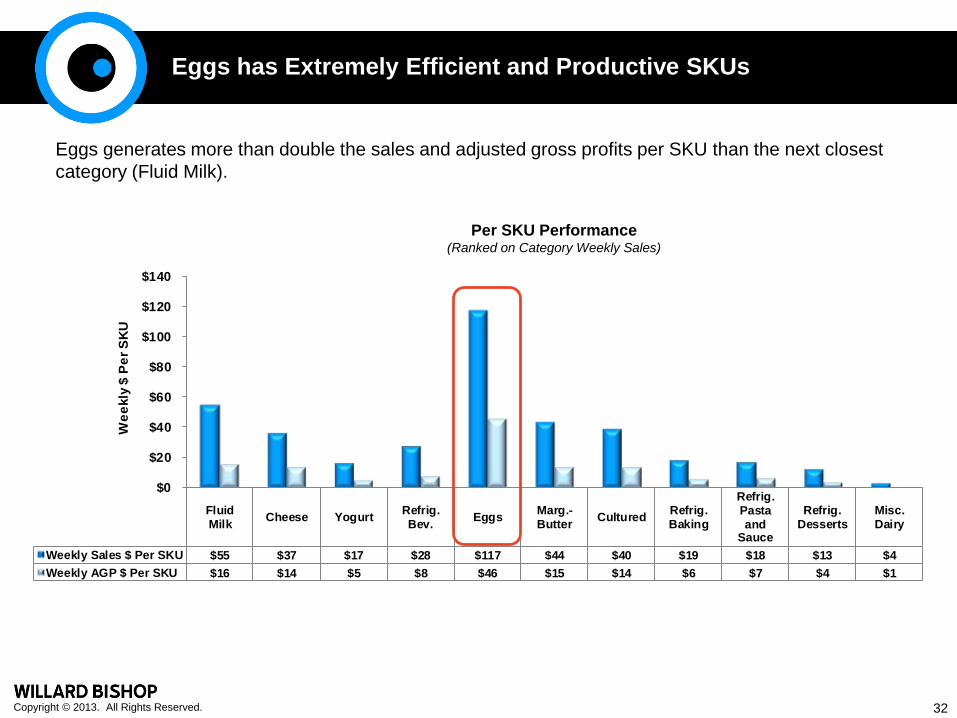
Eggs has Extremely Efficient and Productive SKUs
Eggs generates more than double the sales and profits per SKU than the next closest category (Fluid Milk).
Per SKU Performance(Ranked on Category Weekly Sales)
Note: Misc. Dairy generates a negative true profit. 15
Copyright © 2013. All Rights Reserved.
FluidMilk Cheese Yogurt Refrig.
Bev. Eggs Marg.-Butter Cultured Refrig.
Baking
Refrig.Pastaand
Sauce
Refrig.Desserts
Misc.Dairy
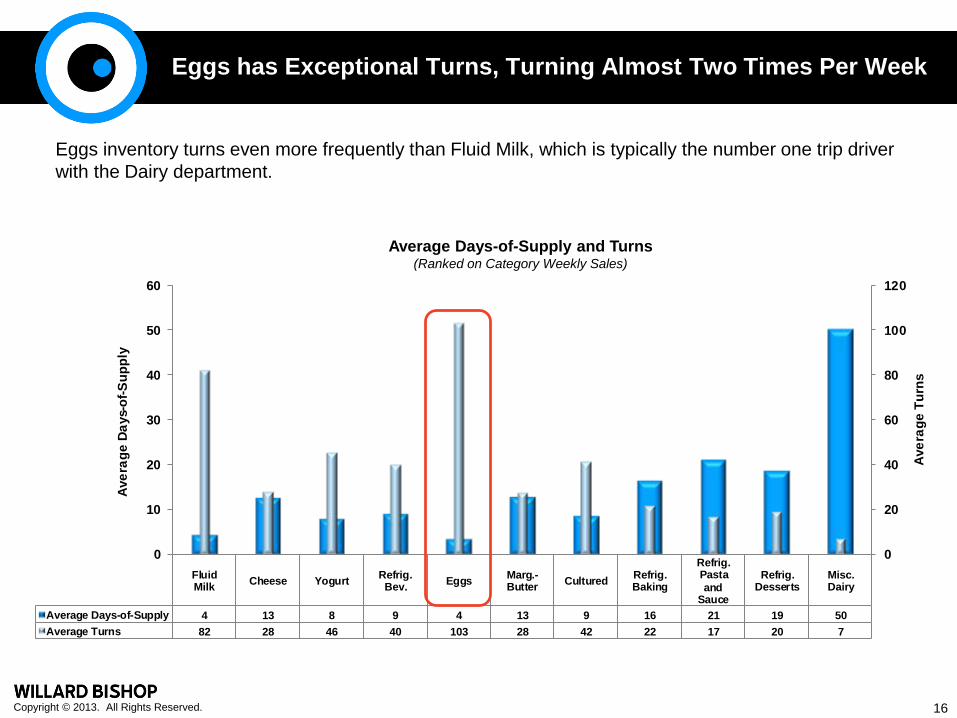
Average Days-of-Supply 4 13 8 9 4 13 9 16 21 19 50Average Turns 82 28 46 40 103 28 42 22 17 20 7
0
20
40
60
80
100
120
0
10
20
30
40
50
60
Aver
age
Turn
s
Aver
age
Days
-of-S
uppl
y
Eggs has Exceptional Turns, Turning Almost Two Times Per Week
Eggs inventory turns even more frequently than Fluid Milk, which is typically the number one trip driver with the Dairy department.
Average Days-of-Supply and Turns(Ranked on Category Weekly Sales)
16
Copyright © 2013. All Rights Reserved.
$0
$2,000
$4,000
$6,000
$8,000
$10,000
$12,000
$14,000
$16,000
$18,000
$0
$10
$20
$30
$40
$50
$60
$70
$80
FluidMilk
Cheese Yogurt Refrig.Bev.
Eggs Marg.-Butter
Cultured Refrig.Baking
Refrig.Pasta and
Sauce
Refrig.Desserts
Misc.Dairy
Annu
al S
helf
Inve
ntor
y Co
st
Prof
it Re
turn
-on-
Inve
ntor
y-In
vest
men
t
Average AGMROII Average TPROII Annual Shelf Inventory Cost
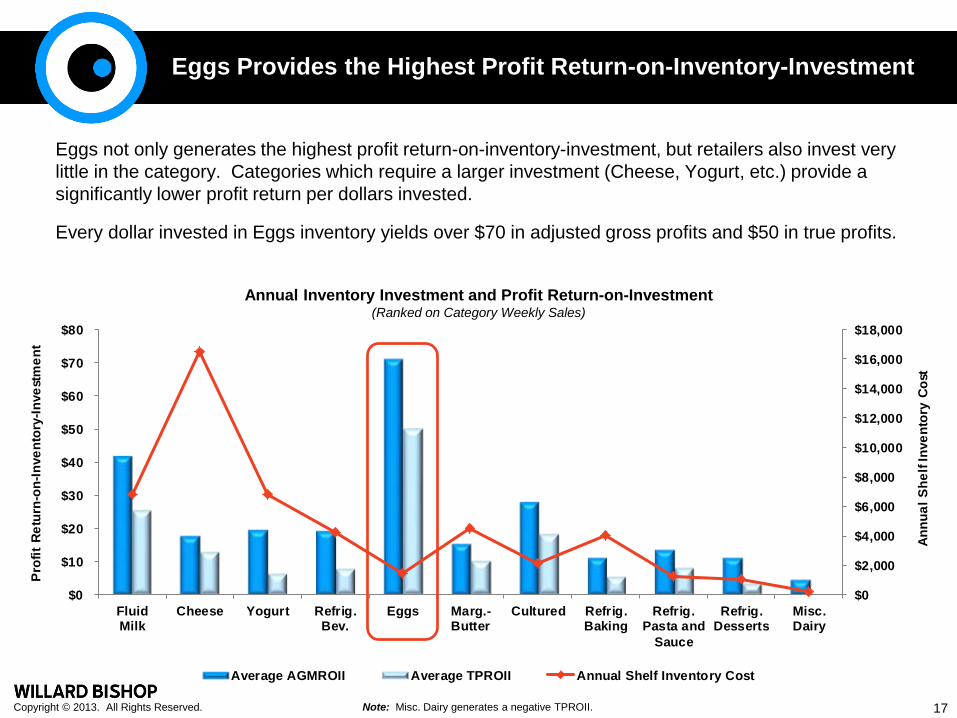
Eggs Provides the Highest Profit Return-on-Inventory-Investment
Eggs not only generates the highest profit return-on-inventory-investment, but retailers also invest very little in the category. Categories which require a larger investment (Cheese, Yogurt, etc.) provide a significantly lower profit return per dollars invested.
Every dollar invested in Eggs inventory yields over $70 in adjusted gross profits and $50 in true profits.
Annual Inventory Investment and Profit Return-on-Investment(Ranked on Category Weekly Sales)
Note: Misc. Dairy generates a negative TPROII. 17
Copyright © 2013. All Rights Reserved.
16% 15%
40% 37%
9%18% 25% 25%
11%
33%
68%
84% 85%
60% 63%
91%82% 75% 75%
89%
68%
32%
FluidMilk
Cheese Yogurt Refrig.Bev.
Eggs Marg.-Butter
Cultured Refrig.Baking
Refrig.Pasta and
Sauce
Refrig.Desserts
Misc.Dairy
% SKUs Making Money % SKUs Losing Money
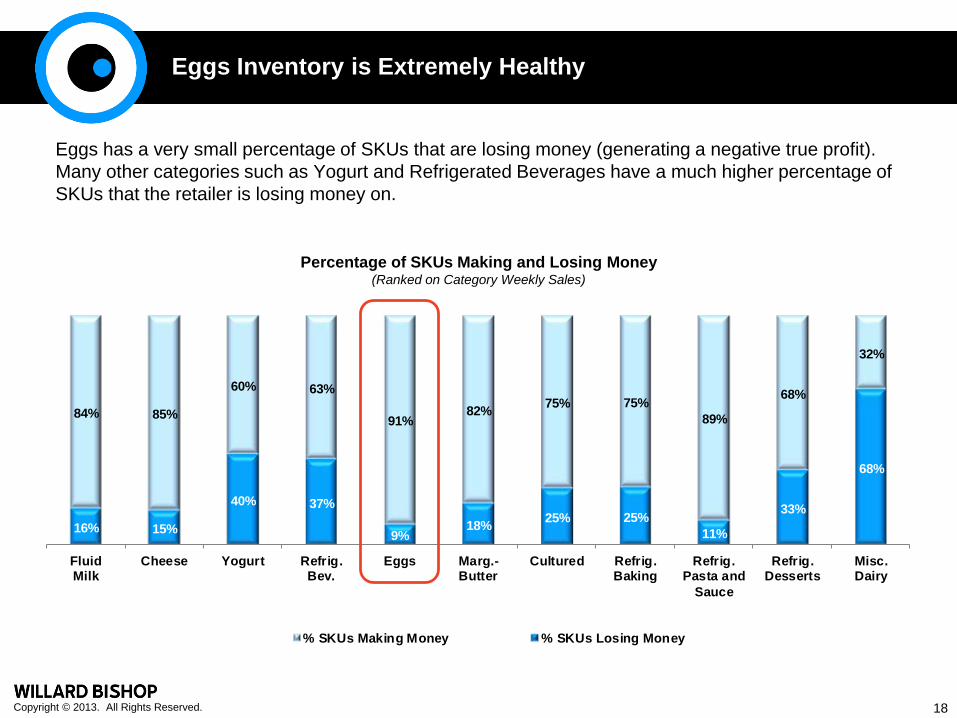
Eggs Inventory is Extremely Healthy
Eggs has a very small percentage of SKUs that are losing money (generating a negative true profit). Many other categories such as Yogurt and Refrigerated Beverages have a much higher percentage of SKUs that the retailer is losing money on.
Percentage of SKUs Making and Losing Money(Ranked on Category Weekly Sales)
18

TitleSummary Highlights
Copyright © 2013. All Rights Reserved.
Summary Highlights
The Dairy department ranks third (out of 13) for total store profits, generating 17% of true profits in only 3% of the space.
Eggs makes great use of its space, generating 11% of Dairy’s true profits.
Eggs SKUs are extremely productive, with a very low percentage of SKUs losing the retailer money.
The category has exceptional turns, and provides a great profit return on investment- significantly higher than other Dairy categories.
20

Appendix

TitleDepartment Highlights
Copyright © 2013. All Rights Reserved.
0
10,000
20,000
30,000
40,000
50,000
60,000
70,000
80,000
90,000
$0
$50,000
$100,000
$150,000
$200,000
$250,000
Grocery GM Produce Dairy Frozen Liquor Meat Deliand FS
HBC Pkgd.Deli
Bakery Floral Seafood
Wee
kly
Mov
emen
t
$ Pe
r Sto
re P
er W
eek
Weekly Sales Adjusted Gross Profit Weekly Movement
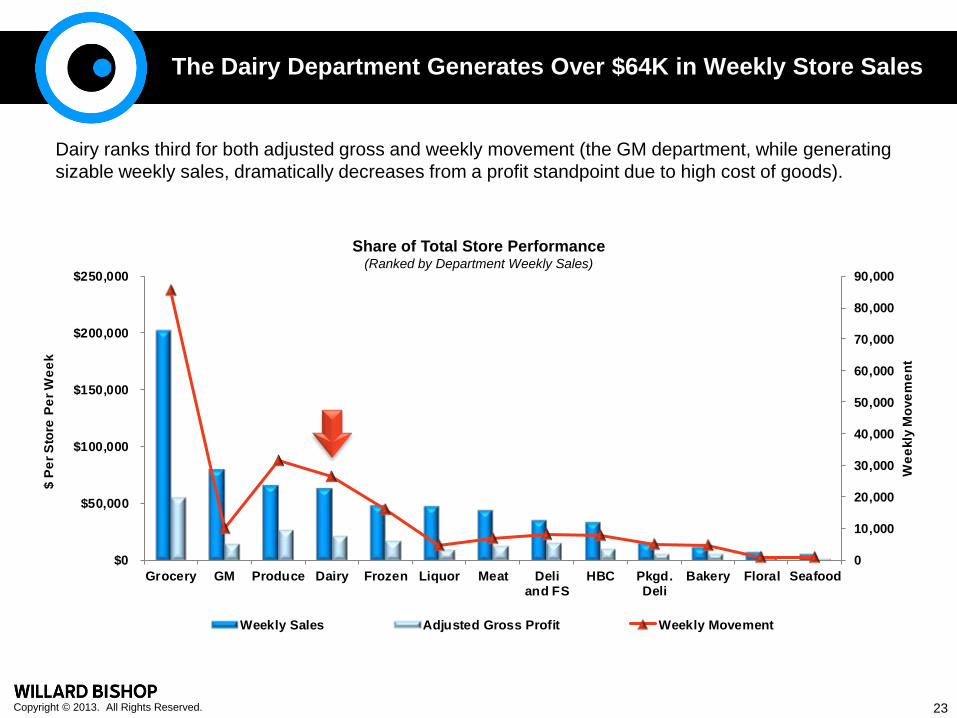
The Dairy Department Generates Over $64K in Weekly Store Sales
Dairy ranks third for both adjusted gross and weekly movement (the GM department, while generating sizable weekly sales, dramatically decreases from a profit standpoint due to high cost of goods).
Share of Total Store Performance(Ranked by Department Weekly Sales)
23
Copyright © 2013. All Rights Reserved.
3%
10%11%
Share ofSquareFoot ofFacing
Share ofWeeklySales
Share ofAdjusted
GrossProfit
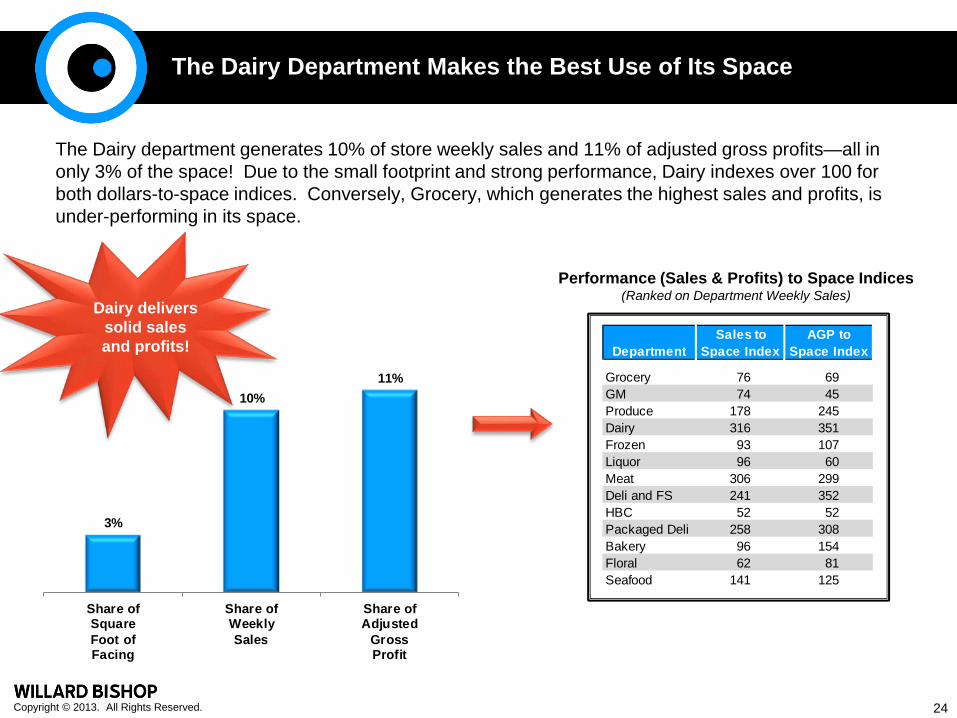
The Dairy Department Makes the Best Use of Its Space
The Dairy department generates 10% of store weekly sales and 11% of adjusted gross profits—all in only 3% of the space! Due to the small footprint and strong performance, Dairy indexes over 100 for both dollars-to-space indices. Conversely, Grocery, which generates the highest sales and profits, is under-performing in its space.
Performance (Sales & Profits) to Space Indices(Ranked on Department Weekly Sales)
Dairy delivers solid sales and profits! Department
Sales to Space Index
AGP to Space Index
Grocery 76 69 GM 74 45 Produce 178 245 Dairy 316 351 Frozen 93 107 Liquor 96 60 Meat 306 299 Deli and FS 241 352 HBC 52 52 Packaged Deli 258 308 Bakery 96 154 Floral 62 81 Seafood 141 125
24
Copyright © 2013. All Rights Reserved.
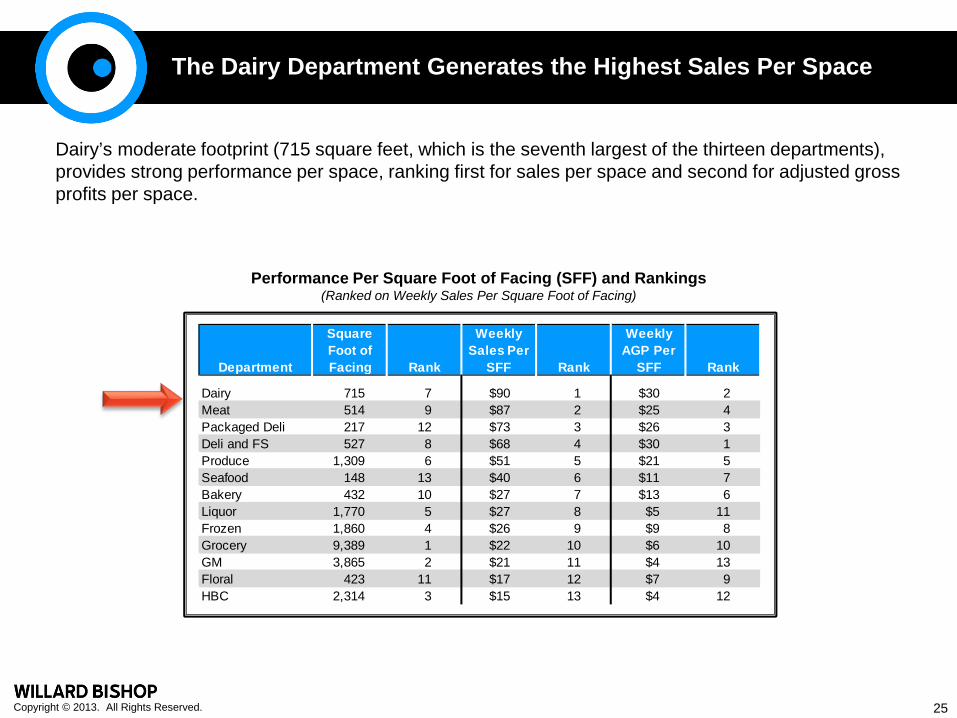
The Dairy Department Generates the Highest Sales Per Space
Dairy’s moderate footprint (715 square feet, which is the seventh largest of the thirteen departments), provides strong performance per space, ranking first for sales per space and second for adjusted gross profits per space.
Performance Per Square Foot of Facing (SFF) and Rankings(Ranked on Weekly Sales Per Square Foot of Facing)
Department
Square Foot of Facing Rank
Weekly Sales Per
SFF Rank
Weekly AGP Per
SFF Rank
Dairy 715 7 $90 1 $30 2 Meat 514 9 $87 2 $25 4 Packaged Deli 217 12 $73 3 $26 3 Deli and FS 527 8 $68 4 $30 1 Produce 1,309 6 $51 5 $21 5 Seafood 148 13 $40 6 $11 7 Bakery 432 10 $27 7 $13 6 Liquor 1,770 5 $27 8 $5 11 Frozen 1,860 4 $26 9 $9 8 Grocery 9,389 1 $22 10 $6 10 GM 3,865 2 $21 11 $4 13 Floral 423 11 $17 12 $7 9 HBC 2,314 3 $15 13 $4 12
25

TitleDairy Highlights
Copyright © 2013. All Rights Reserved.
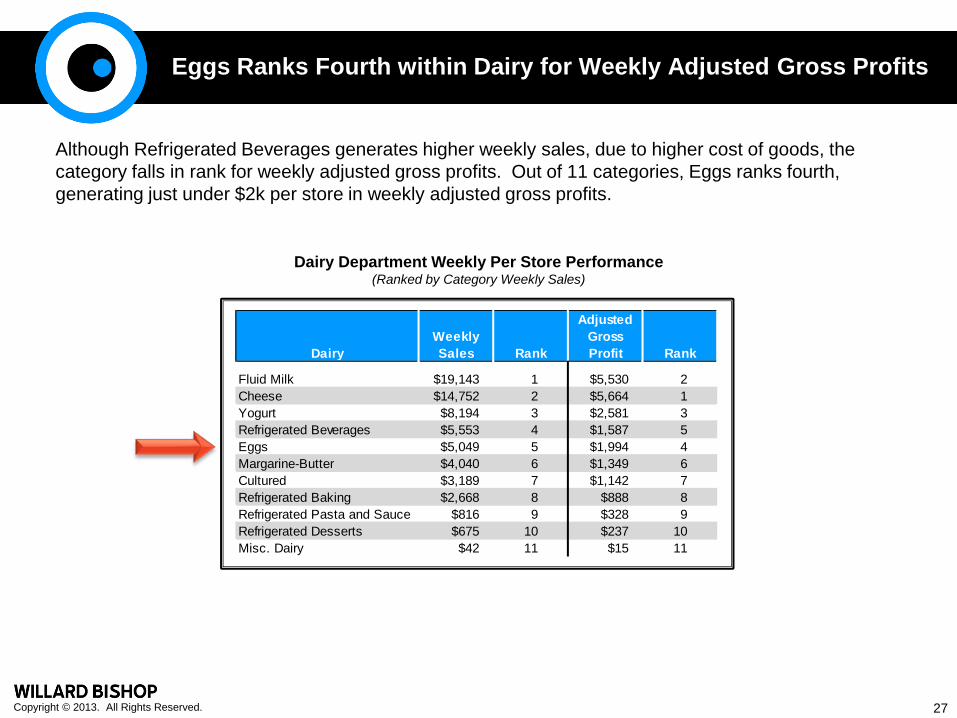
Eggs Ranks Fourth within Dairy for Weekly Adjusted Gross Profits
Although Refrigerated Beverages generates higher weekly sales, due to higher cost of goods, the category falls in rank for weekly adjusted gross profits. Out of 11 categories, Eggs ranks fourth, generating just under $2k per store in weekly adjusted gross profits.
Dairy Department Weekly Per Store Performance(Ranked by Category Weekly Sales)
DairyWeekly Sales Rank
Adjusted Gross Profit Rank
Fluid Milk $19,143 1 $5,530 2 Cheese $14,752 2 $5,664 1 Yogurt $8,194 3 $2,581 3 Refrigerated Beverages $5,553 4 $1,587 5 Eggs $5,049 5 $1,994 4 Margarine-Butter $4,040 6 $1,349 6 Cultured $3,189 7 $1,142 7 Refrigerated Baking $2,668 8 $888 8 Refrigerated Pasta and Sauce $816 9 $328 9 Refrigerated Desserts $675 10 $237 10 Misc. Dairy $42 11 $15 11
27
Copyright © 2013. All Rights Reserved.
7% 8%
9%
Share ofSquareFoot ofFacing
Share ofWeeklySales
Share ofAdjusted
GrossProfit
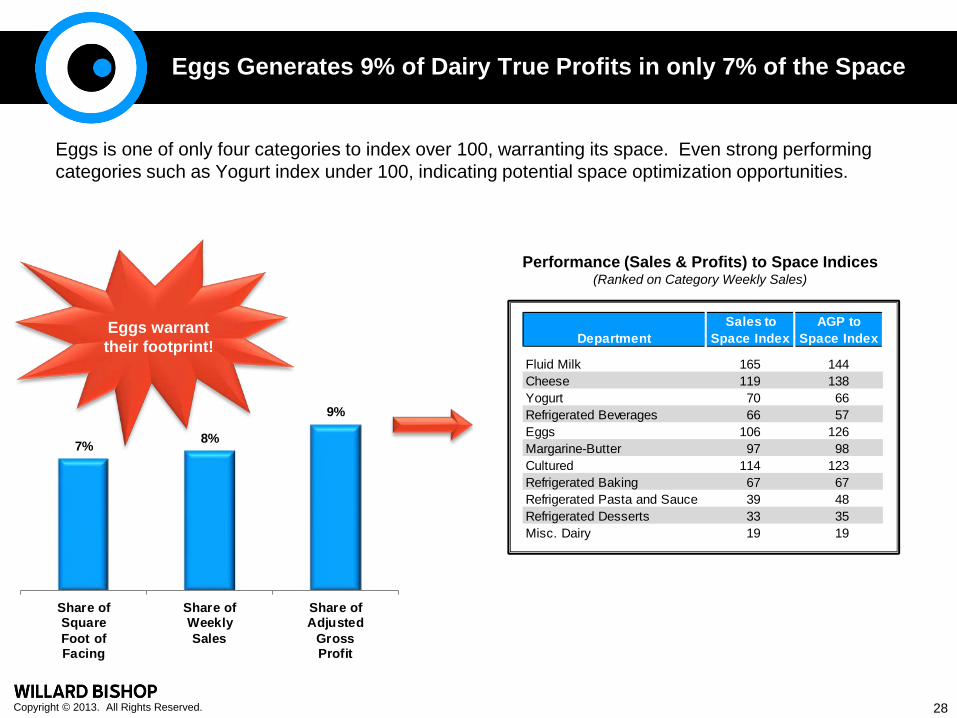
Eggs Generates 9% of Dairy True Profits in only 7% of the Space
Eggs is one of only four categories to index over 100, warranting its space. Even strong performing categories such as Yogurt index under 100, indicating potential space optimization opportunities.
Performance (Sales & Profits) to Space Indices(Ranked on Category Weekly Sales)
Eggs warrant their footprint! Department
Sales to Space Index
AGP to Space Index
Fluid Milk 165 144 Cheese 119 138 Yogurt 70 66 Refrigerated Beverages 66 57 Eggs 106 126 Margarine-Butter 97 98 Cultured 114 123 Refrigerated Baking 67 67 Refrigerated Pasta and Sauce 39 48 Refrigerated Desserts 33 35 Misc. Dairy 19 19
28
Copyright © 2013. All Rights Reserved.
0
20
40
60
80
100
120
140
160
$0
$20
$40
$60
$80
$100
$120
$140
$160
FluidMilk
Cheese Yogurt Refrig.Bev.
Eggs Marg.-Butter
Cultured Refrig.Baking
Refrig.Pasta and
Sauce
Refrig.Desserts
Misc.Dairy
Tota
l Squ
are
Foot
of F
acin
g
$ Pe
r Squ
are
Foot
of F
acin
g
Weekly Salesper SFF Weekly AGP per SFF Square Foot Facing
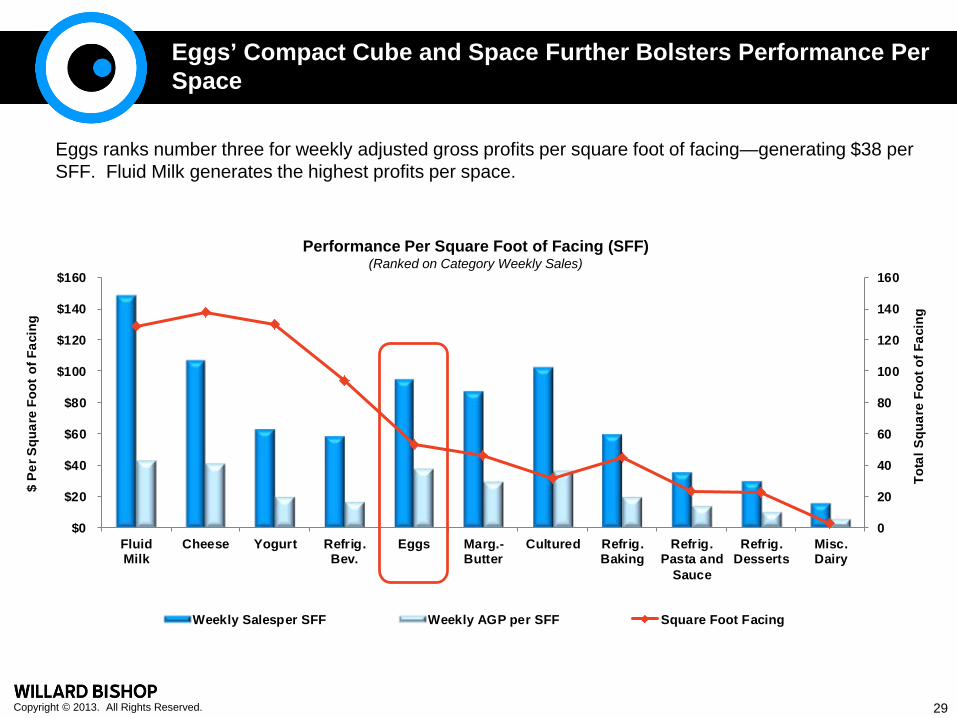
Eggs’ Compact Cube and Space Further Bolsters Performance Per Space
Eggs ranks number three for weekly adjusted gross profits per square foot of facing—generating $38 per SFF. Fluid Milk generates the highest profits per space.
Performance Per Square Foot of Facing (SFF)(Ranked on Category Weekly Sales)
29
Copyright © 2013. All Rights Reserved.
29%38%
32% 29%
39%33% 36% 33%
40%35% 36%
FluidMilk
Cheese Yogurt Refrig.Bev.
Eggs Marg.-Butter
Cultured Refrig.Baking
Refrig.Pasta and
Sauce
Refrig.Desserts
Misc.Dairy
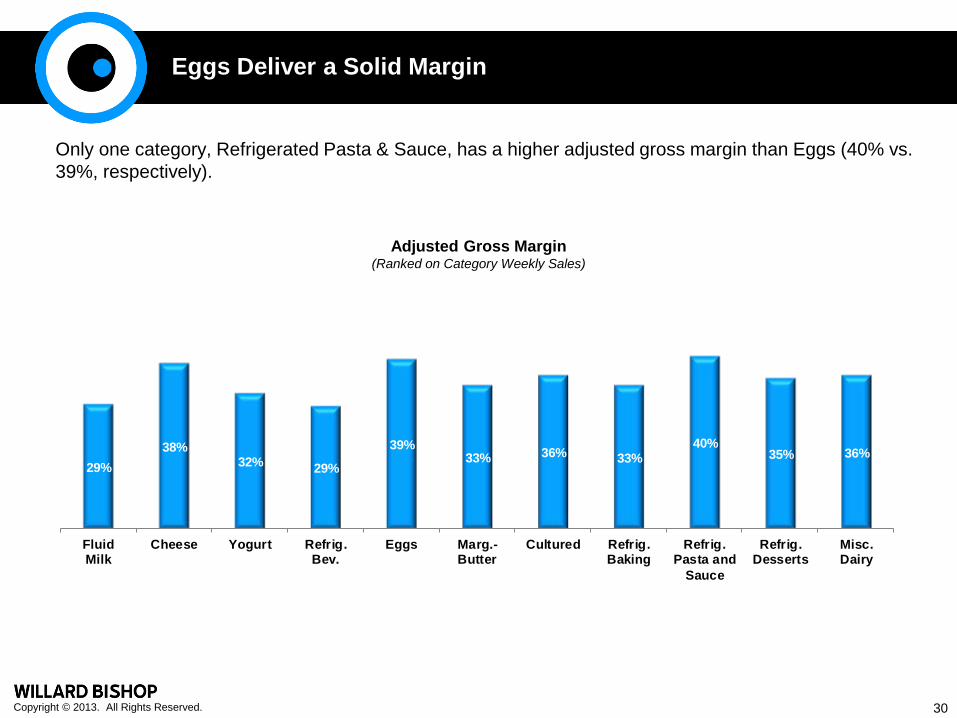
Eggs Deliver a Solid Margin
Only one category, Refrigerated Pasta & Sauce, has a higher adjusted gross margin than Eggs (40% vs. 39%, respectively).
Adjusted Gross Margin(Ranked on Category Weekly Sales)
30
Copyright © 2013. All Rights Reserved.
$1.75 $1.56
$0.59
$1.59 $1.17
$1.55 $1.21 $1.04
$1.94 $1.20
$0.60
$2.08 $1.88
$0.86
$2.09
$1.45
$1.89
$1.51 $1.43
$2.69
$1.95
$1.70
FluidMilk
Cheese Yogurt Refrig.Bev.
Eggs Marg.-Butter
Cultured Refrig.Baking
Refrig.Pasta and
Sauce
Refrig.Desserts
Misc.Dairy
Unit AGP Unit Cost
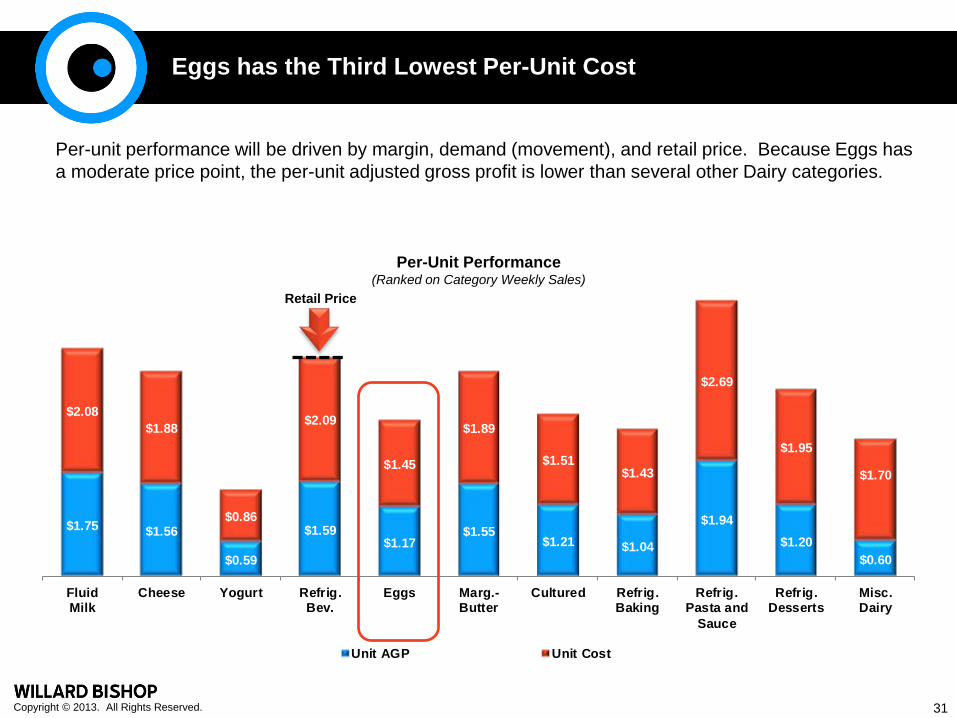
Eggs has the Third Lowest Per-Unit Cost
Per-unit performance will be driven by margin, demand (movement), and retail price. Because Eggs has a moderate price point, the per-unit adjusted gross profit is lower than several other Dairy categories.
Per-Unit Performance(Ranked on Category Weekly Sales)
Retail Price
31
Copyright © 2013. All Rights Reserved.
FluidMilk Cheese Yogurt Refrig.
Bev. Eggs Marg.-Butter Cultured Refrig.
Baking
Refrig.Pastaand
Sauce
Refrig.Desserts
Misc.Dairy
Weekly Sales $ Per SKU $55 $37 $17 $28 $117 $44 $40 $19 $18 $13 $4Weekly AGP $ Per SKU $16 $14 $5 $8 $46 $15 $14 $6 $7 $4 $1
$0
$20
$40
$60
$80
$100
$120
$140
Wee
kly
$ Pe
r SKU
Eggs has Extremely Efficient and Productive SKUs
Eggs generates more than double the sales and adjusted gross profits per SKU than the next closest category (Fluid Milk).
Per SKU Performance(Ranked on Category Weekly Sales)
32

Copyright © 2013. All Rights Reserved.
Eggs has Exceptional Turns, Turning Almost Two Times Per Week
Eggs inventory turns even more frequently than Fluid Milk, which is typically the number one trip driver with the Dairy department.
Average Days-of-Supply and Turns(Ranked on Category Weekly Sales)
FluidMilk Cheese Yogurt Refrig.
Bev. Eggs Marg.-Butter Cultured Refrig.
BakingRefrig.
Pasta andSauce
Refrig.Desserts
Misc.Dairy
Average Days-of-Supply 4 13 8 9 4 13 9 16 21 19 50Average Turns 82 28 46 40 103 28 42 22 17 20 7
0
20
40
60
80
100
120
0
10
20
30
40
50
60
Aver
age
Turn
s
Aver
age
Days
-of-S
uppl
y
33
Copyright © 2013. All Rights Reserved.
$42
$18 $20 $20
$71
$16
$28
$12 $14 $11 $5
$0
$2,000
$4,000
$6,000
$8,000
$10,000
$12,000
$14,000
$16,000
$18,000
$0
$10
$20
$30
$40
$50
$60
$70
$80
FluidMilk
Cheese Yogurt Refrig.Bev.
Eggs Marg.-Butter
Cultured Refrig.Baking
Refrig.Pasta and
Sauce
Refrig.Desserts
Misc.Dairy
Annu
al S
helf
Inve
ntor
y Co
st
Prof
it Re
turn
- on-
Inve
ntor
y -In
vest
men
t
Average AGMROII Annual Shelf Inventory Cost
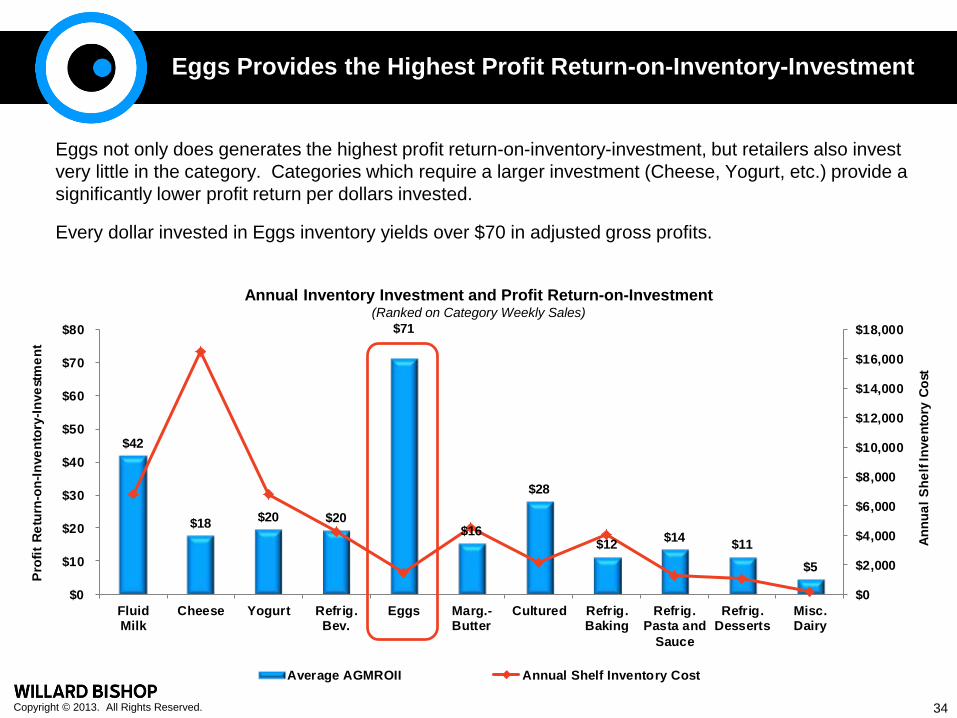
Eggs Provides the Highest Profit Return-on-Inventory-Investment
Eggs not only does generates the highest profit return-on-inventory-investment, but retailers also invest very little in the category. Categories which require a larger investment (Cheese, Yogurt, etc.) provide a significantly lower profit return per dollars invested.
Every dollar invested in Eggs inventory yields over $70 in adjusted gross profits.
Annual Inventory Investment and Profit Return-on-Investment(Ranked on Category Weekly Sales)
34

TitleSummary Highlights
Copyright © 2013. All Rights Reserved.
Summary Highlights
The Dairy department ranks third (out of 13) for total store profits, generating 11% of adjusted gross profits in only 3% of the space.
Eggs makes great use of its space, generating 9% of Dairy’s adjusted gross profits in only 7% of the space.
Eggs SKUs are extremely productive, generating more than double the sales and profits per SKU as the next closest category.
The category has exceptional turns, and provides the highest adjusted gross profit return on investment- significantly higher than other Dairy categories.
36

840 South Northwest Highway Barrington, IL 60010Phone: 847.381.4443 Fax: 847.381.3588
www.willardbishop.com