Wilks, M., Ayele, A., Kendall, J-M., & Wookey, J. (2017 ... · 33 collapse of the Hawassa caldera...
20
Wilks, M., Ayele, A., Kendall, J-M., & Wookey, J. (2017). The 24th January 2016 Hawassa earthquake: implications for seismic hazard in the Main Ethiopian Rift. Journal of African Earth Sciences, 125, 118-125. DOI: 10.1016/j.jafrearsci.2016.11.007 Peer reviewed version Link to published version (if available): 10.1016/j.jafrearsci.2016.11.007 Link to publication record in Explore Bristol Research PDF-document This is the author accepted manuscript (AAM). The final published version (version of record) is available online via Elsevier at http://www.sciencedirect.com/science/article/pii/S1464343X16303569. Please refer to any applicable terms of use of the publisher. University of Bristol - Explore Bristol Research General rights This document is made available in accordance with publisher policies. Please cite only the published version using the reference above. Full terms of use are available: http://www.bristol.ac.uk/pure/about/ebr-terms
Transcript of Wilks, M., Ayele, A., Kendall, J-M., & Wookey, J. (2017 ... · 33 collapse of the Hawassa caldera...

Wilks, M., Ayele, A., Kendall, J-M., & Wookey, J. (2017). The 24th January2016 Hawassa earthquake: implications for seismic hazard in the MainEthiopian Rift. Journal of African Earth Sciences, 125, 118-125. DOI:10.1016/j.jafrearsci.2016.11.007
Peer reviewed version
Link to published version (if available):10.1016/j.jafrearsci.2016.11.007
Link to publication record in Explore Bristol ResearchPDF-document
This is the author accepted manuscript (AAM). The final published version (version of record) is available onlinevia Elsevier at http://www.sciencedirect.com/science/article/pii/S1464343X16303569. Please refer to anyapplicable terms of use of the publisher.
University of Bristol - Explore Bristol ResearchGeneral rights
This document is made available in accordance with publisher policies. Please cite only the publishedversion using the reference above. Full terms of use are available:http://www.bristol.ac.uk/pure/about/ebr-terms

Title: 1 The 24th January 2016 Hawassa Earthquake: Implications for Seismic Hazard in the Main 2 Ethiopian Rift. 3
4 Authors: 5
Matthew Wilksa, Atalay Ayeleb, J-Michael Kendalla & James Wookeya. 6 7 8 Affiliations: 9 a. School of Earth Sciences, University of Bristol, Wills Memorial Building, Queens Road, 10 Bristol, UK. BS8 1RJ. 11 b. Institute of Geophysics, Space Science, and Astronomy, Addis Ababa University, 12 Addis Ababa, Ethiopia. 13
14 Contact Details: 15 Matthew Wilks 16 Email: [email protected] 17 Tel: +44 (0) 117 954 5400 18 Fax: +44 (0)117 954 5420 19 Mob: +44 (0) 7817 25606820
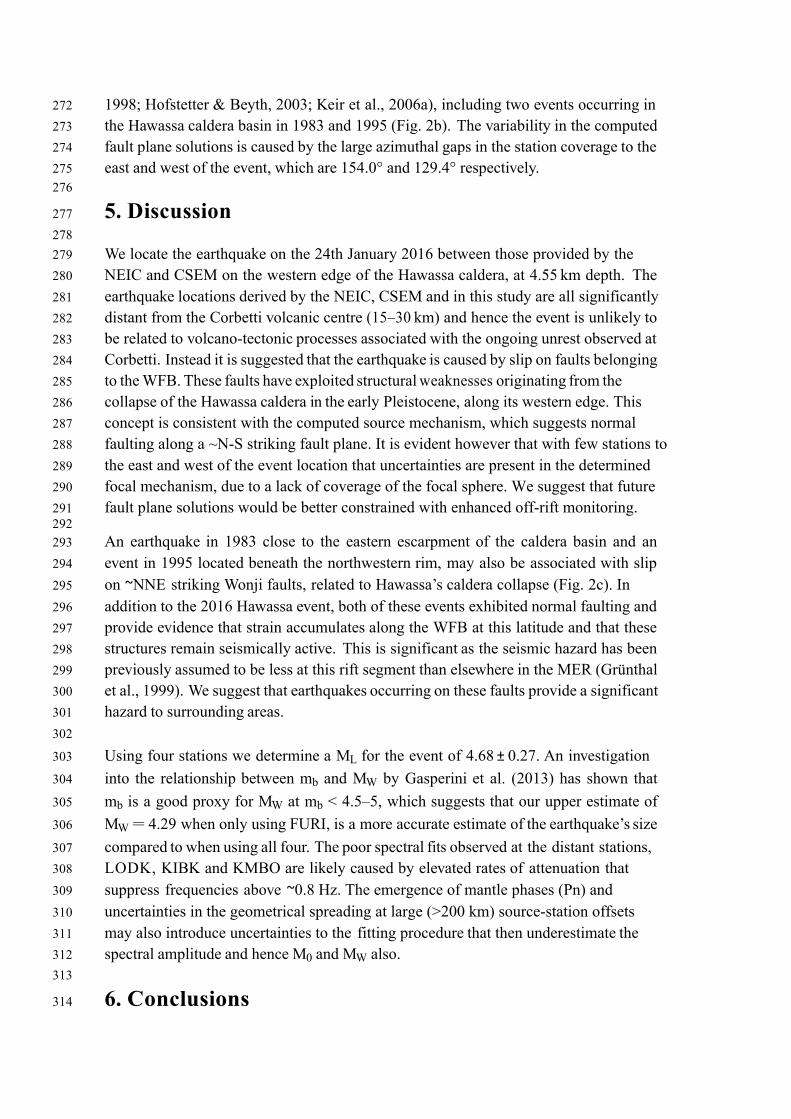
Abstract 21 22 Earthquakes of low to intermediate magnitudes are a commonly observed feature of 23 continental rifting and particularly in regions of Quaternary to Recent volcanism such as 24 in the Main Ethiopian Rift (MER). Although the seismic hazard is estimated to be 25 less in the Hawassa region of the MER than further north and south, a significant 26 earthquake occurred on the 24th January 2016 in the Hawassa caldera basin and close 27 to the Corbetti volcanic complex. The event was felt up to 100 km away and caused 28 structural damage and public anxiety in the city of Hawassa itself. In this paper we 29 first refine the earthquake’s location using data from global network and Ethiopian 30 network stations. The resulting location is at 7.0404°N, 38.3478°E and at 4.55 km 31 depth, which suggests that the event occurred on structures associated with the caldera 32 collapse of the Hawassa caldera in the early Pleistocene and not through volcano- 33 tectonic processes at Corbetti. We calculate local and moment magnitudes, which are 34 magnitude scales more appropriate at regional hypocentral distances than (mb) at four 35
stations. This is done using a local scale (attenuation term) previously determined for the 36 MER and spectral analysis for ML and MW respectively and gives magnitude estimates 37
of 4.68 and 4.29. The event indicates predominantly normal slip on a N-S striking 38 fault structure, which suggests that slip continues to occur on Wonji faults that have 39 exploited weaknesses inherited from the preceding caldera collapse. These results and 40 two previous earthquakes in the Hawassa caldera of M > 5 highlight that earthquakes 41 continue to pose a risk to structures within the caldera basin. With this in mind, it is 42 suggested that enhanced monitoring and public outreach should be considered. 43
44
Key Words: Main Ethiopian Rift, Seismic Hazard, Ethiopia, Seismicity and Tectonics, 45 Continental Tectonics, Earthquake Magnitudes.46

1. Introduction 47
48 The Main Ethiopian Rift (MER) is a magmatic rift that marks the axis of continental 49 extension between the Nubian and Somalian plates. It represents the portion of the 50 greater East African Rift System that traverses through Ethiopia and is characterised by 51 numerous magmatic segments and volcanic centres that have assisted in accommodating 52
extensional strain since ~2 Ma (Ebinger & Casey, 2001; Casey et al., 2006). Seismicity in 53
the MER is generally diffuse along the rift basin (Fig. 1), where earthquakes are 54 typically of small to intermediate magnitudes (M < 6). However, numerous examples 55 of structurally damaging events have been documented over the past century, such as: 56
57 • A M6.3 event close to Hawassa in 1960 that was felt 200 km away and produced 28 58
aftershocks (Gouin, 1979). 59 • A MW 5.3 earthquake on the eastern escarpment of the Hawassa basin in 1983 that 60
caused a rock slide and building collapse in Wendo Genet (Hofstetter & Beyth, 61
2003). 62 • A mb4.8 earthquake in 1985 that was strongly felt at Lake Langano, cracking 63
hotels and buildings around the resort (Asfaw, 1998). 64 • A pair of events (mb > 4.1) on consecutive days in 1993 in the northern CMER, 65
the second of which, caused damage in Nazret (Asfaw, 1998) 66 • A MW 5.0 event at Chabbi in 1995 (Hofstetter & Beyth, 2003). 67
68 Despite improved monitoring over the past decades however, seismic hazard remains 69 relatively poorly constrained (Midzi et al., 1999). 70
71 On the 24th January 2016 at 18:34:35.590 UTC (21:34 local time), an earthquake 72 occurred in the Hawassa region that was felt up to 100 km away, including the major 73 towns and cities of Hawassa (pop. 165 275, [2012]), Shashemene (pop. 122 046, [2012]) 74 and Dila (pop. 79 892, [2012]) (Fantahun, 2016). A series of further tremors were 75 also reported, causing minor structural damage in Hawassa as well as scattered power 76 outages. Although no injuries were reported as a direct consequence of the event, around 77 100 students at Hawassa University required treatment when a stampede ensued as they 78 tried to flee their dormitories. Some residents were apprehensive in returning to their 79 homes and chose to sleep outside in fear of building collapse. 80 81
The earthquake was recorded by both the National Earthquake Information Center 82 (NEIC) and the Centre Sismologique Euro-Mèditerranéen (CSEM), who both estimated a 83 body-wave magnitude (mb) of 4.4. The NEIC located the event beneath the city of 84
Hawassa at 7.088°N±8.8 km, 38.479°E±8.8 km and at a depth of 10±2.0 km below sea 85
level (National Earthquake Information Center [NEIC], 2016), while the CSEM located it 86
to the southwest of Corbetti, at 6.98°N±6.6 km, 38.19°E±13.7 km using a fixed depth of 87
10 km (International Seismological Centre, 2016) (Fig. 2b). 88
89

The MER is subdivided into three segments: the northern, central and southern MER, 90 which exhibit the progressively maturing stages of continental rifting from initial break- 91 up, from south-to-north (Mohr, 1967; Hayward & Ebinger, 1996; Ebinger, 2005). In the 92 early development of the MER, extensional strain was accommodated by long, widely- 93 spaced border faults that bounded the margins of the rift (Fig. 2b), showing general 94
trends of ~N030°E in the CMER and ~N-S in the SMER. 95
96
At ~2 Ma the style of deformation switched considerably in the CMER with the 97
boundary faults becoming relatively inactive (Wolfenden et al., 2004; Casey et al., 2006; 98 Keir et al., 2006a). Deformation became concentrated along relatively short (<20 km), 99 finely spaced (>2/km) faults towards the rift axis at the Wonji Fault Belt (WFB) 100 (Chorowicz et al., 1994; Boccaletti et al., 1998; Ebinger & Casey, 2001). These faults 101
trend obliquely to the border faults at ~N012°E and formed concurrently with a 102
focusing of volcanism towards the centre of the rift (Agostini et al., 2011). Around the 103 latitude of the 2016 event is the boundary between the CMER and SMER, where the 104 rift’s margins rotate from N020–035°E to N005–020°E and where magmatic processes 105 play a lesser role in accommodating extensional strain to the south (Bonini et al., 106 2005). 107
108 The Hawassa caldera basin is located in this region at the eastern escarpment of the rift, 109
forming a topographic depression of 35 ×20 km that is elongated ~E-W. The basin is 110
characterised by silicic lava flows, pumices and welded tuffs, which are dated at 111
1.85–1.1 Ma (WoldeGabriel et al., 1990). More recent volcanism has resulted in the 112 formation of the Corbetti volcanic centre at the northwestern edge of the Hawassa 113 caldera, where rhyolitic lava flows accumulated and initiated a caldera collapse event 114
at 175±20 ka (Hutchison, 2015). Satellite imaging has shown significant surface 115
deformation (<14 cm) at Corbetti over the past twenty years (Biggs et al., 2011), while 116
the volcano has also been outlined as a geothermal energy resource of vast potential 117 (Kebede, 2014). 118
119 In this paper we present this widely-felt, significant event as an example of the potential 120 seismic risk in the region surrounding the Hawassa caldera. The event received public 121 attention across Ethiopia, making it unusual as estimations of hazard are lower at this 122 latitude than elsewhere in the rift (Fig. 1). We therefore locate the earthquake ourselves 123 to refine the contrasting locations suggested by the NEIC and CSEM and determine local 124 (ML) and moment (MW ) magnitudes, which are magnitude scales more appropriate for 125
data recorded at regional distances than mb. We then compute a focal mechanism using 126
P-wave polarities to investigate the mode of faulting for the event. 127 128
2. Earthquake Location 129 130 To locate the earthquake, we manually pick P-arrivals on data recorded at seven stations 131 belonging to the GSN (FURI, KMBO, MBAR, RAYN and UOSS) and GEOFON 132

(LODK and KIBK) (Fig. 2a). These traveltime picks are supplemented by P- and S- 133 wave picks from 5 stations from the Ethiopian Seismic Network (EH) at DESE, ANKE, 134 AAE, WERA and DILA. With large hypocentral offsets of up to 24.95° between the 135 source location and furthest receivers, we calculate P- and S-wave arrival times using the 136 ak135 global model (Kennett et al., 1995) and perform the location in NONLINLOC’s 137
‘global mode’ (Lomax et al., 2000). In this approach, the optimal hypocentre is searched 138 for in a spherical Earth that spans the uppermost 50 km of the crust and the upper mantle 139 (Lomax et al., 2009). 140
141 The resulting best-fit location is at 7.0404°, 38.3478°, which is in between those 142 reported by the NEIC and CSEM (Fig. 2b). This places the event on the western rim of 143 the Hawassa caldera and may be indicative of faulting associated with structures that 144 formed during caldera collapse (WoldeGabriel et al., 1990). In depth, the earthquake 145 appears shallower than the reported locations of 10.0 km at 4.55 km. The one standard 146 deviation uncertainty ellipsoid corresponds to uncertainties of 1.79, 8.10 and 3.4 km in 147 latitude, longitude and depth respectively (2.70, 12.19 and 5.12 km to 95% confidence). 148 The relatively poorer location constraints in longitude can be ascribed to the lack of 149 recording stations to the east and west of the event. 150
151
3. Magnitudes 152
153
Body-wave magnitude is a commonly used empirical magnitude scale used for 154 teleseismic earthquakes (Gutenberg & Richter, 1956). It is calculated using the 155 maximum amplitude of the P-wave, when recorded on a short period seismograph, and a 156 correcting term for attenuation. Estimates of mb were provided by the NEIC and CSEM 157
of 4.4 for the Hawassa event. However, at epicentral distances less than 10–15° the 158 correction function is highly variable with distance and depth due to the heterogeneity of 159 the crust and upper mantle (Bormann et al., 2013). Consequently, it is recommended that 160 only epicentral distances greater than 20° should be considered when calculating mb. 161
We therefore derive local and moment magnitudes using four stations (FURI, LODK, 162 KIBK and KMBO) with epicentral distances of 198–1050 km (1.78–9.43°), where picks 163 for both P- and S-wave arrivals are possible. 164
165
3.1. Local Magnitude 166 167 For local magnitude we use the attenuation term defined for the Main Ethiopian Rift by 168 Keir et al. (2006b). Surface wave energy is suppressed automatically by the convolution 169 of the instrument response to a Wood-Anderson seismograph, which acts as a high-pass 170 filter above 2 Hz (Havskov & Ottemoller, 2010). We measure the maximum peak-to- 171 peak amplitude displacements on each horizontal component (Fig. 3) and halve them 172 to estimate the zero-to-peak amplitudes (𝐴#$). We then evaluate: 𝑀' = log 𝐴#$ +173
1.196997 log(𝑟 17) + 0.001066 𝑟 − 17 + 2.0, where 𝑟 is the hypocentral distance in 174 km, and average across the two values at each station. This computes magnitudes of 175 4.68, 4.31, 4.88 and 4.85 for stations FURI, LODK, KMBO and KIBK respectively 176

(Table 1). The variability in these values may reflect our inability to apply station 177 corrections to this single event but from these values we calculate the mean and 178
determine an overall ML estimate of 4.68 ±0.27. The uncertainty is the standard deviation 179
of the magnitudes determined on each component of each station. 180
181
Station Distance
(km)
Comp
ML M L
FURI
198 N 4.74
4.68 E 4.62
LODK
531 N 4.28
4.31 E 4.32
KMBO
922 N 4.85
4.88 E 4.90
KIBK
1050 N 5.06
4.85 E 4.65 4.68 ±0.27
182 Table 1: ML results for the Hawassa earthquake using the Keir et al. (2006b) 183 attenuation term for the MER at four stations. 184
185
3.2. Moment Magnitude 186
187
Spectral analysis is performed to determine MW by first convolving the raw 188
seismograms to displacement using the appropriate poles and zeros. We compute the 189 frequency spectra of seismograms rotated to the ray-frame for P-, SV- and SH-wave 190 arrivals and the background noise prior to the onset of the P-wave in each case. We 191 then subtract the noise spectra from the spectra of the seismic arrivals and fit the 192 resulting spectra with a Brune source model (Brune, 1970) in a least- squares sense. In 193 this method the spectral amplitude of the low frequency signal (Ω7), corner frequency 194
(𝑓9) and seismic quality factor (𝑄) are solved for simultaneously and we adjust the 195 frequency band at which the spectra is fitted (aiming to keep it as wide as possible) to 196 achieve the best estimate of the source parameters. Where convergence is achieved in 197 all three parameters, the seismic moment (M0) is determined via: 198
199 200
𝑀7 =4𝜋𝜌𝜈?Ω7
𝑅×𝐹×𝐺 Δ, ℎ , 201
202
where ρ and v are the densities (2790 kg/m3) and seismic wave velocities (5.99 km/s for 203
P-waves and 3.53 km/s for S-waves) at the source respectively. R and F are constants 204 pertaining to the radiation pattern and free surface effects as derived by Aki & Richards 205 (2002), where values for the R coefficients are calculated for P- and SV- and SH- 206 waves subject to the focal mechanism computed in the following and F is set equal to 207 2.0. For P-waves we use the geometrical spreading relationship: 𝐺 Δ, ℎ = 1 𝑟 208

where (Δ) is epicentral distance and ℎ is focal depth and for S-waves we assume: 209
𝐺 Δ, ℎ = 1 ΔΔ7, where Δ7 is a reference distance that assumes surface wave 210
dispersion at large hypocentral distances (Havskov & Ottemoller, 2010). This is set to 211 100 km after Herrmann & Kijko (1983). The moment magnitude MW is then calculated 212
via the expression: M# = I?log 𝑀7 − 6.07. 213
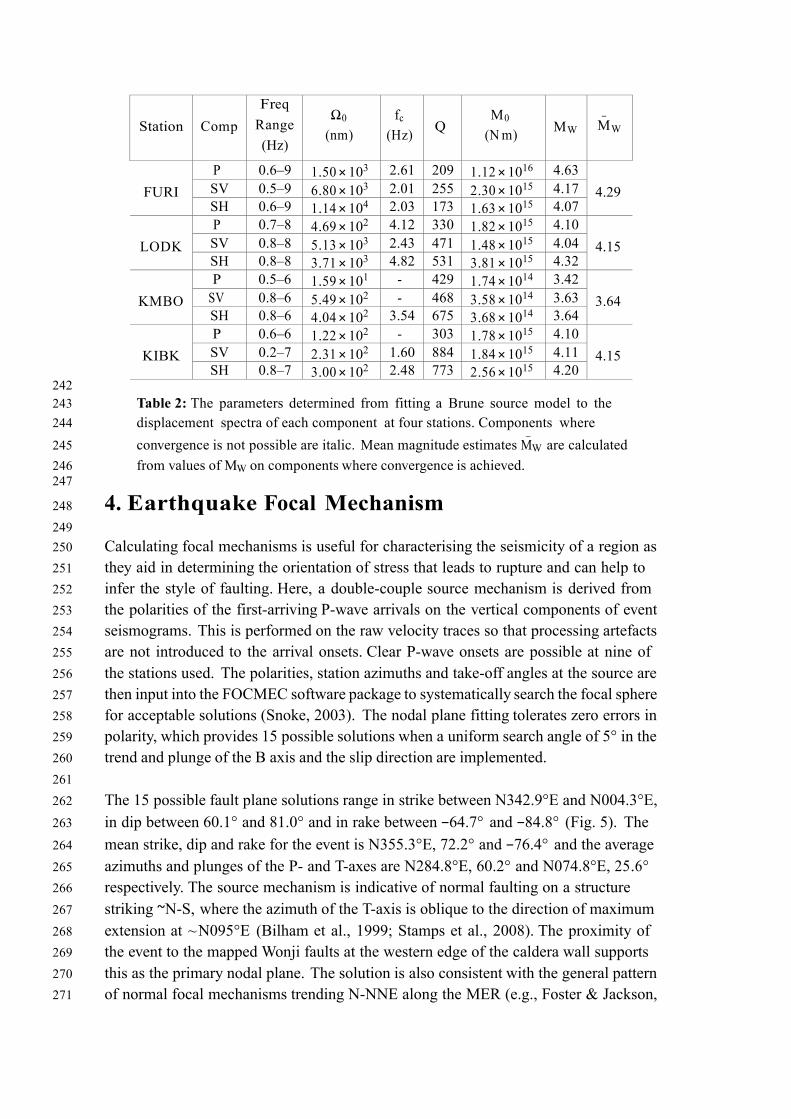
214 The spectral fitting on each component of the four stations and the output parameters 215 in each case are presented in Fig. 4 and Table 2 respectively. At FURI, the spectra are 216 fit accurately at frequencies greater than 0.6 Hz on all components and the observed 217 spectral levels are well constrained. The determined values of Ω7, 𝑓9 and 𝑄 correspond 218 to magnitudes ranging between 4.07 and 4.63 that produces an overall estimate of 4.29 219 for the station. Good fits are also achieved at LODK at frequencies greater than 0.8 Hz, 220 although the signal to noise ratio is noticeably higher in the P-wave spectra. The 221 parameters produce a magnitude estimate of 4.15. 222
223 At KMBO, the signal to noise ratio is reduced below 0.8 Hz and above 6 Hz, which 224 hinders the spectral fitting below and above these frequencies. Between these 225 frequencies, convergence in corner frequency is not possible in the P- and SV-wave 226 spectra and these results are omitted. The SH-spectra produces a magnitude estimate of 227 3.64 although the spectral amplitudes below 0.5 Hz appear greater than that determined 228 in the Ω7 fitting. A high noise level above 6 Hz is also evident at KIBK that in the P-229 wave spectra produces a particularly poor fit. The corner frequency fails to converge as a 230 consequence and the component is excluded. Good fits are achieved in the SV- and 231
SH-wave spectra however, which define a magnitude of 4.15 at the station. 232 233 Taking the values from each component where the source model is constrained produces 234
an overall averaged estimate of the seismic moment equal to 3.00 ×10¹⁵ N m and a 235
magnitude of 4.14 ±0.26. However, the greater epicentral distances of 531, 933 and 1050 236
km at LODK, KMBO and KIBK and the relatively poor spectral fits to those at FURI, 237 imply that the derived spectral amplitudes may be underestimated at these stations. We 238 therefore suggest that only the value from FURI should be considered in determining 239
MW . In this case the revised M0 release of the event is 5.04 ×10¹⁵ N m and MW is equal 240
to 4.29 ±0.30. 241
Station
Comp Freq
Range (Hz)
Ω0
(nm)
fc
(Hz)
Q
M0
(N m)
MW
M W
FURI
P 0.6–9 1.50 ×10³ 2.61 209 1.12 ×10¹⁶ 4.63 4.29 SV 0.5–9 6.80 ×10³ 2.01 255 2.30 ×10¹⁵ 4.17
SH 0.6–9 1.14 ×10⁴ 2.03 173 1.63 ×10¹⁵ 4.07
LODK P 0.7–8 4.69 ×10² 4.12 330 1.82 ×10¹⁵ 4.10
4.15 SV 0.8–8 5.13 ×10³ 2.43 471 1.48 ×10¹⁵ 4.04 SH 0.8–8 3.71 ×10³ 4.82 531 3.81 ×10¹⁵ 4.32
KMBO
P 0.5–6 1.59 ×101 - 429 1.74 ×10¹⁴ 3.42 3.64 SV 0.8–6 5.49 ×10² - 468 3.58 ×10¹⁴ 3.63
SH 0.8–6 4.04 ×10² 3.54 675 3.68 ×10¹⁴ 3.64
KIBK P 0.6–6 1.22 ×10² - 303 1.78 ×10¹⁵ 4.10
4.15 SV 0.2–7 2.31 ×10² 1.60 884 1.84 ×10¹⁵ 4.11 SH 0.8–7 3.00 ×10² 2.48 773 2.56 ×10¹⁵ 4.20
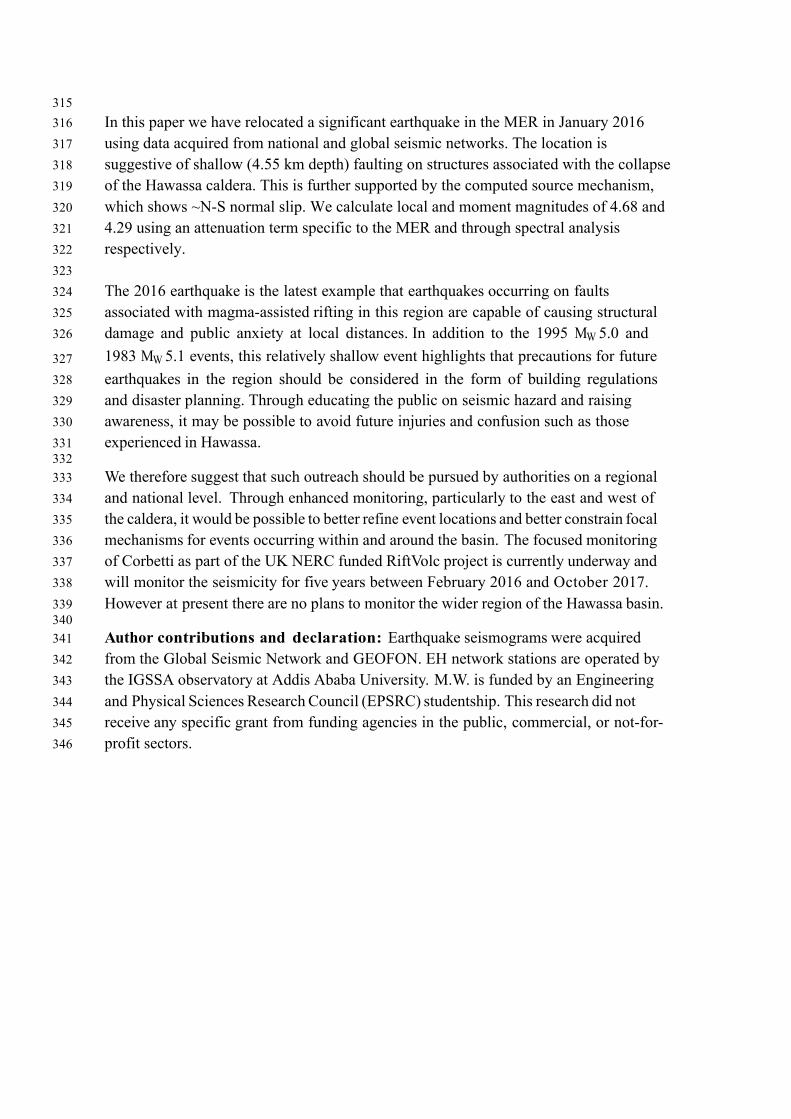
242 Table 2: The parameters determined from fitting a Brune source model to the 243 displacement spectra of each component at four stations. Components where 244
convergence is not possible are italic. Mean magnitude estimates M W are calculated 245 from values of MW on components where convergence is achieved. 246
247
4. Earthquake Focal Mechanism 248 249 Calculating focal mechanisms is useful for characterising the seismicity of a region as 250 they aid in determining the orientation of stress that leads to rupture and can help to 251 infer the style of faulting. Here, a double-couple source mechanism is derived from 252 the polarities of the first-arriving P-wave arrivals on the vertical components of event 253 seismograms. This is performed on the raw velocity traces so that processing artefacts 254 are not introduced to the arrival onsets. Clear P-wave onsets are possible at nine of 255 the stations used. The polarities, station azimuths and take-off angles at the source are 256 then input into the FOCMEC software package to systematically search the focal sphere 257 for acceptable solutions (Snoke, 2003). The nodal plane fitting tolerates zero errors in 258 polarity, which provides 15 possible solutions when a uniform search angle of 5° in the 259 trend and plunge of the B axis and the slip direction are implemented. 260 261 The 15 possible fault plane solutions range in strike between N342.9°E and N004.3°E, 262
in dip between 60.1° and 81.0° and in rake between −64.7° and −84.8° (Fig. 5). The 263
mean strike, dip and rake for the event is N355.3°E, 72.2° and −76.4° and the average 264
azimuths and plunges of the P- and T-axes are N284.8°E, 60.2° and N074.8°E, 25.6° 265 respectively. The source mechanism is indicative of normal faulting on a structure 266
striking ~N-S, where the azimuth of the T-axis is oblique to the direction of maximum 267
extension at ~N095°E (Bilham et al., 1999; Stamps et al., 2008). The proximity of 268 the event to the mapped Wonji faults at the western edge of the caldera wall supports 269 this as the primary nodal plane. The solution is also consistent with the general pattern 270 of normal focal mechanisms trending N-NNE along the MER (e.g., Foster & Jackson, 271
1998; Hofstetter & Beyth, 2003; Keir et al., 2006a), including two events occurring in 272 the Hawassa caldera basin in 1983 and 1995 (Fig. 2b). The variability in the computed 273 fault plane solutions is caused by the large azimuthal gaps in the station coverage to the 274 east and west of the event, which are 154.0° and 129.4° respectively. 275
276
5. Discussion 277 278 We locate the earthquake on the 24th January 2016 between those provided by the 279 NEIC and CSEM on the western edge of the Hawassa caldera, at 4.55 km depth. The 280 earthquake locations derived by the NEIC, CSEM and in this study are all significantly 281 distant from the Corbetti volcanic centre (15–30 km) and hence the event is unlikely to 282 be related to volcano-tectonic processes associated with the ongoing unrest observed at 283 Corbetti. Instead it is suggested that the earthquake is caused by slip on faults belonging 284 to the WFB. These faults have exploited structural weaknesses originating from the 285 collapse of the Hawassa caldera in the early Pleistocene, along its western edge. This 286 concept is consistent with the computed source mechanism, which suggests normal 287 faulting along a ~N-S striking fault plane. It is evident however that with few stations to 288 the east and west of the event location that uncertainties are present in the determined 289 focal mechanism, due to a lack of coverage of the focal sphere. We suggest that future 290 fault plane solutions would be better constrained with enhanced off-rift monitoring. 291
292 An earthquake in 1983 close to the eastern escarpment of the caldera basin and an 293 event in 1995 located beneath the northwestern rim, may also be associated with slip 294
on ~NNE striking Wonji faults, related to Hawassa’s caldera collapse (Fig. 2c). In 295
addition to the 2016 Hawassa event, both of these events exhibited normal faulting and 296 provide evidence that strain accumulates along the WFB at this latitude and that these 297 structures remain seismically active. This is significant as the seismic hazard has been 298 previously assumed to be less at this rift segment than elsewhere in the MER (Grünthal 299 et al., 1999). We suggest that earthquakes occurring on these faults provide a significant 300 hazard to surrounding areas. 301 302
Using four stations we determine a ML for the event of 4.68 ±0.27. An investigation 303
into the relationship between mb and MW by Gasperini et al. (2013) has shown that 304
mb is a good proxy for MW at mb < 4.5–5, which suggests that our upper estimate of 305
MW = 4.29 when only using FURI, is a more accurate estimate of the earthquake’s size 306
compared to when using all four. The poor spectral fits observed at the distant stations, 307 LODK, KIBK and KMBO are likely caused by elevated rates of attenuation that 308
suppress frequencies above ~0.8 Hz. The emergence of mantle phases (Pn) and 309
uncertainties in the geometrical spreading at large (>200 km) source-station offsets 310 may also introduce uncertainties to the fitting procedure that then underestimate the 311 spectral amplitude and hence M0 and MW also. 312
313
6. Conclusions 314
315 In this paper we have relocated a significant earthquake in the MER in January 2016 316 using data acquired from national and global seismic networks. The location is 317 suggestive of shallow (4.55 km depth) faulting on structures associated with the collapse 318 of the Hawassa caldera. This is further supported by the computed source mechanism, 319 which shows ~N-S normal slip. We calculate local and moment magnitudes of 4.68 and 320 4.29 using an attenuation term specific to the MER and through spectral analysis 321 respectively. 322 323 The 2016 earthquake is the latest example that earthquakes occurring on faults 324 associated with magma-assisted rifting in this region are capable of causing structural 325 damage and public anxiety at local distances. In addition to the 1995 MW 5.0 and 326
1983 MW 5.1 events, this relatively shallow event highlights that precautions for future 327 earthquakes in the region should be considered in the form of building regulations 328 and disaster planning. Through educating the public on seismic hazard and raising 329 awareness, it may be possible to avoid future injuries and confusion such as those 330 experienced in Hawassa. 331
332 We therefore suggest that such outreach should be pursued by authorities on a regional 333 and national level. Through enhanced monitoring, particularly to the east and west of 334 the caldera, it would be possible to better refine event locations and better constrain focal 335 mechanisms for events occurring within and around the basin. The focused monitoring 336 of Corbetti as part of the UK NERC funded RiftVolc project is currently underway and 337 will monitor the seismicity for five years between February 2016 and October 2017. 338 However at present there are no plans to monitor the wider region of the Hawassa basin. 339
340 Author contributions and declaration: Earthquake seismograms were acquired 341 from the Global Seismic Network and GEOFON. EH network stations are operated by 342 the IGSSA observatory at Addis Ababa University. M.W. is funded by an Engineering 343 and Physical Sciences Research Council (EPSRC) studentship. This research did not 344 receive any specific grant from funding agencies in the public, commercial, or not-for-345 profit sectors. 346
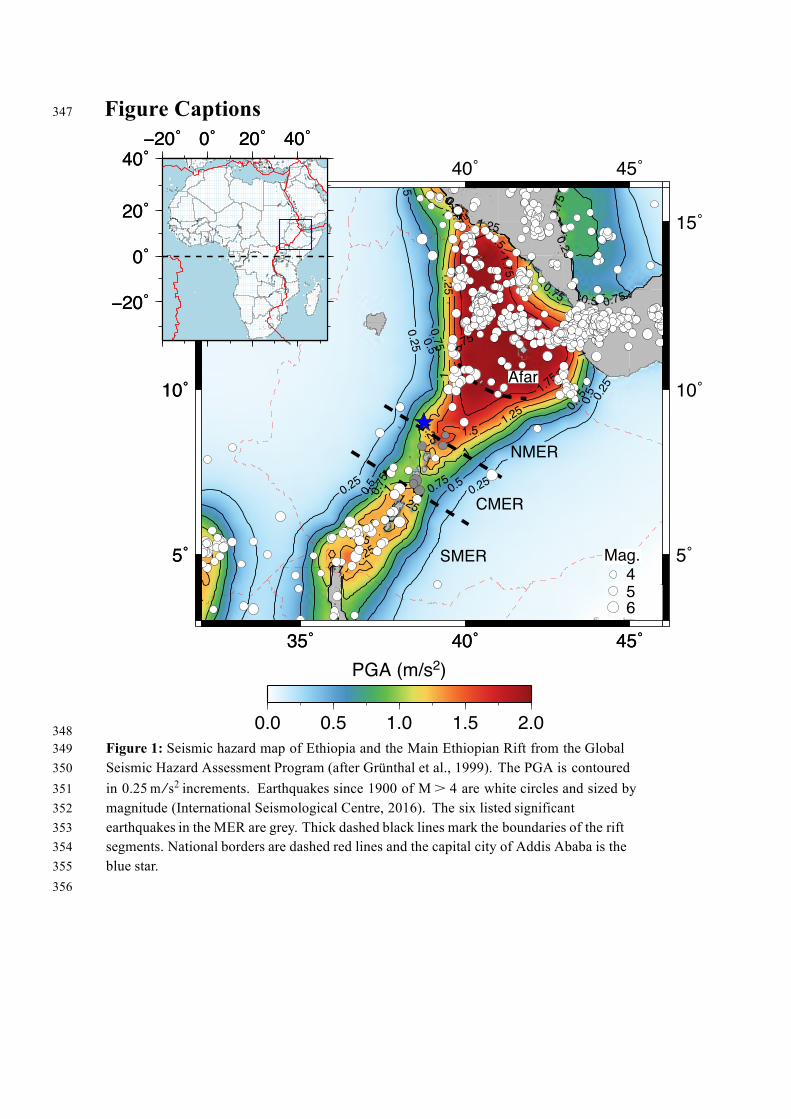
Figure Captions 347
348 Figure 1: Seismic hazard map of Ethiopia and the Main Ethiopian Rift from the Global 349 Seismic Hazard Assessment Program (after Grünthal et al., 1999). The PGA is contoured 350 in 0.25 m/s2 increments. Earthquakes since 1900 of M > 4 are white circles and sized by 351 magnitude (International Seismological Centre, 2016). The six listed significant 352 earthquakes in the MER are grey. Thick dashed black lines mark the boundaries of the rift 353 segments. National borders are dashed red lines and the capital city of Addis Ababa is the 354 blue star. 355 356
35˚ 40˚ 45˚
5˚
10˚
15˚
35˚
35˚
40˚
40˚
45˚
45˚
5˚ 5˚
10˚ 10˚
15˚ 15˚
0.25
0.25
0.25
0.25
0.25
0.25
0.5
0.5
0.5
0.5
0.5
0.5
0.5
0.75
0.75
0.75
0.75
0.75
0.75
0.75
0.75
1
1
11
1
1
1
1
1.25
1.25
1.25
1.251.25
1.25
1.251.25
1.5
1.5
1.51.5
1.75
1.75
1.75
0.0 0.5 1.0 1.5 2.0
PGA (m/s2)
−20˚ 0˚ 20˚ 40˚
−20˚
0˚
20˚
40˚−20˚ 0˚ 20˚ 40˚
−20˚
0˚
20˚
40˚
SMER
CMER
NMER
Afar
456
Mag.

357 Figure 2: (a) The seismic stations used for analysis. Stations from the GSN, GEOFON 358 and EH networks are blue, yellow and red triangles respectively. (b) The Hawassa 359 earthquake location with cross-sections in depth where 0 km is sea level. The maximum 360 probability event location is the blue star with the 68 and 95% uncertainty ellipsoids. The 361 scatter cloud from the output PDF are black points. The locations reported by the NEIC 362 and CSEM are red stars. Focal mechanisms for the 1995 Corbetti and 1983 Hawassa 363 caldera events are also presented. Pink lines are the Corbetti and Hawassa caldera 364 structures. Black and red lines are border and Wonji faults respectively. The cities of 365 Shashemene and Hawassa are grey squares. (c) Inset of the focal mechanism for the 2016 366 event. 367
368
38˚ 38.2˚ 38.4˚ 38.6˚ 38.8˚6.8˚
7˚
7.2˚
7.4˚
Corbetti
HawassaBasin
NEIC
CSEM
Hawassa
Shashemene
05
1015202530
Dept
h (k
m)
38.0 38.2 38.4 38.6 38.8Longitude (°E)
6.8
7.0
7.2
7.4
Latit
ude
(°N)
0 5 10 15 20 25 30Depth (km)
30˚ 40˚ 50˚
0˚
10˚
20˚
FURI
KMBOMBAR
RAYN
LODK
KIBK
UOSS
35˚ 40˚ 45˚
5˚
10˚
15˚
DILA
WERAAAE
ANKE
DESE
38.3˚ 38.4˚ 38.5˚
7˚
7.1˚
7.2˚
a)
b)
c)

369 Figure 3: Seismograms of the Hawassa event recorded at FURI, LODK, KMBO and 370 KIBK. The horizontal components are convolved to the response of a Wood-Anderson 371 seismograph and the maximum peak-to-peak amplitudes are then measured (red ticks). P- 372 and S-wave arrivals are red and blue vertical lines respectively. 373 374
FURI BHN
FURI BHE
0 50 100 150 200 250 300 350 400
Time (s)
Dis
plac
emen
t (m
m)
010
-10
0
1
-1
010
-10
0.5
-0.5
00.5
-0.5
00.4
-0.4
-1
00.5
-0.5
0
0.2
-0.2
0
0.6
-0.6
LODK BHN
LODK BHE
KMBO BHN
KMBO BHE
KIBK BHN
KIBK BHE
APTP
36.8 mm
28.3 mm
1.92 mm
1.74 mm
1.29 mm
1.45 mm
0.50 mm
1.28 mm

375
10-1 100 101
Frequency (Hz)
10-13
10-12
10-11
10-10
10-9
10-8
10-7
10-6
10-5
10-4Sp
ectra
l Am
plitu
de (m
*s)
P
Ω
f c
a) FURI
10-1 100 101
Frequency (Hz)
10-13
10-12
10-11
10-10
10-9
10-8
10-7
10-6
10-5
10-4
SV
Ω
f c
10-1 100 101
Frequency (Hz)
10-13
10-12
10-11
10-10
10-9
10-8
10-7
10-6
10-5
10-4
SH
Ω
f c
10-1 100 101
Frequency (Hz)
10-13
10-12
10-11
10-10
10-9
10-8
10-7
10-6
10-5
10-4
Spec
tral A
mpl
itude
(m*s
)
P
Ω
f c
b) LODK
10-1 100 101
Frequency (Hz)
10-13
10-12
10-11
10-10
10-9
10-8
10-7
10-6
10-5
10-4
SV
Ω
f c
10-1 100 101
Frequency (Hz)
10-13
10-12
10-11
10-10
10-9
10-8
10-7
10-6
10-5
10-4
SH
Ω
f c
10-1 100 101
Frequency (Hz)
10-13
10-12
10-11
10-10
10-9
10-8
10-7
10-6
10-5
10-4
Spec
tral A
mpl
itude
(m*s
)
P
Ω
c) KMBO
10-1 100 101
Frequency (Hz)
10-13
10-12
10-11
10-10
10-9
10-8
10-7
10-6
10-5
10-4
SV
Ω
10-1 100 101
Frequency (Hz)
10-13
10-12
10-11
10-10
10-9
10-8
10-7
10-6
10-5
10-4
SH
Ω
f c
10-1 100 101
Frequency (Hz)
10-13
10-12
10-11
10-10
10-9
10-8
10-7
10-6
10-5
10-4
Spec
tral A
mpl
itude
(m*s
)
P
Ω
d) KIBK
10-1 100 101
Frequency (Hz)
10-13
10-12
10-11
10-10
10-9
10-8
10-7
10-6
10-5
10-4
SV
Ω
f c
10-1 100 101
Frequency (Hz)
10-13
10-12
10-11
10-10
10-9
10-8
10-7
10-6
10-5
10-4
SH
Ω
f c
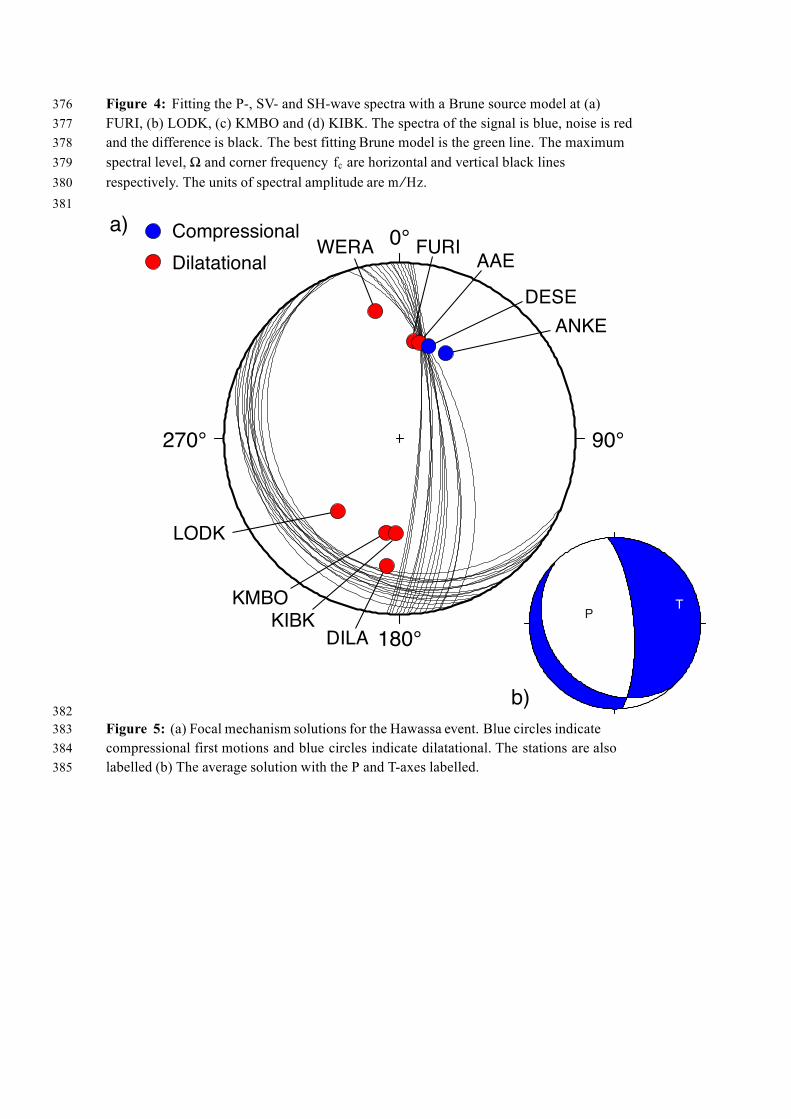
Figure 4: Fitting the P-, SV- and SH-wave spectra with a Brune source model at (a) 376 FURI, (b) LODK, (c) KMBO and (d) KIBK. The spectra of the signal is blue, noise is red 377 and the difference is black. The best fitting Brune model is the green line. The maximum 378 spectral level, Ω and corner frequency fc are horizontal and vertical black lines 379 respectively. The units of spectral amplitude are m/Hz. 380 381
382 Figure 5: (a) Focal mechanism solutions for the Hawassa event. Blue circles indicate 383 compressional first motions and blue circles indicate dilatational. The stations are also 384 labelled (b) The average solution with the P and T-axes labelled. 385
0°
90°
180°
270°
Compressional
Dilatational
DILA
LODK
KMBO
KIBK
ANKE
DESE
AAEFURIWERA
PT
a)
b)

References 386
387 Agostini, A., Bonini, M., Corti, G., Sani, F., & Mazzarini, F., 2011. Fault architecture in 388
the Main Ethiopian Rift and comparison with experimental models: Implications for 389 rift evolution and Nubia-Somalia kinematics, Earth and Planetary Science Letters, 390 301(3-4), 479–492. 391
392 Aki, K. & Richards, P. G., 2002. Quantitative Seismology, University Science Books, 393
Sausalito, California, 2nd edn. 394 395 Asfaw, L. M., 1998. Environmental hazard from fissures in the Main Ethiopian Rift, 396
Journal of African Earth Sciences, 27(3-4), 481–490. 397 398 Biggs, J., Bastow, I. D., Keir, D., & Lewi, E., 2011. Pulses of deformation reveal 399
frequently recurring shallow magmatic activity beneath the Main Ethiopian Rift, 400 Geochemistry, Geophysics, Geosystems, 12(9), 1–11. 401
402 Bilham, R., Bendick, R., Larson, K., Mohr, P. A., Braun, J., Tesfaye, S., & Asfaw, L., 403
1999. Secular and tidal strain across the Main Ethiopian Rift, Geophysical Research 404 Letters, 26(18), 2789–2792. 405
406 Boccaletti, M., Bonini, M., Mazzuoli, R., Abebe, B., Piccardi, L., & Tortorici, L., 407
1998. Quaternary oblique extensional tectonics in the Ethiopian Rift (Horn of Africa), 408 Tectonophysics, 287(1-4), 97–116. 409
410 Bonini, M., Corti, G., Innocenti, F., Manetti, P., Mazzarini, F., Abebe, T., & Pecskay, 411
Z., 2005. Evolution of the Main Ethiopian Rift in the frame of Afar and Kenya rifts 412 propagation, Tectonics, 24, TC1007. 413
414 Bormann, P., Dewey, J. W., Gabsatarova, I., Gregersen, S., Gusev, A. A., Kim, W. Y., 415
Patton, H. J., Presgrave, B. W., Ruifeng, L., Saul, J., Storchak, D., Uhrammer, R. A., 416 Wendt, S., Firbas, P., Havskov, J., Klinge, K., & Veith, K., 2013. Summary of 417 Magnitude Working Group Recommendations on Standard Procedures for 418 Determining Earthquake Magnitudes from Digital Data, Tech. rep., IASPEI. 419
420
Brune, J. N., 1970. Tectonic stress and the spectra of seismic shear waves from 421 earthquakes, Journal of Geophysical Research, 75(26), 4997–5009. 422
423 Casey, M., Ebinger, C. J., Keir, D., Gloaguen, R., & Mohamed, F., 2006. Strain 424
accommodation in transitional rifts: extension by magma intrusion and faulting in 425 Ethiopian rift magmatic segments, in The Afar Volcanic Province within the East 426 African Rift System, vol. 259, chap. 3, pp. 143–163, eds Yirgu, G., Ebinger, C. J., & 427 Maguire, P. K. H., Geological Society of London, London, Special Publications. 428
429

Chorowicz, J., Collet, B., Bonavia, F., & Korme, T., 1994. NW to NNW extension 430
direction in the Ethiopian Rift deduced from the orientation of structures and fault 431 slip analysis, Geological Society of America Bulletin, 105, 1560–1570. 432
433 Ebinger, C. J., 2005. Continental break-up: the East African perspective, Astronomy & 434
Geophysics, 46, 2.16–2.21. 435 436 Ebinger, C. J. & Casey, M., 2001. Continental breakup in magmatic provinces: An 437
Ethiopian example, Geology, 29(6), 527. 438 439 Fantahun, A., 2016. Magnitude 4.3 Earthquake strikes Awassa, Ethiopia Observer. 440 441 Foster, A. N. & Jackson, J. A., 1998. Source parameters of large African earthquakes: 442
implications for crustal rheology and regional kinematics, Geophysical Journal 443 International, 134(2), 422–448. 444
445 Gasperini, P., Lolli, B., & Vannucci, G., 2013. Body-Wave Magnitude mb Is a Good 446
Proxy of Moment Magnitude Mw for Small Earthquakes (mb<4.5-5.0), Seismological 447 Research Letters, 84(6), 932–937. 448
449 Gouin, P., 1979. Earthquake History of Ethiopia and the Horn of Africa, International 450
Development Research Centre, Ottawa, Ontario. 451 452 Grünthal, G., Bosse, C., Sellami, S., Mayer-Rosa, D., & Giardini, D., 1999. Compilation 453
of the GSHAP regional seismic hazard for Europe, Africa and the Middle East, Annali 454 di Geofisica, 42(6), 1215–1223. 455
456
Gutenberg, B. & Richter, C. F., 1956. Earthquake Magnitude, Intensity, Energy and 457 Acceleration, Bulletin of the Seismological Society of America, 46, 105–145. 458
459 Havskov, J. & Ottemoller, L., 2010. Routine Data Processing in Earthquake Seismology, 460
Springer, London, UK. 461 462 Hayward, N. J. & Ebinger, C. J., 1996. Variations in the along-axis segmentation of the Afar 463
Rift system, Tectonics, 15(2), 244–257. 464 465 Herrmann, R. B. & Kijko, A., 1983. Modeling some empirical vertical component Lg 466
relations, Bulletin of the Seismological Society of America, 73(1), 157–171. 467 468 Hofstetter, R. & Beyth, M., 2003. The Afar Depression: interpretation of the 1960-2000 469
earthquakes, Geophysical Journal International, 155, 715–732. 470 471 Hutchison, W., 2015. Past, present and future volcanic activity at restless calderas in 472
the Main Ethiopian Rift, Doctor of philosophy, University of Oxford. 473 474 475
International Seismological Centre, 2016. On-line Bulletin, Internatl. Seis. Cent., 476
Thatcham, United Kingdom. 477 478 Kebede, S., 2014. Geothermal Exploration and Development in Ethiopia: Country 479
Update, in Short Course IX on Exploration for Geothermal Resources, p. 8, UNU- 480 GTP, GDC and KenGen, Lake Bogoria and Lake Naivasha, Kenya. 481
482 Keir, D., Ebinger, C. J., Stuart, G. W., Daly, E., & Ayele, A., 2006a. Strain 483
accommodation by magmatism and faulting as rifting proceeds to breakup: 484 Seismicity of the northern Ethiopian rift, Journal of Geophysical Research, 111(B5), 485 B05314. 486
487 Keir, D., Stuart, G. W., Jackson, A., & Ayele, A., 2006b. Local Earthquake Magnitude 488
Scale and Seismicity Rate for the Ethiopian Rift, Bulletin of the Seismological Society 489 of America, 96(6), 2221–2230. 490
491 Kennett, B. L. N., Engdahl, E. R., & Buland, R., 1995. Constraints on seismic velocities 492
in the Earth from traveltimes, Geophysical Journal International, 122, 108–124. 493
494
Lomax, A., Virieux, J., Volant, P., & Berge-Thierry, C., 2000. Probabilistic earthquake 495 location in 3D and layered models - Introduction of a Metropolis-Gibbs method and 496 comparison with linear locations, in Advances in Seismic Event Location, pp. 101– 497 134, eds Thurber, C. H. & Rabinowitz, N., Kluwer, Amsterdam. 498
499 Lomax, A., Michelini, A., & Curtis, A., 2009. Earthquake Location, Direct, Global- 500
Search Methods, Springer New York, New York, NY. 501 502 Midzi, V., Hlatywayo, D., Chapola, L., Kebede, F., Atakan, K., Lombe, D., 503
Turyomurugyendo, G., & Tugume, F., 1999. Seismic hazard assessment in Eastern 504 and Southern Africa, Annali di Geofisica, V42(6), 1067–1083. 505
506 Mohr, P. A., 1967. The Ethiopian Rift System, Bulletin of the Geophysical Observatory 507
of Addis Ababa, 11, 1–65. 508 509 National Earthquake Information Center [NEIC], 2016. Earthquake Information 510
Bulletin, U.S. Geological Survey, Denver, CO. 511 512 Snoke, J. A., 2003. FOCMEC: FOCal MEChanism determinations, in International 513
Handbook of Earthquake and Engineering Seismology, vol. 85, chap. 12, pp. 1629– 514 1630, eds Lee, W. H. K., Kanamori, H., Jennings, P. C., & Kisslinger, C., Academic 515 Press, San Diego. 516
517 Stamps, D. S., Calais, E., Saria, E., Hartnady, C., Nocquet, J.-M., Ebinger, C. J., & 518
Fernandes, R. M., 2008. A kinematic model for the East African Rift, Geophysical 519 Research Letters, 35, L05304. 520
521

WoldeGabriel, G., Aronson, J. L., & Walter, R., 1990. Geology, geochronology, and rift 522
basin development in the central sector of the Main Ethiopia Rift, Geological Society 523 of America Bulletin, 102(4), 439–458. 524
525 Wolfenden, E., Ebinger, C. J., Yirgu, G., Deino, A., & Ayalew, D., 2004. Evolution of 526
the northern Main Ethiopian rift: birth of a triple junction, Earth and Planetary 527 Science Letters, 224(1-2), 213–228. 528