Wildfires Reported to NICC - Geographic Area … · Fires 447 552 431 383 304 328 429 334 315 188...
16
13 Wildfires Reported to NICC In 2017 there were 71,499 wildfires in the U.S., which burned 10,026,086 acres. Fires reported were well above the five year average and slightly higher than the 10 year national average. Acres burned were well above both the five and ten year national averages. The charts below depict fires and acres as a percentage of the national total.
Transcript of Wildfires Reported to NICC - Geographic Area … · Fires 447 552 431 383 304 328 429 334 315 188...

13
Wildfires Reported to NICC In 2017 there were 71,499 wildfires in the U.S., which burned 10,026,086 acres. Fires reported were well above the five year average and slightly higher than the 10 year national average. Acres burned were well above both the five and ten year national averages. The charts below depict fires and acres as a percentage of the national total.

14
Wildfire Acres Reported to NICC
15
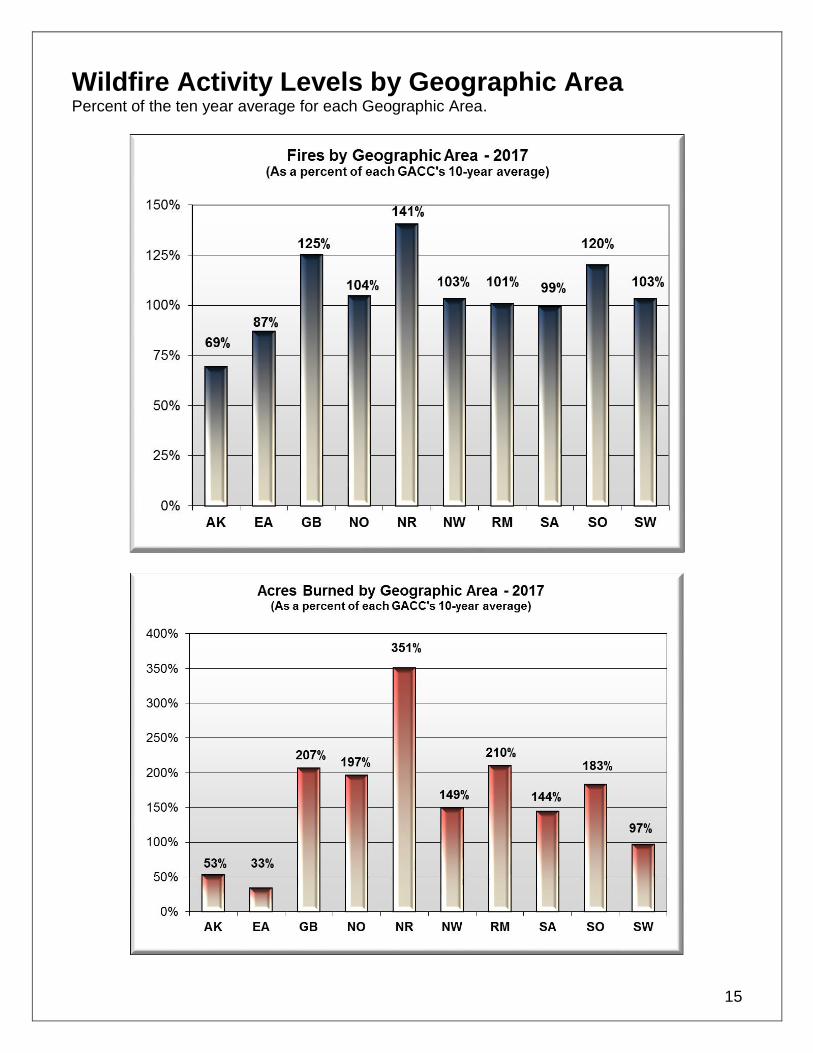
Wildfire Activity Levels by Geographic Area Percent of the ten year average for each Geographic Area.

16
Wildfires by Agency

17
Wildfire Acres by Agency
18
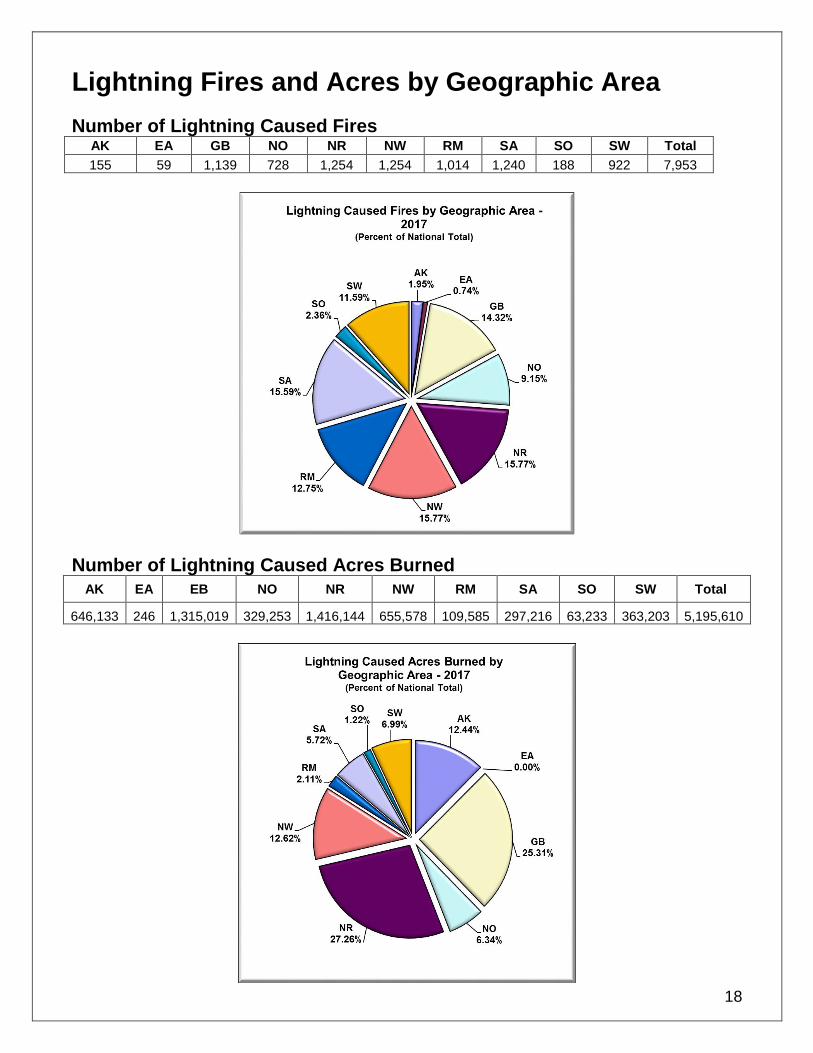
Lightning Fires and Acres by Geographic Area
Number of Lightning Caused Fires AK EA GB NO NR NW RM SA SO SW Total
155 59 1,139 728 1,254 1,254 1,014 1,240 188 922 7,953
Number of Lightning Caused Acres Burned
AK EA EB NO NR NW RM SA SO SW Total
646,133 246 1,315,019 329,253 1,416,144 655,578 109,585 297,216 63,233 363,203 5,195,610
19
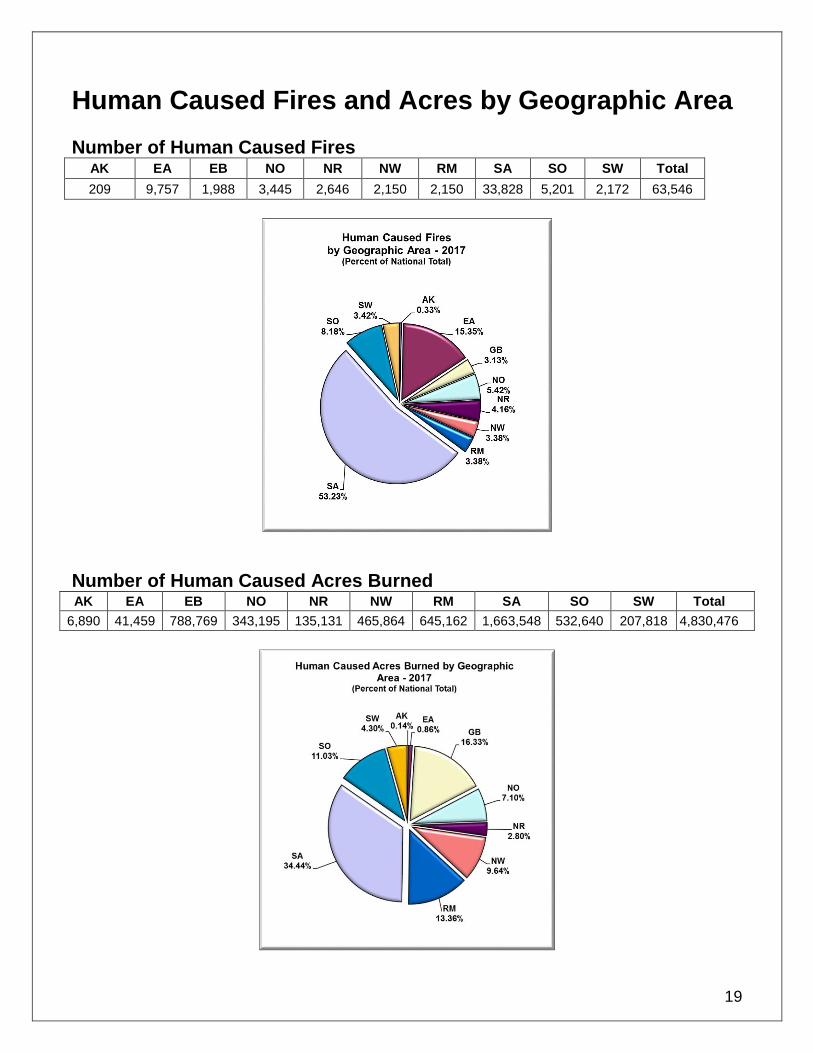
Human Caused Fires and Acres by Geographic Area
Number of Human Caused Fires
AK EA EB NO NR NW RM SA SO SW Total
209 9,757 1,988 3,445 2,646 2,150 2,150 33,828 5,201 2,172 63,546
Number of Human Caused Acres Burned AK EA EB NO NR NW RM SA SO SW Total
6,890 41,459 788,769 343,195 135,131 465,864 645,162 1,663,548 532,640 207,818 4,830,476

21
Wildfires and Acres Burned by Agency
Agency 2009 2010 2011 2012 2013 2014
2015
2016 2017 5-Yr Avg.
10-Yr Avg.
BIA Fires 4,375 3,825 4,274 5,753 3,239 3,377 3,886 4,056 3,843 4,062 4,231
Acres 200,562 106,978 364,767 866,444 173,491 327,352 591,644 325,162 306,542 456,819 339,133
BLM Fires 2,545 2,312 2,798 3,031 2,628 1,944 2,093 2,105 2,927 2,360 2,401
Acres 989,029 830,377 959,410 3,331,273 1,012,600 871,642 4,770,133 1,183,821 2,711,267 2,233,894 1,630,028
FS Fires 7,691 6,797 6,667 7,098 7,105 6,755 7,056 5,676 6,617 6,738 7,044
Acres 715,677 319,730 1,729,937 2,680,233 1,365,644 871,876 1,916,302 1,247,906 2,866,031 1,616,392 1,491,736
FWS Fires 448 323 442 394 332 348 194 174 252 288 348
Acres 821,838 187,991 171,368 101,752 138,284 17,404 33,897 15,374 206,393 61,342 208,490
NPS Fires 426 390 418 369 455 389 398 463 314 415 419
Acres 182,047 174,255 98,147 140,807 265,755 24,949 74,780 177,901 110,349 136,838 133,016
State / Other
Fires 63,307 58,324 59,527 51,129 33,820 50,799 54,524 55,269 57,546 49,108 55,997
Acres 3,012,633 1,803,393 5,387,738 2,205,729 1,363,772 1,482,390 2,738,393 2,559,831 3,825,504 2,070,023 2,752,891
Total Fires 78,792 71,971 74,126 67,774 47,579 63,612 68,151 67,743 71,499 62,972 70,440
Acres 5,921,786 3,422,724 8,711,367 9,326,238 4,319,546 3,595,613 10,125,149 5,509,995 10,026,086 6,575,308 6,555,293

22
Wildfires and Acres Burned by Geographic Area
GACC 2009 2010 2011 2012 2013 2014 2015 2016 2017 5-Yr Avg.
10-Yr Avg.
AK Fires 527 689 515 416 603 384 768 572 364 549 526
Acres 2,951,597 1,125,419 293,018 286,887 1,316,876 233,561 5,111,404 496,467 653,023 1,489,039 1,240,289
EA Fires 15,781 15,844 9,153 11,147 7,110 7,030 11,639 11,270 9,816 9,639 11,308
Acres 118,657 130,103 213,172 146,208 64,992 54,141 100,294 98,042 41,705 92,735 124,548
GB Fires 1,812 1,846 1,880 2,399 2,214 1,719 2,096 2,063 3,127 2,545 2,573
Acres 136,970 712,019 462,499 1,888,892 767,954 105,550 505,483 761,622 2,103,788 972,944 1,017,685
NO Fires 4,567 2,943 3,092 3,536 5,299 4,082 4,587 3,363 4,173 4,173 3,994
Acres 107,411 35,674 24,200 771,486 165,194 474,826 594,048 96,706 672,448 420,452 342,125
NR Fires 2,556 1,740 2,053 3,433 2,773 2,665 3,817 2,700 3,900 3,078 2,776
Acres 69,016 70,474 198,624 1,497,972 179,459 143,271 745,947 202,140 1,551,275 553,758 442,086
NW Fires 3,467 2,188 2,150 2,305 4,389 4,572 4,603 2,519 3,404 3,678 3,301
Acres 177,920 150,553 303,260 1,515,596 503,993 1,383,514 1,823,473 513,226 1,121,442 1,147,960 751,771
RM Fires 2,524 2,903 3,433 5,584 2,621 2,356 2,559 3,289 3,164 3,282 3,137
Acres 107,188 151,631 517,004 1,244,073 237,121 78,345 180,822 686,921 754,747 485,456 359,375
SA Fires 38,660 37,176 42,362 30,964 14,448 34,267 31,594 34,474 35,068 29,149 35,335
Acres 1,227,610 624,440 3,892,567 718,624 182,650 752,694 556,267 1,591,044 1,960,764 760,256 1,361,579
SO Fires 4,591 3,610 4,891 4,412 4,608 3,786 4,175 3,996 5,389 4,195 4,488
Acres 305,974 83,986 104,829 99,914 412,481 80,218 304,925 479,207 595,873 275,349 325,152
SW Fires 3,620 2,547 3,782 2,634 2,757 2,220 2,313 3,497 3,094 2,684 3,001
Acres 686,078 314,558 2,278,026 543,460 325,985 230,241 202,486 584,620 571,021 377,358 590,684

23
Alaska Wildfire Activity In 2017 Alaska burned 7 percent of all burned acres in the U.S. This is well below the ten year average of 19 percent. The chart below compares annual acres burned between Alaska and the rest of the U.S. (including Hawaii).

24
Prescribed Fire Projects and Acres

25
Prescribed Fire Projects and Acres by Agency

26
Prescribed Fire Projects by Agency and Geographic Area National reporting of Prescribed Fire projects and acres began in 1998.
Prescribed Fire Projects by Agency
Agency 2008 2009 2010 2011 2012 2013 2014 2015 2016 2017 10 - Yr
Avg
BIA Fires 254 2,186 403 321 201 202 288 245 240 247 462
Acres 86,161 151,435 124,404 111,352 62,529 80,889 109,629 77,907 99,712 89,330 98,783
BLM Fires 447 552 431 383 304 328 429 334 315 188 399
Acres 109,128 152,420 91,622 242,658 39,675 34,492 132,311 84,399 64,454 77,134 105,128
FS Fires 3,193 3,795 3,766 2,890 2,719 2,497 3,021 2,995 3,061 2,323 3,271
Acres 955,016 1,244,342 1,408,693 960,992 969,560 1,006,955 1,243,739 993,570 1,284,277 958,264 1,135,903
FWS Fires 821 1,227 1,024 840 1,001 530 899 727 757 586 905
Acres 246,617 338,161 257,672 195,055 234,887 123,399 201,426 225,890 266,769 178,394 249,533
NPS Fires 223 815 251 213 203 154 196 160 214 138 270
Acres 105,497 137,719 94,500 72,045 62,357 44,347 67,937 33,377 79,881 183,029 80,954
State / Other
Fires 2,731 3,854 11,007 4,025 12,198 15,053 12,211 32,802 78,418 198,952 18,936
Acres 432,582 507,056 446,971 530,709 602,826 709,958 634,756 1,543,117 2,220,418 4,943,229 878,431
Total Fires 7,669 12,429 16,882 8,672 16,626 18,764 17,044 37,263 83,005 202,434 24,243
Acres 1,935,001 2,531,133 2,423,862 2,112,811 1,971,834 2,000,040 2,389,798 2,958,260 4,015,511 6,429,380 2,548,732
27
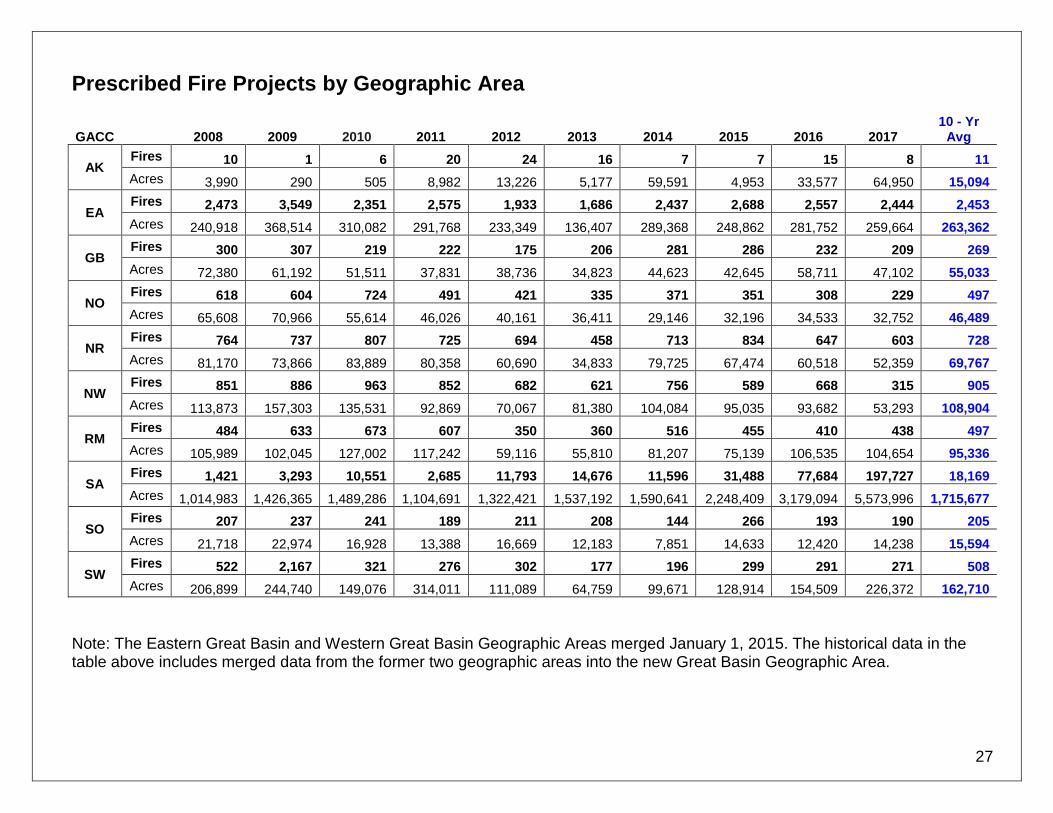
Prescribed Fire Projects by Geographic Area
GACC 2008 2009 2010 2011 2012 2013 2014 2015 2016 2017 10 - Yr
Avg
AK Fires 10 1 6 20 24 16 7 7 15 8 11
Acres 3,990 290 505 8,982 13,226 5,177 59,591 4,953 33,577 64,950 15,094
EA Fires 2,473 3,549 2,351 2,575 1,933 1,686 2,437 2,688 2,557 2,444 2,453
Acres 240,918 368,514 310,082 291,768 233,349 136,407 289,368 248,862 281,752 259,664 263,362
GB Fires 300 307 219 222 175 206 281 286 232 209 269
Acres 72,380 61,192 51,511 37,831 38,736 34,823 44,623 42,645 58,711 47,102 55,033
NO Fires 618 604 724 491 421 335 371 351 308 229 497
Acres 65,608 70,966 55,614 46,026 40,161 36,411 29,146 32,196 34,533 32,752 46,489
NR Fires 764 737 807 725 694 458 713 834 647 603 728
Acres 81,170 73,866 83,889 80,358 60,690 34,833 79,725 67,474 60,518 52,359 69,767
NW Fires 851 886 963 852 682 621 756 589 668 315 905
Acres 113,873 157,303 135,531 92,869 70,067 81,380 104,084 95,035 93,682 53,293 108,904
RM Fires 484 633 673 607 350 360 516 455 410 438 497
Acres 105,989 102,045 127,002 117,242 59,116 55,810 81,207 75,139 106,535 104,654 95,336
SA Fires 1,421 3,293 10,551 2,685 11,793 14,676 11,596 31,488 77,684 197,727 18,169
Acres 1,014,983 1,426,365 1,489,286 1,104,691 1,322,421 1,537,192 1,590,641 2,248,409 3,179,094 5,573,996 1,715,677
SO Fires 207 237 241 189 211 208 144 266 193 190 205
Acres 21,718 22,974 16,928 13,388 16,669 12,183 7,851 14,633 12,420 14,238 15,594
SW Fires 522 2,167 321 276 302 177 196 299 291 271 508
Acres 206,899 244,740 149,076 314,011 111,089 64,759 99,671 128,914 154,509 226,372 162,710
Note: The Eastern Great Basin and Western Great Basin Geographic Areas merged January 1, 2015. The historical data in the table above includes merged data from the former two geographic areas into the new Great Basin Geographic Area.

28
National Preparedness Levels
In 2017 the national Preparedness Level (PL) was elevated to PL 2 on May 17 then was raised to PL 3 on June 29 where it remained for a week and a half. On July 10 it was raised to PL 4 where it remained for thirty-three days. On August 12 the PL was raised to PL 5 and remained at that level for thirty-eight days. On September 19 the PL was dropped to PL 4 for four days and on September 23 the PL was lowered again to PL 3 where it remained for ten days. October 3 the PL was dropped to PL 2 for nine days. On October 12 it was raised again to PL 3 for twelve days until October 24 when it was lowered to PL 2 for eight days. On November 1 PL dropped to PL 1 for thirty-eight days. On December 9 the PL was raised once again to PL 2 for twelve days. Finally, on December 21 the PL was lowered to PL 1 where it remained for the rest of the calendar year.

29
National Preparedness Level Summary In 2017 there were 75 days at Preparedness Levels 4 and 5.
Year PL1 PL2 PL3 PL4 PL5 Total Days at
PL 4 & 5
1990 247 74 31 6 7 13
1991 255 103 7 0 0 0
1992 278 67 15 6 0 6
1993 268 97 0 0 0 0
1994 235 26 54 4 46 50
1995 254 96 15 0 0 0
1996 99 178 60 8 21 29
1997 216 149 0 0 0 0
1998 157 172 30 6 0 6
1999 159 165 33 8 0 8
2000 179 73 61 13 40 53
2001 188 142 9 10 16 26
2002 187 76 14 26 62 88
2003 92 155 60 10 48 58
2004 249 57 60 0 0 0
2005 233 44 47 41 0 41
2006 110 145 44 16 50 66
2007 212 76 17 21 39 60
2008 209 84 15 36 22 58
2009 275 62 28 0 0 0
2010 231 134 0 0 0 0
2011 207 93 58 7 0 7
2012 212 49 60 45 0 45
2013 253 46 42 17 7 24
2014 242 82 26 15 0 15
2015 253 29 40 19 24 43
2016 251 73 28 14 0 14
2017 186 72 33 37 38 75
5-yr Avg 242 56 39 22 6 28
10-yr Avg 235 73 31 17 9 27