
Wild Meadows Wind Project - New Hampshire · Wild Meadows Wind Project | 2 renewable sources by...
37
Wild Meadows Wind Project Economic Impact Report Neil B. Niman Chair and Associate Professor of Economics Department of Economics Peter T. Paul College of Business and Economics University of New Hampshire Durham, NH 03824 603.862.3336 [email protected]
Transcript of Wild Meadows Wind Project - New Hampshire · Wild Meadows Wind Project | 2 renewable sources by...

Wild Meadows Wind Project
Economic Impact Report
Neil B. Niman
Chair and Associate Professor of Economics
Department of Economics
Peter T. Paul College of Business and Economics
University of New Hampshire
Durham, NH 03824
603.862.3336

W i l d M e a d o w s W i n d P r o j e c t | 1
EXECUTIVE SUMMARY
Iberdrola Renewables LLC., the U.S. subsidiary of Iberdrola S.A., is proposing to construct a 75.9
megawatt (MW) Wind Project (known as Wild Meadows) on private land in the towns of Alexandria and
Danbury NH. With more than $10 billion dollars of operating assets totaling more than 5,800 MW of
wind and solar generating capacity, it is in a strong position to add to its current wind investments in
Lempster (24 MW) and Groton (48 MW).
The project will consist of 23 wind turbine generators, each capable of generating 3.3
megawatts of clean energy. With a total investment of roughly $150 million dollars, the contributions to
the NH economy will be substantial.
To evaluate the economic impact of the project, IMPLAN –based multipliers were constructed
for the local economy.1 In conjunction with the widely used JEDI spreadsheet tool, customized project
data based on proprietary information was used to estimate economic impacts.
These impacts were divided between the construction and operational phases of the project.
During the construction phase of the project, it is estimated that $42.35 million dollars of local in-state
economic activity will be created. Constructing the project will require the use of 404 full time
equivalent employees who will earn $21.77 million dollars in income.
During the operational phase of the project, the total number of full time equivalent jobs
created after accounting for both direct and indirect impacts is 13 leading to an increase in annual local
incomes by $770,000. This will contribute to an annual level of economic activity estimated at $2.31
million dollars.
In addition to the benefits identified by regional economic modeling is the contribution of the
project toward meeting the State of NH’s targeted goal of achieving 25% of its electricity from
1 IMPLAN is a modeling software that allows the user to calculate the regional economic impacts of a development
project. More information about the model can be found at:
http://implan.com/v4/index.php?option=com_content&view=article&id=282:what-is-implan&catid=152:implan-
appliance-&Itemid=2

W i l d M e a d o w s W i n d P r o j e c t | 2
renewable sources by 2025. It will either increase the availability of renewable energy which will lower
the price of Renewable Energy Certificates (RECs) or will enable those New England States that have
Renewable Portfolio Standards (RPSs) to more quickly meet their targeted goals at the same price. The
project also affords the potential for significant local property tax reduction or a substantial upgrade in
local services; either should have a positive impact on local property taxes.
INTRODUCTION
As part of a larger national effort, in August 2006, Governor John Lynch announced the 25x’25
Renewable Energy Initiative. The goal of this initiative was for the state of New Hampshire to obtain 25%
of its energy from clean, renewable resources by the year 2025. As an important step toward
implementing the initiative, on July 10, 2007, the NH Legislature enacted RSA 362-F mandating the
State’s first renewable standard. Commitment to the Renewable Portfolio Standard (RPS) approach was
reaffirmed in the 2009 NH Climate Action Plan designed to reduce greenhouse gas emissions to an
amount which is 80% below 1990 levels by 2050.2
In its 2011 review of the standard, the New Hampshire Public Utilities Commission (PUC) noted
that in addition to furthering the goal of developing new sources for clean energy, “The RPS can also
have an economic development effect, if generators, generation component manufacturers, or fuel
suppliers are located in NH.”3 The purpose of this study is to determine the degree to which the
proposed Wild Meadows project initiated by Iberdrola Renewables LLC (IBR) will have a positive
economic benefit in the host communities and the State of NH.4
2 NH DES. The NH Climate Action Plan. March 2009. page 1.
3 NHPUC. 2011. Renewable Portfolio Standard Review. p. 4. Downloaded from:
https://www.puc.nh.gov/Sustainable%20Energy/RPS/RPS%20Review%202011.pdf 4 With investment projects totaling billions of dollars and tens of thousands of jobs created in the construction,
engineering, and transportation sectors, IBR is the second largest wind power producer in the U.S. The company
currently operates a 24MW per hour wind farm project in Lempster, NH and another 48MW per hour project in
Groton, NH. The proposed Project would be IBR’s third in the state.

W i l d M e a d o w s W i n d P r o j e c t | 3
As wind energy becomes more prevalent in the State of NH, a wealth of information and local
expertise has been created surrounding wind projects. For this study, local economic impacts were
evaluated using proprietary data provided by IBR, the extensive experience of IBR executives in
constructing wind facilities in the State of NH, previous studies that have been generated for various
wind projects, the latest IMPLAN multipliers, and peer-reviewed research in the field. The results of this
study indicate that there are substantial economic benefits to the proposed Wild Meadows Wind
Project that goes beyond the contribution that project will make toward furthering the state’s energy
goals.
RSA 362-F AND THE MARKET FOR ELECTRICITY
One of the recommendations that emerged from the 2009 NH Climate Action Plan was continued
support for implementing the 2007 RPS mandating that 23.8 percent of the retail sales of electricity to
in-state customers be met with renewable energy sources by 2025. The numbers underlying the
standard are based on the assumption that “New Hampshire RPS demand combined with regional RPS
demand is modeled to lead to new in-state development of 960 MW wind, 56 MW biomass, 15 MW
landfill gas, and 33 MW solar by 2025.5
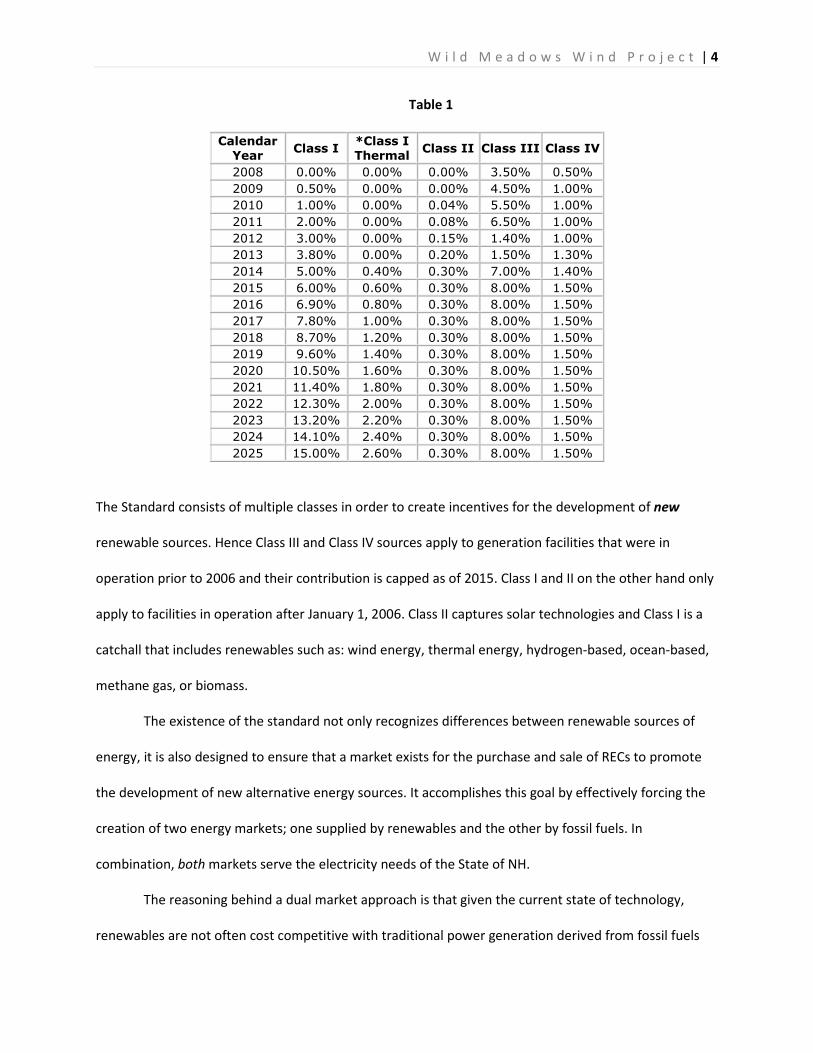
To promote the development of newly mandated renewable energy standards, the RPS works
by requiring that electric providers “meet customer load by purchasing or acquiring certificates
representing generation from renewable energy based on total megawatt-hours supplied.” RPS classes
by percentage can be found in Table 1:6
5 NHDES. 2009. New Hampshire Climate Action Plan Appendix 4.2 p. 3. Of particular note is the contrast that exists
between the goal of 960MW of wind in relationship to the 179.65 MW of capacity that currently exists. 6 Table 1 was downloaded from:
http://www.puc.state.nh.us/Sustainable%20Energy/Renewable_Portfolio_Standard_Program.htm
W i l d M e a d o w s W i n d P r o j e c t | 4
Table 1
Calendar
Year Class I
*Class I
Thermal Class II Class III Class IV
2008 0.00% 0.00% 0.00% 3.50% 0.50%
2009 0.50% 0.00% 0.00% 4.50% 1.00%
2010 1.00% 0.00% 0.04% 5.50% 1.00%
2011 2.00% 0.00% 0.08% 6.50% 1.00%
2012 3.00% 0.00% 0.15% 1.40% 1.00%
2013 3.80% 0.00% 0.20% 1.50% 1.30%
2014 5.00% 0.40% 0.30% 7.00% 1.40%
2015 6.00% 0.60% 0.30% 8.00% 1.50%
2016 6.90% 0.80% 0.30% 8.00% 1.50%
2017 7.80% 1.00% 0.30% 8.00% 1.50%
2018 8.70% 1.20% 0.30% 8.00% 1.50%
2019 9.60% 1.40% 0.30% 8.00% 1.50%
2020 10.50% 1.60% 0.30% 8.00% 1.50%
2021 11.40% 1.80% 0.30% 8.00% 1.50%
2022 12.30% 2.00% 0.30% 8.00% 1.50%
2023 13.20% 2.20% 0.30% 8.00% 1.50%
2024 14.10% 2.40% 0.30% 8.00% 1.50%
2025 15.00% 2.60% 0.30% 8.00% 1.50%
The Standard consists of multiple classes in order to create incentives for the development of new
renewable sources. Hence Class III and Class IV sources apply to generation facilities that were in
operation prior to 2006 and their contribution is capped as of 2015. Class I and II on the other hand only
apply to facilities in operation after January 1, 2006. Class II captures solar technologies and Class I is a
catchall that includes renewables such as: wind energy, thermal energy, hydrogen-based, ocean-based,
methane gas, or biomass.
The existence of the standard not only recognizes differences between renewable sources of
energy, it is also designed to ensure that a market exists for the purchase and sale of RECs to promote
the development of new alternative energy sources. It accomplishes this goal by effectively forcing the
creation of two energy markets; one supplied by renewables and the other by fossil fuels. In
combination, both markets serve the electricity needs of the State of NH.
The reasoning behind a dual market approach is that given the current state of technology,
renewables are not often cost competitive with traditional power generation derived from fossil fuels

W i l d M e a d o w s W i n d P r o j e c t | 5
such as natural gas. Hence by mandating that a certain portion of energy generation come from
renewable sources, it ensures that a captive buyer will exist for these higher cost sources of electricity.
This approach is needed if the development of renewable energy sources is to be nurtured, encouraged,
and a consistent with NH state policy.
Energy prices vary by fuel source, and vary due to market conditions. Recently, the largest
utilities in the State of Massachusetts recently signed contracts to purchase wind generated electricity at
an average cost of less than eight cents a kilowatt hour. Citing U.S. Energy Information Administration
data, relative energy costs were reported as: 7
Chart 1
Despite what appears to be an emerging cost advantage for wind energy, it is important to note
that a direct cost comparison with fossil fuels such as natural gas is not appropriate. While it is the case
that currently wind is more expensive than natural gas, the two are not substitutes. Because of state
mandates, one megawatt produced from a natural gas plant cannot be substituted for one megawatt
from wind and still meet state standards. The legislative body that represents the citizens of New
Hampshire has determined that there exists a public benefit to having a portion of the electricity used in
7 Ailworth, Erin. Mass. Utilities Go for Wind Power. Boston Globe, September 23, 2013.
0 5 10 15 20 25
Natural Gas
Wind
Hydro
Coal
Nuclear
Solar
Wind-offshore
6.71
8.66
9.03
10.01
10.84
14.43
22.15
Projected Average Costs for 2018
cost per kwh (in cents)

W i l d M e a d o w s W i n d P r o j e c t | 6
the state derived from renewable sources. It is the duly elected representatives of the public who have
already made the determination that those benefits are at least as large as the difference between the
cost of generating electricity from renewable sources and a lower cost alternative.8
The benefit of adding renewables (wind, hydro, biomass, solar), to a mix of energy sources
(natural gas, coal, oil), is articulated in the purpose section of RSA 362-F:
Renewable energy generation technologies can provide fuel diversity to the state and
New England generation supply through use of local renewable fuels and resources that
serve to displace and thereby lower regional dependence on fossil fuels. This has the
potential to lower and stabilize future energy costs by reducing exposure to rising and
volatile fossil fuel prices. The use of renewable energy technologies and fuels can also
help to keep energy and investment dollars in the state to benefit our own economy. In
addition, employing low emission forms of such technologies can reduce the amount of
greenhouse gases, nitrogen oxides, and particulate matter emissions transported into
New Hampshire and also generated in the state, thereby improving air quality and
public health, and mitigating against the risks of climate change. It is therefore in the
public interest to stimulate investment in low emission renewable energy generation
technologies in New England and, in particular, New Hampshire, whether at new or
existing facilities.
It is important to note that RSA 362-F does not mandate that the renewable energy must be produced in
the State of New Hampshire. Because of concerns related around the Interstate Commerce Clause, it is
believed that it is not possible for the NH legislature to mandate that all renewable energy be produced
within state borders to meet statutory mandates. Hence, NH electricity providers are only required to
purchase electricity or RECs within the New England regional market that has emerged for renewable
energy.
What is different about the market for RECs when compared to more traditional markets is that
state legislatures, rather than free markets, can influence the demand and supply for this type of power
8 The relative costs are cited in a study commissioned by the State of NH entitled
“Economic Impact of a New Hampshire Renewable Portfolio Standard,” authored by Ross Gittell and Mark
Magnuson in 2007. The report can be downloaded at:
http://des.nh.gov/organization/divisions/air/tsb/tps/climate/rps.htm

W i l d M e a d o w s W i n d P r o j e c t | 7
generation. For example, a fall in the price of certificates may lead to mandates that increase the
percentages that providers must obtain from renewable sources thereby increasing demand.
Alternatively, various subsidies might be enacted in order to increase supply. Thus states through their
individual mandates along with other conditions in the market for renewable energy can move the price
in one direction or another.
That being said, an increase in supply relative to a particular demand would decrease the price
of electricity produced by renewable energy and hence reduce the price of electricity purchased by the
retail customer all other things being equal. Once again it is important to remember that a megawatt of
wind power does not compete against a megawatt of natural gas electricity unless the utility is prepared
to pay a penalty for not meeting the requirements as specified by state statute. Presumably, the price of
RECs and the associated penalties for not meeting state standards will adjust over the long run so that
from the perspective of the electricity provider, the cost of a megawatt of renewable energy is equal to
the cost per megawatt generated by fossil fuels.
The need for additional generation will become increasingly important if the projections of a
2010 NREL technical report are correct. The Report predicts a renewable energy deficit for New England,
NY and the Mid-Atlantic States by 2015. In New England specifically, deficits are shown historically
(years prior to 2008) and increase in size through 2015 with and without offshore wind. Projected
shortages are about 3,500 GWh in 2010, and range from 7,500 GWh to more than 9,000 GWh in 2015.9
Thus the output from the Wild Meadows project will likely be needed in order to moderate any
price increases associated with projected deficits by 2015. Even without a deficit, increases in the supply
of renewable energy will, other things being equal, put pressure on the price of RECs to fall. Lower REC
9 Bird, Lori, Hurlbut, David, Donohoo, Pearl, Cory, Karlynn and Claire Kreycik. 2010. An Examination of the Regional
Supply and Demand Balance for Renewable Electricity in the United States through 2015.NREL Technical Report
6A2-45041 p. 24

W i l d M e a d o w s W i n d P r o j e c t | 8
prices will reduce the cost to providers of meeting existing portfolio standards and will have a positive
impact on electricity prices for the consumer.
Of course, state legislatures could respond to the increase in renewable generation capacity not
by allowing REC prices to fall, but rather by artificially increasing demand. With growing supplies,
legislatures may respond by raising portfolio standards. This would force electricity providers into the
market to buy an even larger amount of renewable energy or number of certificates. By increasing
purchasing requirements states could maintain a constant price, but alter the mix of renewable and
non-renewable generated electricity that eventually reaches the retail customer.
Altering the mix of energy would further foster the goals of NH’s Energy Policy as stated in RSA
365-F. Alternatively, keeping the mix the same would, given the laws of supply and demand, eventually
lower the price. It is difficult to say therefore which will occur as the result of the Wild Meadows project.
However in either case, there is a social benefit; either by increasing the use of renewal resources, or
through lower prices.
Methodology and Assumptions
A dollar spent in a local economy generally increases the level of economic activity in a local community
by more than a dollar. When a construction worker for example is hired, that person might spend part
of their wages at a local restaurant eating lunch, the restaurant in turn would have hired someone to
prepare and serve the meal and might have purchased the food that they prepared from local farmers.
These individuals in turn would be paid and spend some of their income in the local economy and so on
and so on. This is commonly known as the multiplier effect. Hence when exploring the economic impact
of a project, it is important to understand how much spending will take place in the local economy and
then how many times those dollars are “multiplied” as they are used in a series of subsequent economic
transactions.

W i l d M e a d o w s W i n d P r o j e c t | 9
The use of multipliers is an accepted method for many of the studies that are undertaken at the
local or regional economic level. However, developing these multipliers is not an inconsequential task
and can be very expensive and time consuming. To satisfy this need, off-the-shelf products have
appeared that develop multipliers that can be used at the county level to measure the economic impact
of a development project. One of the most popular products was originally developed by the U.S. Forest
Service and has been subsequently revised and marketed by the IMPLAN Group as part of their IMPLAN
Model. The company has an extensive list of clients that can be found in Appendix A. The multipliers
have also been the basis for a number of published research papers. A casual search on EconLit, the
premier database for publications in the economics profession, reveals the existence of 52 papers using
the IMPLAN multipliers. Also, the IMPLAN multipliers have been used to estimate the economic impact
of a variety of projects in the State of NH. A list of some of these projects can be found in Appendix B.
An early comparison between the IMPLAN multipliers and a popular alternative offered by REMI
showed that there were not significant differences in the predicated outcomes derived from the
benchmarked models.10 A more recent analysis by Brown et. al. estimating the potential economic
impact of a wind facility using an econometric model and then comparing that with the more often used
input-output multiplier model concluded:
Overall, our findings suggest that empirical econometric methods are useful in
measuring the ex post impacts of wind power development. Interestingly, despite a
number of known limitations to the standard application of input–output models to
estimating economic development impacts, our results are of a similar general
magnitude to input–output derived estimated impacts. Though the two sets of results
are not strictly comparable, this suggests that input–output models that are used to
assess the economic impacts of wind energy (at least at the county or local level) may
not be unduly impacted by the generic limitations to those models discussed earlier in
this paper.11
10
Rickman, Dan S. and R. Keith Schwer. 1995. A Comparison of the multipliers of IMPLAN, REMI, and RIMS II:
Benchmarking ready-made models for comparison. The Annals of Regional Science. 29: 363 – 374. 11 Brown, Jason P., Pender, John, Wiser, Ryan, Lantz, Eric, and Ben Hoen. 2012. Ex post analysis of economic
impacts from wind power development in U.S. counties. Energy Economics. 34: 1753.

W i l d M e a d o w s W i n d P r o j e c t | 10
To marry the IMPLAN multipliers with the special financial characteristics associated with a
particular wind project, the Jobs and Economic Development Impacts (JEDI) spreadsheet tool was
developed by the National Renewable Energy Laboratory (NREL).12
The JEDI tool for developing wind
energy models is based on default expenditure patterns derived from a number of studies based on
actual wind projects that enables the modeling of the economic impacts without requiring project
specific data.13 Utilizing state-specific IMPLAN multipliers, JEDI calculates the number of jobs, income
and economic output associated with a particular project. Utilizing default values, JEDI provides an
approximate value of the potential aggregate impacts of a project. However, results can be refined and
approximations improved by utilizing actual project data and county level rather than state level
multipliers.14
It is important to note however that the JEDI tool by itself does not estimate the impact of
anything. It is merely a tool that effectively translates specific financial information related to a
project so that the corresponding IMPLAN multipliers can be used to actually estimate local
economic impacts. Hence the JEDI Model does not really have any economic content associated
with it; it merely organizes financial information to reduce the time that would otherwise be
needed to effectively utilize the IMPLAN multipliers.
In conjunction with the latest version of the JEDI spreadsheet tool (1.10.03), the IMPLAN Model
v. 3.1 was used to construct multipliers that could then be used with the JEDI model. The IMPLAN data
consists of 440 industrial sectors. To use this data with the JEDI Model, the complete list of sectors was
aggregated into 14 sectors. Within each of the 14 sectors, multipliers were constructed to capture
13
The usefulness of the JEDI Model is discussed in the following: 2011 EPA publication: Assessing the Multiple
Benefits of Clean Energy: A Resource for States. EPA-430-R-11-014. 14
A recent application of the JEDI Model along with the IMPLAN multipliers for the purpose of estimating the
economic impact of a wind project can be found in Slattery, Michael C., Lantz, Eric and Becky L. Johnson. 2011.
State and local economic impacts from wind energy projects: Texas case study. Energy Policy 39: 7930 – 7940.

W i l d M e a d o w s W i n d P r o j e c t | 11
direct, indirect and induced spending for employment, labor income and output. Hence a total of 126
multipliers were constructed. In addition to the multipliers, the JEDI model also requires that the ratio of
personal consumption expenditures be constructed for the 14 aggregate categories.
In addition to a user area for entering county level multipliers, the JEDI tool consists of various
other default values that can be changed to generate a more robust set of results. As a result, every
opportunity to supply project specific data was utilized rather than default values. However, the data
format supplied by IBR was more consistent with how a contractor bids a project rather than a reflection
of the existing categories utilized in the JEDI Model. Hence a spreadsheet was developed to create a
correspondence between the data supplied by IBR and the categories contained in the JEDI Model.
Within the model, opportunities for adding project specific information include:
• Project Cost Data
• Annual Operations and Maintenance Costs
• Tax and Lease Parameters
• Payroll Parameters
Project cost data within the JEDI model contains the dollar value of standard cost categories along
with the local share (the degree to which it would be supplied in the local region). Having already
constructed two projects in the State of NH and as a leading provider of wind energy, IBR was able to
provide a detailed estimate of the capital expenditures (CAPEX) associated with the projects. Given past
experience with contractors for the Lempster and Groton wind projects, IBR was able to provide local
share data with respect to the various cost categories.
IBR was also able to supply a detailed estimate of the operating expenditures (OPEX) associated
with the project. Given the ability to achieve some cost savings associated with operating multiple wind
farms in fairly close proximity, the number of jobs and annual operating expenditures are lower than if
Wild Meadows was a stand-alone project.

W i l d M e a d o w s W i n d P r o j e c t | 12
Payments in Lieu of Taxes (PILOT) at the time of writing this report have not been finalized. The
numbers used were based on PILOTs to the two towns in the amount of $835,000 and lease payments
totaling $280,000, using pro-rated actual payments made for the Groton Wind Farm.
The JEDI Model allows the user to change wages and benefits associated with the project. The
default values were not used. Rates were derived from the NH Department of Employment Security
along with those supplied by IBR.
The Economic Impact of the Wild Meadows Project
Results from the JEDI Model are broken down into three categories. These categories include: 1] Project
Development & Onsite Impacts; 2] Local Revenue, Turbine & Supply Chain Impacts; and 3] Induced
Impacts. The sum of these three categories generates the total economic effect of the project. Results
are calculated and reported for two phases: construction and operation. Tables 2 and 3 taken from
Slattery (2011, p. 7933) describe the impacts.

W i l d M e a d o w s W i n d P r o j e c t | 13
Table 2: Construction Period Impacts
Category Label Description Types of Persons and Businesses
Impacted
Project Development and Onsite
Labor Impacts
Impacts from money spent on
labor for persons working to
develop and construct wind
projects
Project managers,
environmental technicians, civil
engineers, legal staff, road
builders, concrete pourers, crane
operators, etc.
Local Revenue, Turbine and
Supply Chain
Impacts resulting from
equipment and turbine
purchases. It includes impacts to
OEMs and the array of suppliers
providing components or other
products for required wind plant
equipment. It also includes
impacts to the finance and
banking sectors.
Turbine, blade and tower
manufacturers, gear
manufacturers, electrical cable
manufacturers, fiberglass and
epoxy producers, steel
producers, quarries,
accountants, etc.
Induced Impacts Impacts from reinvestment and
spending by beneficiaries of
spending and economic activity
in the top two tiers of impacts.
Local retailers, food and
hospitality services, childcare
providers, etc.
Table 3: Operations Period Impacts
Category Label Description Types of Persons and Businesses
Impacted
Onsite Labor Impacts Impacts resulting from money
spent on labor for persons
working to operate, maintain and
manage ongoing plant
operations.
Maintenance technicians,
administrative staff and
managers, etc.
Local Revenue and Supply Chain
Impacts
Impacts from expenditures
related to maintenance, repair,
and general operation activities.
Also includes impacts from land
lease payments, property tax
payments, insurance costs, and
other ongoing expenses.
Repair and replacement parts
manufacturers, tool providers,
local government, local utilities,
insurance providers, welders
and metal fabricators, etc.
Induced Impacts Impacts from reinvestment and
spending by beneficiaries of
spending and economic activity
in the top two tiers of impacts
Local retailers, restaurants,
childcare providers, etc.

W i l d M e a d o w s W i n d P r o j e c t | 14
Within each phase, cumulative results are generated for the amount of economic activity, the number of
jobs, and earnings. All job figures are reported as full-time equivalents (FTE). One FTE is equal to a single
person working full time for 1 year (2080 hours).
With respect to the Wild Meadows Project, the following, Table 4 provides a summary of the
local NH impacts during the construction phase of the project.
Table 4
NH impacts during construction period FTEs Earnings ($M) Output Project Development and Onsite Labor Impacts 80 $6.10 $6.17 Turbine and Supply Chain Impacts 239 $11.82 $25.74 Induced Impacts 84 $3.84 $10.43
Total Impacts 404 $21.77 $42.35
The total number of jobs is estimated to be 404 with turbine and supply chain impacts creating the
majority of employment. Total earnings generated are $21.88 million dollars. The project is estimated to
generate $42.35 million dollars of local economic activity during construction.
The economic benefits generated in the operations phase of the project are shown in Table 5.
Table 5
During operating years (annual) FTEs Earnings ($M) Output Onsite Labor Impacts 4 $0.36 $0.36 Local Revenue and Supply Chain Impacts 4 $0.18 $1.33 Induced Impacts 5 $0.23 $0.62
Total Impacts 13 $0.77 $2.31
With respect to the operations phase, the number of FTEs that result from the project is 13. It would
generate $2.31 million dollars in annual economic activity and contribute $770,000 in income on an
annual basis.
It is important to note that the ongoing jobs created by the Wild Meadows project are very
attractive jobs. Table 6 shows 2012 county level wage rates in Grafton and Merrimack counties for

W i l d M e a d o w s W i n d P r o j e c t | 15
various industries.15 The industries chosen represent both the high and low ends of the wage scale. The
also include those categories that currently have the highest number of jobs. The employment
opportunities that will be created at the Wild Meadows facility would place those employees at the high
end of the scale in both counties.
Table 6
Grafton Merrimack
Annual Average Hourly Annual Average Hourly
Industry Employment Wage Employment Wage
Construction 1,275 $22.41 2,861 $25.93
Manufacturing 5,268 $25.23 5,896 $26.55
Health Care & Social Assistance 10,876 $31.25 11,538 $22.36
Professional & Technical Services 1,852 $41.93 2,839 $33.18
Retail Trade 7,302 $13.19 27,330 $14.94
Accommodation and Food Services 5,127 $9.04 4,459 $8.26
Manager of Company/Enterprise n/a n/a 436 $47.09
Net vs. Gross Effects
Models by definition are nothing more than abstract representations of the real world. Hence
they never perfectly incorporate any and everything found in the actual world. If they did, then by
definition they would not be models (abstract simplifications of the world in which we live). The art of
using models is to determine when these assumptions create potential problems and when they do not
adversely affect the value of the estimates generated. That being said, regardless of how one evaluates
a particular project, any model will be subject to limitations. In terms of the JEDI tool, one of the
assumptions used to simplify the analysis is that the model looks at gross rather than net effects.
The basic structure of any input-output model is based on the premise that positive
expenditures will be multiplied by some other positive number; thereby generating a significantly larger
result in terms of local spending and employment. From this perspective, the JEDI tool with the
15
http://www.nhes.nh.gov/elmi/statistics/documents/county2012.pdf

W i l d M e a d o w s W i n d P r o j e c t | 16
associated IMPLAN multipliers will always show a positive gross impact on the local economy. However,
it may be possible to say that in a full employment economy, the construction of a wind facility will not
lead to any net new jobs, but will merely shift the mix of existing jobs as one is substituted for another.
The same holds true with capital; every dollar used to construct a wind facility is a dollar that could have
been used in a different project that might have generated more jobs or a higher level of economic
activity.
Thus, what is important are the net rather than the gross effects. These net effects would look
at the difference between the next best use of workers or capital and the benefits associated with the
project in question. From this perspective, the positive effects of a proposed project might be less than
the gross effects suggested by the JEDI model and under certain circumstances might even be negative.
When using a model to evaluate the potential economic benefits, results need to be evaluated
and placed within the appropriate economic context. Within the context of the proposed Wild Meadows
Wind Project, it is important to evaluate whether or not sufficient local capacity exists to construct the
facility, unemployed workers exist to operate the plant once it has been constructed, and whether
sufficient capital exists to finance the project without crowding out other and potentially more
worthwhile projects.
NH Labor Markets
In terms of evaluating whether or not sufficient capacity exists in the local economy to supply workers
with the requisite skills to build the wind facility, one can look at the construction sector of the NH
Economy. Using data provided by the Federal Reserve Bank of Boston, one can see that construction
employment is well under its peak in 2006. This can be seen in Table 7.

W i l d M e a d o w s W i n d P r o j e c t | 17
Table 7
Of course, one might argue that those jobs are long gone. Workers have found other employment and
hence the Wild Meadows Wind Project will not generate net new jobs. However, a look once again at
the data for the NH economy shows that while construction jobs have fallen, their loss has been offset
by those in the Tourism and Hospitality Industries.16 This would suggest that some construction workers
may be underemployed.
Underemployment exists when workers with particular skill, experiences, or education cannot
find employment that matches their qualifications. Instead they must accept employment in jobs or
industries that fail to take advantage of their desires or abilities and instead reluctantly accept jobs that
they do not want.
In this case where a large portion of workers are underemployed, the creation of construction
jobs would enable workers to leave lower skilled and paying jobs to accept higher paying construction
ones. Under this scenario, net new jobs would be created because as construction workers leave the
lower paying jobs in which they are currently employed, those who are still without a job would be able
16
Federal Reserve Bank of Boston. 2012. New England Economic Indicators: Fourth Quarter. Downloaded from:
http://www.bostonfed.org/economic/neei/back/2012/q412.pdf
0
5
10
15
20
25
30
35--
----
----
----
----
---…
No
v-9
0
Oct
-91
Sep
-92
Au
g-9
3
Jul-
94
Jun
-95
Ma
y-9
6
Ap
r-9
7
Ma
r-9
8
Feb
-99
Jan
-00
De
c-0
0
No
v-0
1
Oct
-02
Sep
-03
Au
g-0
4
Jul-
05
Jun
-06
Ma
y-0
7
Ap
r-0
8
Ma
r-0
9
Feb
-10
Jan
-11
De
c-1
1
No
v-1
2
NH Construction Employment (seasonally adjusted)

W i l d M e a d o w s W i n d P r o j e c t | 18
to easily enter the market and accept jobs in other industries. Looking at the three major NH
Metropolitan NECTAS where the unemployment rate is significantly above its low point, there appears
to be sufficient slack in the labor market to accommodate the Wild Meadows Project. The NH
unemployment rate can be found in Table 8.
Table 8
Unemployment Rate NH Metropolitan NECTAS (Seasonally Adjusted)
Capital Markets
The other issue when evaluating the gross vs. net effects of the JEDI Model is to look at capital markets.
It could be the case that capital is in short supply and hence a project like Wild Meadows could crowd
out the market; essentially taking capital that can only finance a single project. This could potentially
mean that the construction of the Wild Meadows facility would mean that some other project could not
be financed and hence built. Thus the jobs associated with the Wild Meadows Project might possibly be
offset by a loss of jobs associated with some other project.
To evaluate whether or not capital markets are constrained, it is important to look at two key
economic variables. The first is the amount of commercial loan activity. If commercial banks were
0123456789
----
----
----
----
----
----
---…
No
v-9
0
Oct
-91
Sep
-92
Au
g-9
3
Jul-
94
Jun
-95
Ma
y-9
6
Ap
r-9
7
Ma
r-9
8
Feb
-99
Jan
-00
De
c-0
0
No
v-0
1
Oct
-02
Sep
-03
Au
g-0
4
Jul-
05
Jun
-06
Ma
y-0
7
Ap
r-0
8
Ma
r-0
9
Feb
-10
Jan
-11
De
c-1
1
No
v-1
2
Manchester
Portsmouth
Rochester-Dover

W i l d M e a d o w s W i n d P r o j e c t | 19
making commercial loans at record rates, this might suggest that substantial crowding out might occur.
However, as seen by the data in Table 9, commercial lending is well below the levels set before the 2008
recession.
Table 9
Of course, the ability of banks to make commercial loans depends on the availability of excess reserves.
When a customer makes a deposit at the bank, a portion is held in the form of required reserves and the
remainder is available for loans. Known as excess reserves, they provide a good measure of whether
banks have the capacity to make loans if they choose to do so. The availability of excess reserves can be
found in Table 10.

W i l d M e a d o w s W i n d P r o j e c t | 20
Table 10
After looking at the availability of excess reserves that might be available for bank loans, it is difficult to
conclude that credit markets are capital constrained.
Moreover, it is important to realize that IBR is an international company that will be self-
financing the project and has a large variety of options for deploying its capital. Hence rather than
having a $150 million dollar project generating a large amount of economic activity and creating high
paying jobs here in New Hampshire, those dollars could be used to stimulate a different state’s
economy.17 Rather than assuming that there is another $150 million dollar project waiting in the wings,
17
The importance of U.S. subsidiaries of global companies to the NH Economy is substantial. Insourcing 39,400
jobs, these jobs account for 7.3 percent of the state’s private sector workforce. On a per capita basis, NH ranks
third in the nation in terms of jobs at U.S. subsidiaries. Most important, 44 percent of these jobs are in the higher
paying manufacturing sector of the state’s economy. http://www.ofii.org/resources/jobs-by-state/new-hampshire

W i l d M e a d o w s W i n d P r o j e c t | 21
in all likelihood, a similar development will not take its place to the economic detriment of the towns of
Alexandria and Danbury.
Municipal Benefits
What sets New Hampshire apart from most other states is the lack of broad-based taxes such as
sales and income taxes. However, municipal services must still be provided and in New Hampshire, they
are financed primarily at the local level through property taxes. As a result, the property tax burden is
higher in NH than in almost any other state.18 A relative comparison of property tax impacts taken from
Tax Foundation data can be found in Table 11.
Table 11
Property Taxes on Owner-Occupied Homes (2006-08 averages)
County
Median
Property
Taxes Paid on
Homes Median Home Value
Tax as % of
Home Value
Median
Homeowner
Income
Tax as % of
Income
NH AVG. $ 3,801 $ 228,070 1.69% $ 68,553 5.49%
USA $ 1,854 $192,400 0.96% $ 65,088 2.85%
If we look at the property tax burden in the two towns affected by the Wild Meadows Wind
Project, we see that Alexandria ranks 91, while Danbury comes in at 126 in terms of tax burden when
compared with all of the other municipalities within the State of NH.19 The respective valuations, tax
rates, and tax commitments for 2012 can be found in Table 12:20
Table 12
18
According to the Tax Foundation, NH has the 4th
highest property tax burden per capita of the 50 states.
http://taxfoundation.org/article/state-and-local-property-tax-collections-capita-state-2006-2010 19
These rankings cover 224 municipalities in NH where 1 represents the municipality with the lowest tax burden
and 224 would have the highest. 20
2012 Tax Rate Report downloaded from: http://www.revenue.nh.gov/munc_prop/property-tax-rates-related-
data/2012/documents/2012TaxRateReport.pdf

W i l d M e a d o w s W i n d P r o j e c t | 22
Town Modified Local Assessed
Valuation
2012 Local Tax Rate Tax Commitment
Alexandria $201,326,753 $19.96 $4,018,481.99
Danbury $109,636,331 $23.22 $2,545,934.91
One of the reasons why Alexandria and Danbury are relatively high tax towns is because of their lack of a
commercial tax base. They both rely primarily on residential property tax payers to fund almost all
municipal services and with relatively small populations and large areas, their density is relatively low.
This is shown in Table 13.
Table 13
The Wild Meadows Project proposes that a PILOT will be paid to each town. As of the writing of this
report, it is expected that Alexandria will receive $290,000 in the first year and Danbury $545,000 in the
first year. The amount of property development that would be required to generate the equivalent
amount in tax payments is shown in Table 14.
Table 14
Town Payment Property Value % of Total Property
Value
Alexandria $290,000 $14,529,058 7%
Danbury $545,000 $23,470,135 21%
Town Total
Property
Residential
%
Commercial
%
Other % Population Population
Density
Alexandria 43.0 89.1 2.8 8.1 1543 36 ppl per sq
mile
Danbury 37.4 89.4 7.7 2.9 1138 30 ppl per sq
mile

W i l d M e a d o w s W i n d P r o j e c t | 23
To put this in perspective, assuming an average house value of $250,000, and adhering to traditional
development patterns, the equivalent investment in Alexandria would see only $406,814 dollars in new
commercial real estate development and the construction of 47 homes. In Danbury, with the same
assumptions, the town would see an additional $1,807,200 in commercial development and 84 new
houses. In both towns the potential impact on town budgets and the need to expand municipal services
such as school, police, fire, and road maintenance would be substantial. On the other hand, the
expansion of a commercial tax base to support the provision of municipal services would be relatively
small.
In contrast, the Wild Meadows project is a commercial project which requires no additional
municipal services and hence the funds collected from their respective PILOTS could be used for to
lower the tax commitment in each community; thereby lowering property tax rates. The new potential
tax rates can be found in Table 15.
Table 15
Town New Tax
Commitment
New Tax Rate Tax Rate Change Percentage
Change
Alexandria $3,728,481.99 $18.52 $1.44 8%
Danbury $2,000,934.91 $18.25 $4.97 27%
For a house assessed at $250,000, this would lead to annual property tax savings of $360.11 in
Alexandria and $1,242.71 in Danbury. In the case of Danbury where the savings are about $100 a month,
this may be significant enough to have a positive impact on the value of housing in the community.
Property values are in part influenced by the demand for housing. The demand for housing is to
a large extent dependent on the income and borrowing capacity of the buyer. Within the market for
mortgages, strict standards exist for qualifying borrowers. The sum of the borrower’s monthly payment
for the mortgage, real estate taxes, and insurance must meet certain income requirements. Since many

W i l d M e a d o w s W i n d P r o j e c t | 24
buyers are credit constrained, the monthly payment rather than the price of the house determines
whether or not they can purchase a particular property. A savings of $100 a month in property taxes
represents the equivalent of $10,000 in property value at an interest rate of 4%. In other words, the
purchase price can be $10,000 higher and the payment will remain the same when the monthly
property tax payment is reduced by $100.
Hence, lower property taxes will create movement for housing prices to appreciate over the
long run. However, even if the payments in lieu of taxes are not used for tax reduction, they can still
have a positive impact on real estate prices. Potential real estate buyers are attracted by a variety of
factors. For example, the quality of the educational system relative to other towns in an area may
increase the demand for housing. Thus even if the payments in lieu of taxes are not used for tax
reduction, they may be spent in a way that increases the desirability of a town and hence increases the
demand for real estate.
Of course this captures the special nature of the NH real estate market that is heavily
influenced by real estate taxes. The important question is whether or not the benefit in terms of
property tax reduction or an increase in municipal services is offset by a corresponding reduction in
property values arising from the construction of the wind facility. Exploring the question of whether or
not the construction of wind facilities has an impact on property values, Hoen et. al. (2011) constructed
a study using 7459 sales of single family homes between 1996 – 2007 surrounding 24 existing wind
facilities.21 Applying four different hedonic models, and a variety of robustness tests, they determined
that neither the view nor distance to facilities had a statistically significant effect on sales prices.22
21
Hoen, Ben, Wiser, Ryan, Cappers, Peter, Thayer, Mark and Gautam Sethi. 2011. Wind Energy Facilities and
Residential Properties: The Effect of Proximity and View on Sales Prices. JRER 33(3): 279 – 316.
22 There have not been a large number of studies evaluating the effect of wind facilities on property values. Of
those that currently exist, many have not been published in peer reviewed journals. That being said, hedonic
valuation models currently represent the “gold standard” because they enable the researcher to control for

W i l d M e a d o w s W i n d P r o j e c t | 25
An even more recent study by Hoen et. al. (2013) found no statistically significant effects on real
estate valued. Their study used the same hedonic modeling techniques with data from over 50,000 real
estate transactions among 27 counties covering nine states. Evaluating home sales within a 10 mile
radius of 67 different wind facilities (including 1198 homes within one mile of a turbine) they conclude
that “the core results of our analysis consistently show no sizeable statistically significant impact of wind
turbines on nearby property values.”23
However, it is important to note that many of the studies exploring the potential effects of the
development of a wind facility on property values fail to take into account is the fact that property is not
just a physical space, but it is also a bundle of property rights. Land owners have the right to develop
their property within the limitations imposed by local zoning ordinances. Hence when calculating the
potential effect of a particular development project, the appropriate comparison is not between the
proposed project and the value of the attributes associated with an undeveloped plot of land. One
needs to look instead at some of the potential alternate development projects that might take place on
a particular piece of land.
For example, suppose the next highest and best use of a property would be to construct a
mountain top resort with 150 guest rooms and various amenities. This type of commercial development
will need to have roads built, parking lots constructed, a building large enough to house and take care of
a large number of guests and other amenities such as a pool. Thus when looking at the potential impact
of the development of a wind facility, the appropriate comparison is not the consequence of a road
leading to a wind turbine versus no road at all. Rather, it would be comparing the incremental effect of
various potential effects, thereby isolating those particular characteristics relevant to the question being
investigated.
23 Hoen, Ben, Brown, Jason P., Jackson, Thomas, Wiser, Ryan, Thayer, Mark and Peter Cappers. 2013. A Spatial
Hedonic Analysis of the Effects of Wind Energy Facilities on Surrounding Property Values in the United States.
Ernest Orland Lawrence Berkeley National Laboratory. LBNL-6362E.

W i l d M e a d o w s W i n d P r o j e c t | 26
that road versus the road and corresponding parking lot that might be built with the development of a
resort.
As long as a parcel of land is not in conservation, the owner has the right to develop the
property. Hence the appropriate comparison is between one development proposal relative to the next
best development opportunity that exists given the set of property rights associated with a particular
parcel. This is consistent with the practices followed by professional appraisers. The value of a raw piece
of land is not determined by what currently exists, but rather, is valued in terms of its highest and best
use. The same holds true when comparing various development scenarios. Thus the true impact is not to
evaluate the existence of a wind project relative to undeveloped land, but instead, to what might be
otherwise developed on the same parcel.
Conclusion
A characteristic of wind power is that it is very site specific. Small increases in wind speed can lead to
large increases in wind energy. In New England, the best locations are typically mountain ridges and
shorelines. NREL estimated in 2010 that only 1.78% of the available land in NH is suitable for developing
wind power at a capacity factor in excess of 30% at 80 meters.24
Despite the physical challenges posed by the geography of the State of New Hampshire, the
General Court and previous Governor have decided on multiple occasions that renewable energy is the
future of the State and that wind can play an important role in reducing the State’s dependence on fossil
fuels. The benefits of an alternate energy strategy have already been debated and policy has been
formulated to encourage the development of the State’s potential to generate wind power.
The benefits to the state are clear. The positive economic impacts will be large and continue
throughout the life of the project. These impacts are found first in the construction phase which will
24
The spreadsheet showing wind potential can be downloaded at http:// Error! Hyperlink reference not valid.

W i l d M e a d o w s W i n d P r o j e c t | 27
create the full time equivalent of 404 jobs, $21.77 million dollars in earnings and $42.35 million dollars
in increased economic activity, and second in the operations phase with the creation of 13 full time
equivalent jobs, $770,000 in annual income and $2.31 million dollars of increased economic activity
each and every year for the life of the project.
The benefits to the host communities are equally impressive. With a small commercial tax base,
both Alexandria and Danbury will receive substantial payments in lieu of taxes that can be used to
reduce already high property taxes or improve/expand municipal services. While alternative
investments may exist for the rest of the state, for these two municipalities, it is the best opportunity for
reducing the tax burden on already stressed homeowners.

W i l d M e a d o w s W i n d P r o j e c t | 28
Appendix A
The following is indicative of the wide range of organizations that use the IMPLAN system, but is not
meant to be a comprehensive list.
Agricultural Statistics Service
Animal & Plant Health Inspection Service
Argonne National Laboratory
Army Corp of Engineers
Bureau of Ocean Energy Management
Bureau of Economic Analysis
Bureau of Land Management
Bureau of Reclamation
Department of Agriculture Rural Development
Department of Transportation
Economic Research Services
Environmental Protection Agency
Federal Reserve Bank
Fish & Wildlife Service
Forest Service
Geological Survey
National Marine Fisheries Service
National Park Service
Natural Resources Conservation Service
Pacific Fishery Management Council
Sandia National Laboratories
AK Department of Fish & Game
AR Department of Economic Development
AZ Department of Commerce
CA Department of Fish and Game
CA Department of Transportation
CA Department of Water Resources
CA State Water Resources Control Board
CO Department of Labor & Employment
CT Department of Community and Economic Development
CT Department of Labor
CT Economic Resource Center
DE Economic Development Office
FL Department of Environmental Protection
FL Agency for Workforce Innovation
FL Fish & Wildlife Conservation Commission
FL Governor's Office
FL Labor Market Statistics
FL Legislature
FL Office of Tourism: Visit Florida
IN Department of Workforce Development
KY Cabinet for Economic Development

W i l d M e a d o w s W i n d P r o j e c t | 29
LA Department of Wildlife & Fisheries
MD Department of Business & Economics
MD Department of Natural Resources
MD Department of Transportation
ME Office of Rural Health
ME State Planning Office
MI Department of Natural Resources- Forest Mgmt Division
MN Department of Agriculture Marketing Section
MN Department of Economic Security
MN Department of Natural Resources
MN Economic Development Center
MN Office of Legislative Auditor
MO Department of Economic Development
MO Department of Health & Human Services
MS Department of Forestry
MS Institutions of Higher Learning
MT Department of Commerce
MT Department of Labor & Industry
NC Department of Commerce
NC Division Marine Fisheries
NE Department of Economic Development
NE Department of Revenue
NM Department of Agriculture
NV Department of Conservation & Water
NY Department of Labor
NY Office of the State Comptroller
OH Department of Development
OK Department of Commerce
OR Department of Forestry
OR Economic Development
SC Employment Security
SC State Office of Rural Health
TX Forest Service
TX Water Development Board
UT Division of Parks & Recreation
UT Office of Planning and Budget
VA Department of Forestry
VA Employment Commission
WA Department of Revenue
WA Department of Transportation
WI Department of Transportation
WI Department of Workforce Development
WV Development Office
Albany State University
Arizona State University
Arkansas State University
Armstrong Atlantic State University

W i l d M e a d o w s W i n d P r o j e c t | 30
Auburn University
Augusta State University
Bowling Green State University
California Polytechnic State University
California State University, Chico
California State University, Sacramento
Calvin College
Citadel College
Clarion State College
Clemson University
Cleveland State University
Coastal Carolina University
College of William & Mary
Colorado State University
Columbia University
Cook College Rutgers University
Cornell University
Creighton University
Duke University
Eastern New Mexico University
Eastern Washington University
Elon College
Flathead Valley Community College
Florida Gulf Coast University
Florida International University
Florida State University
Gardner-Webb University
George Mason University
George Washington University
Georgia State University
Georgia Tech.
Hamline University
Humboldt State University
Idaho State University
Indiana University, South Bend
Iowa State University
Louisiana State University
Marshall University
Michigan State University
Middle Tennessee State University
Mississippi State University
Montana State University
National University System
New Mexico State University
New School University
Nicholls State University
NLH Agricultural University of Norway
Nord-Trondelag - Distriktshogskole, Norway

W i l d M e a d o w s W i n d P r o j e c t | 31
North Carolina State University
Northeast Louisiana University
Northern Arizona University
Northern Illinois University
Northwest Nazarene University
Ohio State University
Oklahoma State University
Old Dominion University
Penn State University
Presbyterian College
Purdue University
Rutgers University
Salisbury University
San Diego State University
SE Missouri State University
Shippensburg University
Sonoma State University
South Dakota State University
Southern Illinois University
Southern University
Southern Utah University
State University of New York, Buffalo
Tennessee State University
Texas A&M International University
Texas A&M University
Texas A&M University-Commerce
Texas A&M University-Kingsville
Texas Tech University
Troy State University
University of Alabama
University of Arizona
University of Arkansas, Fayetteville
University of Arkansas, Little Rock
University of Baltimore
University of California, Berkeley
University of California, Riverside
University of California, Santa Barbara
University of Colorado
University of Colorado, Colorado Springs
University of Connecticut
University of Delaware
University of Florida
University of Georgia
University of Hawaii, Manoa
University of Idaho
University of Illinois, Champaign
University of Illinois, Chicago
University of Illinois, Springfield

W i l d M e a d o w s W i n d P r o j e c t | 32
University of Kansas
University of Kentucky
University of Louisville
University of Massachusetts, Amherst
University of Massachusetts, Dartmouth
University of Memphis
University of Minnesota
University of Minnesota, Duluth
University of Mississippi
University of Missouri, Columbia
University of Missouri, St. Louis
University of Montana
University of Nebraska
University of Nebraska, Omaha
University of Nevada, Reno
University of New Hampshire
University of New Mexico
University of North Carolina, Chapel Hill
University of North Carolina, Charlotte
University of North Carolina, Greensboro
University of North Dakota
University of Northern Arizona
University of Northern Iowa
University of Northern Texas
University of Notre Dame
University of Oklahoma
University of Rhode Island
University of Richmond
University of San Diego
University of South Carolina
University of South Florida
University of Southern California
University of Southern Colorado
University of Southern Indiana
University of Southern Mississippi
University of Tennessee
University of Texas, Austin
University of Texas, El Paso
University of Texas, Pan American
University of Texas, San Antonio
University of Toledo
University of Vermont
University of West Florida
University of Wisconsin Center, Rock County
University of Wisconsin, Madison
University of Wisconsin, Whitewater
University of Wyoming
Utah State University

W i l d M e a d o w s W i n d P r o j e c t | 33
Virginia Commonwealth University
Virginia State University
Virginia Tech
Washington State University
Washington State University, Puyallup
West Virginia University
West Washington University
Western Carolina University
Western Illinois University
Wingate University
Woods Hole Oceanographic Institute
Alpena Regional Medical Center
Asheville Chamber of Commerce
Association of Bay Area Governments
Center for Labor & Community Research
Chattanooga Area Chamber of Commerce
City of El Paso Economic Development
City of Lubbock
City of Virginia Beach
Greater Austin Chamber of Commerce
Greater Omaha Chamber of Commerce
Greater Phoenix Economic Council
Lower Colorado River Authority
Maricopa Association of Governments
Mass. League of Comm Health Centers
National Indian Gaming Association
Nebraska Public Power District
Neighborhood Reinvestment Corporation
Northeastern Pennsylvania Alliance
Nuclear Energy Institute
Orange County Business Council
Sacramento Area COG
San Diego Association of Governments
Sarasota County Government
Southern California Association of Governments
St. Louis Reg. Commerce & Growth
Suffolk County Legislature
Tampa Bay Regional Planning Council
Tennessee Hospital Association
Union of Concerned Scientists

W i l d M e a d o w s W i n d P r o j e c t | 34
AECOM
Applied Development Economics
Battelle Pacific NW Labs
BBC Research
Beacon Hill Institute
Booz, Allen and Hamilton
Cambridge Systematics
CC Benefits
CDM Smith
CH2M Hill
Charles River Associates
Chmura Economics & Analytics
CIC Research
Coopers & Lybrand LLP
CSL International
Dames and Moore
Dean Runyan Associates
Deloitte & Touche LLP
Dornbusch & Co
Duke Power Co.
E.D.Hovee & Company
ECO Northwest
Ecology and Environment, Inc.
Economic Development Research Group
Economic Research Associates
Elliott D. Pollack & Company
EMSI
Energy and Environmental Engineering
Environmental Sciences Associates
Ernst and Young LLP
ESI Corporation
Foster Wheeler Environmental Corp.
Hazen & Sawyer
HLB Decision Economics, Inc.
Hobson Ferrarini Associates
HVS Convention,Sport&Entertainment
ICF Kaiser
Jack Faucett Associates
Jones and Stokes, Assoc., Inc.
KPMG Peat Marwick LLP
Mangi Environmental Group

W i l d M e a d o w s W i n d P r o j e c t | 35
McDowell Group
National Economic Research Associates, Inc.
Neenan Associates
NorthStar Economics
PriceWaterhouseCoopers
Public Sector Consultants
Robert Charles Lesser & Co. Sage Policy Group, Inc.
SAIC
Sparks Companies Inc.
Strategic Advisory Group
Tetra Tech, Inc.
The Concord Group
URS Corporation

W i l d M e a d o w s W i n d P r o j e c t | 36
APPENDIX B
Selected local studies using the IMPLAN multipliers
New England Cable and Telecommunications Associate Inc. 2011. Connecting New Hampshire: Cable’s
Impact on the State’s Economy.
Defense Technology Initiative. 2012. The New England Defense Industry: Current Profile and Economic
Significance.
MaineDOT. 2005. Economic Benefits of Amtrak Downeaster Service.
Foundation for Healthy Communities, NH Hospital Association and National Center for Rural Health
Works. 2009. The Economic Impact of Hospital Systems in New Hampshire
NH Manufacturing Extension Partnership (NH MEP). The Economic Impacts of the New Hampshire
Extension Partnership Program on the New Hampshire Economy.
American Petroleum Institute. 2013. The Economic Impacts of the Oil and Gas Industry on the U.S.
Economy in 2011: Employment, Labor Income and Value Added.
The Society for the Protection of New Hampshire Forests. 1999. The Economic Impact of Open Space in
New Hampshire.
Outdoor Industry Foundation. 2006. The Active Outdoor Recreation Economy: a $730 billion annual
contribution to the U.S. Economy.
Pease Development Authority. 2013. Main Wharf Expansion.
Town of Peterborough. 2002. Master Plan
New Hampshire Lakes Association. 2003. Estimates of Select Economic Values of New Hampshire Lakes,
Rivers, Streams and Ponds - Phase II Report.
New Hampshire Healthy Families Campaign. 2003. The Fiscal and Economic Impacts of Increasing the
Tobacco Tax in New Hampshire.
NH Camp Directors Association. 2008. The Economic Impact of the Camp Industry on the State of New
Hampshire.