WIEB Webinar: System Flexibility and Data-Driven Thermal ...
30
WIEB Webinar: System Flexibility and Data-Driven Thermal Operating Limits Western Interstate Energy Board May 29, 2019 1
Transcript of WIEB Webinar: System Flexibility and Data-Driven Thermal ...

WIEB Webinar: System Flexibility and
Data-Driven Thermal Operating Limits
Western Interstate Energy Board
May 29, 2019
1

Western Interstate Energy Board 2
Presenters
• Debbie Lew• Senior Technical Director at GE Energy Consulting
• Austin Park• Graduate Student and Researcher at Stanford University

Confidential. Not to be copied, distributed, or reproduced without prior approval.
Integrating Variable Renewables: Reducing PminDebbie LewSenior Technical Director, GE Energy ConsultingMay 29, 2019

Confidential. Not to be copied, reproduced, or distributed without prior approval.
CAUTION CONCERNING FORWARD-LOOKING STATEMENTS:This document contains "forward-looking statements" – that is, statements related to future events that by their nature address matters that are, to different degrees, uncertain. For details on the uncertainties that may cause our actual future results to be materially different than those expressed in our forward-looking statements, see http://www.ge.com/investor-relations/disclaimer-caution-concerning-forwardlooking-statements as well as our annual reports on Form 10-K and quarterly reports on Form 10-Q. We do not undertake to update our forward-looking statements. This document also includes certain forward-looking projected financial information that is based on current estimates and forecasts. Actual results could differ materially. to total risk-weighted assets.]
NON-GAAP FINANCIAL MEASURES:In this document, we sometimes use information derived from consolidated financial data but not presented in our financial statements prepared in accordance with U.S. generally accepted accounting principles (GAAP). Certain of these data are considered “non-GAAP financial measures” under the U.S. Securities and Exchange Commission rules. These non-GAAP financial measures supplement our GAAP disclosures and should not be considered an alternative to the GAAP measure. The reasons we use these non-GAAP financial measures and the reconciliations to their most directly comparable GAAP financial measures are posted to the investor relations section of our website at www.ge.com. [We use non-GAAP financial measures including the following:• Operating earnings and EPS, which is earnings from continuing operations excluding non-service-related pension costs of our principal pension plans.• GE Industrial operating & Verticals earnings and EPS, which is operating earnings of our industrial businesses and the GE Capital businesses that we expect to retain.• GE Industrial & Verticals revenues, which is revenue of our industrial businesses and the GE Capital businesses that we expect to retain.• Industrial segment organic revenue, which is the sum of revenue from all of our industrial segments less the effects of acquisitions/dispositions and currency exchange.• Industrial segment organic operating profit, which is the sum of segment profit from all of our industrial segments less the effects of acquisitions/dispositions and currency exchange.• Industrial cash flows from operating activities (Industrial CFOA), which is GE’s cash flow from operating activities excluding dividends received from GE Capital.• Capital ending net investment (ENI), excluding liquidity, which is a measure we use to measure the size of our Capital segment.• GE Capital Tier 1 Common ratio estimate is a ratio of equity
Integrating Variable Renewables: Reducing Pmin21 May 2019

Confidential. Not to be copied, distributed, or reproduced without prior approval.
Wind and solar integration requires
May 21, 2019 3
Flexibility accommodates the variability and uncertainty of variable renewables
Source: US Dept of Energy Wind Program

Confidential. Not to be copied, distributed, or reproduced without prior approval.
What is Pmin and why is it important?
May 21, 2019 4
Pmin is the minimum generation level of a generator
Source: Lew et al, 2013 https://www.nrel.gov/docs/fy13osti/55588.pdf
All the coal plantsare running atPmin (as low asthey can go)

Confidential. Not to be copied, distributed, or reproduced without prior approval.
Why plant owners don’t want low Pmin
5
Impacts on power plant:• Wear-and-tear costs: more frequent maintenance or repairs
• Emissions impacts, potential for emissions to be unstable at very low Pmin
• (Note NREL study found that while there are costs and emissions impacts, they are far outweighed by the benefits of integrating additional renewables https://www.nrel.gov/docs/fy13osti/55588.pdf )
Plant profitability:
• Capital expenditure for upgrade may be required for plant to provide more flexibility
• Lower Pmin may lead to reduced revenues in the energy market

Confidential. Not to be copied, distributed, or reproduced without prior approval.
Examples of systems that have low Pmin
May 21, 2019 6
• Hawaiian Electric Company reduced Pmin below 30% and has demonstrated 5.6%
• Denmark – thermal (CHP) plants can run down to Pmin of 10%
• Public Service of Colorado reduced Pmin of Comanche 3 from 67% to 54% (http://info.aee.net/hubfs/EPA/AEEI-Renewables-Grid-Integration-Case-Studies.pdf )
• NREL case study of coal plant that frequently ran below 20% and could go to 12.5% for 6 hours (https://www.nrel.gov/docs/fy14osti/60575.pdf )
• Ireland – new ancillary service (synchronous inertial response, which is ratio of kinetic energy over Pmin) incentivized low Pmin


Data-driven generating unit parameters
An effort of WIDAP, WIEB, and GEAustin Park, Maury Galbraith, Debra Lew, Scott Jespersen, and Sally Benson

WIDAPWestern Interconnection Data Analytics Project
We use public grid data to create free tools, analyze how the Western Interconnection has changed, and guide discussion on its future.
Toolkit Analysis
bitsandwatts.stanford.edu/widap
WIDAP map
● Rich display of electricity
emissions and generation data
for 2001 - 2018
● Includes coal and gas plants > 25
MW in the Western
Interconnection
web.stanford.edu/group/widap/unit_level_dashboard.html
WIDAP dashboard
● Detailed plots of each generation
unit in the Western
Interconnection
● Plots reveal efficiency, modes of
operation, equipment upgrades,
emissions controls, and much
more.
How are renewables affecting the fossil fleet?
Emissions intensityHow flexible have they revealed themselves to be?
Generator limits
Gov’t regulates SO2 and NO
x,
not CO2. See the difference.
Emissions trendsHow is the grid interacting and changing?
Grid as a whole
Funded by the Global Climate & Energy Project, Western Interstate Energy Board, and Stanford Bits & Watts.
Today’s topic

Flavors of Pmin
● Generating units say they are operating in red when they put out less than this level of power.
● Because this is tied to fuel price, its true value fluctuates.
● There was previously no way to verify this number.
● Now we can use the data-driven method presented in previous slides to put an upper bound on this number.
● In extreme weather, security emergencies, or other equipment failure, units can turn down lower than their economic Pmin
● This is closer to the true physical limitations of the plant.
3
Economic Emergency
Sources: 1. https://www.nrel.gov/docs/fy10osti/47434.pdf2.https://www.xcelenergy.com/staticfiles/xe/PDF/Attachment%20AKJ-2.pdf

How has Pmin been estimated in the past?
4
● Call up the plant operator● Look at the spec sheet● Assume a reasonable number
Sources: 1. https://www.mhps.com/products/gasturbines/lineup/m501j/2.ttps://www.ge.com/content/dam/gepower-pgdp/global/en_US/documents/product/gas%20turbines/Fact%20Sheet/2018-prod-specs/GEA32937A%20LM2500_Power_Plants_R2.pdf
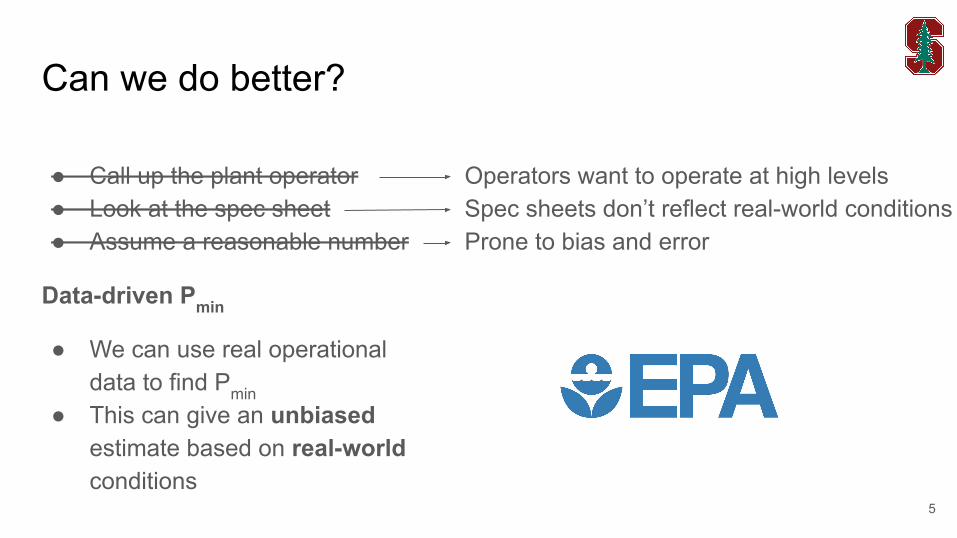
Can we do better?
5
● Call up the plant operator● Look at the spec sheet● Assume a reasonable number
Data-driven Pmin
● We can use real operational data to find Pmin
● This can give an unbiased estimate based on real-world conditions
Operators want to operate at high levelsSpec sheets don’t reflect real-world conditionsProne to bias and error

Data-driven Pmin methodology
6
1. Look at each hour when the unit was on. Count up hours spent at each power output level.
2. Draw a smooth line over those counts.
3. Find the top of the smooth line’s first significant hill.
4. Return the power output at that hilltop.
Humboldt Bay, Unit 1 | 54 MW Gas

7
A few examplesHumboldt Bay, Unit 1 | 54 MW Gas Arapahoe, Unit 1 | 44 MW Coal

Pmin estimates can change over time. Use the smallest.
8
Intermountain, Unit 1SGA | 980 MW coal Huntington, Unit 1 | 513 MW coal
9
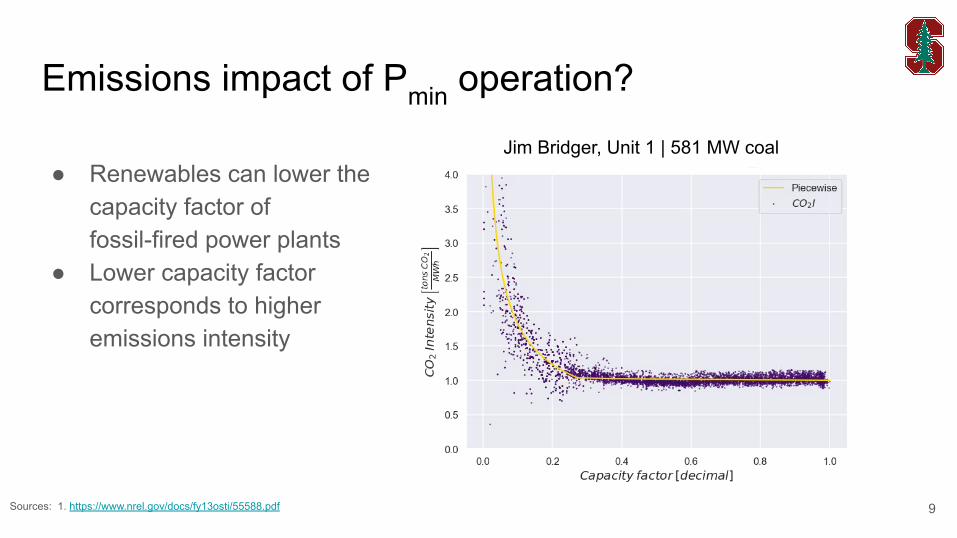
● Renewables can lower the capacity factor of fossil-fired power plants
● Lower capacity factor corresponds to higher emissions intensity
Jim Bridger, Unit 1 | 581 MW coal
Sources: 1. https://www.nrel.gov/docs/fy13osti/55588.pdf
Emissions impact of Pmin operation?

10
● So far, the emissions impact is very low for two reasons:
1. Power plants spend barely any time at Pmin.
2. Emissions intensity at Pmin rarely exceeds the optimal emissions intensity by more than 3X.
Emissions impact of Pmin operation?Not substantial.
Sources: 1. https://www.nrel.gov/docs/fy13osti/55588.pdf
Jim Bridger, Unit 1 | 581 MW coal

11
● So far, the emissions impact is very low for two reasons:
1. Power plants spend barely any time at Pmin.
2. Emissions intensity at Pmin rarely exceeds the optimal emissions intensity by more than 3X.
Emissions impact of Pmin operation?Not substantial.
Sources: 1. https://www.nrel.gov/docs/fy13osti/55588.pdf
Jim Bridger, Unit 1 | 581 MW coal

12
Comparison to WECC Anchor Data Set 2.2
● A number less than one indicates the data-driven Pmin estimation is lower than WECC’s estimate.
● Most estimates are similar (close to one), but some are much lower.
● Estimates greater than one can be ignored. The data-driven method gives an upper bound.

13
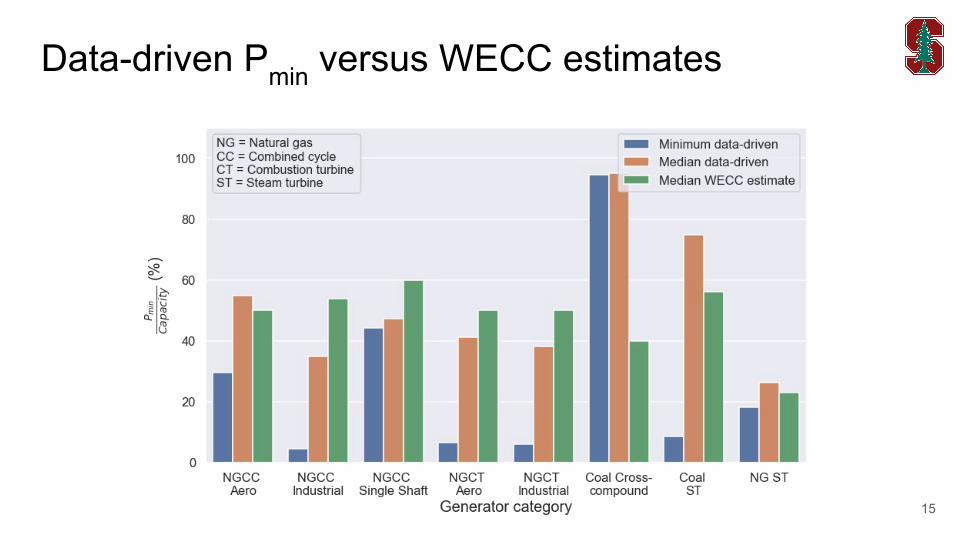
Taking it a step fartherThe minimum Pmin among the same category of generating units can be used for all units in that category.
1. Say three NGCC Aero generating units had the following Pmin values:
20 MW 80 MW 35 MW
2. And the following nameplate capacities:
100 MW 150 MW 120 MW
3. Then Pmin for all units of this type would be:
20/100 MW 80/150 MW 35/120 MW
20% 53.3% 29.2%

14
The smallest Pmin in each category is stable
15
Data-driven Pmin versus WECC estimates

Policy recommendations
● Use data-driven Pmin values in grid planning at the following levels:
○ Interconnection: WECC reliability planning○ ISO: Transmission planning process○ DSO: Integrated resources planning
● Better reflect physical capabilities of grid● Dramatically reduce cost of planning a
clean, cheap, and reliable grid
● Use data-driven Pmin values in daily dispatch of all balancing areas.
● Dramatically increase system flexibility with zero upfront cost
● No ratepayer cost● Reduce renewable curtailment
16
Planning Operations

Pmin values for each unit in the Western Interconnection will be posted soon!
● We will follow up with the link to the Pmin’s by email.● Check out WIDAP’s tools for more resources
○ Map: https://energy.stanford.edu/widap○ Dashboard: http://web.stanford.edu/group/widap/unit_level_dashboard.html
17
Thank you for listening!
Western Interstate Energy Board 3
Thank You
Fall 2019 Joint CREPC-WIRAB MeetingSan Diego, CA
October 7-9, 2019
Webinar recording will be available at:
https://westernenergyboard.org/category/webinars/

Appendix
18

Mathematical explanation:
a. Filter for positive power output [MW]b. Fit a kernel density estimator to get a
continuous probability density function (pdf) and cumulative distribution function (cdf).
c. Find each peak in the pdf.d. Choose the smallest peak that conforms to
two constraints:
19
Humboldt Bay, Unit 1 (gas)
1. Pmin > 0.05 * Pmax2. PDF(Pmin) - PDF(baseline) > 0.03 * PDFmax
Data-driven Pmin methodology

EPA’s public Air Markets Program Data (AMPD)
20
● Temporal range: 2001-2018● Spatial range: US. WIDAP focuses only on the Western Interconnection● Temporal granularity: Hourly until July 1, 2017. Then 2-hour data.● Spatial granularity: Generating unit● Data generated with continuous emissions monitoring systems (CEMS)● Every fossil fuel-fired electric generation unit > 25 MW● Consumption, emissions, generation, operational, and location data, and
labeling● Available here: https://ampd.epa.gov/ampd/