Width of Gene Expression Profile Drives Alternative Splicing · Width of Gene Expression Profile...
13
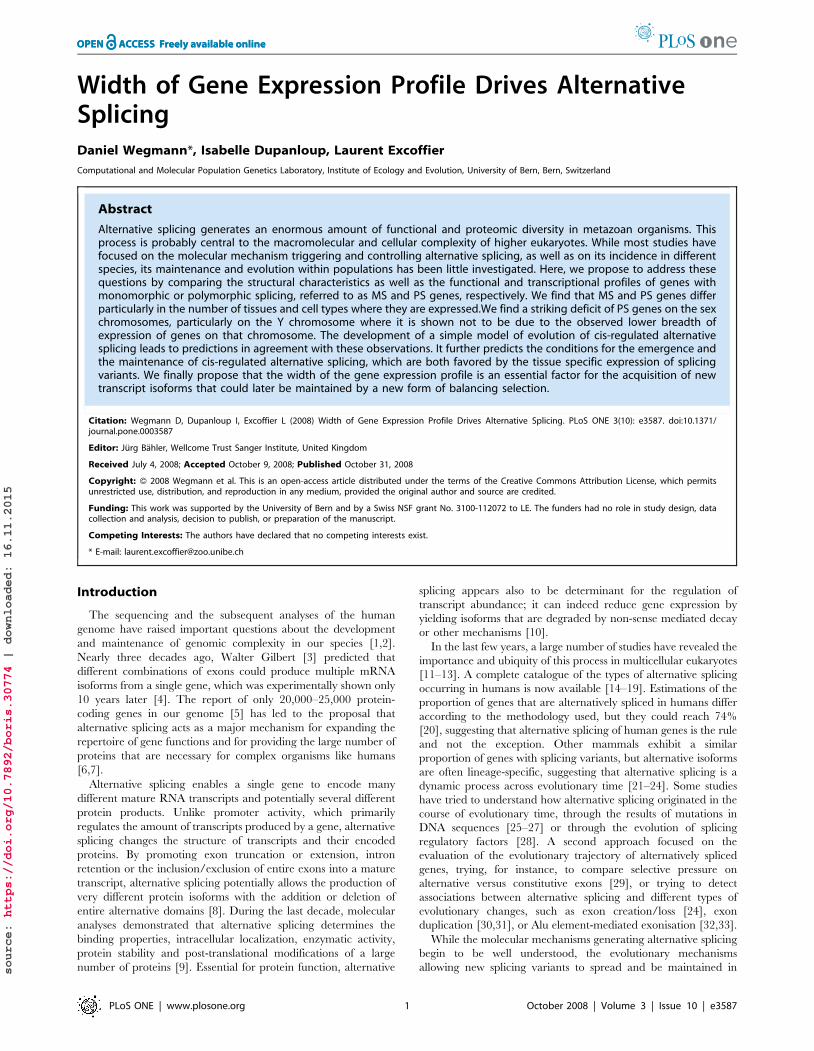
Width of Gene Expression Profile Drives Alternative Splicing Daniel Wegmann*, Isabelle Dupanloup, Laurent Excoffier Computational and Molecular Population Genetics Laboratory, Institute of Ecology and Evolution, University of Bern, Bern, Switzerland Abstract Alternative splicing generates an enormous amount of functional and proteomic diversity in metazoan organisms. This process is probably central to the macromolecular and cellular complexity of higher eukaryotes. While most studies have focused on the molecular mechanism triggering and controlling alternative splicing, as well as on its incidence in different species, its maintenance and evolution within populations has been little investigated. Here, we propose to address these questions by comparing the structural characteristics as well as the functional and transcriptional profiles of genes with monomorphic or polymorphic splicing, referred to as MS and PS genes, respectively. We find that MS and PS genes differ particularly in the number of tissues and cell types where they are expressed.We find a striking deficit of PS genes on the sex chromosomes, particularly on the Y chromosome where it is shown not to be due to the observed lower breadth of expression of genes on that chromosome. The development of a simple model of evolution of cis-regulated alternative splicing leads to predictions in agreement with these observations. It further predicts the conditions for the emergence and the maintenance of cis-regulated alternative splicing, which are both favored by the tissue specific expression of splicing variants. We finally propose that the width of the gene expression profile is an essential factor for the acquisition of new transcript isoforms that could later be maintained by a new form of balancing selection. Citation: Wegmann D, Dupanloup I, Excoffier L (2008) Width of Gene Expression Profile Drives Alternative Splicing. PLoS ONE 3(10): e3587. doi:10.1371/ journal.pone.0003587 Editor: Ju ¨rg Ba ¨hler, Wellcome Trust Sanger Institute, United Kingdom Received July 4, 2008; Accepted October 9, 2008; Published October 31, 2008 Copyright: ß 2008 Wegmann et al. This is an open-access article distributed under the terms of the Creative Commons Attribution License, which permits unrestricted use, distribution, and reproduction in any medium, provided the original author and source are credited. Funding: This work was supported by the University of Bern and by a Swiss NSF grant No. 3100-112072 to LE. The funders had no role in study design, data collection and analysis, decision to publish, or preparation of the manuscript. Competing Interests: The authors have declared that no competing interests exist. * E-mail: [email protected] Introduction The sequencing and the subsequent analyses of the human genome have raised important questions about the development and maintenance of genomic complexity in our species [1,2]. Nearly three decades ago, Walter Gilbert [3] predicted that different combinations of exons could produce multiple mRNA isoforms from a single gene, which was experimentally shown only 10 years later [4]. The report of only 20,000–25,000 protein- coding genes in our genome [5] has led to the proposal that alternative splicing acts as a major mechanism for expanding the repertoire of gene functions and for providing the large number of proteins that are necessary for complex organisms like humans [6,7]. Alternative splicing enables a single gene to encode many different mature RNA transcripts and potentially several different protein products. Unlike promoter activity, which primarily regulates the amount of transcripts produced by a gene, alternative splicing changes the structure of transcripts and their encoded proteins. By promoting exon truncation or extension, intron retention or the inclusion/exclusion of entire exons into a mature transcript, alternative splicing potentially allows the production of very different protein isoforms with the addition or deletion of entire alternative domains [8]. During the last decade, molecular analyses demonstrated that alternative splicing determines the binding properties, intracellular localization, enzymatic activity, protein stability and post-translational modifications of a large number of proteins [9]. Essential for protein function, alternative splicing appears also to be determinant for the regulation of transcript abundance; it can indeed reduce gene expression by yielding isoforms that are degraded by non-sense mediated decay or other mechanisms [10]. In the last few years, a large number of studies have revealed the importance and ubiquity of this process in multicellular eukaryotes [11–13]. A complete catalogue of the types of alternative splicing occurring in humans is now available [14–19]. Estimations of the proportion of genes that are alternatively spliced in humans differ according to the methodology used, but they could reach 74% [20], suggesting that alternative splicing of human genes is the rule and not the exception. Other mammals exhibit a similar proportion of genes with splicing variants, but alternative isoforms are often lineage-specific, suggesting that alternative splicing is a dynamic process across evolutionary time [21–24]. Some studies have tried to understand how alternative splicing originated in the course of evolutionary time, through the results of mutations in DNA sequences [25–27] or through the evolution of splicing regulatory factors [28]. A second approach focused on the evaluation of the evolutionary trajectory of alternatively spliced genes, trying, for instance, to compare selective pressure on alternative versus constitutive exons [29], or trying to detect associations between alternative splicing and different types of evolutionary changes, such as exon creation/loss [24], exon duplication [30,31], or Alu element-mediated exonisation [32,33]. While the molecular mechanisms generating alternative splicing begin to be well understood, the evolutionary mechanisms allowing new splicing variants to spread and be maintained in PLoS ONE | www.plosone.org 1 October 2008 | Volume 3 | Issue 10 | e3587 source: https://doi.org/10.7892/boris.30774 | downloaded: 16.11.2015
Transcript of Width of Gene Expression Profile Drives Alternative Splicing · Width of Gene Expression Profile...
Width of Gene Expression Profile Drives AlternativeSplicingDaniel Wegmann*, Isabelle Dupanloup, Laurent Excoffier
Computational and Molecular Population Genetics Laboratory, Institute of Ecology and Evolution, University of Bern, Bern, Switzerland
Abstract
Alternative splicing generates an enormous amount of functional and proteomic diversity in metazoan organisms. Thisprocess is probably central to the macromolecular and cellular complexity of higher eukaryotes. While most studies havefocused on the molecular mechanism triggering and controlling alternative splicing, as well as on its incidence in differentspecies, its maintenance and evolution within populations has been little investigated. Here, we propose to address thesequestions by comparing the structural characteristics as well as the functional and transcriptional profiles of genes withmonomorphic or polymorphic splicing, referred to as MS and PS genes, respectively. We find that MS and PS genes differparticularly in the number of tissues and cell types where they are expressed.We find a striking deficit of PS genes on the sexchromosomes, particularly on the Y chromosome where it is shown not to be due to the observed lower breadth ofexpression of genes on that chromosome. The development of a simple model of evolution of cis-regulated alternativesplicing leads to predictions in agreement with these observations. It further predicts the conditions for the emergence andthe maintenance of cis-regulated alternative splicing, which are both favored by the tissue specific expression of splicingvariants. We finally propose that the width of the gene expression profile is an essential factor for the acquisition of newtranscript isoforms that could later be maintained by a new form of balancing selection.
Citation: Wegmann D, Dupanloup I, Excoffier L (2008) Width of Gene Expression Profile Drives Alternative Splicing. PLoS ONE 3(10): e3587. doi:10.1371/journal.pone.0003587
Editor: Jurg Bahler, Wellcome Trust Sanger Institute, United Kingdom
Received July 4, 2008; Accepted October 9, 2008; Published October 31, 2008
Copyright: � 2008 Wegmann et al. This is an open-access article distributed under the terms of the Creative Commons Attribution License, which permitsunrestricted use, distribution, and reproduction in any medium, provided the original author and source are credited.
Funding: This work was supported by the University of Bern and by a Swiss NSF grant No. 3100-112072 to LE. The funders had no role in study design, datacollection and analysis, decision to publish, or preparation of the manuscript.
Competing Interests: The authors have declared that no competing interests exist.
* E-mail: [email protected]
Introduction
The sequencing and the subsequent analyses of the human
genome have raised important questions about the development
and maintenance of genomic complexity in our species [1,2].
Nearly three decades ago, Walter Gilbert [3] predicted that
different combinations of exons could produce multiple mRNA
isoforms from a single gene, which was experimentally shown only
10 years later [4]. The report of only 20,000–25,000 protein-
coding genes in our genome [5] has led to the proposal that
alternative splicing acts as a major mechanism for expanding the
repertoire of gene functions and for providing the large number of
proteins that are necessary for complex organisms like humans
[6,7].
Alternative splicing enables a single gene to encode many
different mature RNA transcripts and potentially several different
protein products. Unlike promoter activity, which primarily
regulates the amount of transcripts produced by a gene, alternative
splicing changes the structure of transcripts and their encoded
proteins. By promoting exon truncation or extension, intron
retention or the inclusion/exclusion of entire exons into a mature
transcript, alternative splicing potentially allows the production of
very different protein isoforms with the addition or deletion of
entire alternative domains [8]. During the last decade, molecular
analyses demonstrated that alternative splicing determines the
binding properties, intracellular localization, enzymatic activity,
protein stability and post-translational modifications of a large
number of proteins [9]. Essential for protein function, alternative
splicing appears also to be determinant for the regulation of
transcript abundance; it can indeed reduce gene expression by
yielding isoforms that are degraded by non-sense mediated decay
or other mechanisms [10].
In the last few years, a large number of studies have revealed the
importance and ubiquity of this process in multicellular eukaryotes
[11–13]. A complete catalogue of the types of alternative splicing
occurring in humans is now available [14–19]. Estimations of the
proportion of genes that are alternatively spliced in humans differ
according to the methodology used, but they could reach 74%
[20], suggesting that alternative splicing of human genes is the rule
and not the exception. Other mammals exhibit a similar
proportion of genes with splicing variants, but alternative isoforms
are often lineage-specific, suggesting that alternative splicing is a
dynamic process across evolutionary time [21–24]. Some studies
have tried to understand how alternative splicing originated in the
course of evolutionary time, through the results of mutations in
DNA sequences [25–27] or through the evolution of splicing
regulatory factors [28]. A second approach focused on the
evaluation of the evolutionary trajectory of alternatively spliced
genes, trying, for instance, to compare selective pressure on
alternative versus constitutive exons [29], or trying to detect
associations between alternative splicing and different types of
evolutionary changes, such as exon creation/loss [24], exon
duplication [30,31], or Alu element-mediated exonisation [32,33].
While the molecular mechanisms generating alternative splicing
begin to be well understood, the evolutionary mechanisms
allowing new splicing variants to spread and be maintained in
PLoS ONE | www.plosone.org 1 October 2008 | Volume 3 | Issue 10 | e3587
source: https://doi.org/10.7892/boris.30774 | downloaded: 16.11.2015
populations have received less attention. For instance, it is still
unclear if and how alternative splicing can be maintained by
selection, or if it is just a transient state before the fixation of a new
selectively neutral transcript form by genetic drift. If selection was
involved in its maintenance, genes where splicing is polytypic (PS
genes) should have different functional properties than genes
where it is monotypic (MS genes). In an attempt to better
understand the evolutionary forces promoting and maintaining
alternative splicing, we created a database of human genes with
and without splicing variants, and documented the characteristics,
functional properties and expression profiles of these two types of
genes. Since several studies have shown that point mutations in
splice sites, splicing enhancers or silencers, may generate splicing
variants for single genes [25–27], we developed a theoretical
model of cis-regulated alternative splicing .This simple model
allows us to predict the conditions for the emergence and
maintenance of alternative splicing variants for genes expressed
in several tissues.
Methods
Database of human genes with and without splicingvariants
Using the gene set of the ENSEMBL database (http://www.
ensembl.org/index.html, version 33.35f [34]), which corresponds
to a total of 21,999 protein-coding genes, we classified these genes
into two different categories: genes monotypic (referred here as
MS genes) or polytypic (referred here as PS genes) for splicing.
This classification was done by cross-validating the information
available in the ENSEMBL dataset and the AltSplice component
of the ASD-EBI database (http://www.ebi.ac.uk/asd/, release 2
[16]). The ENSEMBL annotation reports information on
alternative transcripts for its genes set, but it does not directly
provide data related to alternative splicing events and isoform
splicing patterns for the included genes. We therefore comple-
mented it with information taken from the AltSplice database,
which is generated by an automated computational pipeline
involving the comparison of EST/mRNA alignments with
genomic sequences [16]. It is important to note that AltSplice
uses Ensembl genes as the starting genes set for deriving splicing
patterns, and it is therefore intrinsically associated with the
Ensembl annotation of alternate transcripts.
It should also be noted that the AltSplice dataset only contains
information relative to splicing events and not to splicing variants
or transcript isoforms. Alternative splicing events lead to the
occurrence of a new splicing variant. They are defined as (a) exon
(or intron) isoforms where the use of alternative donor or acceptor
splice sites leads to the truncation or the extension of exons (or
introns); (b) intron retention where an intronic region is not spliced
out; (c) cassette exons where an entire exon is seen in some
transcripts but not in others; and (d) mutual exclusive exons events
where the splice isoforms contain one or the other of an exon pair.
Even if events and variants are clearly associated, we were not able
to describe splicing variants (i.e. transcript isoforms for PS genes),
because variants can differ from each other by several events.
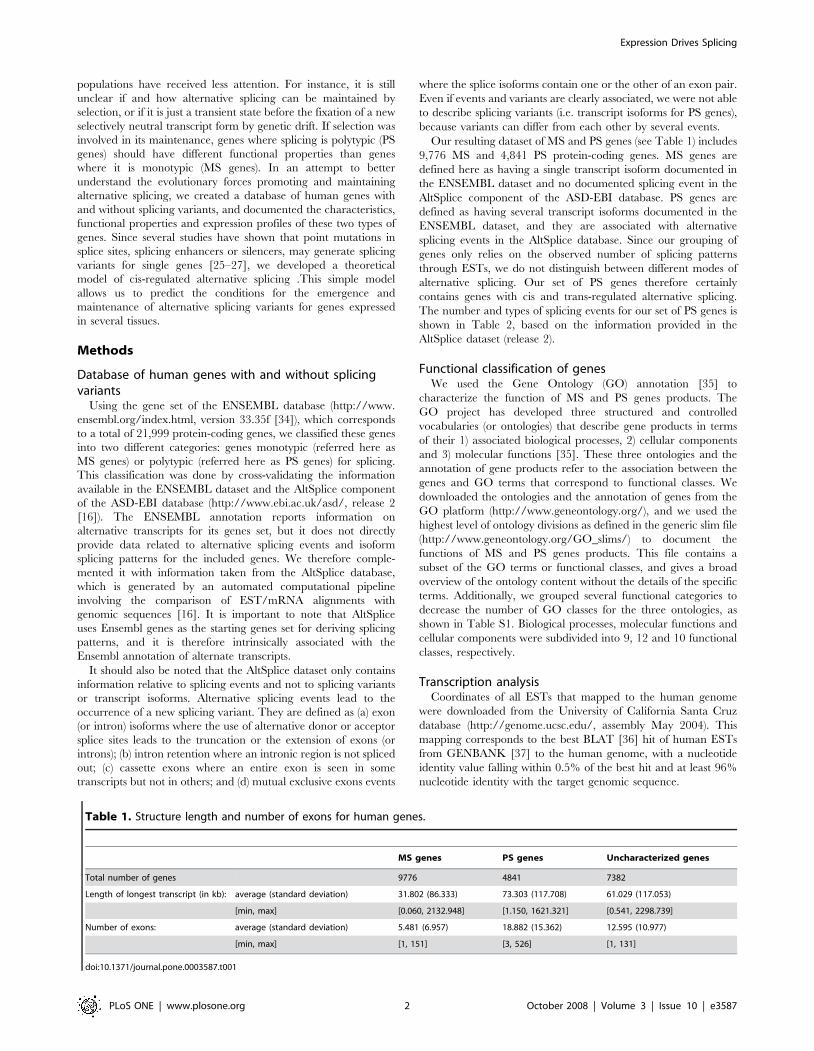
Our resulting dataset of MS and PS genes (see Table 1) includes
9,776 MS and 4,841 PS protein-coding genes. MS genes are
defined here as having a single transcript isoform documented in
the ENSEMBL dataset and no documented splicing event in the
AltSplice component of the ASD-EBI database. PS genes are
defined as having several transcript isoforms documented in the
ENSEMBL dataset, and they are associated with alternative
splicing events in the AltSplice database. Since our grouping of
genes only relies on the observed number of splicing patterns
through ESTs, we do not distinguish between different modes of
alternative splicing. Our set of PS genes therefore certainly
contains genes with cis and trans-regulated alternative splicing.
The number and types of splicing events for our set of PS genes is
shown in Table 2, based on the information provided in the
AltSplice dataset (release 2).
Functional classification of genesWe used the Gene Ontology (GO) annotation [35] to
characterize the function of MS and PS genes products. The
GO project has developed three structured and controlled
vocabularies (or ontologies) that describe gene products in terms
of their 1) associated biological processes, 2) cellular components
and 3) molecular functions [35]. These three ontologies and the
annotation of gene products refer to the association between the
genes and GO terms that correspond to functional classes. We
downloaded the ontologies and the annotation of genes from the
GO platform (http://www.geneontology.org/), and we used the
highest level of ontology divisions as defined in the generic slim file
(http://www.geneontology.org/GO_slims/) to document the
functions of MS and PS genes products. This file contains a
subset of the GO terms or functional classes, and gives a broad
overview of the ontology content without the details of the specific
terms. Additionally, we grouped several functional categories to
decrease the number of GO classes for the three ontologies, as
shown in Table S1. Biological processes, molecular functions and
cellular components were subdivided into 9, 12 and 10 functional
classes, respectively.
Transcription analysisCoordinates of all ESTs that mapped to the human genome
were downloaded from the University of California Santa Cruz
database (http://genome.ucsc.edu/, assembly May 2004). This
mapping corresponds to the best BLAT [36] hit of human ESTs
from GENBANK [37] to the human genome, with a nucleotide
identity value falling within 0.5% of the best hit and at least 96%
nucleotide identity with the target genomic sequence.
Table 1. Structure length and number of exons for human genes.
MS genes PS genes Uncharacterized genes
Total number of genes 9776 4841 7382
Length of longest transcript (in kb): average (standard deviation) 31.802 (86.333) 73.303 (117.708) 61.029 (117.053)
[min, max] [0.060, 2132.948] [1.150, 1621.321] [0.541, 2298.739]
Number of exons: average (standard deviation) 5.481 (6.957) 18.882 (15.362) 12.595 (10.977)
[min, max] [1, 151] [3, 526] [1, 131]
doi:10.1371/journal.pone.0003587.t001
Expression Drives Splicing
PLoS ONE | www.plosone.org 2 October 2008 | Volume 3 | Issue 10 | e3587

We identified all ESTs that align with a genomic sequence
overlapping with an MS or a PS gene. For each mapping of an
EST to a gene, we assigned an evidence for transcription for the
corresponding gene. The transcription profiles of MS and PS
genes were then established by linking mapped ESTs to the eVOC
ontology [38] through the annotations of cDNA library sources in
eVOC version 2.7. The expression profiles of the MS and PS
genes were obtained for each of the four core eVOC ontologies
(Anatomical System, Cell Type, Developmental Stage and
Pathology). Analyses and comparisons between genes were
performed by considering the first level of the eVOC hierarchy,
which is shown in Table S2. Anatomical Systems, Cell Types,
Developmental Stages and Pathologies were divided into 12, 31, 6
and 9 transcriptional classes, respectively. In Table S2, we only
report the transcriptional classes defined in the first level of the
eVOC for which expression of MS and PS genes have been found.
Conservation of splicing patterns in mouseWe built a dataset of MS and PS genes in mouse using the same
procedures as in humans. We used the mouse genes set of the
ENSEMBL database (version 33.34a), which corresponds to a
total of 24,741 protein-coding genes, and, as before, the AltSplice
component of the ASD-EBI database (release 2 [16]). The
resulting dataset for mouse (Table 2) corresponds to 13,565 MS
genes, and 3,422 PS genes. The number and distribution of
splicing events for mouse PS genes is shown in Table 2.
Orthologous relationships between human and mouse genes
were inferred using the information provided by the ENSEMBL
consortium. We first downloaded the list of human and mouse
homologous genes from EnsMart version 33 [39]. Homologous
genes represent the best reciprocal BLAST hits for the two species
with additional pairs obtained by a combination of BLAST and
location information for closely related species, such as human and
mouse. We then defined as orthologous genes the pairs of human
and mouse genes labeled as UBRH (Unique Best Reciprocal Hit) or
RHS (Reciprocal Hit based on Synteny information) by ENSEMBL.
We then classified the 16,938 orthologous gene pairs in 4 categories
(MS and PS genes in the 2 species) according to our database of MS
and PS genes in humans and mice. A total of 6,738 gene pairs were
characterized for splicing ability in the two species.
Results
Chromosomal and splicing events distributionsThe distribution of the identified 9,776 MS and 4,841 PS genes
in the human genome among chromosomes is significantly
different (x2 = 118.4, df = 23, p,0.001, Figure 1), with a clear
deficit of PS genes on the Y chromosome, and to a lesser extent on
the X chromosome as well. PS genes also tend to be much longer
on average than MS genes, with a larger transcript length
(73.3 Kb vs. 31.8 Kb) and a larger number of exons (18.9 vs. 5.5,
see Table 1). This difference is observed for all chromosomes
(Figure S1A and S1AB)
PS genes show on average 5.6 splicing events but this number is
highly variable (s.d. = 6.3, Table 2) Around 23% of PS genes show
only 1 splicing event and the distribution of the number of splicing
events per gene is skewed towards low numbers (Figure S2A).
Some genes are characterized by a large number (.50) of distinct
events. An example is the CD44 gene, encodeing a cell-surface
glycoprotein, involved in cell-cell interactions, cell adhesion and
migration, which participates in a wide variety of cellular functions
including lymphocyte activation, hematopoiesis, and tumor
metastasis [40]. For this gene, alternative splicing participates to
the structural and functional diversity of the protein, with many
variants involved in a broad range of human cancers [41]. As
reported previously [42], cassette exon events outnumber the other
event types for human genes (Table 2). More than 80% of PS
Table 2. Number of splicing events for PS genes in humans and mice.
PS genes (human) PS genes (mouse)
Total number of genes 4841 3422
Number of splicing events: mean1 (standard deviation) 5.554 (6.324) 3.899 (4.005)
[min, max] [1, 70] [1, 59]
Cassette exons: proportion of genes2 80.15% 70.11%
mean (standard deviation) 2.928 (3.151) 2.246 (2.302)
[min, max] [1, 57] [1, 34]
Exon isoforms: proportion of genes2 46.56% 43.37%
mean (standard deviation) 1.840 (1.540) 1.515 (1.067)
[min, max] [1, 16] [1, 14]
Intron isoforms: proportion of genes2 63.87% 64.17%
mean (standard deviation) 2.386 (2.371) 1.889 (1.514)
[min, max] [1, 29] [1, 15]
Intron retention: proportion of genes2 28.86% 20.46%
mean (standard deviation) 2.055 (1.985) 1.667 (1.283)
[min, max] [1, 30] [1, 12]
Mutual exclusive exon: proportion of genes2 12.04% 7.10%
mean (standard deviation) 1.947 (2.175) 1.609 (2.439)
[min, max] [1, 23] [1, 33]
1Mean number of splicing events per gene.2Proportion of genes showing the corresponding type of splicing variants.doi:10.1371/journal.pone.0003587.t002
Expression Drives Splicing
PLoS ONE | www.plosone.org 3 October 2008 | Volume 3 | Issue 10 | e3587

genes indeed show at least one cassette exon and the distribution of
the number of cassette exons for human genes is less skewed than
the distribution of the other event types (Figure S2A).
Gene functionWe compared MS and PS genes for their Gene Ontology (GO),
which is actually generally better defined for PS than for MS genes
in the three GO ontologies (biological process: determined for
47.51% of MS vs. 73.35% of PS genes, molecular function:
determined for 51.60% of MS vs. 81.08% of PS genes, cellular
component: determined for 47.22% of MS vs. 71.12% of PS
genes). We find that the distributions of the number of functional
classes for MS and PS genes products are significantly different
(Figure 2A and Figure S3). PS genes products are clearly involved
in a larger number of distinct biological processes (x2 = 995.2,
df = 7, p,0.001, Figure 2A and Figure S3A), they perform a larger
number of molecular functions (x2 = 150.4897, df = 5, p,0.001,
Figure S3B), and they are associated with or located in more
cellular components than MS genes products (x2 = 1042.3, df = 6,
p,0.001, Figures 2A and S3C). We also observe a significant
correlation between the number of functional classes for MS and
PS genes products when performing a pairwise comparison of the
Figure 1. Chromosomal distribution of MS and PS genes in humans. A. Contrast between the distributions of MS (white bars) and PS genes(black bars) across chromosomes, which are significantly different (x2 = 118.387, df = 23, p,0.001). B. Chromosomal distribution of genes that cannotbe assigned ot the MS or PS categories. The ratio of uncharacterized genes on the total number of ENSEMBL genes (grey dashed line) isapproximately constant across chromosomes. The ratio of PS genes on MS genes (black dotted line) clearly drops for the Y chromosome and to alesser extent for the X chromosome.doi:10.1371/journal.pone.0003587.g001
Expression Drives Splicing
PLoS ONE | www.plosone.org 4 October 2008 | Volume 3 | Issue 10 | e3587

Figure 2. Functional classification and expression profiles of MS (white bars and circles) and PS (black bars and circles) genes inhumans. A. Functional classification of genes according to the GO ontology. Note that a gene may be associated with more than one function andhence may belong to more than one functional group. The chart shows a clear and positive relationship between the number of distinct biologicalprocesses and the number of cellular components in which gene products are involved. Top (right): histogram of the number of distinct biologicalprocesses (cellular components) for MS and PS genes. The list of cellular components and biological processes is shown in Figure S4. B. Expressionprofiles of MS and PS genes in humans using ESTs and the eVOC ontology. The chart shows a clear and positive relationship between the number ofdistinct anatomical systems and the number of cell types in which the genes are expressed. Top (right): histogram of the number of distinctanatomical systems (cell types) for MS and PS genes. The cell types and the list of anatomical systems are given in Table S2. The circle areas areproportional to the number of genes. Information for MS and PS genes is shown in white and black, respectively.doi:10.1371/journal.pone.0003587.g002
Expression Drives Splicing
PLoS ONE | www.plosone.org 5 October 2008 | Volume 3 | Issue 10 | e3587

three GO ontologies (as shown in Figure 2A and Table S3). PS
genes thus show a wider functional profile than MS genes. We can
also detect several differences in the distribution of genes among
functional classes (Figure S4). MS genes are, for instance, enriched
in biological processes related to the response to a stimulus and
they are also more involved in signal transducer activity (Figure
S4). In contrast, PS genes are more often involved in the regulation
of biological processes, and in catalytic activities (Figure S4).
Expression profileWe have analyzed the transcription pattern of MS and PS genes
using EST databases and the eVOC ontology (see Methods). As
seen in Table 3, we could assign ESTs to nearly all PS genes
whereas direct evidence for transcription was only found for less
than 80% of MS genes. We were thus able to characterize the
expression profile in each of the four core eVOC ontologies for
.91% of PS genes and for 50–60% of MS genes.
The transcription profile of PS genes is found much wider than
that of MS genes (Figure 2B and Figure S5). PS genes are indeed
expressed in a larger number of distinct anatomical systems
(x2 = 2120.39, df = 11, p,0.001, Figure 2B and Figure S5A), cell
types (x2 = 1386.81, df = 22, p,0.001, Figure 2B and Figure S5B),
development stages (x2 = 1710.46, df = 5, p,0.001, Figure S5C)
and pathologies (x2 = 1926.54, df = 7, p,0.001, Figure S5D) than
MS genes. They also present additional differences in their spatial
and temporal pattern of expression, as well as in the types of
pathologies in which they are involved (see Figure S6). We find an
overall significant correlation between the width of expression of
MS and PS genes when comparing transcription evidence across
the different eVOC ontologies (see Figure 2B and Table S4). This
is in line with the results of a previous study [43] showing that
different genes belonging to a given biological process (GO
category) have a specific breadth of expression (number of tissues
where a gene is expressed), suggesting that some cellular functions
are more ubiquitous than others. Interestingly, we also observe a
positive and significant correlation between the number of splicing
events in PS genes and the width of their expression profile
(Figure 3).
Conservation of splicing patterns in mouseUsing the same approach as in humans, we identified 13,565
MS and 3,422 PS genes in the mouse genome. The proportion of
PS genes is slightly lower in mice than in humans, an observation
which is consistent with earlier reports [44]. Like in humans, we
observe a significant deficit of PS genes on the sex chromosomes
(x2 = 117.1, df = 19, p,0.001, Figure S7 A), with a striking
absence of PS genes on the Y chromosome. Transcript length and
number of exons are also found much smaller for MS than for PS
genes (Figure S7 A and B). The distribution of the number and
type of splicing events per mice gene is very similar to that
obtained in humans (Table 2, Figure S2). The large majority of
genes (around 92%) show less than 10 splicing events, but a few
genes are characterized by a large number (.30) of distinct events.
Among them the CNOT2 gene, which encodes a transcription
factor which directs the formation of a diverse array of neurons
and glia in the developing brain [45].
Several studies have looked at the conservation of splicing
events between humans and mice, leading sometimes to
contradictory results [46–49]. In our approach, we first identified
orthologous relationships between human and mouse genes (see
Methods), and then classified orthologous genes according to their
splicing polymorphism in both species, based on our database of
MS and PS genes in humans and mice. Orthologs in humans and
mice tend to belong to the same splicing class (MS or PS, Fisher
exact test of homogeneity, p,0.001, Table 4), showing a
conservation of these categories for the genes of these two
mammals. When comparing splicing events in human and mice
PS genes, we note a significant correlation between the numbers of
observed events in the two species (r = 0.231, p,0.001, Figure
S8A), but these events differ qualitatively (Figures S8B and S8C).
In other words, PS genes with many splicing events also tend to
have a large number of isoforms in mice, but the splicing variants
are different, which suggests a rapid turnover of transcript isoforms
in mammalian history. These results are compatible with a
previous study [49], which showed a highly restricted phylogenetic
distribution of splicing events in mammals.
Model of cis-regulated alternative splicingWhile the proportion of genes among our set of PS genes with
cis-regulated alternative splicing is unknown, we introduce here a
simple model for the evolution of cis-regulated alternative splicing.
Our goal is to describe the fate of splicing variants under the action
of selection once they have appeared in a large population, and to
monitor the fitness of the population as a function of allele
frequencies, splicing variant fitness and expression levels. We shall
not consider here the molecular mechanisms that generate new
splicing variants for individual genes, since these processes have
received much attention elsewhere [25–27]. Our evolutionary
model will however allow us to state the conditions for the
maintenance of existing splicing variants in populations, and
therefore the maintenance of alternative splicing per se.
We consider here a simple model of cis-regulated alternative
splicing, where a given gene has two alleles coding for two distinct
splicing variants labeled P1 and P2. Our model thus strictly
accounts for a cis regulation of alternative splicing since allelic
(nucleotide) differences are supposed to fully specify the two
different transcript isoforms (see e.g. [25–27] for examples of cis-
determination of splicing variants). We further assume that the two
splicing variants show different expression levels and have different
associated fitness in two arbitrary tissues T1 and T2. Relative
expression levels in these tissues are noted as aij, and splicing
variant specific fitness as vij, such that, for instance, a12 is the
expression level of protein 2 in tissue 1, and v21 is the fitness of
protein 1 in tissue 2. Note that for simplicity, we shall assume the
two variants are the only expressed transcripts, such that
ai1+ai2 = 1 for each tissue. The tissues T1 and T2 are also supposed
to contribute by a proportion b and 12b, respectively, to the
global fitness of an individual.
Under this model, the fitness of the homozygotes P1 P1 and P2
P2 are simply given by vP = bv11+(12b)v21 and
vQ = bv12+(12b)v22, respectively, while the fitness of the hetero-
zygotes is vH = b[a11v11+(12a11)v12]+(12b)[(12a22)v21+
Table 3. Expression evidence for human genes.
MS genes PS genesUncharacterizedgenes
Total number of genes 9776 4841 7382
ESTs assigned 7801 (79.8%) 4834 (99.9%) 7277 (98.6%)
Anatomical system 6135 (62.%) 4815 (99.5%) 7171 (97.6%)
Cell Type 4854 (49.7%) 4654 (96.1%) 6736 (91.3%)
Development stage 5506 (56.3%) 4787 (98.9%) 7052 (95.5%)
Pathology 6073 (62.1%) 4815 (99.5%) 7164 (97.1%)
doi:10.1371/journal.pone.0003587.t003
Expression Drives Splicing
PLoS ONE | www.plosone.org 6 October 2008 | Volume 3 | Issue 10 | e3587

a22v22]. With this formulation, the evolution of allelic frequencies,
and thus the evolution of alternative splicing, in (infinitely) large
populations can be studied by classical equations of deterministic
selection. For instance the fitness of the population at a given point
in time is obtained classically as v = p2vP+2p(12p)vH+(12p)2vQ
where p is the frequency of the P1 allele, and an equilibrium
frequency for P1 can be derived by solving dv/dp = 0, leading
classically to pe = (vH2vQ)/(2vH2vP2vQ) or
pe~ba11Dv1{ 1{bð Þa21Dv2
b a11{a12ð ÞDv1z 1{bð Þ a22{a21ð ÞDv2ð1Þ
where Dv1 = v112v12 and Dv2 = v212v22, which shows that
equilibrium frequency only depends on the difference in fitness
between the two splicing variants in both tissues, and not on
absolute fitness values.
Fitness landscapeAn examination of the fitness landscape in a few particular
cases is instructive, as it can reveal if selection will promote the
fixation of a new variant, or if alternative splicing can be
maintained by (balancing) selection, and, if yes, what are the
conditions favoring this maintenance. In Figure 4, we show the
fitness of the population as a function of the frequency of the
splicing variant P1, and its specificity a11 for tissue T1. In
Table 4. Conservation of splicing ability for genes betweenhuman and mouse.
Human dataset
MS genes PS genes
Mouse dataset MS genes 3517 1154
PS genes 606 1461
Orthologs in humans and mice tend to belong to the same splicing class (Fisherexact test of homogeneity, p,0.001).doi:10.1371/journal.pone.0003587.t004
Figure 3. Box plot of the pattern of gene expression as a function of the number of splicing events for PS genes in humans. Thenumber of anatomical systems is shown in light grey and the number of cell types is indicated in dark grey. The width of the boxes is proportional tothe square-root of the number of genes in each group. The correlation between the number of splicing events and the width of the expressionprofile for PS genes is highly significant (anatomical systems: r = 0.224, p,0.001; cell types: r = 0.238, p,0.001).doi:10.1371/journal.pone.0003587.g003
Expression Drives Splicing
PLoS ONE | www.plosone.org 7 October 2008 | Volume 3 | Issue 10 | e3587

Figure 4A, we report a case where the two variants are expressed
at a similar level in tissue T2 (a22 = 0.5), and where the two
splicing variants have maximal fitness in different tissues. Here
the fitness of the population is maximized when a11 = 1, which
corresponds to the case where P1 is the only variant expressed in
tissue T1. Interestingly, selection maintains a balanced polymor-
phism of the two splicing variants at pe = 0.5 for large values of
a11, while disruptive selection prevails for low values of a11. In
Figure 4B, the conditions are identical except that the variant P2
is much more expressed than P1 in tissue T2 (a22 = 0.9), which
leads to a larger portion of the landscape where balancing
selection can occur. For complex cases, with unequal contribu-
tion of different tissues to the individual fitness, tissue specificity
for P2 in T2 and asymmetric relative fitness components, the
fitness landscape can be extremely different depending on the
specific values of the parameters. Figure 4C represents a case of
directional selection, preventing the form P1 to increase in
frequency, mainly because v12.v21. Under the same conditions
as in Figure 4C, but this time with v12,v21, the landscape
becomes more complex, and P1 can increase in frequency and go
to fixation or reach a stable equilibrium depending on the value
of a11 (Figure 4D).
Figure 4. Population fitness landscape (z-axis) as a function of the frequency (p) of the alternative splicing variant P1, and itsspecificity for tissue T1 (a11). See text for the definition of the other parameters.doi:10.1371/journal.pone.0003587.g004
Expression Drives Splicing
PLoS ONE | www.plosone.org 8 October 2008 | Volume 3 | Issue 10 | e3587

Evolution of tissue specificityThe population fitness v can be expressed as a linear
combination of the tissue specificities a11 and a22 as v= c1a11+c2a22+c3, where c1 = 2p(12p)b(v112v12), c2 = 2p(12p)
(12b)(v222v21), and c3 = b(v12+p2(v112v12))+(12b)(v21+(12p)2
(v222v12)). It shows that the population fitness is maximized
when the two splicing variants are not expressed in the same tissue
(when a11 = 1 and a22 = 1), irrespective of the other parameters
and splicing variant frequencies. It suggests that if splicing variant
expression is free to evolve in different tissues, selection should
promote tissue specific expression.
Fate a new alternative splicing variantThe population fitness landscape will condition whether a new
alternative splicing variant will be able to increase in frequency in
the population. The fate of a new variant under the influence of
selection alone can thus be predicted by evaluating the slope of the
fitness landscape at p = 0. We therefore need to evaluate d �vvdp
���p~0
,
which has the simple solution 2ba11Dv122(12b)a21Dv2.
P1 can therefore invade the population if ba11Dv1.(12
b)a21Dv2. Favorable conditions for this invasion are when the
new variant has a high specificity for an important tissue and that
its fitness advantage over the other variant in that tissue is larger
than its relative fitness disadvantage in another tissue.
Maintenance of alternative splicingAnother question of interest is the maintenance of a balanced
polymorphism for alternative splicing in the population. As
explained above, it should depend on the respective fitness of
the variants in different tissues and on tissue specificity. From
equation (1), we find that the conditions under which alternative
splicing can be maintained by selection are
0vpev1 uba11Dv1w 1{bð Þa21Dv2
ba12Dv1v 1{bð Þa22Dv2
�, ð2Þ
In Figure 5, we report the portions of the relative fitness space
where alternative splicing can persist for different levels of tissue
specificity. We see that there is a much wider range of conditions
leading to a balancing polymorphism when there is strong tissue
specificity for alternative splicing variants, than when splicing
variants are expressed at a similar level in all tissues. Indeed, in
Figure 5A, when there is only a slight overexpression of P1 over P2
in T1, conditions for balancing selection are very limited and in
most of the cases one alternative splicing variant will fix in the
population. On the other hand, when P2 is the only variant
expressed in T2, and almost not expressed in T1 (Figure 5C),
almost all conditions where Dv1 and Dv2 have the same sign lead
to a balanced polymorphism. The comparison of Figure 5B and
Figure 5D shows that balancing selection can more easily operate
when tissues are equally important for the individual fitness
(b<0.5). As seen previously, if tissue specificity was free to evolve,
one would predict that splicing variants should become very tissue
specific, which would further increase the chance for the
establishment of a balanced polymorphism.
Transient alternative splicing at haploid lociFor genes with cis-regulated alternative splicing that are present
on a haploid chromosome (e.g. Y chromosome in humans), the
situation is simpler and different than for diploid loci. Indivi-
duals P1 and P2 have fitness v1 = bv11+(12b)v21 and
v2 = bv12+(12b)v22, respectively, and P1 will simply fix in the
population if v1.v2. An equilibrium exists if v1 = v2, i.e. when
bDv1 = (12b)Dv2, but this equilibrium is unstable, and one or the
other splicing variant should fix in the population. It follows that
unlike in the diploid case, cis-regulated alternative splicing cannot
be maintained by selection alone, and that any observed
polymorphism for alternative splicing should only be transient.
Discussion
Our comparison of human genes with (PS genes) and without
(MS genes) evidence for alternative splicing shows that PS genes
are generally longer and contain more exons than MS genes
(Figure 1), in line with the fact that longer genes have more exons
and thus could produce more alternative variants. PS genes are
also involved in more cellular functions and expressed in more
tissues (Figure 2). Another striking difference is the clear deficit
(compared to autosomes) of PS genes on the Y chromosome, and
to a lesser extent on the X chromosome. A similar analysis on the
mouse genome reveals very comparable patterns, including a total
absence of PS genes on the mouse Y chromosome. This results
extends previous indirect evidence of different levels of alternative
splicing on mammalian chromosomes, where it was postulated
that negative selection pressure against premature protein
truncation was reduced by alternative splicing and nonsense
mediated decay on diploid chromosomes but not on the X
chromosome [50].
The observations that the splicing status of orthologous genes is
conserved between humans and mice (Table 1, i.e. PS genes in
humans tend to also be PS genes in mice), but that there is no real
conservation of the splicing events (Figure S8), implies that
orthologous PS genes have different sets of splicing variants in
humans and mice. The conservation of the ability to have splicing
variants rather than particular splicing variants in different
mammal species also suggests a relatively rapid turnover of
splicing variants within species. Since orthologous genes are likely
to be involved in similar functions in mice and humans, we also
expect their width of expression to be similar. Orthologous genes
should therefore show similar opportunities for tissue specificity.
According to our model of cis-regulated alternative splicing,
splicing variants would be kept in the population due to balancing
selection acting on tissue-specific variants, which would explain the
conservation of the splicing status between human and mice. As
different variants are competing, changes in form or functions of
tissues between these two species are likely to bring along changes
in splicing events, explaining the high turnover of splicing events
observed. Note that a strict comparison of the alternative splicing
variants themselves is impossible with current EST databases. This
would indeed require information on complete mature mRNA or
protein sequences, which seems difficult with extant techniques.
Database integrityOur results showing drastic constitutive difference between PS
and MS genes are strongly dependent on the quality of our
database on MS and PS genes in humans and mice. By cross-
validating information on alternative splicing between the
ENSEMBL and the ASD databases, we discarded a large
proportion of humans and mice genes (.30%) from our dataset,
because of incongruent annotation in the two databases.
Discarded genes seem to be enriched in PS genes, since our
retained data set contains only 33% (and 20% respectively) of PS
genes in humans (and mice), which is much below standard
estimates of this proportion (.50%) in humans and mice [20,51].
However, if we pool the uncharacterized and the PS genes
together (Figure 1, Table 1, Figures S1, S3, S5 and S7), we still
detect significant differences in the chromosomal distribution,
Expression Drives Splicing
PLoS ONE | www.plosone.org 9 October 2008 | Volume 3 | Issue 10 | e3587

structural characteristics, functional and transcriptional profiles of
MS and PS genes (results not shown).
Since the probability to detect mRNA isoformes depends on the
number of ESTs sequenced for a given gene [44], the much lower
number of ESTs sequenced in mice than in humans (4.3 vs 7.8
million ESTs) might at least partly explain the observed smaller
proportion of PS genes in mice. We indeed find a much lower
average number of ESTs mapped to MS genes than PS genes in
humans (72.56 vs 296.39, t-test, p,2.2610216). Hence, the
observed differences in expression patterns between MS and PS
genes might therefore be artificial, as genes with a larger and wider
expression pattern are more likely to be sampled by ESTs.
Additionally, given that the splicing machinery is not 100%
efficient, all genes are expected to produce some aberrant mRNA
isoformes [52]. Hence, the probability to detect splicing variants is
larger for genes bearing a larger number of exons. For instance,
the average number of exons per gene on the Y chromosome is
4.42, while the genome wide average is 7.49. Further, the missing
Figure 5. Effect of tissue specificity on the maintenance of alternative slicing. Colored zones correspond to parameter areas wherealternative splicing can be maintained by balancing selection. Equilibrium frequency (p) can vary between 0 (blue) and 1 (red).doi:10.1371/journal.pone.0003587.g005
Expression Drives Splicing
PLoS ONE | www.plosone.org 10 October 2008 | Volume 3 | Issue 10 | e3587

conservation of splicing variants between humans and mice is
consistent with the hypothesis that many mRNA isoformes result
from aberrant splicing events.
If the number of sequenced ESTs per gene and the number of
exons indeed explained differences between MS and PS genes, we
would expect to see a relationship between these two factors and
the number of known splicing events per PS gene. By performing
an ANOVA, we indeed find a highly significant relationship
between the number of known splicing events and the number of
sampled ESTs (p = 5.2610210), the number of exons
(p = 7.461027) and the interaction of both (p = 1.161024).
However, these factors only explain very little of the total variance
in the number of splicing events among genes (R2 = 0.061), and we
are thus confident that our results are not due to a bias in the
constitution of our database. Additionally, it is hard to judge
whether mRNA isoforms are found more often in genes with
higher expression levels or whether PS genes show a higher
expression level per se, since genes with a wider expression pattern
should also have more opportunities for tissue-specific adaptation.
Note that a similar type of argument can be made for the number
of exons.
We have shown that PS genes are involved in more cellular
functions and expressed in more tissues than MS genes (Figure 2),
which could result from the fact that alternative splicing variants of
widely expressed genes could be easier to detect (see above). On
the other hand, Lercher et al. [53] have shown that housekeeping
gene (defined in [53] as genes that are expressed in more than
eight tissues) are not randomly distributed in the genome. In
particular, they seem extremely rare on the Y chromosome and
under-represented on the X chromosome. This might potentially
explain the observed deficit of PS genes on the sex chromosomes.
To test this hypothesis, we have tried to obtain the null distribution
of the number of PS genes one would observe on X and Y
chromosomes by keeping the distribution of the breadth of
expression constant on these two sex chromosomes. This has been
done with the following procedure: 1) 100,000 random X and Y
chromosomes were generated in silico by replacing each gene on
these chromosomes with a gene randomly chosen from the whole
genome having the same breadth of expression (as measured by
the number of anatomical systems or cell types they are expressed
in); 2) the number of PS and MS genes on the artificially created
chromosomes were each time counted to get their empirical null
distribution: 3) The P-value of the observed numbers were then
obtained from this null distribution. This procedure reveals that
the number of PS genes on the X chromosome is not significantly
small (p = 0.25 when controlled for anatomical systems, and
p = 0.32 when controlled for cell types). On the other hand, we
find a slightly significant deficit of PS genes on the Y chromosome
(p = 0.015 when controlled for anatomical systems, and p = 0.05
when controlled for cell types). This suggests that the genes located
on the Y chromosome show less alternative spliced forms than
those of the rest of the genome irrespective of their breadth of
expression. This is in keeping with the proposed model of cis-
regulated alternative splicing we have developed, where alternative
splicing is actively maintained by balancing selection (see below).
Model of cis-regulated alternative splicingIn our theoretical model of cis-regulated alternative splicing, PS
genes are simply genes with more than a single splicing variant,
and MS genes have a single splicing variant because newly created
splicing variants could not increase in frequency or because a new
variant had fixed in a population. It is important to understand
that observed PS genes can therefore either be transiently so
(between two fixation events due to directional selection) or be
actively maintained polymorphic by balancing selection. Our
model explains the strong deficit of PS genes on the Y
chromosome by the inability of balancing selection to operate on
this haploid chromosome. Interestingly, this observation also
suggests that trans-regulation of alternative splicing, even though
certainly possible [54], plays a minor role, since one would expect
that it would have the same effect on autosomes and sex-linked
markers. The prediction of our theoretical model that alternative
splicing is favored by a strong tissue specificity in splicing variant
expression fits well with the observation that PS genes are
expressed in more tissues than MS genes (Figure 2B). There is
actually some evidence that splicing variants have some tissue
specificity or show a specialized function [55]. While the exact
factors conditioning tissue specific gene expression are not well
defined, it seems logical to consider that the chance for a new
variant to be overly expressed in a random tissue would increase
with the number of tissues where it is expressed. Therefore, the
conditions for the occurrence of balancing selection would increase
with the width of tissue expression taken as a proxy of tissue
possible specificity (Figure 4). Interestingly, our model also shows
that tissue specific expression is favored by selection, since the
fitness of the population should increase with tissue specificity.
However, the same variants should remain for a sufficiently long
time in the population for tissue specificity to evolve, which may
not be the case due to the apparent rapid turnover in splicing
variants within species.
While our theoretical model of the evolution of alternative
splicing is purely deterministic, genetic drift could also be involved
in the segregation of splicing variants in populations, like any other
molecular marker [56]. However, splicing variant frequencies
should evolve under selection if the difference in variant fitness
times the population effective size is larger than 1 [57] (i.e. if
NeDv1.1 and NeDv2.1). A simple correlation between gene
length and the probability of emergence of new alternative splicing
variants could explain some of our observations (Figure 2), but not
the deficit of PS genes on the Y chromosome, since the length of
human MS Y chromosome genes is in the range of autosomal MS
genes (Figure S1B). While we considered a very simple model with
only two alleles and associated splicing variants expressed in two
tissues, it could readily be extended to accommodate more splicing
variants and more than two tissues. However, the main qualitative
results concerning the difference between diploid and haploid
genes and increased possibility of balancing selection with more
tissue specificity are unlikely to change. Note that our model bears
some analogies with models explaining the maintenance of genetic
diversity in species occupying different ecological niches. Indeed,
in those models, selection is spatially heterogeneous, and a
stronger habitat preference depending on their genotype leads to
an increased chance to globally preserve polymorphism (see e.g.
[58]).
ConclusionsBased on the current evidence and on our theoretical
predictions, we can therefore distinguish between the cause and
the effect of alternative splicing and propose a model of its
evolution. Since favorable conditions for the occurrence of
alternative splicing are the existence of splicing variants and their
spread and maintenance in the populations, we postulate that
alternative splicing is favored and maintained by balancing
selection in genes with many exons that are expressed in many
tissues. While the width of expression is overall positively
correlated with the number of alternative splicing events, this
relationship does not seem to explain the lack of genes with
alternative splicing variants on the Y chromosome, which is in
Expression Drives Splicing
PLoS ONE | www.plosone.org 11 October 2008 | Volume 3 | Issue 10 | e3587

keeping with a model where balancing selection contributes to
the maintenance of alternative splicing. Even though they may
not be entirely conserved across evolutionary time [59], the
structural characteristics of the genes thus probably determine
their splicing status. Indeed, a new splicing variant at a gene
expressed in many cellular components would have a larger
chance to find a tissue where it would be both advantageous and
expressed at a high level than a variant appearing in a gene
expressed in a small number of tissues. Our conclusions would
certainly benefit from the use of additional data on alternative
splicing variants in humans and other species. Complete and
accurate information about the extent and conservation of
alternative splicing in different species may soon allow one to
better understand how this important generator of functional
diversity has been shaped across different evolutionary times.
Since our model is purely based on cis-regulated altenative
splicing, the relative importance of this mode of alternative
splicing is an important, yet still unresolved question.
Supporting Information
Figure S1 A. Distribution of the average longest transcript
length (in kb) for MS and PS genes among chromosomes in
humans. B. Distribution of the average number of exons for MS
and PS genes among chromosomes in humans. In A and B, the
range bar correspond to one standard deviation. Uncharacter-
ized genes correspond to ENSEMBL genes that could not be
assigned to one of the two other groups, due to insufficient
evidence.
Found at: doi:10.1371/journal.pone.0003587.s001 (0.28 MB EPS)
Figure S2 A. Total number of splicing events for PS genes in
humans and mice as provided by the ASD dataset. B. Number of
distinct types of splicing events for PS genes in humans and C. in
mice.
Found at: doi:10.1371/journal.pone.0003587.s002 (0.43 MB EPS)
Figure S3 Functional classification of MS and PS genes in
humans according to the GO ontology. Uncharacterized genes are
also shown, for comparison. A gene may be associated with more
than one function and hence may belong to more than one
functional group. A. Distribution of the number of distinct
biological processes. B. Distribution of the number of molecular
functions. C. Distribution of the number of cellular components.
In all cases, the distributions for MS and PS genes are significantly
different (A. X2 = 74.68, df = 6, p,0.001; B. X2 = 126.97, df = 3,
p,0.001; C. X2 = 174.36, df = 5, p,0.001), with a clear excess of
PS genes in the higher numbers of distinct functional classes.
Found at: doi:10.1371/journal.pone.0003587.s003 (0.39 MB EPS)
Figure S4 Functional classification of MS and PS genes in
humans according to the GO ontology. Uncharacterized genes are
also shown, for comparison. A. Distribution of biological process.
B. Distribution of molecular function. C. Distribution of cellular
component. The proportion of genes corresponds to the number
of genes found in a functional category, scaled to 100% across the
whole set of categories. In all cases, we found a significant different
distribution of genes among functional groups (A. X2 = 131.54,
df = 7, p,0.001; B. X2 = 157.34, df = 10, p,0.001; C.
X2 = 252.52, df = 9, p,0.001).
Found at: doi:10.1371/journal.pone.0003587.s004 (0.94 MB EPS)
Figure S5 Expression profiles of MS and PS genes in humans
using ESTs and the eVOC ontology (see Methods). Uncharacter-
ized genes are also shown, for comparison. A. Distribution of the
number of distinct anatomical systems. B. Distribution of the
number of cell types. C. Distribution of the number of
development stages. D. Distribution of the number of pathologies.
In all cases, the distributions for MS and PS genes are different,
with PS genes being more widely expressed in space and time (A.
X2 = 2120.39, df = 11, p,0.001; B. X2 = 1386.81, df = 22,
p,0.001; C. X2 = 1710.46, df = 5, p,0.001, D. X2 = 1926.54,
df = 7, p,0.001).
Found at: doi:10.1371/journal.pone.0003587.s005 (0.43 MB EPS)
Figure S6 Expression profiles of MS and PS genes in humans.
Uncharacterized genes are also shown, for comparison. A.
Distribution of anatomical systems. B. Distribution of cell types.
C. Distribution of development stages. D. Distribution of
pathologies. The proportion of genes corresponds to the number
of genes expressed in a spatial or temporal category, scaled to
100% across the whole set of categories. In all cases, we found a
significant different distribution of genes among transcriptional
categories (A. X2 = 561.45, df = 11, p,0.001; B. X2 = 364.93,
df = 30, p,0.001; C. X2 = 534.12, df = 5, p,0.001; D.
X2 = 691.43, df = 7, p,0.001).
Found at: doi:10.1371/journal.pone.0003587.s006 (1.14 MB
DOC)
Figure S7 A. Chromosomal distribution of MS and PS genes in
mice. ENSEMBL genes that could not be assigned to one of the 2
groups, due to insufficient evidence, are also shown. B.
Distribution of the average longest transcript length (in kb) for
MS, PS and uncharacterized genes among chromosomes in mice.
C. Distribution of the average number of exons for MS, PS and
uncharacterized genes among chromosomes in mice. In B. and C.,
the range displayed corresponds to the mean plus and minus one
standard deviation.
Found at: doi:10.1371/journal.pone.0003587.s007 (0.39 MB EPS)
Figure S8 Conservation of splicing patterns between humans
and mice are displayed here as plots of the numbers of different
types of splicing events for pairs of orthologous genes. Pearson’s
correlation coefficient (r) and associated p-values are shown.
Found at: doi:10.1371/journal.pone.0003587.s008 (0.68 MB EPS)
Table S1 List of functional classes, used in this paper, for the
three GO ontologies, to describe the function of MS and PS genes
(see main text).
Found at: doi:10.1371/journal.pone.0003587.s009 (0.10 MB
XLS)
Table S2 List of transcriptional classes, used in this paper, to
describe the expression profile of MS and PS genes (see main text).
Found at: doi:10.1371/journal.pone.0003587.s010 (0.10 MB
XLS)
Table S3 Pearson correlation coefficients between the number
of functional groups, when comparing the three GO categories, for
MS and PS genes. 1. The correlation was computed when
considering only the genes annotated in both functional categories.
2. We included the genes that were uncharacterized in one or the
two functional categories.
Found at: doi:10.1371/journal.pone.0003587.s011 (0.10 MB
XLS)
Table S4 Pearson correlation coefficients between the number
of expression evidence for MS and PS genes. 1. The correlation
was computed when considering only the genes expressed in both
transcriptional categories. 2. We included the genes for which we
could not detect expression evidence in one or the two
transcriptional categories.
Found at: doi:10.1371/journal.pone.0003587.s012 (0.10 MB
XLS)
Expression Drives Splicing
PLoS ONE | www.plosone.org 12 October 2008 | Volume 3 | Issue 10 | e3587

Acknowledgments
We thank Henrik Kaessmann for his helpful comments on a previous
version of this manuscript.
Author Contributions
Conceived and designed the experiments: DW ID LE. Performed the
experiments: DW ID LE. Analyzed the data: DW ID LE. Contributed
reagents/materials/analysis tools: DW ID LE. Wrote the paper: DW ID
LE.
References
1. Lander ES, Linton LM, Birren B, Nusbaum C, Zody MC, et al. (2001) Initial
sequencing and analysis of the human genome. Nature 409: 860–921.
2. Venter JC, Adams MD, Myers EW, Li PW, Mural RJ, et al. (2001) Thesequence of the human genome. Science 291: 1304–1351.
3. Gilbert W (1978) Why genes in pieces? Nature 271: 501.4. Breitbart RE, Andreadis A, Nadal-Ginard B (1987) Alternative Splicing: A
Ubiquitous Mechanism for the Generation of Multiple Protein Isoforms from
Single Genes. Annual Review of Biochemistry 56: 467–495.5. Consortium IHGS (2004) Finishing the euchromatic sequence of the human
genome. Nature 431: 931–945.6. Pennisi E (2005) Why Do Humans Have So Few Genes? Science 309: 80.
7. Tress ML, Martelli PL, Frankish A, Reeves GA, Wesselink JJ, et al. (2007) Theimplications of alternative splicing in the ENCODE protein complement. Proc
Natl Acad Sci U S A 104: 5495–5500.
8. Kriventseva EV, Koch I, Apweiler R, Vingron M, Bork P, et al. (2003) Increaseof functional diversity by alternative splicing. Trends in Genetics 19: 124–128.
9. Stamm S, Ben-Ari S, Rafalska I, Tang Y, Zhang Z, et al. (2005) Function ofalternative splicing. Gene 344: 1–20.
10. Hillman RT, Green RE, Brenner SE (2004) An unappreciated role for RNA
surveillance. Genome Biology 5: R8.11. Graveley BR (2001) Alternative splicing: increasing diversity in the proteomic
world. Trends in Genetics 17: 100–107.12. Modrek B, Lee C (2002) A genomic view of alternative splicing. Nature Genetics
30: 13–19.13. Kim E, Magen A, Ast G (2007) Different levels of alternative splicing among
eukaryotes. Nucleic Acids Research 35: 125–131.
14. Lee C, Atanelov L, Modrek B, Xing Y (2003) ASAP: the Alternative SplicingAnnotation Project. Nucleic Acids Research 31: 101–105.
15. Leipzig J, Pevzner P, Heber S (2004) The Alternative Splicing Gallery (ASG):bridging the gap between genome and transcriptome. Nucleic Acids Research
32: 3977–3983.
16. Thanaraj TA, Stamm S, Clark F, Riethoven JJM, Le Texier V, et al. (2004)ASD: the Alternative Splicing Database. Nucleic Acids Research 32: D64–D69.
17. Kim N, Shin S, Lee S (2005) ECgene: genome-based EST clustering and genemodeling for alternative splicing. Genome Research 15: 566–576.
18. Zheng CL, Kwon YS, Li HR, Zhang K, Coutinho-Mansfield G, et al. (2005)
MAASE: an alternative splicing database designed for supporting splicingmicroarray applications. RNA 11: 1767–1776.
19. Holste D, Huo G, Tung V, Burge CB (2006) HOLLYWOOD: a comparativerelational database of alternative splicing. Nucleic Acids Research 34: D56–62.
20. Johnson JM, Castle J, Garrett-Engele P, Kan Z, Loerch PM, et al. (2003)Genome-wide survey of human alternative pre-mRNA splicing with exon
junction microarrays. Science 302: 2141–2144.
21. Modrek B, Lee CJ (2003) Alternative splicing in the human, mouse and ratgenomes is associated with an increased frequency of exon creation and/or loss.
Nature Genetics 34: 177–180.22. Cusack BP, Wolfe KH (2005) Changes in alternative splicing of human and
mouse genes are accompanied by faster evolution of constitutive exons.
Molecular Biology and Evolution 22: 2198–2208.23. Ermakova EO, Nurtdinov RN, Gelfand MS (2006) Fast rate of evolution in
alternatively spliced coding regions of mammalian genes. BMC Genomics 7: 84.24. Alekseyenko AV, Kim N, Lee CJ (2007) Global analysis of exon creation versus
loss and the role of alternative splicing in 17 vertebrate genomes. RNA 13:661–670.
25. Sorek R, Lev-Maor G, Reznik M, Dagan T, Belinky F, et al. (2004) Minimal
conditions for exonization of intronic sequences: 59 splice site formation in aluexons. Molecular Cell 14(2): 221–231.
26. Sakabe NJ, de Souza SJ (2006) Sequence features responsible for intronretention in human. BMC Genomics 8: 59.
27. Koren E, Lev-Maor G, Ast G (2007) The emergence of alternative 39 and 59
splice site exons from constitutive exons. PLoS Computational Biology 3: e95.28. Izquierdo JM, Valcarcel J (2006) A simple principle to explain the evolution of
pre-mRNA splicing. Genes and Development 20: 1679–1684.29. Xing Y, Lee C (2005) Evidence of functional selection pressure for alternative
splicing events that accelerate evolution of protein subsequences. Proc Natl AcadSci U S A 102: 13526–13531.
30. Kondrashov FA, Koonin EV (2001) Origin of alternative splicing by tandem
exon duplication. Human Molecular Genetics 10: 2661–2669.31. Letunic I, Copley RR, Bork P (2002) Common exon duplication in animals and
its role in alternative splicing. Human Molecular Genetics 11: 1561–1567.
32. Sorek R, Ast G, Graur D (2002) Alu-containing exons are alternatively spliced.
Genome Research 12: 1060–1067.
33. Zheng CL, Fu XD, Gribskov M (2005) Characteristics and regulatory elements
defining constitutive splicing and different modes of alternative splicing in
human and mouse. RNA 11: 1777–1787.
34. Hubbard T, Andrews D, Caccamo M, Cameron G, Chen Y, et al. (2005)
Ensembl 2005. Nucleic Acids Research 33: D447–453.
35. Harris MA, Clark J, Ireland A, Lomax J, Ashburner M, et al. (2004) The Gene
Ontology (GO) database and informatics resource. Nucleic Acids Research 32:
D258–261.
36. Kent WJ (2002) BLAT–the BLAST-like alignment tool. Genome Research 12:
656–664.
37. Benson DA, Karsch-Mizrachi I, Lipman DJ, Ostell J, Wheeler DL (2006)
GenBank. Nucleic Acids Research 34: D16–20.
38. Kelso J, Visagie J, Theiler G, Christoffels A, Bardien S, et al. (2003) eVOC: a
controlled vocabulary for unifying gene expression data. Genome Res 13:
1222–1230.
39. Kasprzyk A, Keefe D, Smedley D, London D, Spooner W, et al. (2004)
EnsMart: a generic system for fast and flexible access to biological data. Genome
Research 14: 160–169.
40. Sneath RJ, Mangham DC (1998) The normal structure and function of CD44
and its role in neoplasia. Molecular Pathology 51: 191–200.
41. Skotheim RI, Nees M (2007) Alternative splicing in cancer: Noise, functional, or
systematic ? The International Journal of Biochemistry & Cell Biology.
42. Stamm S, Riethoven JJ, Le Texier V, Gopalakrishnan C, Kumanduri V, et al.
(2006) ASD: a bioinformatics resource on alternative splicing. Nucleic Acids
Research 34: D46–55.
43. Urrutia AO, Ocana LB, Hurst LD (2008) Do Alu repeats drive the evolution of
the primate transcriptome? Genome Biology 9: 16.
44. Brett D, Pospisil H, Valcarcel J, Reich J, Bork P (2002) Alternative splicing and
genome complexity. Nat Genet 30: 29–30.
45. Gray PA, Fu H, Luo P, Zhao Q, Yu J, et al. (2004) Mouse brain organization
revealed through direct genome-scale TF expression analysis. Science 306:
2255–2257.
46. Thanaraj TA, Clark F, Muilu J (2003) Conservation of human alternative splice
events in mouse. Nucleic Acids Research 31: 2544–2552.
47. Sugnet CW, Kent WJ, Ares M, Haussler D (2004) Transcriptome and genome
conservation of alternative splicing events in humans and mice. Pacific
Symposium on Biocomputing. pp 66–77.
48. Pan Q, Bakowski MA, Morris QD, Zhang W, Frey BJ, et al. (2005) Alternative
splicing of conserved exons is frequently species-specific in human and mouse.
Trends in Genetics 21: 73–77.
49. Yeo GW, Van Nostrand E, Holste D, Poggio T, Burge CB (2005) Identification
and analysis of alternative splicing events conserved in human and mouse. Proc
Natl Acad Sci U S A 102: 2850–2855.
50. Xing Y, Lee CJ (2004) Negative selection pressure against premature protein
truncation is reduced by alternative splicing and diploidy. Trends in Genetics 20:
472–475.
51. Sharov AA, Dudekula DB, Ko MS (2005) Genome-wide assembly and analysis
of alternative transcripts in mouse. Genome Research 15: 748–754.
52. Jaillon O, Bouhouche K, Gout JF, Aury JM, Noel B, et al. (2008) Translational
control of intron splicing in eukaryotes. Nature 451: 359–U315.
53. Lercher MJ, Urrutia AO, Hurst LD (2002) Clustering of housekeeping genes
provides a unified model of gene order in the human genome. Nature Genetics
31: 180–183.
54. Ast G (2004) How did alternative splicing evolve? Nature Reviews Genetics 5:
773–782.
55. Pan Q, Shai O, Misquitta C, Zhang W, Saltzman AL, et al. (2004) Revealing
global regulatory features of mammalian alternative splicing using a quantitative
microarray platform. Molecular Cell 16: 929–941.
56. Crow JF, Kimura M (1970) Introduction to Population Genetics Theory:
Harper & Row Publishers.
57. Ewens WJ (2004) Mathematical Population Genetics: Springer.
58. Gavrilets S (2006) The Maynard Smith model of sympatric speciation. Journal of
Theoretical Biology 239: 172–182.
59. Rogozin IB, Sverdlov AV, Babenko VN, Koonin EV (2005) Analysis of
evolution of exon-intron structure of eukaryotic genes. Briefings in Bioinfor-
matics 6: June 2005.
Expression Drives Splicing
PLoS ONE | www.plosone.org 13 October 2008 | Volume 3 | Issue 10 | e3587