Widening Participation in Higher Education, England, …...6 Progression to the most selective...
15
Contact: Email: [email protected] Press office: 020 7783 8300 Public enquiries: 0370 000 2288 Widening Participation in Higher Education, England, 2016/17 age cohort – Official Statistics 22 November 2018 The progression rate of FSM pupils has increased but the gap between FSM and non-FSM remains stable An estimated 25.6% of pupils who were in receipt of Free School Meals (FSM) aged 15 in 2012/13 entered Higher Education by age 19 by 2016/17. This compares to 43.3% of non-FSM pupils. The gap in progression rates between FSM and non-FSM pupils has remained at 17.7 percentage points over the past three years. The gap has varied between 16.8 and 19.2 percentage points since 2005/06. The 2016/17 cohort includes those who entered Higher Education aged 18 in 2015/16 or aged 19 in 2016/17. The gap in progression rates by school type to the most selective HEIs has decreased in the latest year after several years of increases An estimated 61.4% of students who took A level and equivalent qualifications in independent schools and colleges progressed to the most selective Higher Education providers by age 19 by the 2016/17 academic year, compared to 22.4% of those from state-funded schools and colleges. The most selective are defined as the top third of Higher Education providers when ranked by mean UCAS tariff score from the top three A level grades of entrants. The gap between state and independent rates has decreased for the first time since 2012/13. Note that there have been some small revisions to the matching algorithm and methodology to improve the accuracy of the measures. These changes have been applied to the whole time series covered by this publication. More details can be found in the accompanying Technical Note.
Transcript of Widening Participation in Higher Education, England, …...6 Progression to the most selective...

Contact: Email: [email protected] Press office: 020 7783 8300 Public enquiries: 0370 000 2288
Widening Participation in Higher Education, England,
2016/17 age cohort – Official Statistics
22 November 2018
The progression rate of FSM pupils has increased but the gap between FSM and non-FSM remains stable
An estimated 25.6% of pupils who
were in receipt of Free School
Meals (FSM) aged 15 in 2012/13
entered Higher Education by age
19 by 2016/17. This compares to
43.3% of non-FSM pupils. The gap
in progression rates between FSM
and non-FSM pupils has remained
at 17.7 percentage points over the
past three years. The gap has
varied between 16.8 and 19.2
percentage points since 2005/06.
The 2016/17 cohort includes those
who entered Higher Education
aged 18 in 2015/16 or aged 19 in
2016/17.
The gap in progression rates by school type to the most selective HEIs has decreased in the latest year after several years of increases
An estimated 61.4% of students
who took A level and equivalent
qualifications in independent
schools and colleges progressed to
the most selective Higher
Education providers by age 19 by
the 2016/17 academic year,
compared to 22.4% of those from
state-funded schools and colleges.
The most selective are defined as
the top third of Higher Education
providers when ranked by mean
UCAS tariff score from the top
three A level grades of entrants.
The gap between state and
independent rates has decreased
for the first time since 2012/13.
Note that there have been some small revisions to the matching algorithm and methodology to improve the accuracy of the measures. These changes have been applied to the whole time series covered by this publication. More details can be found in the accompanying Technical Note.

Contact: Email: [email protected] Press office: 020 7783 8300 Public enquiries: 0370 000 2288
Contents
Progression to Higher Education by Free School Meal status (Table 1) ........ 4
Progression to Higher Education/Most Selective Higher Education by Free School Meal status by Region (Tables 2 and 2a) ...................................................... 4
Progression to Higher Education/Most Selective Higher Education by school type (Tables 3ab and 3cd) ........................................................................................ 7
Graduate outcomes by social background (Table 4) ...................................... 9
Other Widening Participation Measures (Table 5) ........................................ 10
Accompanying tables ................................................................................... 13
Further information is available .................................................................... 14
Official Statistics .......................................................................................... 14
Technical information ................................................................................... 14
Get in touch ................................................................................................. 14
Media enquiries ....................................................................................................................... 14
Other enquiries/feedback ......................................................................................................... 14
About this release
This Official Statistics Release includes the latest information on three measures of Widening Participation in Higher Education:
• The estimated percentage of 15 year olds, by Free School Meals (FSM) status, who progressed to Higher Education (HE) and to the most selective Higher Education providers by age 19 by 2016/17. The information is presented at national, regional and local authority level.
• The estimated percentage of A level and equivalent students, by school/college type, who progressed to HE and to the most selective Higher Education Providers by age 19 by 2016/17.
• Estimated proportions of young 2016/17 graduates in different occupation classifications by social background on entry to HE. This uses Standard Occupation Classification (SOC) at both points, split into two groups (Most Advantaged/Less Advantaged).
The FSM measure covers pupils from English state-funded schools and special schools who have progressed to HE in UK Higher Education Providers and English Further Education Colleges. The school type measure covers pupils from English schools and colleges who have progressed to HE in UK Higher Education Providers. The measure on graduate outcomes covers English domiciled graduates from UK Higher Education Providers. The first two measures use matched data which takes longer to become available than the sources used for the graduate outcomes measure. Figures from matched data should be considered as estimates. Pupils progressing to alternative providers are excluded from this section of the publication, however we are consulting on including them in the future.
These measures are intended to contribute to the understanding of widening participation issues as part of a range of measures. Section 5 provides information on some of the other measures available.

Contact: Email: [email protected] Press office: 020 7783 8300 Public enquiries: 0370 000 2288
There have been some small revisions to the matching algorithm and methodology to improve the accuracy of the measures. These changes have been applied to the whole time series covered by this publication. More details can be found in the accompanying Technical Note.
This publication updates the previous release of August 2017.
Widening Participation in Higher Education 2017
In this publication
The following tables are included in the release:
• Table 1 Progression to Higher Education by Free School Meal status (Excel .xls)
• Table 2 Progression to Higher Education by Free School Meal status by Local Authority (Excel .xls)
• Table 2a Progression to the most selective Higher Education by Free School Meal status by Local Authority (Excel .xls)
• Table 3 Progression to Higher Education/Most Selective Higher Education by school type (Excel .xls)
• Table 4 Graduate outcomes by social background (Excel .xls)
• Table 5 Other Widening Participation measures (Excel .xls)
• Table A Estimated mean UCAS tariff score from the top three A-level grades of entrants to each Higher Education Institution (HEI) by age 19 (Excel .xls)
The accompanying Technical Note document provides information on the data sources, their coverage and quality and explains the methodology used in producing the data.
Feedback
We are changing how our releases look and welcome feedback on any aspect of this document at [email protected]

4
Progression to Higher Education by Free School Meal status (Table 1)
Figure 1 shows that an estimated 17.4% of state-funded and special school pupils who received Free
School Meals (FSM) at age 15 entered Higher Education by age 19 by 2008/09. This rose steadily to an
estimated 25.6% for the 2016/17 cohort. The estimated progression rate for pupils not receiving Free
School Meals has risen from 34.9% for the 2008/09 cohort to 43.3% for the 2016/17 cohort. The estimated
gap between FSM and Non-FSM progression rates was 17.7 percentage points for the 2016/17 cohort, the
same as the previous two years.
Figure 1: Estimated percentage of 15 year old state-funded and special school pupils by Free School Meal status who entered HE by age 19
Academic Years 2008/09 to 2016/17
UK Higher Education Providers and English Further Education Colleges
Source: Matched data from the DfE National Pupil Database, Higher Education Statistics Agency (HESA) Student Record and ESFA Individualised Learner Record (ILR)
Methodology Changes
There have been some small revisions to the methodology and matching algorithm to improve the accuracy of this measure. These changes have been applied to the whole time series covered by this publication, however the impact on the figures is small. More details can be found in the accompanying Technical Note and Changes document.
Prior attainment
Prior attainment is not accounted for in this measure. Many pupils will not continue their education after Key Stage 4 and therefore may not hold the qualifications to progress to Higher Education. See Technical Note for more details.
Free School Meal eligibilty
An estimated 14.9% of all 15 year old pupils were in receipt of Free Schools Meals. This proportion has remained between 12% to 15% over the past decade. See Technical Note for more details.
Progression to Higher Education/Most Selective Higher Education by Free School Meal status by Region (Tables 2 and 2a)
Progression to Higher Education varies significantly by region, in particular for those eligible for Free
School Meals. Figure 2 shows that 48% of those eligible for Free School Meals at age 15 in Inner London
progressed to HE by age 19 – a rate more than three times higher than for the South West (15%). London
also has the highest progression rates for those not eligible for Free School Meals at age 15 – over 50% in
both Inner London (57%) and Outer London (55%). The South West has the lowest progression rate of
38%.

5
Figure 2: Estimated percentage of 15 year old state-funded and special school pupils by Free School Meal status who entered HE by age 19 by region
Academic Year 2016/17
UK Higher Education Providers and English Further Education Colleges
Source: Matched data from the DfE National Pupil Database, HESA Student Record and ESFA ILR
The gap between progression rates between those eligible for Free School Meals at age 15 and those who were not eligible also varies by region. Figure 3 shows that the gap is lowest for Inner London at 9 percentage points, followed by Outer London at 13 percentage points and the West Midlands at 17 percentage points. The South East has the largest gap in progression rates at 25 percentage points.
Figure 3: Estimated gap in progression to HE between 15 year old state-funded and special school pupils eligible for Free School Meals and those not eligible by age 19 by region
Academic Year 2016/17
UK Higher Education Providers and English Further Education Colleges
Source: Matched data from the DfE National Pupil Database, HESA Student Record and ESFA ILR
An Excel table associated with this publication on the webpage gives a time series of the local authority
level information.
Care should be taken when comparing progression rates across regions. In particular, it is not possible to conclude that the gaps in progression rates shown are a reflection of the performance of educational institutions in those regions. This is because the composition of the Non-FSM group (and to a lesser extent the FSM group) will vary considerably in terms of levels of affluence and other factors that will impact on educational attainment and progression. The proportion of pupils with FSM varies considerably between regions.

6
Progression to the most selective Higher Education providers also varies by region. Figure 4 shows that
11% of those eligible for Free School Meals at age 15 in Inner London progressed to the most selective HE
by age 19 – a rate more than five times higher than for the North East (2%). London also has the highest
progression rates for those not eligible for Free School Meals at age 15 – 20% in Outer London and 18% in
Inner London. The North East has the lowest progression rate of 10%.
Figure 4: Estimated percentage of 15 year old state-funded and special school pupils by Free School Meal status who entered the most selective HE providers by age 19 by region
Academic Year 2016/17
UK Higher Education Providers and English Further Education Colleges
Source: Matched data from the DfE National Pupil Database, HESA Student Record and ESFA ILR
The gap in progression rates to the most selective institutions between those eligible for Free School Meals at age 15 and those who were not eligible also varies by region. Figure 5 shows that the gap is lowest for Inner London at 7 percentage points. The South East has the largest gap in progression rates at 12 percentage points.
Figure 5: Estimated gap in progression to the most selective HE providers between 15 year old state-funded and special school pupils eligible for Free School Meals and those not eligible by age 19 by region
Academic Year 2016/17
UK Higher Education Providers and English Further Education Colleges
Source: Matched data from the DfE National Pupil Database, HESA Student Record and ESFA ILR

7
Progression to Higher Education/Most Selective Higher Education by school type (Tables 3ab and 3cd)
An estimated 64.0% of those who studied A level and equivalent qualifications in state schools and
colleges at age 17 in 2014/15 progressed to Higher Education by age 19 by 2016/17. This is up from 63.0%
for the 2015/16 cohort but remains below the progression rates for the 2008/09 to 2012/13 cohorts. For
independent school and college pupils the estimated progression rate was 80.7%. The gap between these
progression rates fell from 17.7 to 16.7 percentage points between 2015/16 and 2016/17. However, the gap
remains higher than in the period 2008/09 to 2012/13.
Figure 6: Estimated percentage of A level and equivalent students who entered HE by age 19, by independent and state school/college Academic Years 2008/09 to 2016/17
Source: Matched data from the DfE National Pupil Database and HESA Student Record
The estimated progression rate for state school and college pupils to the most selective Higher Education
Providers was 22.4% for the 2016/17 cohort, up from 22.1% from the previous cohort. The equivalent
progression rate for independent school and college pupils was 61.4% for the 2016/17 cohort, down from
62.0%. The gap between state and independent progression rates to the most selective institutions for the
2016/17 cohort was 39.0 percentage points, down from 39.8 percentage points for the 2015/16 cohort.
Figure 7: Estimated percentage of A level and equivalent students who progressed to the most selective HE Providers by age 19, by independent and state school/college Academic Years 2008/09 to 2016/17
Source: Matched data from the DfE National Pupil Database and HESA Student Record
Most Selective The most selective are currently defined as the top third of HEPs when ranked by mean UCAS tariff
score from the top three A level grades of entrants. We are consulting on a proposed new method for the calculation. See Changes document for more details.

8
Changes to matching
The matching algorithm has been reviewed and revised to take account of additional data and to improve the quality of the match. These changes have had a limited impact on the figures presented, with the exception of progression from independent schools which have fallen by around 4 percentage points. See Changes document for more details.
When the analysis is restricted to those who took A levels only, the gap between independent and state-
funded schools/colleges reduces.
Figure 8 shows that 81.9% of pupils who took A levels in Independent schools progressed to HE, 5.1 percentage points higher than for pupils in state-funded schools/colleges (76.8%). This gap is down from 5.3 percentage points in 2015/16.
Figure 8: Estimated percentage of A level students who entered HE by age 19 by independent and state school/college Academic Years 2010/11 to 2016/17
Source: Matched data from the DfE National Pupil Database and HESA Student Record
The gap however remains large when focusing on those progressing to the most selective HEIs, despite narrowing over time. Figure 9 shows an estimated 61.9% of pupils who took A levels in Independent schools progressed to the most selective HEIs, 30.4 percentage points higher than those in state-funded schools/colleges (31.5%). This gap is down from 31.0 percentage points in 2015/16. Figure 9: Estimated percentage of A level students who progressed to the most selective HE Providers by age 19 by independent and state school/college Academic Years 2010/11 to 2016/17
Source: Matched data from the DfE National Pupil Database and HESA Student Record

9
Graduate outcomes by social background (Table 4)
Figure 10 covers young first-degree graduates (aged 20 to 22 in their graduation year) in full-time employment six months after graduating. An estimated 81.4% of those from the most advantaged backgrounds before higher education were in high-skilled jobs six months after graduating in 2016/17. This is up 2.7 percentage point from 2015/16. 76.1% of those from less advantaged backgrounds were in the high-skilled jobs, up 3.1 percentage point on the previous year.
Standard Occupational Classification (SOC) classifies jobs in terms of skill level and skill content. SOC 1 to 3 is used as a proxy for high-skilled. SOC 4 to 9 is used as a proxy for medium and low skilled jobs.
The occupational group on entry to HE will often reflect the occupation of the student’s parents. The employment group reflects the graduate’s employment.
Figure 10: Percentage of graduates in full-time employment in high-skilled jobs six months after graduating by occupational background on entry to Higher Education English domiciled full-time first degree Aged 20-22 in graduation year Academic Years 2011/12 to 2016/17
Source: HESA Student Record and DLHE survey
Figures should be treated as estimates and considered to be broadly indicative rather than precise measures, due to data limitations.
A change to the UCAS question on occupation means that 2011/12 graduate figures are not directly comparable with other years.
The share of graduates entering Standard Occupational Classification (SOC) groups 1 to 3 occupations has increased over time with a more notable increase between 2013/14 and 2014/15. This increase was driven by graduates entering occupations classified as SOC group 2 (“Professional occupations”), which is dominated by professions such as teaching, nursing and medicine. The increase in 2014/15 is due to the relative share of graduates in these professions increasing because their student numbers remained stable in a year when the size of the wider graduation cohort reduced.
The number of employed leavers in 2015/16 was relatively smaller than in previous years and a larger share of graduates had entered further study (rather than employment) than in previous years. In 2016/17 this increased back to a similar level to 2014/15.
See Technical Note section 3 for more details.

10
Other Widening Participation Measures (Table 5)
The measures given in the main body of this publication should be considered alongside other statistics on
widening participation in Higher Education. Some other measures are described in the following section.
Universities and Colleges Admissions Service (UCAS): End of cycle report 2017
UCAS released widening participation data in December 2017, including analysis of entry rates by POLAR
disadvantage and entry to higher tariff institutions:
UCAS End of Cycle Reports.
Entry rates give the number of students from England entering Higher Education via UCAS by age 19 as a
proportion of the population of 18 year olds in England.
POLAR
Participation of Local Areas (POLAR) was developed by HEFCE and classifies small areas across the UK into five groups according to their level of young participation in HE. Each of these groups represents around 20 per cent of young people and are ranked from quintile 1 (Q1) (areas with the lowest young participation rates, considered as the most disadvantaged) to quintile 5 (Q5) (highest young participation rates, considered most advantaged). This has been updated over the years to POLAR2, POLAR3 and POLAR 4. This publication presents information using POLAR3.
Higher tariff institutions
UCAS group institutions into three levels based on the average attainment of their accepted applicants (summarised through UCAS tariff points) in recent cycles. Each group had around a third of all UK 18 year old acceptances in recent cycles. This measure covers the group of institutions with entrants with the highest attainment.
Higher Education Statistics Agency (HESA): Performance Indicators in Higher Education
HESA has published Performance Indicators in Higher Education since 2002/03. The latest publication was
released in February 2018 and is available from the HESA website:
HESA Performance Indicators
The Performance Indicators provide information about the proportion of entrants who are from state
schools and low participation neighbourhoods as well as previously provided data on young peoples’ socio-
economic class. The indicator for state schools reflects the percentage of young, full-time entrants to first
degrees in English Higher Education Institutions who had previously attended a school or college in the
state sector. These measures differ from the widening participation measures as they focus on the
composition of the HE student population rather than progression rates into HE.
Low Participation Neighbourhood
The Low Participation Neighbourhood (LPN) indicator is the percentage of young, full-time entrants to first degree courses in English HEIs whose home area (as denoted by their postcode) is identified as being within Quintile 1 of the POLAR system. POLAR is described in the UCAS entry above. POLAR2 (Participation of Local Area 2) data is not comparable with the more recent POLAR3 data.

11
Table 5 shows widening participation measures from these sources. It is important to note that these
measures are not directly comparable, as there are differences in definitions, coverage and data sources.
Table 5: Widening participation in higher education – basket of measures
Years: 2008/09 to 2017/18
Measure 2008/09 2009/10 2010/11 2011/12 2012/13 2013/14 2014/15 2015/16 2016/17 2017/18
Progression by age 19
DfE
Progression to HE
by FSM status
FSM 17.4% 18.6% 19.8% 20.3% 21.3% 22.3% 23.5% 25.1% 25.6% ..
Non-FSM 34.9% 36.2% 37.4% 38.3% 38.8% 39.1% 41.2% 42.8% 43.3% ..
Gap (pp) 17.6 17.6 17.7 18.0 17.5 16.8 17.7 17.7 17.7 ..
UCAS
Young (18-19) cohort entry
rates POLAR3 [1][2]
Disadvantaged (Q1) 17.1% 18.6% 19.7% 20.7% 21.2% 22.2% 23.9% 25.3% 26.0% ..
Advantaged (Q5) 55.9% 57.2% 57.8% 57.5% 57.0% 56.2% 57.7% 59.8% 59.4% ..
Gap (pp) 38.8 38.6 38.1 36.8 35.8 34.0 33.8 34.5 33.4 ..
All [3] 35.0% 36.5% 37.3% 38.1% 38.2% 38.7% 40.5% 42.1% 42.5% 43.3%
Entry at age 18
UCAS
Entry rates state
school pupils [4]
FSM 11.0% 11.7% 11.7% 13.2% 13.0% 13.9% 15.1% 16.3% 16.6% 16.9%
Non-FSM 26.5% 27.4% 27.5% 28.6% 27.5% 29.5% 30.8% 31.8% 33.1% 33.8%
Gap (pp) 15.5 15.7 15.8 15.4 14.5 15.6 15.7 15.5 16.5 16.9
Entry rates POLAR3 [2] [5]
Disadvantaged (Q1) 12.9% 13.6% 14.2% 15.1% 15.1% 16.3% 17.8% 18.5% 19.5% 20.4%
Advantaged (Q5) 42.3% 42.4% 41.8% 44.4% 41.7% 43.0% 44.4% 44.9% 46.3% 47.1%
Gap (pp) 29.4 28.8 27.6 29.3 26.6 26.7 26.6 26.4 26.8 26.7
Entry rates to
higher tariff inst. [2][6]
Disadvantaged (Q1) 2.5% 2.4% 2.4% 2.4% 2.6% 2.9% 3.2% 3.3% 3.6% 4.0%
Advantaged (Q5) 19.6% 18.8% 18.2% 17.9% 19.0% 19.8% 20.5% 20.7% 21.3% 21.7%
Gap (pp) 17.1 16.4 15.8 15.5 16.4 16.9 17.4 17.4 17.7 17.7
Young (under 21) entry
HESA Performance
Indicators [7]
State Schools 88.0% 88.4% 88.2% 88.5% 89.0% 89.4% 89.6% 89.8% 90.0% ..
Lower NS-SEC [8] .. 30.1% 30.7% 30.9% 32.8% 33.1% 33.4% .. .. ..
LPN (POLAR2) [2] 10.2% 10.5% 10.6% 10.7% 11.7% 11.7% . . . .
LPN (POLAR3) [2] . 9.6% 10.0% 10.2% 10.9% 10.9% 11.3% 11.3% 11.4% ..
. not applicable .. not available [1] Young cohort entry rates (aged 18 or 19 on entry) by POLAR3 groups for England. The entry rates give students from England entering Higher Education via UCAS by age 19 as a proportion of the population of 18 year olds in England, based on ONS data. UCAS End of cycle report 2016. UCAS describe cohorts by the year when aged 18, rather than 19 as in the table, so figures are under different headings to those in the UCAS publication.
12
[2] Entry rates for Quintile 1 disadvantaged and Quintile 5 advantaged areas by POLAR. POLAR is an area based measure of educational disadvantage. The POLAR classification analyses the geographical variation in participation by grouping small areas across the UK according to their level of young HE participation. [3] England young cohort entry rate from UCAS End of cycle report 2017. [4] Entry rates for English 18 year old state school pupils by Free School Meal (FSM) status at age 15. From UCAS data linked to DfE National Pupil Database data. From UCAS End of cycle report 2017. FSM Figures have been updated due to a change in definition - see UCAS Website. [5] English 18 year old entry rates by POLAR3 groups from UCAS End of Cycle report 2017. [6] English 18 year olds, entry rates to higher tariff institutions by POLAR3 groups. The cycle entry rates give students entering Higher Education from a UCAS application cycle as a proportion of the base population, based on ONS population estimates. From UCAS End of cycle report 2017. See source for definition of higher tariff institutions. [7] Young full-time first degree UK domiciled students in Higher Education Institutions in England. For example 90.0% of entrants covered were from state schools in 2016/17. LPN refers to Low Participation Neighbourhoods (POLAR Q1) using two definitions, the older POLAR2 and the more recent POLAR3 definition. [8] National Statistics Socio-Economic Classification 4 to 7; comparable figures for 2008/09 are not available.
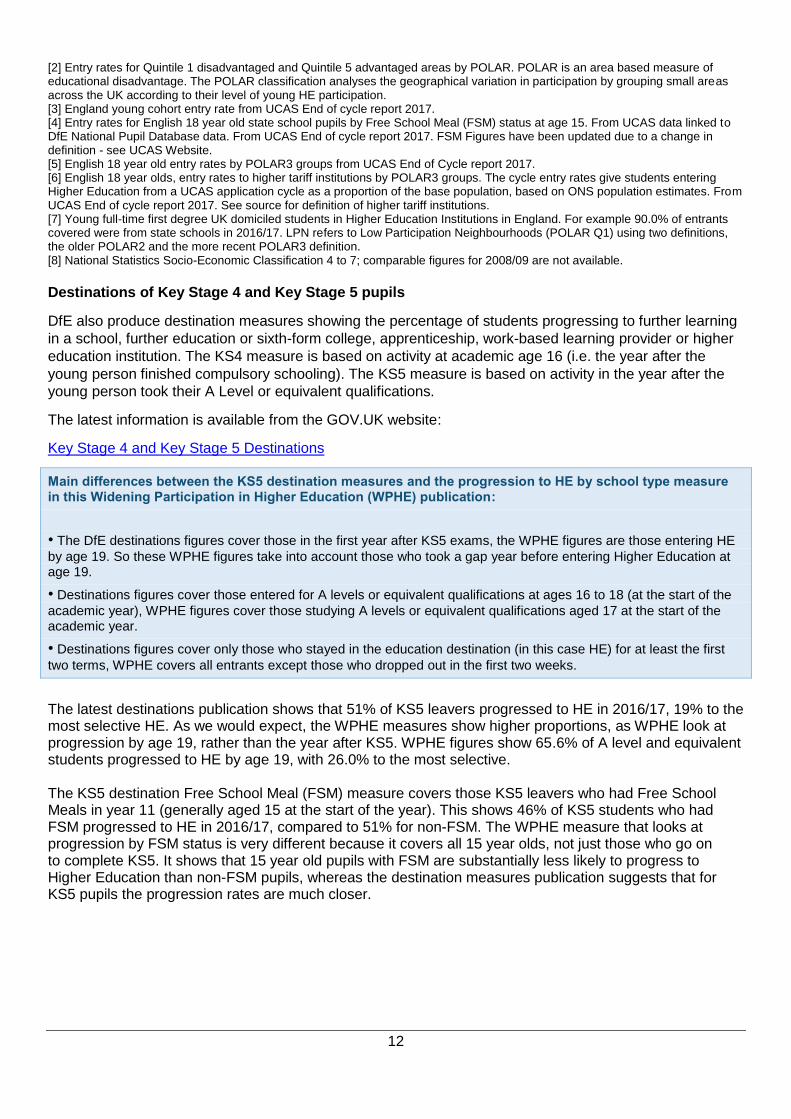
Destinations of Key Stage 4 and Key Stage 5 pupils
DfE also produce destination measures showing the percentage of students progressing to further learning
in a school, further education or sixth-form college, apprenticeship, work-based learning provider or higher
education institution. The KS4 measure is based on activity at academic age 16 (i.e. the year after the
young person finished compulsory schooling). The KS5 measure is based on activity in the year after the
young person took their A Level or equivalent qualifications.
The latest information is available from the GOV.UK website:
Key Stage 4 and Key Stage 5 Destinations
Main differences between the KS5 destination measures and the progression to HE by school type measure in this Widening Participation in Higher Education (WPHE) publication:
• The DfE destinations figures cover those in the first year after KS5 exams, the WPHE figures are those entering HE
by age 19. So these WPHE figures take into account those who took a gap year before entering Higher Education at age 19.
• Destinations figures cover those entered for A levels or equivalent qualifications at ages 16 to 18 (at the start of the
academic year), WPHE figures cover those studying A levels or equivalent qualifications aged 17 at the start of the academic year.
• Destinations figures cover only those who stayed in the education destination (in this case HE) for at least the first
two terms, WPHE covers all entrants except those who dropped out in the first two weeks.
The latest destinations publication shows that 51% of KS5 leavers progressed to HE in 2016/17, 19% to the most selective HE. As we would expect, the WPHE measures show higher proportions, as WPHE look at progression by age 19, rather than the year after KS5. WPHE figures show 65.6% of A level and equivalent students progressed to HE by age 19, with 26.0% to the most selective. The KS5 destination Free School Meal (FSM) measure covers those KS5 leavers who had Free School Meals in year 11 (generally aged 15 at the start of the year). This shows 46% of KS5 students who had FSM progressed to HE in 2016/17, compared to 51% for non-FSM. The WPHE measure that looks at progression by FSM status is very different because it covers all 15 year olds, not just those who go on to complete KS5. It shows that 15 year old pupils with FSM are substantially less likely to progress to Higher Education than non-FSM pupils, whereas the destination measures publication suggests that for KS5 pupils the progression rates are much closer.

13
Accompanying tables
The following tables are available in Excel format on the department’s statistics website:
National and local authority tables
1 Estimated number and percentage of pupils from state-funded and special schools by Free School Meal status who entered HE by age 19
2 Estimated percentage of pupils from state-funded and special schools by Free School Meal status who entered HE by age 19 by local authority
2a Estimated percentage of pupils from state-funded and special schools by Free School Meal status who entered the most selective HE by age 19 by local authority
3ab Estimated number and percentage of A level and equivalent students who entered HE by age 19 and the percentage who progressed to the most selective HE Institutions, by independent and state school/college
3cd Estimated number and percentage of A level students who entered HE by age 19 and the percentage who progressed to the most selective HE Institutions, by independent and state school/college
4 English domiciled full-time first degree graduates in full-time employment six months after graduating: estimated percentages for Standard Occupational Classification (SOC) on entry to Higher Education and in employment
5 Widening participation in higher education - basket of measures
A Estimated mean UCAS tariff score from the top three A-level grades of entrants to each Higher Education Institution (HEI) by age 19 and most selective status
When reviewing the tables, please note that:
Tables 1,2 and 2a Progression to Higher Education by Free School Meal status
There may be pupils who are eligible for FSM but do not claim for a number of reasons. Such pupils will not be classified as in receipt of FSM for the purposes of this measure.
Pupils may have claimed FSM in earlier school years, but not when age 15. Such pupils will not be recorded as in receipt of FSM in this measure.
May include a small amount of double counting where pupils attend more than one school.
This measure only tracks entry to HE by age 19. A number of pupils may enter HE at a later age and are not included in this measure.
Prior attainment is not accounted for in this measure. Many pupils will not continue their education; therefore will not hold the qualifications to progress to HE.
Due to the matching procedures deployed, all figures in this measure should be treated as estimates. Tables 3ab and 3cd Progression to Higher Education by school type
Prior attainment is not accounted for in this measure. Many pupils may not achieve the required Level 3 qualifications to progress to HE.
Due to the matching procedures deployed, all figures in this measure should be treated as estimates.
Also please note the details in the Technical Note.
14
Further information is available
A detailed Technical Note and Changes Document are published alongside this publication.
Previously published figures are also available from the same website.
Section 5 gives details of some other sources of information on Widening Participation
Official Statistics
These are Official Statistics and have been produced in line with the Code of Practice for Official Statistics.
This can be broadly interpreted to mean that the statistics:
meet identified user needs;
are well explained and readily accessible;
are produced according to sound methods, and
are managed impartially and objectively in the public interest.
Once statistics have been designated as Official Statistics it is a statutory requirement that the Code of
Practice shall continue to be observed.
The Department has a set of statistical policies in line with the Code of Practice for Official Statistics.
Technical information
A quality and methodology information document accompanies this publication. This provides further
information on the data sources, their coverage and quality and explains the methodology used in
producing the data, including how it is validated and processed.
Get in touch
Media enquiries
Press Office News Desk, Department for Education, Sanctuary Buildings, Great Smith Street, London
SW1P 3BT.
Tel: 020 7783 8300
Other enquiries/feedback
John Simes, Higher Education Analysis, Department for Education, 2 St. Paul’s Place, Sheffield, S1 2FJ.
Email: [email protected]

© Crown copyright 2018
This publication (not including logos) is licensed under the terms of the
Open Government Licence v3.0 except where otherwise stated. Where
we have identified any third party copyright information you will need to
obtain permission from the copyright holders concerned.
To view this licence:
visit www.nationalarchives.gov.uk/doc/open-government-licence/version/3
email [email protected]
write to Information Policy Team, The National Archives, Kew, London, TW9 4DU
About this publication:
enquiries John Simes, Higher Education Analysis, Department for Education, 2 St. Paul’s
Place, Sheffield, S1 2FJ. Email: [email protected]
download https://www.gov.uk/government/collections/widening-participation-in-higher-
education
Reference: Widening Participation in Higher Education, England, 2016/17 age cohort
Follow us on Twitter: @educationgovuk
Like us on Facebook: facebook.com/educationgovuk