Why Was Europe Left at the Station When America’s Productivity Locomotive Departed? Robert J....
56
Why Was Europe Left at the Station When America’s Productivity Locomotive Departed? Robert J. Gordon Northwestern University, NBER, and CEPR Presented at ATP Investment Summit Copenhagen, October 10, 2005
-
date post
20-Dec-2015 -
Category
Documents
-
view
216 -
download
0
Transcript of Why Was Europe Left at the Station When America’s Productivity Locomotive Departed? Robert J....

Why Was Europe Left at the Station When America’s Productivity Locomotive Departed?
Robert J. Gordon
Northwestern University, NBER, and CEPR
Presented at ATP Investment Summit
Copenhagen, October 10, 2005

Two Big Themes
• Europe’s Productivity Almost Caught up and is Now Falling Behind: In What Sectors is This Happening and Why?
• How Much Does Real GDP per Capita Understate European Welfare?– Interpretation of hours per capita
– Other welfare differences

An Overriding Difference: The Consumer vs. the Producer
• The Fundamental Conflict between the Consumer and Producer.
• Everywhere you look, Europe protects the producer and penalizes the consumer
– Wal-Mart as a Symbol. Protecting the Consumer while Squeezing the Employee to Achieve the “Low Prices Always”
– Sitting in Europe vs. Standing in the U. S.

Qualifications
• Raw Growth Comparisons Lead to a pro-US bias
• Not enough Attention to U. S. Weaknesses
– Inequality
– Medical Care
– Education
– Protection and Pork Barrel
• Whenever I bring up a U. S. weakness, there’s always Ian jumping to the defense of the American Way (who is Ian?)
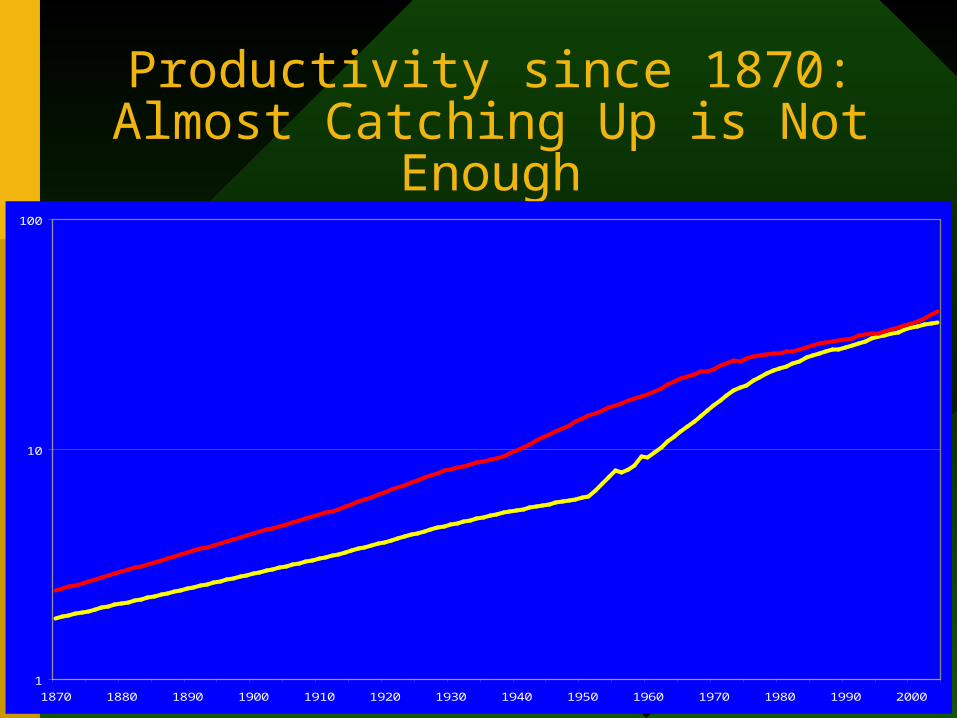
Productivity since 1870:Almost Catching Up is Not
Enough
1
10
100
1870 1880 1890 1900 1910 1920 1930 1940 1950 1960 1970 1980 1990 2000
Europe - 15
United States

Productivity Post-1960:The Ratio Reaches 96.9% in 1995
0
5
10
15
20
25
30
35
40
45
1960 1965 1970 1975 1980 1985 1990 1995 2000
Europe - 15
United States

133 Years: Falling Behind, Catching Up, Now Falling Behind
Annual Growth Rate of GDP per Hour, EU minus US, 1870-2003
-1.50
-1.00
-0.50
0.00
0.50
1.00
1.50
2.00
2.50
1870-1913 1913-1950 1950-1973 1973-1995 1995-2003

Where is the Difference? The Van-Ark Decomposition
• 55% retail trade
• 24% wholesale trade
• 20% securities
• Rest of the economy: ZERO
• U. S. negative in telecom, backwardness of mobile phones

Output per Hour by Industry Group, EU and US, 1990-2003
-2.0
0.0
2.0
4.0
6.0
8.0
10.0
12.0
1990-1995 1995-2001
US ICT Pro
EU ICT Pro
US ICT Using
EU ICT Using
US Non-ICT
EU Non-ICT
Finding the Culprit Industries

The Big Question: What’s Wrong with Europe in Retailing?
• U. S. “Big Boxes” (Wal-Mart, Home Depot, Best Buy, Target)
• Stunning Finding from Micro Data: ALL of U. S. retail productivity growth has been achieved by new post-1990 establishments and the closing of old establishments. Continuing establishments contributed nothing
• Europe: – Land-use regulation, planning approval
– Shop-closing restrictions
– Central-city congestion, protection of central-city shopping precincts

The New Conference Board Report: The Retailing Revolution
• Startling Numbers
• U. S. Retail Trade Productivity Growth
– 1980-95, only 2.6 percent per year
– 1995-2002, jumped to 7.4 percent per year
• U. S. Wholesale Trade
– Jumped from 4.1 to 8.5 percent over same time intervals

Five Factors Explain Europe’s Lagging Behind in Retail
• #1: U. S. got started first in converting retail from low-tech to high-tech
• #2: Europe’s regulatory obstacles– Regulation within individual countries
– Inconsistent regulation across national boundaries
• #3: Reduced opportunity for cross-border scale limits Europe’s ability to exploit Economies of Scale

The Last Two
• #4: Europe’s Trucking Industry was deregulated only in mid-1990s (U.S. in late 1970s)
– Inhibits complementary innovation in retail and shipping
• #5: Culture and taste differences among European Countries

Product Market Competition Imposes Costs
• Unbridled expansion of Wal-Mart and other
U. S. retail “big boxes”
– Tears up the countryside
– Destroys Main Street businesses in small towns
• Protection of the European urban retail “pedestrian zone”: Efficiency is not the only priority, other values matter

Ian on Wal-Mart
• “Wal-Mart vs. inner-city pedestrian shopping zones . . .”– Not an issue of variety vs. homogeneity
– It’s an issue of aristocracy vs. egalitarianism
• “To promote ancient downtowns at the cost of higher prices aids the rich and hurts the poor”
• My false dichotomy: IKEA in Sweden and a thriving downtown in my own Evanston

Turning to the SecondBig Theme: Welfare
Comparisons
• Blanchard (JEP Future of Europe Fall 2004)
– Everything is OK
– Productivity has caught up to 100%
– The 75% Ratio for Output per Capita reflects Voluntarily Chosen Leisure
• But He’s Wrong on Productivity
• What about Output per Capita?

The Broad Sweep of 2 Centuries:Income per Capita
1000
10000
100000
1820 1830 1840 1850 1860 1870 1880 1890 1900 1910 1920 1930 1940 1950 1960 1970 1980 1990 2000
Europe - 15
United States
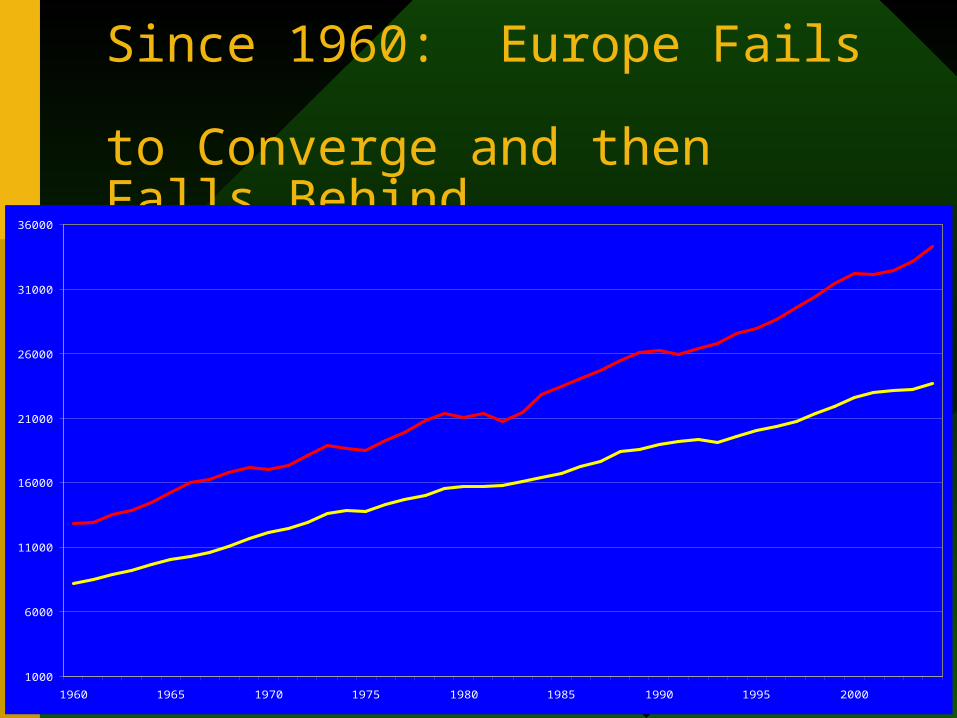
Since 1960: Europe Fails to Converge and then Falls Behind
1000
6000
11000
16000
21000
26000
31000
36000
1960 1965 1970 1975 1980 1985 1990 1995 2000
Europe - 15
United States
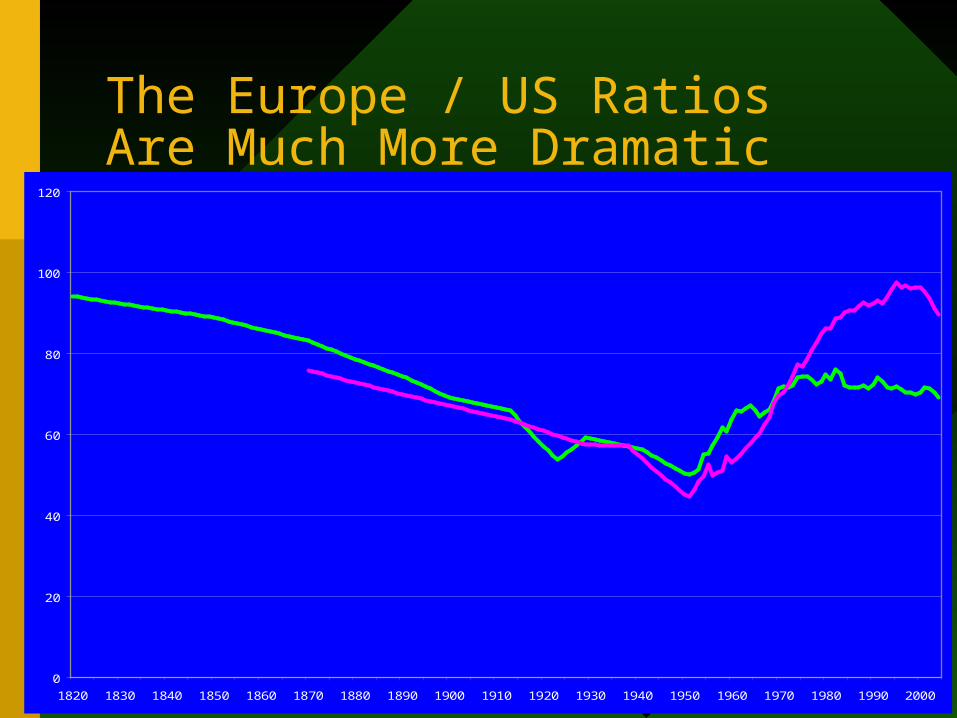
The Europe / US Ratios Are Much More Dramatic
0
20
40
60
80
100
120
1820 1830 1840 1850 1860 1870 1880 1890 1900 1910 1920 1930 1940 1950 1960 1970 1980 1990 2000
Output per hourOutput per capita
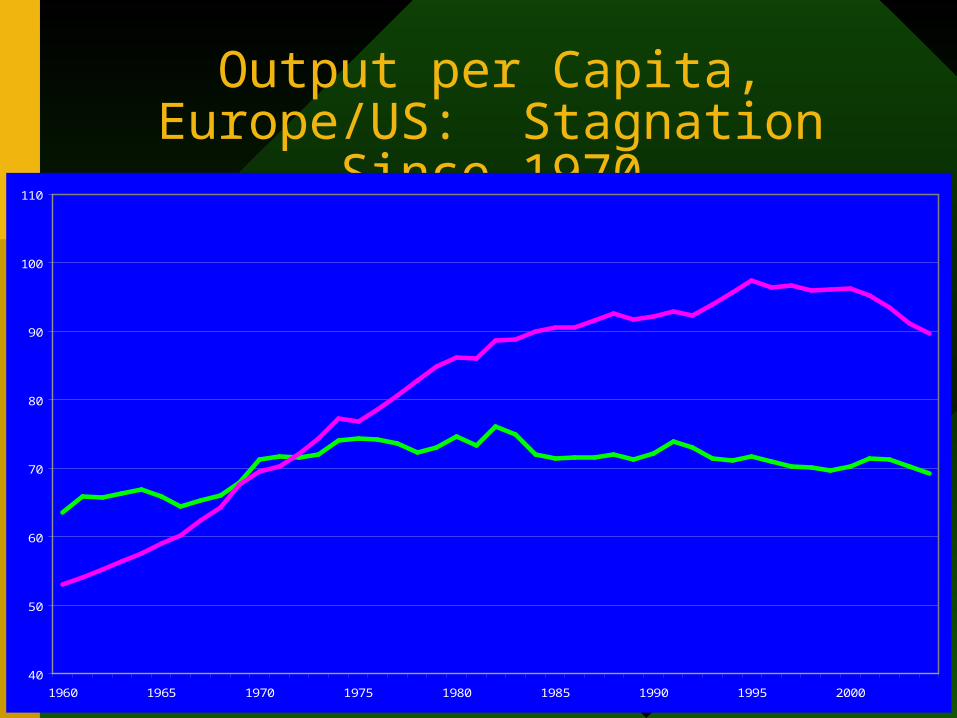
Output per Capita, Europe/US: Stagnation Since 1970
40
50
60
70
80
90
100
110
1960 1965 1970 1975 1980 1985 1990 1995 2000
Output per hour
Output per capita

Ratios of Ratios: The Real Clue as to What is Going On
60
70
80
90
100
110
120
130
1960 1965 1970 1975 1980 1985 1990 1995 2000
Hours per employee
Employee to population ratio
Output per capita tooutput per hour ratio

What are the Numbersthat Go with these Lines?
(Y/N) / (Y/H) H/E E/N
1960 119.8 102.4 115.9
1995 73.6 87.1 85.6
2004 77.1 85.4 91.7
% Log Change
1960-1995 -48.6 -16.1 -30.3
1960-2004 -44.1 -18.1 -23.4

Hours per Employee Declined in Tandem until 1970, then diverged
0
500
1000
1500
2000
2500
3000
3500
1870 1880 1890 1900 1910 1920 1930 1940 1950 1960 1970 1980 1990 2000
Europe - 15
United States

A Close-up of Hours per Employeeafter 1960
1400
1500
1600
1700
1800
1900
2000
2100
2200
1960 1965 1970 1975 1980 1985 1990 1995 2000
Europe - 15
United States
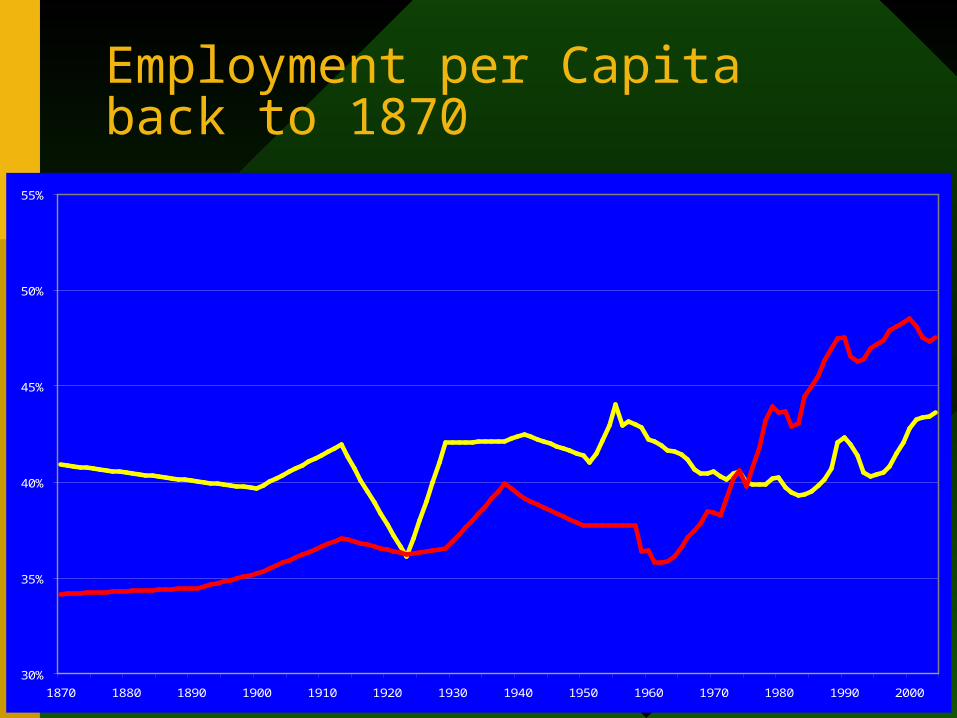
Employment per Capitaback to 1870
30%
35%
40%
45%
50%
55%
1870 1880 1890 1900 1910 1920 1930 1940 1950 1960 1970 1980 1990 2000
Europe - 15
United States

Employment per Capita: U.S. Women and Teens
Marched Off to Work 1965-1990
30%
35%
40%
45%
50%
55%
1960 1965 1970 1975 1980 1985 1990 1995 2000
Europe - 15
United States

An Outline of Issues for Discussion
• Europe’s failure to converge is not just a matter of voluntary vacations
• Much more of the change 1960-95 was the decline in employment per capita
• Even lower hours are not entirely voluntary– Ian: “If the French really wanted to work only 35 hours, why do
they need the hours police?”
– Alesina (NBER Macro Annual Conference 2005): • Short hours are a victory for unions and parliamentary politics, not for
free choice
• So is early retirement, a major source of falling E/N

What Matters for Welfare is Y/N + Differential Leisure, not Y/H
• Europeans have “bought” their high productivity ratio with every conceivable way of making labor expensive– High marginal tax rates (payroll and income taxes)
– Firing restrictions
– Early retirement (55! 58!) with pensions paid for by working people
– Lack of encouragement of market involvement by teens and youth

The Decline in Europe’s E/N Matters more than H/E
• First, which age groups are suffering from higher unemployment in Europe?
• Second, which age groups experience lower labor force participation in Europe?
• Third, how does it come together in the distribution of low E/N by age group?
• Note: These graphs are for total population by age and blur male/female differences.
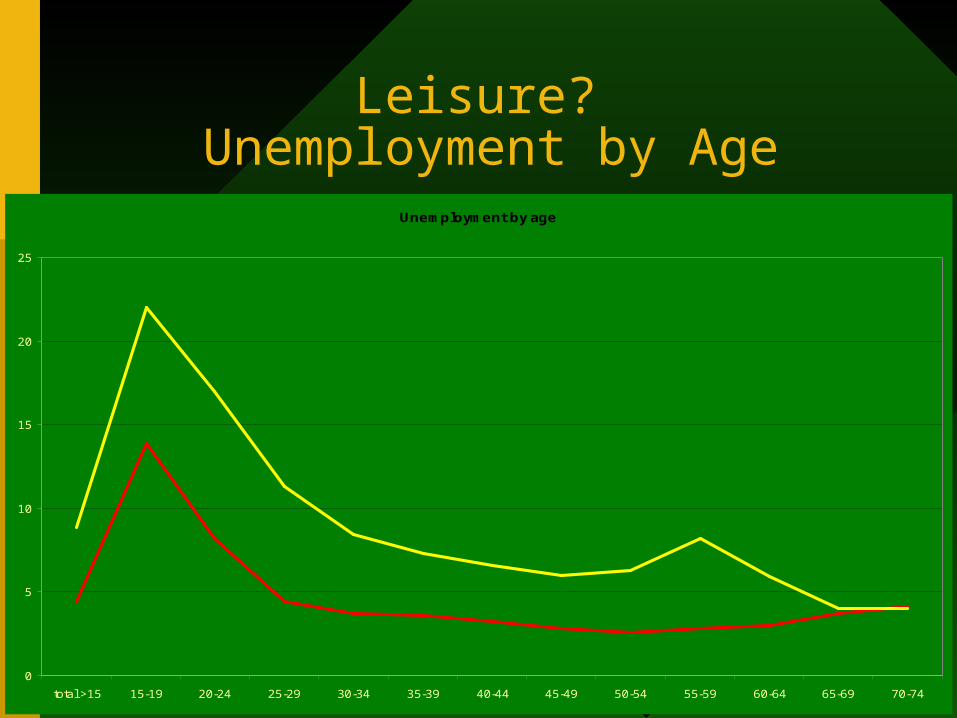
Leisure? Unemployment by Age
Unemployment by age
0
5
10
15
20
25
total >15 15-19 20-24 25-29 30-34 35-39 40-44 45-49 50-54 55-59 60-64 65-69 70-74
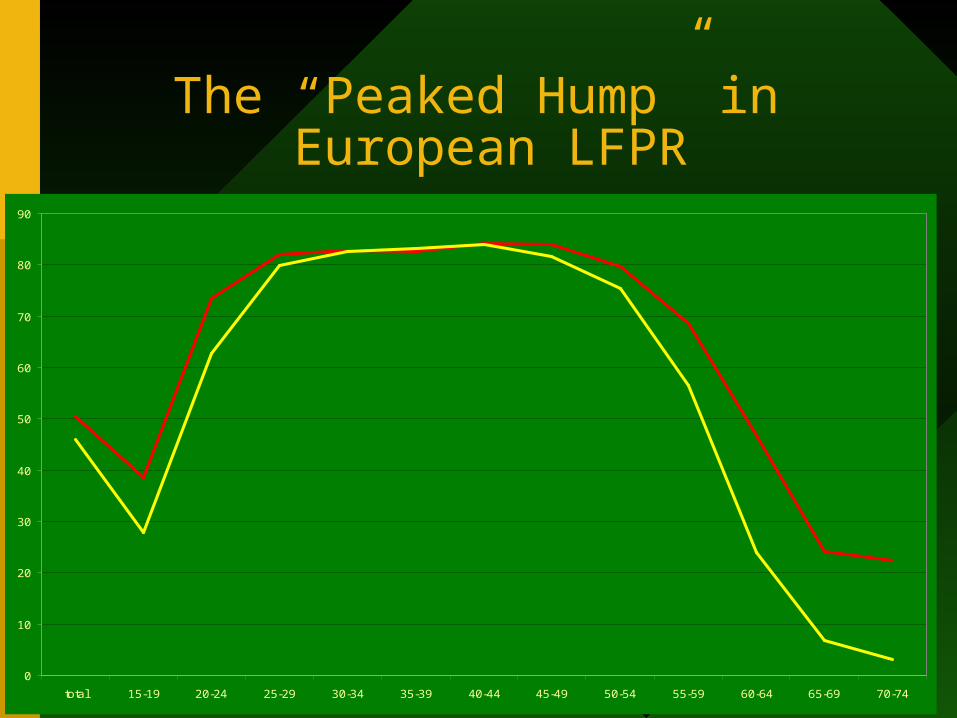
The “Peaked Hump” in European LFPR
0
10
20
30
40
50
60
70
80
90
total 15-19 20-24 25-29 30-34 35-39 40-44 45-49 50-54 55-59 60-64 65-69 70-74

Putting it Together:E/N by Age
Employment rates
0
10
20
30
40
50
60
70
80
90
total 15-19 20-24 25-29 30-34 35-39 40-44 45-49 50-54 55-59 60-64 65-69 70-74

Decomposing the EU/US Difference
in the E/N Ratio
age distribution unemployment LFPR E/N ratio
EU EU EU 87.14
US EU EU 86.19
EU US EU 91.23
EU EU US 97.11
US US EU 90.77
EU US US 102.1

Welfare Aspects of E/Nby Age Group
• Youth enter late into Market Employment
• If we are assessing extra European “leisure”, how much if any credit do we give to youth?
– Disconnected from the market economy
– American youth are expected to work
• Link with government support of higher education: tuition grants in Europe vs. peer-reviewed research grants in US
– Plus state university subsidies

The Welfare Effect of EarlyRetirement: Back-of-Envelope Handout
• Baseline: work age 20-65, retire 65-84
• No saving, investment
• 30% tax finances pay-as-you-go pensions with balanced govt budget– Tax finances equality of consumption in retirement to consumption
during work years
• Alternative retirement age at 55 requires tax increase to 45.6%, 25.1% decline in consumption during work years and retirement

Welfare Valuation of Leisure
• Work time is chosen to equate marginal utility of leisure to after-tax wage
• Diminishing marginal utility of leisure
– Infra-marginal leisure valued > wage
– Extra-marginal leisure valued < wage
• Back-of-envelope.
– Value weekday and weekend leisure of both workers and retired = 4/3 after-tax wage
– Value hours switched from work to retirement = 2/3 after-tax wage

Welfare calculation
• With 55 retirement age, after-tax wage is 25% less
• Extra hours switched from work to retirement leisure are low-valued (2/3)
• Total welfare = market consumption plus total value of leisure
• Market consumption declines 25.1 percent, welfare declines 22.6 percent, ratio 90% (i.e., leisure offsets 10%)

Conclusion about Leisure Offset
• Europe’s decline in H/E, not all of this is voluntary (Alesina)
• Europe’s decline in E/N due to unemployment and low labor force participation of youth and early retirees, virtually no leisure offset
• Freeman-Schettkat
– Part of difference in H/N represents not leisure but household production
– German mothers cook at home, American mothers go out to eat

Turn the Tables on the U. S.:The “Disconnect” between Welfare and PPP-Adjusted GDP
• GDP Exaggerates U. S. GDP per Capita
– Extreme climate, lots of air conditioning, low petrol prices, huge excess energy use
– U. S. urban sprawl: energy use, congestion
– Crime, 2 million in prison
• How much is this worth?

A Shrinking Explanation:Declining Btu / GDP
200
250
300
350
400
1940 1950 1960 1970 1980 1990 2000 2010
5
10
15
20
25
Btu/GDP
Btu per capita

The EU-US Difference is only 2% of GDP
0
2,000
4,000
6,000
8,000
10,000
12,000
14,000
16,000
1980 1985 1990 1995 2000

Other Additions or Subtractions from Europe’s Welfare
• Urban Congestion? – London vs. NY? Paris vs. Chicago?
– Time spent in London underground vs. in a Chicago automobile?
• Prisons, perhaps 1% of GDP
• Undeniable U. S. superiority: housing– People value interior square feet (2X in US)
– People value exterior land (4X in US)

Ian on Urban Density
• “We overspend on highways, they overspend on trains”
• “We live in suburbs and have long commutes, they live in cramped homes and are closer to work”
• “We have options: in Chicago I can live in a suburb and drive OR live in an apartment and walk to work”
• However, many Americans lack such options– Inner city African Americans seeking suburban jobs
– Many medium and small cities have virtually no public transit options, and there are few jobs where you can “walk to work”

Putting it Together for 2004
• EU/US Y/N = 68.8
• EU/US Y/H = 89.2
• Raise Europe:– 67% of H/E difference (11.8) is leisure = 7.9
– 10% of E/N difference (8.6) = 0.9
– Half of Energy use difference = 1.0
– Prisons and other = 1.0
• Europe’s welfare vs. U. S. = 79.6

A Solid Reason why the U. S.Welfare Level is Truly Higher
• Hedonic regressions show: people value square feet of housing and exterior land
• The average American housing unit is more than double the average European unit
• The land area is at least 4x, maybe more
• The time cost of commuting may be less when all the delays of public transit are taken into account

Aggregation in U. S., Lack of Aggregation in Europe
• Puzzle is not failure in Europe, it’s heterogeneity in Europe
• If you disaggregated the U. S., you’d find similar differences in Productivity growth and IT use:
– Silicon Valley = Ireland + Finland
– New England = Denmark + Sweden
– Austin Texas = Australia
– Heartland = France or Germany
– What’s Missing in U. S. is Olive Belt (IT+PO+SP+GR)• But we’ve got it south of the border in the Tequila Belt

Finally, A Set of Qualificationsabout the Apparent U. S.
Advantage
• #1. Europe is not Homogeneous
• #2. Secondary Education in U. S.
• #3. Chaotic and Inefficient Medical Care
• #4. Astounding Results on Inequality
• #5. Perverse Public Policies

Qualifications about the U. S.
• Education
– Poor elementary and secondary schools dependent on wildly unequal finance across school districts
– U. S. ranks low on world league tables of science and math knowledge by teenagers

The U. S. Medical Care Non-System
• Medical Care Insurance Tied to Employment, not a Right of Citizenship– Artificial creation of part-time jobs
– Toyota builds its new plant in Canada
– The noose around the neck of the legacy firms (GM and Ford)
• 4% of GDP wasted on paperwork
• Economists are Making this worse – confusion about moral hazard

Some New Results About Inequality: Shares of Growth in Real Wage and Salary Income,
1997-2001
80-9014.8%
50-8023.4%
90-9511.0%
95-9914.3%
99-99.916.2%
20-5010.8%
99.9-1007.7%
0-201.9%

Percent of Real Income Growth Accounted for by Top 10 Percent
Figure 12.Share of Top 10 Percent in Increase of Real Income, $2000, Selected
Intervals, 1966-2001
0
10
20
30
40
50
60
70
1966-79 1979-97 1997-2001 1966-2001
Perc
en
t
Labor Income
Nonlabor Income
Total Income

Government Interventionin the U. S. is off the Rails
• Farm subsidies: hurt LDCs, promote obesity
• Steel Tariffs
• Medical Care: Run in the interest of giant insurance and pharmaceutical corporations
• Starvation of Public Transit and Subsidization of Interstate Highways
• Pork-Barrel Energy Bill and Transportation Bill, the Bridge to Nowhere in Alaska
• Local Zoning and Inequality of School Finance
• Tax Deductibility of Mortgage Interest

Ian on Farm Subsidies
• “To complain about American subsidies seems odd considering that the average cow in Europe earns more income in subsidies than the median income of the world”
• OK, Europe and U.S. are equally guilty on farm subsidies
• The rest of my list is intact

Conclusion: Persistence of American Exceptionialism
• America:
– Long work hours, short vacations
– Low-density metro areas
– High fertility
– Role of immigration interacts with flexible labor markets

Are Tastes Endogenous?
• Europe and U. S. have Settled down in Two Different Equilibria?
• Can One Side Converge to the Other?
• Policies, Constraints, Influence Tastes
• The Best Prediction is: Still Different in 50 years

Let Ian Have the Final Word
• “In Europe you have to pay higher prices so that rich people get variety”
• “If you want half-decent higher education, you have to leave the continent”
• “If you’re poor, you can’t rise because it’s hard to start a company and you can’t work more than 35 hours per week”
• “Show me a European Richard Grasso (former CEO of the New York Stock Exchange), a man who didn’t go to college and got fired for making too much money”