Robust Quantification of Earthquake Clustering: Overcoming the Artifacts of Catalog Errors

Fe and Cu Artifact XRF Analysis
Why quantification can not be done on artifacts that have corrosion or dirt on them or the object itself is
not uniform in content!
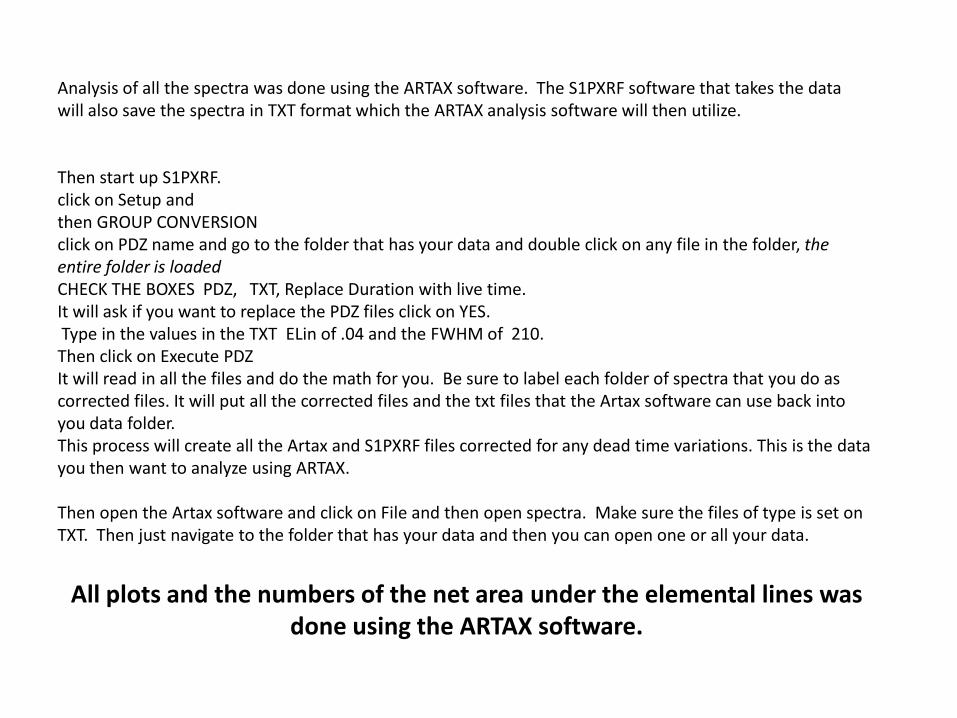
Analysis of all the spectra was done using the ARTAX software. The S1PXRF software that takes the data will also save the spectra in TXT format which the ARTAX analysis software will then utilize.
Then start up S1PXRF.click on Setup and then GROUP CONVERSION click on PDZ name and go to the folder that has your data and double click on any file in the folder, the entire folder is loadedCHECK THE BOXES PDZ, TXT, Replace Duration with live time. It will ask if you want to replace the PDZ files click on YES.Type in the values in the TXT ELin of .04 and the FWHM of 210. Then click on Execute PDZ It will read in all the files and do the math for you. Be sure to label each folder of spectra that you do as corrected files. It will put all the corrected files and the txt files that the Artax software can use back into you data folder.This process will create all the Artax and S1PXRF files corrected for any dead time variations. This is the data you then want to analyze using ARTAX.
Then open the Artax software and click on File and then open spectra. Make sure the files of type is set on TXT. Then just navigate to the folder that has your data and then you can open one or all your data.
All plots and the numbers of the net area under the elemental lines was done using the ARTAX software.

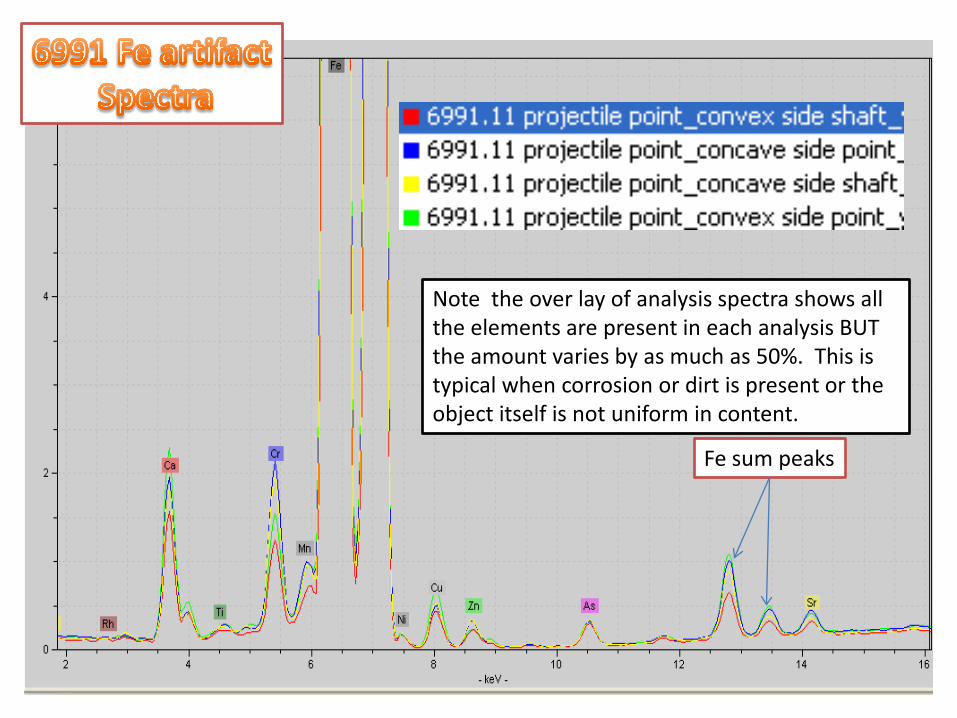
Note the over lay of analysis spectra shows all the elements are present in each analysis BUT the amount varies by as much as 50%. This is typical when corrosion or dirt is present or the object itself is not uniform in content.
Fe sum peaks

Note the over lay of analysis spectra shows all the elements are present in each analysis BUT the amount varies by as much as 50%. This is typical when corrosion or dirt is present or the object itself is not uniform in content..
Fe sum peaks
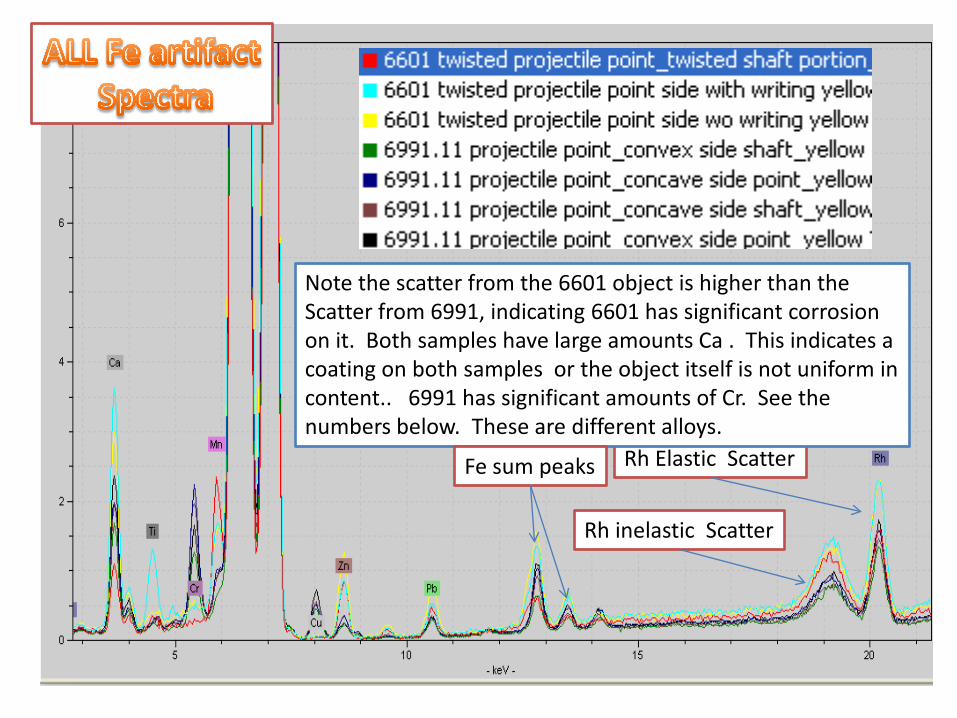
Rh Elastic Scatter
Rh inelastic Scatter
Note the scatter from the 6601 object is higher than the Scatter from 6991, indicating 6601 has significant corrosion on it. Both samples have large amounts Ca . This indicates a coating on both samples or the object itself is not uniform in content.. 6991 has significant amounts of Cr. See the numbers below. These are different alloys.
Fe sum peaks

Note the over lay of analysis spectra shows all the Fe varies greatly. This is typical when corrosion or dirt is present or the object itself is not uniform in content..

Note the over lay of analysis spectra shows all the Fe varies greatly. This is typical when corrosion or dirt is present or the object itself is not uniform in content. .

The net area under the elemental lines shown on the next slides was gotten using the Gaussian curve fitting option in the Artax analysis software. This allows one to do semi quantitative evaluation of the spectra data.

Rh KNormalized
Element6991.11 projectile point_convex PT
6991.11 projectile point_concav PT
6991.11 projectile point_concav Shaft
6991.11 projectile point_convex Shaft 6991.1 AVE STD Dev %SD
Ratio to Fe 6991.1
Ca 11444 10255 10419 10169 10572 591 5.6 0.00573
Cr 6689 10636 10859 6883 8767 2290 26.1 0.00475
Mn 1340 1502 1443 1053 1335 199 14.9 0.00072
Fe 1814848 1847948 1873242 1839124 1843791 24112 1.3 1.00000
Cu 3893 2961 3437 3273 3391 388 11.5 0.00184
Zn 1163 1779 2052 1576 1643 375 22.8 0.00089
As 1757 1903 2095 2185 1985 192 9.7 0.00108
Sr 2604 2771 2272 2094 2435 308 12.6 0.00132
Rh 12374 12374 12374 12374 12374 0 0.0
Rh K Normalized
Element6601 twisted proj
point w label6601 twisted proj
point wo6601 twisted proj
point shaft 6601 AVE STD Dev % STD Dev Ratio to Fe
Ca 17404 13785 7857 13015 4820 37.0 0.00579
Ti 5871 993 1910 2925 2592 88.6 0.00130
Cr 426 575 285 429 145 33.8 0.00019
Mn 5869 5532 16299 9233 6121 66.3 0.00411
Fe 2220304 2374491 2143141 2245979 117793 5.2 1.00000
Cu 135 158 307 200 94 46.7 0.00009
Zn 4829 7318 7692 6613 1556 23.5 0.00294
Sr 1903 1965 1368 1745 328 18.8 0.00078
Rh 17638 17638 17638 17638 0 0.0 0.00785
Pb 2935 5050 4245 4077 1067 26.2 0.00182
The great variation as indicated by the % STD Dev between analysis shows that 6601 is covered by corrosion. Xrf quantification is not possible
The variation as indicated by the % STD Dev between analysis shows that 6991 is covered by some corrosion. Xrf quantification is not possible.
net area under the elemental lines

Summary analysis
Element 6991.1 AVE Ratio Fe 6601 AVE Ratio FeCa 10571.9 0.00573 13015.2 0.0058Ti 0.0 0.00000 2924.8 0.0013Cr 8766.9 0.00475 428.7 0.0002
Mn 1334.6 0.00072 9233.1 0.0041Fe 1843790.6 1.00000 2245978.5 1.0000Cu 3391.0 0.00184 200.2 0.0001Zn 1642.5 0.00089 6613.0 0.0029As 1984.9 0.00108 0.0 0.0000Sr 2435.1 0.00132 1745.2 0.0008Rh 12374.0 0.00671 17638.0 0.0079Ag 0 0.00000 0 0.0000Sn 0 0.00000 0 0.0000Pb 0 0.00000 4076.5 0.0018
The great variation in the area under each element peaks as the analysis shows, indicates that 6601 and 6991 are different either in the corrosion layer or the alloy itself. Xrf quantification is not possible. To be sure the alloy is deferent you would have to analyze, “clean” samples.
net area under the elemental lines

Rh Elastic Scatter
Rh inelastic Scatter
Cu/Zn sum peaks
Note the scatter from the both objects is the same indicating very little corrosion These are different alloys.


Element6545.23 projectile
point_side wo label6545.23 projectile point_side w label
6545.2 Ave
Ratio to Cu Element
5496.11 proj point side wo
labelRatio to
Cu
Ca 2965 1975 2470 0.001 Ca 1843 0.0007
Ti 339 294 317 0.000 Ti 459 0.0002
Fe 8633 7325 7979 0.004 Fe 6933 0.0026
Cu 1905701 1984771 1945236 1.000 Cu 2667684 1.0000
Zn 739623 687643 713633 0.367 Zn 549517 0.2060
Rh 6217 6215 6216 0.003 Rh 7914 0.0030
Ag 0 0 0 0 Ag 982 0.0004
Sn 0 0 0 0 Sn 1679 0.0006
Sn 0 0 0 0 Sn 277 0.0001
Pb 44664 44781 44723 0.023 Pb 27142 0.0102
Looking at all the plots of the spectra and the analysis of the area under the peaks clearly shows these are different alloys of Cu with variation in all key elemental components; Zn, Pb and Sn.
net area under the elemental lines