

Why Poland? Michal Mierzwa Head of Trade and Investment Promotion Section Polish Embassy Cairo.
33
Why Poland? Michal Mierzwa Head of Trade and Investment Promotion Section Polish Embassy Cairo
Transcript of Why Poland? Michal Mierzwa Head of Trade and Investment Promotion Section Polish Embassy Cairo.

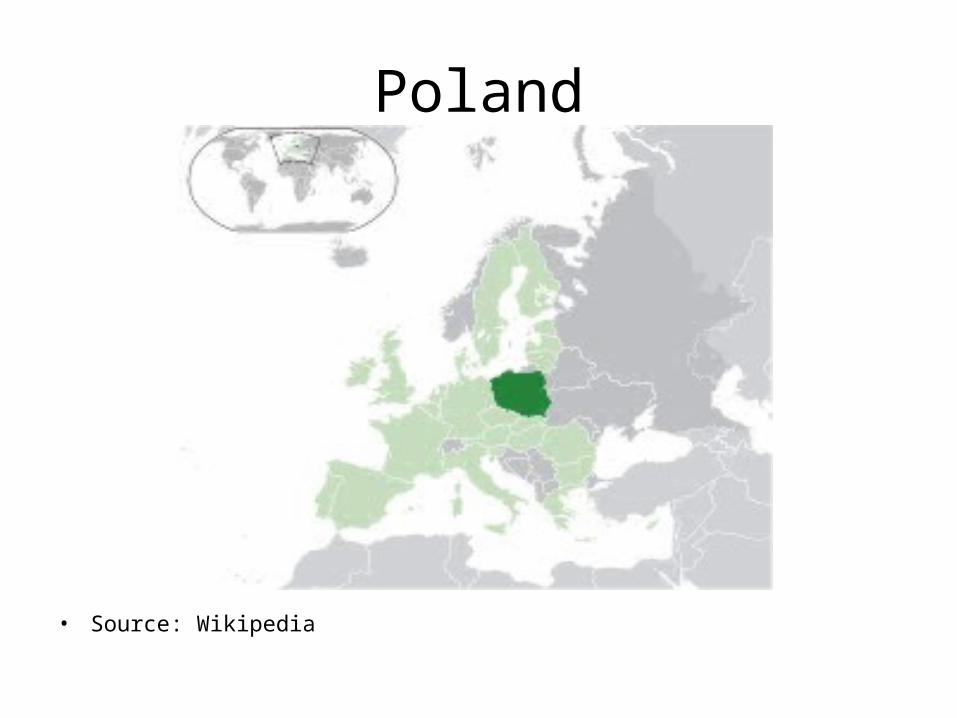
Why Poland?
Michal MierzwaHead of Trade and Investment Promotion Section
Polish EmbassyCairo
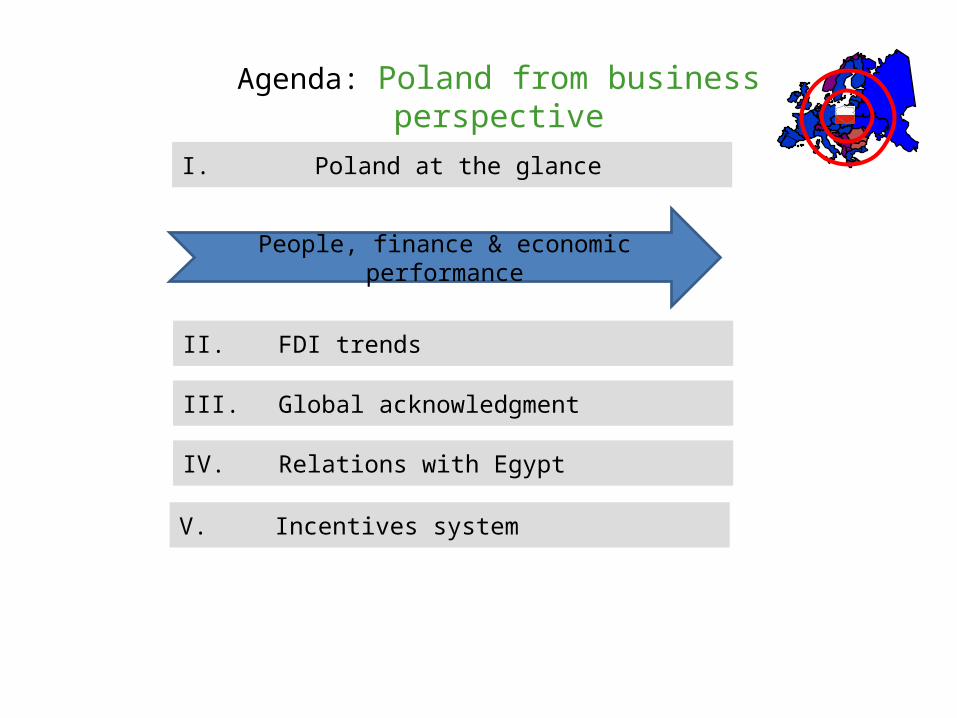
Agenda: Poland from business perspective
I. Poland at the glance
II. FDI trends
III. Global acknowledgment
IV. Relations with Egypt
V. Incentives system
People, finance & economic performance

Cooperating with Poland?

People: 38 m (6th in EU)
• Median age 37 y• Labour force 17 m• Unemployment 10 % • Labour force/occupation 5% agr./31% serv./54%ind.
20 m young people
almost 2 m students
more than 430 thous. graduates every year
more than 90% of students know foreign languages

Finance• Average wage (monthly) $920 net, $1,300 gross• Statutory min. wage (monthly gross) 1,386 PLN ($470)• Social security by employer ca. 20%• PIT 18-32%• CIT 19%• VAT 0-8-23%• Inflation 4%• Repo 4.5%Investment incentives• 2007-2013: EUR 90 bn into economic projects, innovation,
infrastructure & HR• 14 Special Economic Zones• Grants for priority sectors• EUR 24 bn- 2012 European Football Championship

Economic stability•Main driver of economic growth:
– domestic demand – 4.5%– overall consumption – 2.9%
• GDP (PPP): total $754,097 bn (20th) • Per capita: $19,752 (40th)• GDP (nominal): total $468,539 bn• Per capita: $12,300 • GDP/sector: 4.6% agr./28.1% ind./67.3% serv.• IMF 2011-2016 GDP growth projections : 3.8%-3.6% (4.5% 1993-2010)
1.7%-2.1% (2%) 1.2%-6.5% (5% 1993-2010)
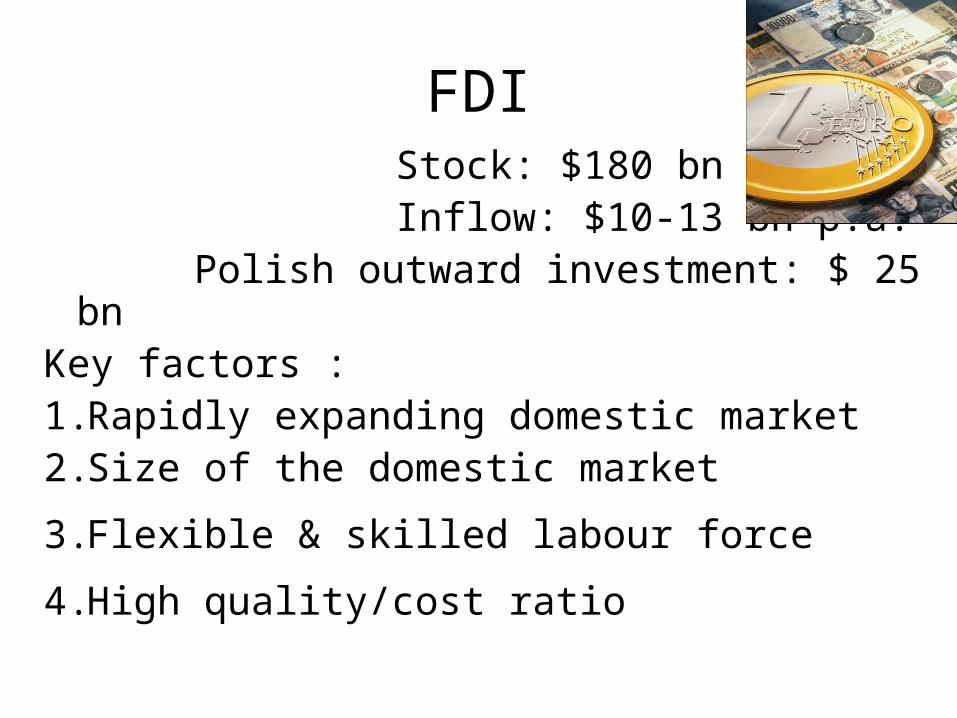
FDI Stock: $180 bn Inflow: $10-13 bn p.a.
Polish outward investment: $ 25 bnKey factors : 1.Rapidly expanding domestic market 2.Size of the domestic market
3.Flexible & skilled labour force
4.High quality/cost ratio

4.7
4.7
5.2
6.4
8.4
11.1
14.3
20.8
22.9
Great Britain
Austria
Italy
Sweden
USA
Luxembourg
France
Germany
the Netherlands
FDI stock in Poland (EUR bn)
EU 89,7%
Other countries
10,3%
Geographical sources of FDI
Geographical sources of FDI inflow(in EUR bn, cumulative since 1993)
Source: National Bank of Poland 2011
63,576,7
121,1128,8 136,4
95,4
116,4
0
20
40
60
80
100
120
140
160
2004 2005 2006 2007 2008 2009 2010
EU
R b
n
Cumulative value of FDI

FDI by industry
Manufacturing 31%
Finance 20%
Others 15%
Trade & repairs 17%
Real estate & accounting 17%

Great Story to Tell (1)Services and Manufacturing Hub in Poland
AutomotiveAutomotive
White goodsWhite goods
ElectronicsElectronics
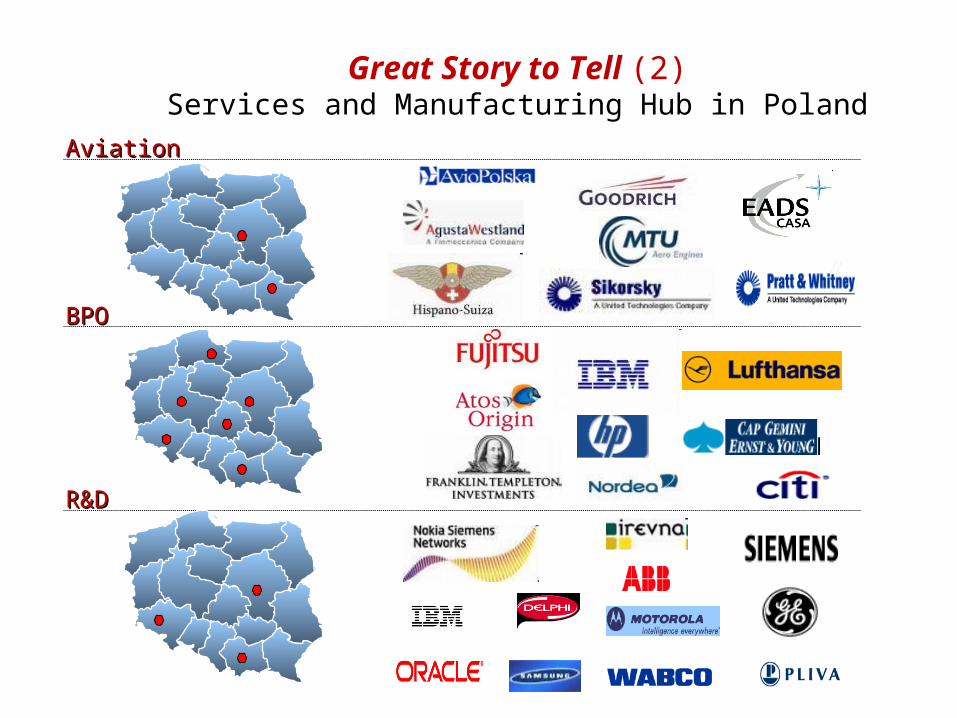
Great Story to Tell (2)Services and Manufacturing Hub in Poland
AviationAviation
BPOBPO
R&DR&D

Investors confidence

Source: AmCham, KPMG 2010
Investment attractiveness of Poland – strenghts

Source: AmCham, KPMG 2010
Investment attractiveness of Poland – weaknesses
-1,40
-1,20
-1,00
-0,80
-0,60
-0,40
-0,20
0,00
Support fromgovernmentinstitutions
Simpicity of taxsystem Red tape
Quality of railwaysystem
Quality of roadsystem

Exports 2010 $160 bn (+17%)

Imports 2010 $178 bn (+19%)

Polish Exports to Egypt $233 m

Geographical export distribution
EU=80%

Polish imports from Egypt$50 m

Geographical import distribution
EU=60%

Major Polish exporters1. Bel Group, cheese +machinery2. Contractus, milk powder+machinery3. FTK, tobacco4. GSK Parmaceuticals5. Geofizyka, exploration6. KGHM, copper7. Ciech, chemicals8. Debica, tyres9. Purcell Systems, TT enclosures10. Apator Metrix, gas meters11. Befared, motor reducers12. Gemalto, digital security, electronic passport13. ABB, electric motors, transformers, electricity grids14. Hepam, disconnectors15. Philips Lighting

Major Polish importers1. Ciech, chemicals, plastics2. GSK Pharmaceuticals3. Tesco4. C&A, branded apparel5. Defalin Group, twines+ropes6. Andropol, home+industrial fabrics7. Pirelli8. CDM, wooden windows, doors9. Hart-SM, tempered glass10. BRW, kitchen fronts, furniture11. DS Smith, recycled packaging+ office products12. Farm Frites, fresh frozen vegetables13. Kamis, condiments14. Cenos, hulled rice , groats, peas, corn15. Instanta, instant coffee

15 Polish sectors with potential for export to and cooperation with Egyptian companies
1. Polish food specialties 2. Agroindustry3. Automotive industry4. Brown and white goods5. IT and ICT6. Biotechnological and pharmaceutical industry7. Cosmetics 8. Production of medical equipment and measuring devices9. Woodwork of windows and doors10.Furniture 11.Construction industry- services and products12.Mining machines and equipment13.Apparel, accessories, leather articles14.Health tourism15.Yacht and recreational boat manufacturing

Major Polish investors
1. PGNiG, oil industry, Cairo2. Can Pack Linco, packaging, Cairo3. Magic Play, tourist village, Hurghada4. Dolfinella for Touristic Hostelry, South Sinai5. Sonata for Real Estate Investment, Red See6. Cora Lo Mors, real estate, Red See7. Ozis, socks manufacture, Ismailia 8. Hacon for Metal Industry, 6th of October9. Halabanaha for Touristic Investment, Red See10.Agaby for Touristic Facilities Management and Real Estate Investment, Red See11. International for Touristic Investment,
Red See

Tax breaks CIT exemption in Special Economic Zone
Real estate tax exemption
Cash support
Government grants through individual negotiations
Cash grants available through EU Funds
Incentives: Forms of regional aid
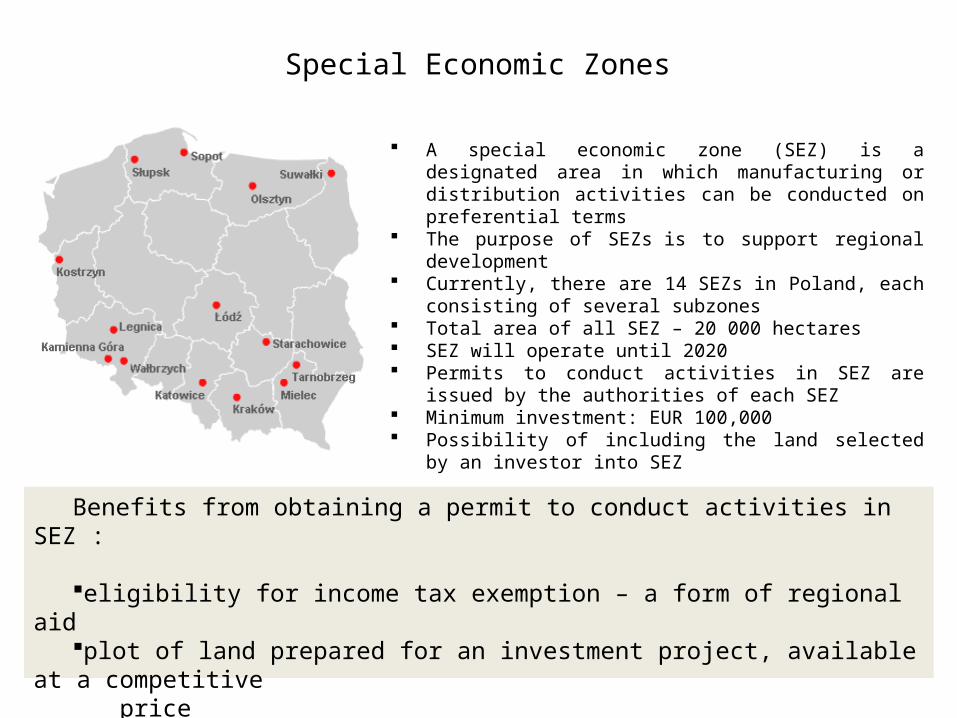
Special Economic Zones
A special economic zone (SEZ) is a designated area in which manufacturing or distribution activities can be conducted on preferential terms
The purpose of SEZs is to support regional development
Currently, there are 14 SEZs in Poland, each consisting of several subzones
Total area of all SEZ – 20 000 hectares SEZ will operate until 2020 Permits to conduct activities in SEZ are issued by
the authorities of each SEZ Minimum investment: EUR 100,000 Possibility of including the land selected by an
investor into SEZ
Benefits from obtaining a permit to conduct activities in SEZ :
eligibility for income tax exemption – a form of regional aidplot of land prepared for an investment project, available at a
competitive price
free assistance in dealing with formalities relating to the investment project

Priority sectors: Government grants
Production
automotive
electronics
aviation
biotechnology
„big investment” in other sectors
System of support of investments of considerable importance for Polish economy
Purpose of support
development of innovativeness and competitiveness of Polish economy
Result of support
50 programmes of total amount 13,5 bn PLN (since 2004 r.)
33,7 thous. of new jobsSource: PAIiIZ, Ministry of Economy
Modern services
ICT
SSC
BPO
R&D activity

Government grants
Sector New work places andInvestment
outlays
Maximumamount of
support
Support for new investment
Priority sectors 50 PLN 160 m2% to 10.5% of
investment outlays
Large investment in other sectors
500 PLN 1 bn

Incentives available for manufacturing projects
Available instruments?
Minimum requirements
How much?Investment
expendituresNew job places
Investment grant PLN 160 m 502-10.5% of investment outlays
Employment grant PLN 40 m 2503,200 – 15,600 PLN/work place
EU grants PLN 160 m 150max. 30% of investment expenditure
CIT exemption (SEZ) EUR 100,000subject to negotiations
To the maximum level of public aid for the project or to the end of existence of SEZ
RET exemption depends on the location
Measure 4.5, sub-measure 4.5.1
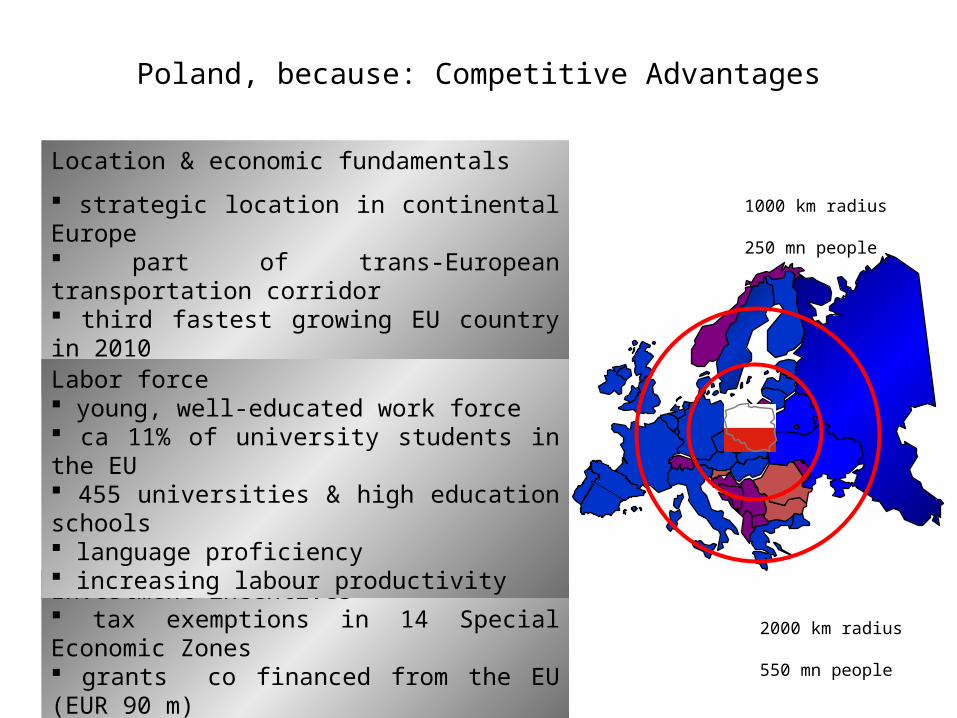
Poland, because: Competitive Advantages
Location & economic fundamentals
strategic location in continental Europe part of trans-European transportation corridor third fastest growing EU country in 2010 38 million consumers
Investment incentives tax exemptions in 14 Special Economic Zones grants co financed from the EU (EUR 90 m)
Labor force young, well-educated work force ca 11% of university students in the EU 455 universities & high education schools language proficiency increasing labour productivity
1000 km radius
250 mn people
2000 km radius
550 mn people

Market penetration
Business dialogue
B2B
Awareness raising
•State & business missions•Fairs & exhibitions•Contacts with GOP, GOE & business
•Business leads & referrals•Intelligence on economy, sectors & financial incentives
•Niche identification
•Consultancy & advice•Advocacy
•Trade & investment seminars•PR
Our purpose: Helping make the right choices
Our activity: Providing & supporting intelligence & projects
Our mission: Enhancing trade & investment with Egyptian business