Why Not Divide and Conquer? Targeted Bargaining and Violence in
239
Why Not Divide and Conquer? Targeted Bargaining and Violence in Civil War Rex W. Douglass A DISSERTATION PRESENTED TO THE FACULTY OF PRINCETON UNVERSITY IN CANDIDACY FOR THE DEGREE OF DOCTOR OF PHILOSOPHY RECOMMENDED FOR ACCEPTANCE BY THE DEPARTMENT OF POLITICS Adviser: Joanne Gowa September 2012
Transcript of Why Not Divide and Conquer? Targeted Bargaining and Violence in

Why Not Divide and Conquer? Targeted Bargaining
and Violence in Civil War
Rex W. Douglass
A DISSERTATION
PRESENTED TO THE FACULTY
OF PRINCETON UNVERSITY
IN CANDIDACY FOR THE DEGREE
OF DOCTOR OF PHILOSOPHY
RECOMMENDED FOR ACCEPTANCE
BY THE DEPARTMENT OF POLITICS
Adviser: Joanne Gowa
September 2012
© Copyright by Rex W. Douglass, 2012.
All rights reserved.

iii
For my parents, Debra and Larry.
iv
Abstract
How do rebel groups maintain cohesion when faced with powerful and wealthy
governments? Successful rebel groups are a paradox in international relations because
they manage to solve collective action problems in wartime environments that lack
third-party enforcement and monitoring opportunities. Governments ought to be able
to split these rebel groups using a divide-and-conquer strategy of directed amnesty,
rewards, and intimidation. I investigate three specific dimensions of the cohesion of a
rebel movement: (1) the degree to which rebels can operate among the civilian
population outside of their main base areas; (2) the rate at which rebel groups lose
members through defection to the government; and (3) the degree to which civilians are
willing to withhold information from the government to protect rebels from arrest and
assassination even at risk to themselves.
Of all the tools of persuasion (e.g. ideological appeals, public goods, targeted
rewards), I show that rebel cohesion is most clearly threatened by brute military force.
Civilians will provide the tips needed for selective targeting when the alternative is
indiscriminate targeting. Rebels will defect when the government militarily takes
control of their communities. I explain the success of brute force over softer appeals by
detailing the organizational and principal agent problems inherent to rebel organization
in a war-zone. Large structural factors, particularly the ability to develop a monopoly of
v
control over territory, provide far more leverage over civilians and fighters than
punishment and reward strategies ever could.
I test and illustrate this argument using remarkably detailed microlevel evidence
from the Vietnam War. Using textual and electronic archival records, I provide new
data on Viet Cong defections, government assassinations of civilians, the division of
territorial control, and other novel measures. New kinds of data require new techniques
for analysis. I show that by disaggregating selective targeting by the source of
information used to identify the suspect, the role of government coercion in generating
civilian cooperation is revealed. I also show that even amorphous concepts like
territorial control can be accurately measured on a large scale by expert surveys through
application of models from item response theory.

vi
Acknowledgements
In the almost four years of work on this project and close to nine years of training
in social science, I have accrued a long list of debts across a number of institutions. I
thank my dissertation advisers Joanne Gowa, Kris Ramsay, and Jake Shapiro for their
mentorship, advice, and support. I thank Ethan Bueno de Mesquita for his feedback and
coming on as my outside reader. Like war, dissertations succeed or fail based on
logistics and Cindy Ernst and Kristen D. Seith have gone above and beyond to ensure
that my dissertation never ground to a halt. A number of individuals assisted in this
research. In the early phases I appreciate help provided by David Madden and Josh
Martin. In later phases, I appreciate the help of Josh Borkowski, Amy Dao, Katherine
Elgin, Stephanie Jordan, and Jacques R. Singer-Emery. A particularly talented
researcher, Walter Fick, made a heroic effort to help me over the last hump of writing
and completion.
I gratefully acknowledge both direct and indirect financial support from a grant
by the Minerva Research Initiative through the Air Force Office of Scientific Research
and a grant from Bobst Center for Peace and Justice. I had the opportunity to present
parts of this research in a number of venues. I appreciate the comments and feedback
from the participants of the Princeton International Relations Graduate Seminar, the
Empirical Studies of Conflict Governance, Development, and Political Violence
Workshop, and the Yale Program on Order, Conflict, and Violence.
vii
This work is based on evidence which was preserved by hundreds of dedicated
individuals, of which several generously shared their time and expertise with me. At
the United States National Archives in College Park I thank archivists Richard Boylan,
Martin Gedra, Lynn Goodsell, and Andrew Knight. At the University of California
Irvine Special Collections and Archives I thank archivist Christina Woo and former
RAND analyst Joseph Carrier who shared with me a great deal of insights into his
records on and experience with Viet Cong defection. At the United States National
Archives Kansas City I thank archivists Pamela Anderson and Jake Ersland and two
research assistants Will Hickox and Dustin Stalnaker. Additionally I thank the staffs at
the U.S. Survivability/ Vulnerability Information Analysis Center and the U.S. Air Force
14th Weather Squadron.
I have learned from and enjoyed the company of many scholars in the course of
this project. Almost all gave feedback on this project or at a minimum one of its
precursors. I particularly appreciate the opportunity to have learned from Chris Achen,
Kosuke Imai, Tse-min Lin, Adam Meirowitz, and to have gained appreciation for
historical research from H.W. Brands and Francis J. Gavin. For their support in
navigating the first phases of graduate school I thank Aaron Friedberg, Helen Milner,
and Keith Whittington. For mustering the resources, setting the example, and providing
feedback and encouragement, I thank members of the Empirical Studies of Conflict
Group including Eli Berman, Joseph Felter, David Laitin, Jason Lyall, and Jeremy
viii
Weinstein. Through that group, I had the opportunity to meet and learn from a number
of talented individuals including Michael Callen, Luke Condra, Radha Iyengar, Patrick
Johnston, Oliver R. Kaplan, Christopher Paik, Abbey Steele, and Nils Weidmann. I
greatly benefited from feedback from fellow travelers who have worked with the
Vietnam data including Matthew Kocher, Håvard Kongsgård, and Stathis Kalyvas.
At Princeton, I worked and learned alongside a remarkable group of people. For
on call editing and many late nights, I thank Kristen Harkness, Michael A. Hunzeker,
Alexander Lanoszka, and Thomas L. Scherer. For their friendship and support I thank
Lamis Abdelaaty, Scott Abramson, Matt Barnes, Graeme Blair, Brookes Brown, Peter E.
Buisseret, Will Bullock, Sarah Bush, Steven Chaudoin, Jeff Colgan, Nick Goedert, Kasia
Hebda, Sarah Hummel, Kevin Hughes, David Hsu, Matt Incantalupo, Kris Johnson,
Adam Liff, Mike McKoy, Mike Miller, Dan Myers, Michelle Phelps, Steve Rogers,
Dustin Tingley, and Teppei Yamamoto.
None of this would have been possible without the encouragement, financial
support, and unpaid labor of friends and family. I thank Patrick McMillin for reminding
me that there was a time before graduate school. I thank my in-laws Salvador Puente,
Diane Romer, and Megan Puente. I thank my wife Ali Puente-Douglass for being the
most supportive and loving partner anyone could ask for. Before I proposed six years
ago, I told her parents that I wanted her by my side for this next phase of life, and now
on the other end of it, I simply do not know how I could have done it without her.

ix
Finally, I thank my parents for whom this dissertation is dedicated. Their love, support,
and pride in my accomplishments never cease to amaze me.
x
Table of Contents
Abstract......................................................................................................................................... iv
Acknowledgements .................................................................................................................... vi
List of Figures ............................................................................................................................ xiii
List of Tables .............................................................................................................................. xiv
Chapter 1 Introduction to the Essays ........................................................................................ 1
1.1 Rebel Cohesion in the Face of Strong Governments ..................................................... 1
1.2 The Evidence ....................................................................................................................... 2
1.3 Plan of the Dissertation and Overarching Themes ....................................................... 3
Chapter 2 Expert Surveys as a Source of Longitudinal Civil War Data: Measuring
Territorial Control in the Vietnam War .................................................................................. 11
2.1 Introduction ...................................................................................................................... 12
2.2 Territorial Control ............................................................................................................ 17
2.2.1 Defining Control ....................................................................................................... 17
2.2.2 Control as an Equilibrium Outcome ...................................................................... 19
2.3 Expert Surveys and Measuring Territorial Control in the Vietnam War ................ 23
2.3.1 Background ................................................................................................................ 23
2.3.2 Efforts to Measure Control ...................................................................................... 25
2.3.3 The Raters ................................................................................................................... 26
2.3.4 Validity and the HES Questions ............................................................................. 28
2.3.5 Measurement Error and Bias ................................................................................... 31
2.3.6 Contemporary Aggregations Used during the War ............................................ 32
2.4 Item Response for Cross Sectional Comparison .......................................................... 40
2.4.1 Question Selection and Screening .......................................................................... 42
2.4.2 Partial Credit Item Response Models ..................................................................... 44
2.4.3 How Did Different Questions Map onto Control? ............................................... 46
2.4.4 How Did Control Vary over Space? ....................................................................... 58
2.4.5 How Did Control Vary by Local Conditions/Demographics? ........................... 65
2.5 Measuring Control over Time ........................................................................................ 71
2.5.1 IRT Linking Methods................................................................................................ 71
xi
2.5.2 How Did Control Vary over Time? ........................................................................ 73
2.5.3 Robustness and Item Parameter Drift .................................................................... 75
2.6 Conclusion ........................................................................................................................ 78
Chapter 3 Why Not Just Bribe the Rebels? The Determinants of Rebel Defection in the
Vietnam War ............................................................................................................................... 83
3.1 Introduction ...................................................................................................................... 84
3.2 Literature ........................................................................................................................... 88
3.2.1 Individual Motivation .............................................................................................. 88
3.2.2 Outside Options ........................................................................................................ 90
3.2.3 Organizational Design.............................................................................................. 92
3.2.4 Major Takeaways ...................................................................................................... 97
3.3 Theory and Empirical Predictions ................................................................................. 98
3.3.1 Shifts in Territorial Control ..................................................................................... 98
3.3.2 Propaganda, Chieu Hoi Centers, and Political Persuasion................................. 99
3.4 The Vietnam War, the Chieu Hoi Program, and Data .............................................. 102
3.4.1 Background on the Program ................................................................................. 102
3.4.2 The Rebel Group ..................................................................................................... 103
3.4.3 Who Defected and Why? ....................................................................................... 105
3.4.4 The Data ................................................................................................................... 107
3.4.5 Dependent Variable - Defection ............................................................................ 107
3.4.6 Independent Variables ........................................................................................... 110
3.5 Results .............................................................................................................................. 115
3.5.1 Territorial Control ................................................................................................... 115
3.5.2 Infrastructure ........................................................................................................... 119
3.5.3 Placebo Test ............................................................................................................. 122
3.6 Conclusion ...................................................................................................................... 125
Chapter 4 Hearts, Minds, or Bodies: The Strategy of Selective Violence in Civil War .. 128
4.1 Introduction .................................................................................................................... 129
4.2 Literature ......................................................................................................................... 134
4.3 A Model of Civilian Targeting in Civil War .............................................................. 139
4.3.1 Utilities...................................................................................................................... 143
xii
4.3.2 Equilibrium .............................................................................................................. 145
4.3.3 Comparative Statistics and Hypotheses .............................................................. 150
4.4 The Empirical Setting: Violence toward Civilians in the Vietnam War................. 156
4.4.1 Dependent Variable- Selective Targeting ............................................................ 158
4.4.2 Independent Variables- Territorial Control and Intelligence ........................... 160
4.4.3 Control Variables .................................................................................................... 166
4.5 Results .............................................................................................................................. 167
4.5.1 Violence over Aggregate Territorial Control ...................................................... 167
4.5.2 Violence and Information ...................................................................................... 172
4.5.3 Violence, Government Control, and Rebel Control ........................................... 175
4.5.4 Access to Information as a Moderating Variable ............................................... 177
4.6 Conclusion ...................................................................................................................... 179
Appendix A ............................................................................................................................... 182
A.1 HAMLA Questions and Answers .............................................................................. 182
A.2 HES70/71 Questions and Answers ............................................................................. 185
A.3 Example Conditional Probability Tables from HES70/71 ....................................... 188
A.3 Proof of Lemma 1 .......................................................................................................... 189
A.4 HES70/71 Questions for the Government Control MOD1D ................................... 190
A.5 HES70/71 Questions for Rebel Control MOD1A ...................................................... 192
A.6 Overlap of Government and Rebel Selective Targeting .......................................... 193
A.7 Intelligence Report based on Civilian Denunciation ............................................... 194
References ................................................................................................................................. 195
xiii
List of Figures Figure 2.1 Dichotomous Measure of Fully Rebel Controlled ............................................................ 35
Figure 2.2: HAMLA Additive Aggregation 1967-1969 ....................................................................... 37
Figure 2.3: HES70/71 Bayesian Aggregation July 1969-1972 .............................................................. 39
Figure 2.4: Correlation Matrix of Candidate HAMLA and HES70/71 Questions ........................... 43
Figure 2.5: Distribution of Estimated Latent Control ......................................................................... 48
Figure 2.6: Contemporary Measures Compared to the New Estimate ............................................ 48
Figure 2.7: Person Item Map for HAMLA Questions in Oct. 1967 ................................................... 51
Figure 2.8:Person Item Map for HES70/71 Questions in Oct. 1970 ................................................... 54
Figure 2.9: Discrimination Parameters for HAMLA Questions Oct. 1967 ....................................... 56
Figure 2.10: Discrimination Parameters for HES70/71 Questions Oct. 1970 .................................... 58
Figure 2.11: Average Relative Control by Province 1967-1972 .......................................................... 62
Figure 2.12: Map of Mean Provincial and Village Control in Oct. 1967 ........................................... 64
Figure 2.13: Control and Hamlet History, Administrative Role, and Urbanity .............................. 67
Figure 2.14: Control and Hamlet Primary Occupation ....................................................................... 68
Figure 2.15: Control and Hamlet Religion. ........................................................................................... 69
Figure 2.16: Control and Primary Government Security Force ......................................................... 71
Figure 2.17: Change in Territorial Control over Time by Province .................................................. 74
Figure 2.18: Unlinked Item Discrimination Parameters Across All Months ................................... 77
Figure 3.1: Monthly rates of Rebel Defection by Province 1965-1972 ............................................... 87
Figure 3.2: Monthly Rebel Defections in South Vietnam 1965-1972 ............................................... 109
Figure 3.3: Monthly Rebel Defections by Corps 1965-1972 .............................................................. 110
Figure 3.4: Availability of Chieu Hoi cadre across Hamlets by Corps. .......................................... 114
Figure 3.5: Availability of Chieu Hoi cadre across Villages by Corps. ........................................... 115
Figure 3.6: Defections and Shifts in Territorial Control by Corps ................................................... 116
Figure 4.1: Expected Returns from Government Violence ............................................................... 143
Figure 4.2: Government’s Best Response given Differing Costs ..................................................... 152
Figure 4.3: The Community’s Best Response ..................................................................................... 154
Figure 4.4: Government and Rebel Selective Violence July 1969-December 1972 ........................ 160
Figure 4.5: Control Disaggregated into Rebel and Government Control ...................................... 163
Figure 4.6: Map of Village Control in Oct. 1970 ................................................................................. 164
Figure 4.7: Availability of Intelligence and Territorial Control ....................................................... 166
Figure 4.8: Distribution of Selective Targeting over Territorial Control ........................................ 170
Figure 4.9: Relationships between Control, Intelligence, and Informed Targeting ...................... 177
Figure A.1: Overlap of Government and Rebel Selective Targeting .............................................. 193
Figure A.2: Intelligence Report based on Civilian Denunciation .................................................... 194
xiv
List of Tables Table 2.1: Temporal Overlap of the HES Surveys ............................................................................... 26
Table 2.2: HAMLA Questions and Summary Statistics ...................................................................... 29
Table 2.3: HES70/71 Question and Summary Statistics ...................................................................... 30
Table 3.1: Shifts in Territorial Control and Defection ....................................................................... 118
Table 3.2: Shifts in Chieu Hoi Infrastructure and Defection ........................................................... 121
Table 3.3: Infrastructure Placebo Test ................................................................................................. 124
Table 4.1: Violence and Aggregate Control ........................................................................................ 171
Table 4.2: Violence and Information.................................................................................................... 174
Table 4.3: Violence and Disaggregated Control................................................................................. 176
Table 4.4: Rebel Control and the Mediating Effect of Reduced Intelligence ................................. 179
Table A.1: HAMLA Questions and Answers ..................................................................................... 182
Table A.2: HES70/71 Questions and Answers ................................................................................... 185
Table A.3: Friendly Military Presence (Level 1 Model Computation)............................................ 188
Table A.4: Friendly Military Presence (Conditional Probabilities) ................................................. 188
Table A.5: Questions Aggregate Measure of Government Control MOD1D ................................ 190
Table A.6: Questions Included in Aggregate Measure of Rebel Control MOD1A ....................... 192
1
Chapter 1 Introduction to the Essays
1.1 Rebel Cohesion in the Face of Strong Governments
What explains the cohesion of rebel movements over time? Successful rebel
groups are somewhat of a paradox in international relations because they manage to
solve collective action problems in wartime environments that lack third-party
enforcement and monitoring opportunities. Governments ought to be able to split these
rebel groups using divide-and-conquer strategies such as directed amnesty, rewards,
and intimidation. How is it that rebel groups survive even when faced with a strong
central government, backed by powerful outside patrons?
To make this question tractable, I focus in this dissertation on three specific and
measurable dimensions of the cohesion of a rebel movement: (1) the degree to which
rebels can operate among the civilian population outside of their main base areas; (2)
the rate at which rebel groups lose members through defection to the government; and
(3) the degree to which civilians are willing to withhold information from the
government to protect rebels from arrest and assassination even at risk to themselves.
For each case, I aim to make a major theoretical or methodological contribution
alongside a substantive test with original data.
2
1.2 The Evidence
I introduce new evidence from one of the largest and arguably the best
documented cases of counterinsurgency, the Vietnam War. The Vietnam War is a
particularly interesting laboratory for studying rebel cohesion in the face of different
government strategies because the government of South Vietnam, with help from its
patrons, had the bureaucratic and financial resources necessary to implement a large
scale selective violence campaign, to accurately track and attempt to expand its control
over territory in rural and remote areas, and to implement a large scale defector
program with infrastructure reaching down into the smallest communities. The
Vietnam War is also unique in the breadth and scope of efforts taken to quantify
progress in counterinsurgency efforts on a wide range of issues. Under the direction of
U.S. Secretary of Defense Robert McNamara, the Office of the Assistant Secretary of
Defense for Program Analysis and Evaluation (ASDPAE) created the Operations
Analysis System (OPSANAL) with the goal of performing the first large scale
computerized documentation and study of the progress of a war. Using punch cards,
proprietary military file formats and operating systems, and the IBM 360 mainframe,
the U.S. military proceeded to document many aspects of the war.
The major change in civil conflict research in the last decade has been the shift
towards increasingly fine grained subnational units of analysis. This approach is
limited, as a recent review notes, because the necessary datasets are “expensive, hard-
3
won, and often require a mix of luck and ingenuity” (Blattman and Miguel 2010, 37). In
this research, I demonstrate how civil war studies can tap an underutilized source:
microlevel historical conflict data in government archives. I combine electronic records
recovered from obsolete formats, tens of thousands of pages of raw data printouts, and
unstructured or semi-structured narratives into coherent subnational conflict datasets.
Initially, the Vietnam data were underutilized by researchers because of the lack of
awareness and the difficulty in dealing with the size and format of these files (Harrison
1988). In addition to documenting, cleaning, and making available the Vietnam War
data, an aim of this project is to show that with the proper eye to methodological
problems these data are in some ways even better than the data available for modern
conflicts.
1.3 Plan of the Dissertation and Overarching Themes
Each chapter represents a coherent essay organized around a specific research
question. They are self-contained and can be read in any order, but each builds on
results and historical background established in earlier chapters.
Chapter 2 addresses a methodological question of how we should measure
territorial control in an ongoing conflict. The degree to which combatants take and hold
territory is one of the most important and interesting concepts in civil war, but civil war
environments are not conducive to large scale and systematic data collection. This is
particularly true for measures that are not directly observably but instead must be
4
inferred through their impact on other observable factors. I propose a partial solution in
the form of a theoretical conception of territorial control, a new source of information,
and a method of analysis and aggregation.
I argue that territorial control is an equilibrium outcome that results from a
strategic interaction between the government, rebels, and local civilians. That outcome
is distinct and separate from the types of observable events we normally use to measure
control, like attacks on military targets. I propose a method of measuring control with
linked partial credit item response models which estimates territorial control as an
unobserved latent trait which is realized in response patterns on longitudinal expert
surveys. With this method, dozens of questions from different surveys can be used to
generate a single consistent ranking for each community on the dimension of relative
government control.
I apply this approach to a remarkable longitudinal expert survey called the
Hamlet Evaluation System (HES). I generate monthly measures of territorial control
across over 12,000 hamlets for 72 months (over half a million observations). Using the
model’s estimates of item difficulty and discrimination, I show that despite the
amorphous nature of control and the subjective nature of the questions and responses,
the rater-provided responses follow a clear and consistent pattern. The relationship
between responses on different questions, the ordering of difficulty of different
questions, and the degree to which different questions discriminated between
5
communities of high and low government control all follow our theoretical
understanding of counterinsurgency. I go on to compare estimated levels of
government control across geographic, demographic, and economic subgroups in South
Vietnam, and find a pattern which closely matches the qualitative historical record.
Finally, I show that based on the metric of territorial control, the government of South
Vietnam and its allies made major gains in pacifying the rural countryside in the period
between 1969 and 1971. This is supportive evidence for the view that the government
“won” the counterinsurgency only to have it undone by a conventional invasion from
North Vietnam.
Chapter 3 addresses the puzzle of why rebel groups are sometimes able to
maintain their ranks despite the lack of enforcement and monitoring opportunities in a
wartime environment, and other times lose tens of thousands of fighters through
defection to the government. The proposed answer is that rebel groups maintain
command and control and solidarity in the face of a wealthy and powerful government
not through reward and punishment strategies, but instead through physical separation
and segregation of their fighters from government influence. Insurgency is
distinguished as a strategy by the degree to which rebel fighters intermingle and hide
among the civilian population, but there is a tradeoff in terms of the ease with which
fighters can defect when in close proximity to government areas. Rebel groups expend a
great deal of effort in attempting to hold sovereign territory, in minimizing contact
6
between their fighters and government areas, and limiting information flow to their
fighters overall. In this formulation, the task for governments is not to convince fighters
to lay down their arms by pacifying areas already under government control; rather, the
task is to capture and hold new areas currently under rebel control to give pockets of
fighters the opportunity to defect.
I draw several implications from this theory, including that rates of rebel
defection should be most influenced by shifts in territorial control rather than
government consolidation of areas already under control. To test this prediction, I
introduce longitudinal data on monthly rates of Viet Cong defection across 44 provinces
for eight years of the war. Using the measure of territorial control I developed in
Chapter 2, I show that defections spike when the government first conquers a new area
and then decline quickly. This pattern of raiding a new pocket of potential defectors
also extends to the introduction of new propaganda/amnesty infrastructure to an area.
Controlling for military factors, defections spike when the government first introduces
new amnesty offices at the village and hamlet level, and then decline. The implications
of these findings are subtle but important. Allegiance shifts in the very early period of
expansion by either side, not over long periods during a “pacification” of areas already
under control. The implication of this result is that governments should focus on
liberating new areas rather than piling on resources in areas already under control.
7
Chapter 4 addresses the puzzle of why selective targeting of civilians in civil
wars is often simultaneously described as both effective and incompetent. It asks how
programs that routinely fail to target the right people can still generate concern among
rebels and induce some civilian cooperation. The answer I propose is that selective and
indiscriminate targeting are necessary complements to one another. Governments
receive targeting information from communities, and the best information lies in
communities where there is a large rebel presence. However, a rebel presence either
indicates an affinity toward them by the community or a real risk of retaliation if the
community shares information with the government. In rebel controlled communities,
governments do not simply stop targeting because of the lack of information from the
community; they switch to more brutal and arbitrary methods like mass arrests,
checkpoints, and random interrogations. Eventually, the costs of those arbitrary tactics
may make cooperating worthwhile to the community, opening the flow of information,
and ultimately allowing selective targeting after all. This theory explains why selective
violence programs score occasional victories while at the same time brutalize so many
people.
I test the theory using evidence from one of the most infamous selective violence
programs, the Phoenix Program of the Vietnam War. I introduce detailed data
preserved in archival records on the identification and targeting of nearly 50,000
individuals over a period of three and half years. I combine that data with measures of
8
territorial control across communities, rebel acts of selective violence, and measures of
reported information flow from each community. I show that it is important to
disaggregate selective violence into the arbitrary random kind designed to induce
cooperation and the informed and specific kind designed to target individuals based on
clear tips. Based on this disaggregation, the pattern of violence in Vietnam supports the
theory. Communities in rebel areas suffered more violence overall, but when they
cooperated by sharing information, they shifted the portfolio of violence away from
arbitrary and indiscriminate targeting toward more selective targeting. They were in
effect able to limit the total amount of pain they suffered by providing at least some
begrudging cooperation. In this way, indiscriminate and selective targeting are really
two sides of the same coin. Further, governments with the resources and the reach to
threaten far-flung rebel communities with violence will be able to induce at least some
cooperation, even when they don’t have the “hearts and the minds” of the population.
All three chapters share overarching themes that are relevant to security studies
more broadly. First, how actors take and exclude others from a given territory is a
central question of inter and intra-state conflict. I develop a novel method for measuring
territorial control over time in Chapter 2. In Chapter 3, I use shifts in territorial control
to explain patterns of rebel defection, and I use division of territorial control to explain
selective violence in Chapter 4.
9
Second, every organization faces similar problems in recruiting, monitoring, and
maintaining control over members. Chapter 2 studies these problems in terms of
potential bias in survey responses when raters are judged partly on progress shown in
their own ratings. In Chapter 3, I investigate the role of ideology, rewards,
punishments, and physical control in preventing defection of rebel fighters to the
government. In Chapter 4, I explore these principal agent problems in a different
context by investigating how government and rebel forces use the threat of violence to
compete for the collaboration of civilians.
Finally, civil war studies are increasingly turning to the role of information, and
civilian provision of that information, as a key variable in explaining patterns of civil
war events and civil war outcomes. Chapter 3 argues that one mechanism through
which territorial conquest by the government can cause defection is through providing
information to rebel fighters about the likelihood of actually winning the conflict.
Chapter 4 develops a theory of selective violence where civilians strategically provide
and withhold information from the government in order to limit the total amount of
violence they suffer from both sides. In a departure from the existing literature which
must infer the role of information because no direct measures are available, I introduce
two new actual measures of information flow in (1) the use of tips in the targeting of an
individual and (2) the proportion of rebels in a community thought to be known by
government intelligence agents.

10

11
Chapter 2 Expert Surveys as a Source of Longitudinal Civil War
Data: Measuring Territorial Control in the Vietnam War
Abstract
Control over territory is both a significant means and ends of civil war. Yet, despite its
importance, little consensus exists as to the meaning of territorial control or the
appropriate way to measure it. In order to improve our understanding of this critical
concept, I propose a method of measuring territorial control using expert surveys. I use
a partial credit item response model and a test-linking procedure to measure territorial
control as a latent trait of a community. That trait is then reflected in answers that
military or civilian raters provide on a bank of security related questions. I apply the
method to an expert survey from the Vietnam War called the Hamlet Evaluation System
that provided monthly ratings of over 12,000 individual communities. I show that this
method provides a valid and effective means for gauging relative control in an ongoing
civil war. Based on those ratings, I find that the United States and the government of
South Vietnam were largely successful in securing the rural countryside in the period
between 1969 and 1971.
12
2.1 Introduction
How do governments and rebel groups share and compete over territory in civil
war? The division and overlap of control of territory and people is a central feature of
policy and academic research on civil war, appearing in nearly all theoretical
discussions of civil war events and outcomes. Scholars have suggested that the
propensity for civil war depends on the state’s capacity to find and destroy rebels
(Sobek 2010; Braithwaite 2010), which is in turn shaped by conflict-specific features like
favorable terrain (Fearon and Laitin 2003). The most effective structure for a rebel
organization depends on the availability of safe havens (Sinno 2009). Civilian
collaboration and information sharing depend on the combatants having physical
access to threaten communities (Kalyvas 2006). Governments manipulate that access
with their choice of denial tactics (Toft and Zhukov 2012). In fact, the distinction
between a terrorist campaign and a civil war depends on the group’s ability and
willingness to take and hold territory, which they can then parlay into mass recruitment
of civilians (Sanchez-Cuenca and Luis de la Calle 2009).
The important role of territorial control in counterinsurgency programs and
nation building means that to some degree academics, government and civilian
agencies, aid groups, think tanks, and private contractors all use or produce sub-
national measures of security. Given the lack of a clear underlying theory, the difficulty
of measurement in a war zone, and the diversity of actors involved, there are a vast
13
number of ad hoc compilations of metrics for recent conflicts.1 Efforts to track territorial
control have been particularly disjointed. Humphreys and Weinstein (2006) use surveys
of ex-combatants to retroactively estimate their location and activities during the
conflict in Sierra Leone. Wood (2003) had interviewees in El Salvador draw maps of
control showing shifts in their local areas. Mvukiyehe and Samii (2010) use civilian
surveys to assess security conditions around known peacekeeping bases in postwar
Liberia. Condra and Iyengar (2012) use two questions from a commercial survey of
civilians in Afghanistan on the presence of rebel forces in communities and rebel control
over local roads. Stam and Davenport (2009) reconstruct the front line over time during
the Rwandan Genocide using contemporary military maps and order of battle
estimates. Kalyvas (2006) reconstructs control over 200 villages in the Greek Civil War
using primary documents from both combatants. Recently, cross national event datasets
such as ACLED and UCDP GED have attempted to record shifts in control reported in
local news sources (Raleigh et al. 2010; Sundberg et al 2010).
I provide new evidence from an extensive wartime longitudinal expert survey,
the Hamlet Evaluation System (HES).2 For over six years, hundreds of American
1 Notable examples include the International Security Assistance Force Commander’s District
Assessments (Downes-Martin 2011), the weekly UN Afghanistan Security Situation Report (United
Nations 2010), the Measures of Progress in Afghanistan reports (Cordesman 2012), and the Iraq Index
(O’Hanlon and Livingston 2012). 2 Expert surveys (where respondents are practitioners, journalists, etc.) are relatively rare in civil war
studies compared to surveys of civilians and combatants. For a recent review see Brück et al (2010)..
Surveys of former combatants have measured the motivations for joining and leaving rebel groups and
the determinants of successful reintegration (Arjona and Kalyvas 2008; Guichaoua’s 2007; Mvukiyehe et
14
military officers, their staffs, and their Vietnamese counterparts, systematically rated
over 12,000 individual communities every single month. The effort was unparalleled in
scope, resources, and, in some ways, sophistication. Kalyvas and Kocher (2009) find the
survey better than anything available for other conflicts. HES has been used to test the
relationship between urbanization and control (Kocher 2004), selective violence against
civilians and control (Kalyvas and Kocher 2009), the distribution of military attacks
(Kongsgaar 2010), and the effects of indiscriminate bombing (Kocher et al. 2011).
Unfortunately, there is a great deal of historical and contemporary pessimism
towards HES and systems like it. A recent thorough review sums up the position: “HES
appears to show that the most extensive and structured effort to obtain ground truth in
a centralized quantitative system likely produced fabricated or irrelevant data that had
no real utility at the tactical, operational, or strategic levels of operation and decision-
making” (Connable 2012, 131). This divide stems largely from the questions and the
methodologies from which different camps approach the use of metrics. Historical
accounts show that only a small minority of policymakers and analysts had the skill set,
resources, and incentives to develop and use data during the conflict responsibly.
al. 2007). Using surveys to determine violent deaths over time is difficult (Spagat, Mack et al. 2009), but
have been employed in a number of cases (Roberts et al. 2004; Burnham, et al. 2006; 2008). Specifically,
surveys have been used to determine several aspects of genocide including the demographics of the
perpetrators (Verwimp 2005) and their victims (Verwimp 2003). The individual downstream
psychological and economic effects of civil war have been evaluated with surveys that gauge wartime
experiences such as suffering, witnessing, or committing violence (Annan et al. 2006, 52; Annan et al.
2007). Similar studies track the occurrence and determinants of post-traumatic stress disorder in veterans
(Kulka 1988).
15
Problems of measurement, manipulation, and a-theoretical analysis provide endless
anecdotes.3
This chapter illustrates the potential of expert surveys for estimating a key civil
war variable, territorial control. Specifically, I address three questions. First, how
should we measure territorial control, and can longitudinal expert surveys like the
Hamlet Evaluation System in Vietnam provide a credible approach in a wartime
environment? Second, given the measurement of control provided by HES, how did
control in South Vietnam vary across space? Third, given the above, did the United
States and the Government of the Republic of Vietnam (GVN) make demonstrable
progress in securing the countryside in the later part of the Vietnam War?
I argue for a conceptualization of territorial control as an equilibrium outcome
resulting from the strategic interaction of government, rebels, and civilians. It should be
considered separate and distinct from the occurrence of violent events. Unlike violent
events, territorial control is not directly observable. Whether it is safe to enter a village
can only be inferred by knowledge about past experiences, the balance of nearby forces,
and the preferences of the population. Yet, we can indirectly observe control through
things like the willingness of government officials to sleep in the area, the likelihood of
observing rebel forces operating nearby in open daylight, and the cooperation of the
3 It is telling that canonical examples of debunking of Vietnam era data such as the account of Sam
Adams’s take down of the Viet Cong Order of Battle Statistics (Adams 1994), were done by even more
systematic analysis using additional data and evidence, not less.

16
local population. To the degree that these downstream effects can be documented,
expert surveys can provide sufficient information from which detailed longitudinal
measures of control can be constructed.
I show that the Hamlet Evaluation System exhibits a number of desirable
properties. I use an item response theory approach to directly estimate territorial
control as a function of survey responses over time. I use a generalized partial credit
model which can handle mixed dichotomous and polytomous responses, missing data,
and unordered response. It also allows each question to have varying ability to
discriminate weakly government-controlled hamlets from strongly-controlled ones.
Even though the HES survey changed multiple times during the war, including a
complete switch in surveys midway, I am able to generate a single consistent measure
of control running for the entire period using IRT linking methods.
The remainder of the chapter is as follows. Section 2 defines territorial control in
a civil war as an equilibrium outcome and reviews the relevant literature. Section 3
evaluates the meaning of territorial control in the context of the later part of the
Vietnam War and introduces the Hamlet Evaluation System. Section 4 proposes an item
response model approach to estimate territorial control using expert surveys. Section 5
presents results from HES with the original and new estimators. According to HES,
territorial control shifted decidedly in the government’s favor from 1967 to 1972. Section

17
6 concludes with a discussion of the results and suggestions for evaluating control in
other conflicts.
2.2 Territorial Control
2.2.1 Defining Control
I define territorial control as the degree to which a government has exclusive
military and administrative access to a fixed geographic space. A further distinction is
between segmented and fractured control. Under fractured control, the areas
monopolized by either side are relatively small and both actors have at least some
access to and presence in most places.4 This share of monopoly by either side lies along
a continuum and is not directly observable. In practice, it is useful to divide control
conceptually into ordered categories. Samson (1970) provides a detailed and ordered
coding of fragmented control in South Vietnam that is worth reproducing here:
1. GVN village: The land and living areas were controlled by the Government
(“GVN”), and both GVN officials and Americans could travel unescorted during
the day and in most places at night.
2. Semisecure GVN village: The living area but not the land was controlled by the
GVN. The ability of Americans and Vietnamese officials to move about in living
areas or closely associated fields (within 3km) in daytime depended on the
4 In contrast, segmented control is closer to a conventional war with a clear front line and most areas
completely under control of one actor or the other.
18
continuous presence of the local militia (Popular Forces, Regional Forces, or
Revolutionary Development Cadre Team). At night, free movement for such
persons was restricted to that area enclosed by wire fortifications in the case of a
fenced-in former strategic hamlet or to that area in the immediate vicinity of the
village-guard command post (usually the village office) for other villages. Village
officials could not live in their homes at night and slept in the closely guarded
village office.
3. Contested village: Neither the living area nor the land was freely accessible to
unescorted officials in daytime or at night. But since such villages were not the
permanent residence of troops from either side, movement with only light
(platoon) protections was possible. At night such villages were often subject to
Viet Cong efforts to propagandize, entertain, draft (for labor or military
purposes), or tax their inhabitants. In daytime similar pressures came from the
GVN side.
4. Semisecure Viet Cong village: These villages were the permanent residences of
Viet Cong militia and civilian officials. Their economies were usually isolated
from GVN area markets because of roads cut by ditches or blown bridges. They
were the frequent targets of GVN search and destroy missions during which the
Viet Cong cadres, properly warned, withdrew to secure Viet Cong areas.
19
5. Viet Cong Village: These villages contained a full complement of Viet Cong
military and civilian personnel and frequently had not been entered by GVN or
United States Government (“USG”) officials since 1946.
Variants of this ordinal coding scheme have been used in a number of conflicts
(Kalyvas 2006). Galula (1964, 70-71) describes a system used in Algeria where zones
were either government controlled (white), rebel controlled (red), or contested (pink).
Most recently, the ISAF District Assessment Model used in Afghanistan scores districts
as actively supporting the government, sympathetic for the government, neutral,
sympathetic to the insurgency, or actively supporting the insurgency.5
2.2.2 Control as an Equilibrium Outcome
I argue that territorial control is an equilibrium outcome resulting from decisions
by the government, the rebel opposition, and the civilians that live there. Therefore,
control over any particular area might vary over a short time frame for a number of
reasons. First, the government may choose not to allocate personnel and resources to an
area because of finite resources. Logistical requirements impose a limit on an army’s
ability to project force across distance in a civil war, shifting the expected front line of
fighting (Hegre et al 2009). Even great powers face resource constraints. The United
Kingdom often lacked effective intelligence and policing capabilities in its colonies
5 “ISAF Joint Command District Assessments 100408,“
http://info.publicintelligence.net/ISAFdistrictassessments.pdf
20
because of intentionally low commitments of resources (Anderson and Killingray 1992).
Similarly, even if the U.S. had entered Iraq with the largest recommended force sizes, it
may still have not been able to maintain control over most of the country (Enterline et
al. 2009).
Second, the threat of violence might deter the government from entering a given
space.6 Nighttime can shift the advantage to rebel forces such that government
administrators and forces would conduct only daytime operations.7 Booby-traps are an
effective and cheap means for deterring entry by an opposing force, and were used to
great effect in Vietnam as well as in the recent conflicts in Iraq and Afghanistan
(Bonsignore 2006). Casualty aversion leads to several strategies that are suboptimal
from the point of view of taking and holding territory. Mechanization in modern
militaries reduces access to the population and limits travel away from developed roads
(Lyall and Wilson 2009). Occasionally, principal-agent problems appear when
commanders will refuse combat orders for fear of being killed by someone in their unit
(Prados 2009, 277-8). Other times there are local mutually agreed upon cease fires. The
ARVN 25th division, for example, was reportedly very skilled at patrolling without
accidentally engaging Viet Cong fighters (Clodfelter 1995, 88).
6 Seeking to avoid casualties, military units will often restrict themselves to bases or routes intentionally
selected to avoid enemy contact. 7 An interesting reversal of this trend for military operations has resulted in the availability of effective
night vision equipment to government but not rebel forces.
21
Third, the government may simply be disinterested in entering or governing the
space. The government may have no interest in controlling an area that has little
resources, particularly if it has access to another concentrated resource like diamonds or
timber elsewhere (Weinstein 2007). Taxation is an important objective for governments,
and often the only experience ordinary civilians in rural areas will have with the
government is through brief visits by tax collectors accompanied by armed escort.
Fourth, the government may be physically prevented from entering the space by
violent enemy tactics. As a matter of strategy, rebel forces typically retreat when
government forces arrive in mass, but not always. Sunni insurgents along with foreign
fighters intermittently held the city of Fallujah against American and Iraqi forces over a
period of twenty months (West 2005).
Fifth, the presence of government forces is often not sufficient to prevent access
by rebel forces. The strategy of guerrilla warfare developed by Mao Tse-tung calls for
rebels to blend into the local population, making it impossible for government forces to
distinguish rebels from non-combatants with any degree of certainty.8 This both
complicates their goal of identifying rebel units for destruction while increasing the
odds that they will inadvertently strike the civilian targets, thereby further increasing
popular support for the insurgency. Without local support, it is often impossible to
8 Marine Brig. Gen. Samuel B. Griffith who traveled extensively in China during the Civil War provides
the best translation of “On Guerrilla Warfare” (Tse-tung 2000). For the Vietnamese take on Maoist
insurgency doctrine see Gen. Vo Nguyen Giap’s “People’s War, People’s Army” (Giap 1962).
22
identify rebel administrators and supporters living in the general population. In urban
and jungle environments, even relatively large armed rebel units have been able to
operate in close proximity to government forces without arousing suspicion.9
There are two implications of this line of argument. The first is that control is a
temporary outcome, predicated on the preferences and capabilities of the actors
involved. This is different from the conception of “pacification” where areas are
somehow made permanently aligned to one side or the other. Second, these complex
strategic interactions suggest that we should distinguish between the concept of
territorial control and the outbreak of violent events. Staniland (2012, 246) shows that
brutal conflict, limited norms governed clashes, and active collusion to maintain a
stream of rents from the population could all be consistent with an equal division of
territorial control. Selective violence against civilians is argued to vary nonlinearly,
peaking in areas of partial control (Kalyvas 2006). Logistical constraints suggest that
attacks on military targets should be nonlinear with control, peaking at the edge of the
government’s ability to easily project power into rebel areas (Hegre et al 2009). Properly
specifying this functional form is important for testing theories of civil war using events
(Signorino and Yilmax 2003). For this reason, efforts that focus specifically on patterns
of violent events alone find it difficult to infer underlying causes (Schroden 2009, Gons
et al. 2012).
9 There are multiple accounts of Viet Cong political and military operations in close proximity to
American units as large as a Marine Corps infantry battalion’s headquarters (Ahern 2010, 249–250).
23
2.3 Expert Surveys and Measuring Territorial Control in the Vietnam War
2.3.1 Background
The Vietnam War was an internationalized civil war with combat taking place in
North Vietnam, South Vietnam, Laos, and Cambodia. A number of countries committed
personnel, including the United States, South Korea, Australia, New Zealand, the
Philippines, China, and the Soviet Union. However, it was still a war fought primarily
by Vietnamese communists against Vietnamese nationalists. In the GVN’s fight against
the Viet Cong, over one million ethnic Vietnamese either joined or were drafted into the
various military and police forces. The same was true for the prior colonial conflict
between the Viet Minh and the French, where over 400,000 local Vietnamese were
recruited into the colonial army.
Strategically, both sides fought a defensive action intended to wait out the other.
The United States chose to intervene and designed a military strategy in order to buy
the GVN enough time to survive on its own (Kolko 1985, 177-80). How that strategy
was implemented changed over time. Thayer summarizes the shift: “the 1967-1972
pacification effort gradually built up the allied counterguerrilla and anti-Viet Cong
infrastructure effort. Meanwhile, gradual U.S. withdrawal reduced the allied main
forces. Hence the allied style and force structure were becoming somewhat less
conventional as the communists became notably more conventional” (Thayer 1985, 39).
In this period, there were two major rebel events. The first was the Tet Offensive in
24
January of 1968, which the Viet Cong led in an attempt to inspire an uprising and
takeover of urban areas. The second was the Easter Offensive, starting March of 1972,
which was primarily a conventional attempt by the North Vietnamese to gain as much
territory as possible prior to the conclusion of the Paris Peace Accords.
Geographically, South Vietnam was divided into four military regions, and the
nature of the conflict varied greatly between them and within them over time.10 Further
distinctions can be drawn between provinces and even between individual villages.
Only 10 of 44 provinces accounted for over half of all government or ally combat deaths
(Thayer 1985, 14-5).11 The type of warfare varied greatly, with five of the provinces
fighting a large-scale main force war, five fighting a primarily guerrilla war, and
another five exhibiting a hybrid of the two (Prince et al. 1972, I-3). Recent comparisons
of Viet Cong initiated incidents have found that the violence may have been even more
localized to specific districts and villages (Lohman 2010).
10 The southernmost region, III Corps and IV Corps were closest to a locally grown and operated
insurgency throughout the war. In the Viet Minh period, regional forces and local militia units were the
only significant PAVN units in the southern Mekong Delta region (Pike 1986, 39). At the end of the war in
South Vietnam, NVA units had largely taken over for Viet Cong forces everywhere except the Mekong
Delta (Clodfelter 1995). III Corps contained the capital which guaranteed both a larger government
presence as well as greater contestation by the Viet Cong. II Corps saw intense large-scale battles before
returning back to insurgency style fighting. I Corps was practically a conventional war toward the later
part of the war. 11 They were the northern provinces, Quang Tri, Thua Thien, Quang Nam, Quang Tin, Quang Ngai, Binh
Diny, and three province critical to control around the capital in MR3, Tan Ninh, Dinh Tuong, and Kien
Hoa.
25
2.3.2 Efforts to Measure Control
Both the GVN and the Viet Cong developed systems for reporting political and
military conditions at the hamlet level.12 GVN reporting began as early as 1964 and ran
into 1967.13 In April 1965, the government system began to rate some individual hamlets
in addition to province-wide measures.14 In October 1966, the Department of Defense
ordered the creation of an American system for measuring monthly progress. It was
designed to provide for the basic requirements of a counterinsurgency campaign
including census functions (tracking locations, names, demographics, and population of
administrative units) and basic military intelligence functions (documenting the
locations and activities of enemy and friendly forces). It also attempted to measure less
tangible aspects of war such as government control over territory, progress in economic
development and pacification, and progress in basic administration and governance.15
The first survey called HAMLA entered the field in January of 1967 and assigned
each hamlet a letter grade (from E to A, with A the best) on 18 main questions along
with a number of questions on specific problem areas.16 After a major review, the E to A
subjective scores were replaced with specific questions that could then be aggregated
12 For discussion of the Viet Cong’s interpretation of control see Race (1972, 138-140) and Hunt (1974). 13 Data from this system has not yet been located, but from May 1964 through September 1966 a system
called Population Control File (POPCA) recorded province-months estimates of the population living in
“Secure,” “Semi-Secure,” “Contested,” “Unknown,” and “VC Controlled” areas. 14 One indication of the poor quality of this earlier system is that it showed major improvements in
security during the near collapse of the government’s position in 1964 (Thayer 1975, 36). 15 For a recent review of the importance of a census to counterinsurgency operations see Shrout (2011). 16 The first few months of data from HES reported similar security conditions as the existing GVN system
(Thayer 1975, 14-5).
26
into a meaningful overall grade. The redesign led to a survey called HES70/71, which
ran from July 1969 and until the fall of Saigon in 1975.17 For the first year and a half, it
carried 139 hamlet and village level questions – a number that was later increased to
165.18 The designers used a number of forward thinking approaches. They included
overlap between the two systems to allow for calibration of responses. They allowed for
the addition of new questions over time as they became relevant, and they generated a
number of aggregation systems. The data analyzed here run from January 1967 to
December of 1972 when the system was almost entirely transferred to the South
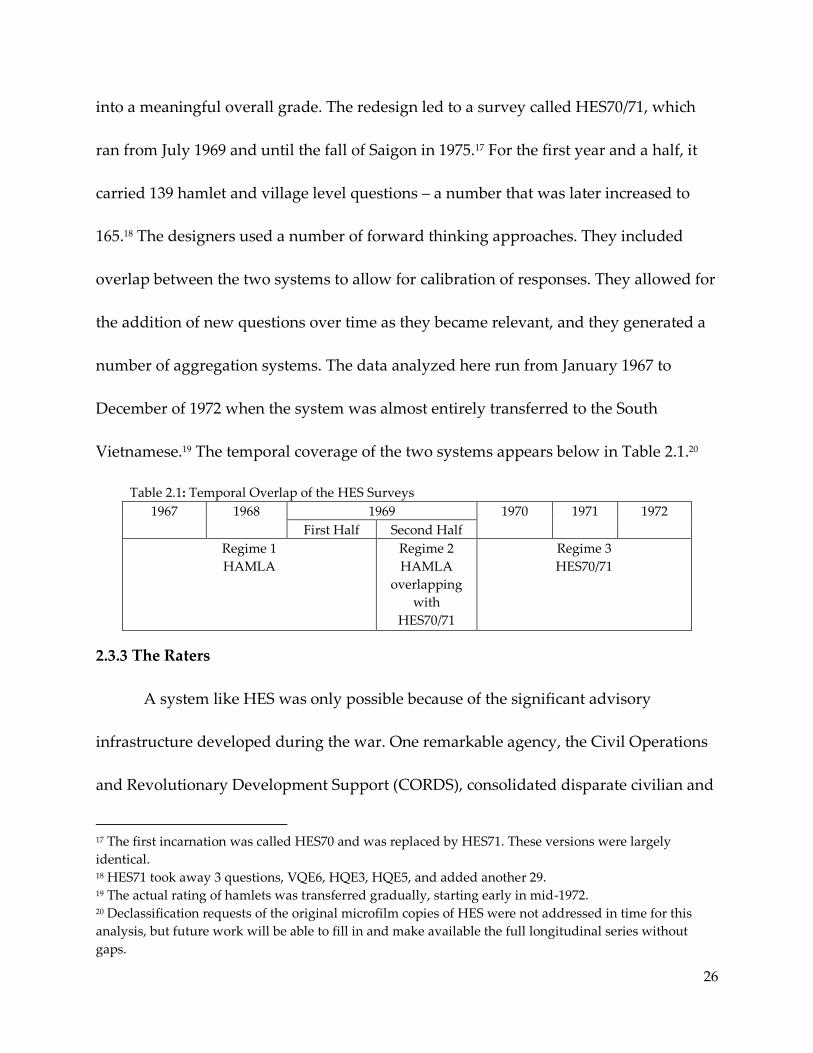
Vietnamese.19 The temporal coverage of the two systems appears below in Table 2.1.20
Table 2.1: Temporal Overlap of the HES Surveys
1967 1968 1969 1970 1971 1972
First Half Second Half
Regime 1
HAMLA
Regime 2
HAMLA
overlapping
with
HES70/71
Regime 3
HES70/71
2.3.3 The Raters
A system like HES was only possible because of the significant advisory
infrastructure developed during the war. One remarkable agency, the Civil Operations
and Revolutionary Development Support (CORDS), consolidated disparate civilian and
17 The first incarnation was called HES70 and was replaced by HES71. These versions were largely
identical. 18 HES71 took away 3 questions, VQE6, HQE3, HQE5, and added another 29. 19 The actual rating of hamlets was transferred gradually, starting early in mid-1972. 20 Declassification requests of the original microfilm copies of HES were not addressed in time for this
analysis, but future work will be able to fill in and make available the full longitudinal series without
gaps.
27
military pacification efforts under a single roof (Scoville 1982). Importantly, the
advisory effort mirrored the federal structure of South Vietnam. An advisory team led
by a Province Senior Advisor (PSA) was assigned to each of the 44 provinces. Each of
the 240 districts had their own team of 5 to 13 persons headed by a District Senior
Advisor (DSA) who was typically an Army major.21 The advisory system benefited from
the continuity that resulted from repeated tours of advisors, the sometimes-extended
rotations, and the limited options for transferring to other jobs or more secure districts
(Osborne 2012,10).22 U.S. advisors were mirrored by their GVN counterparts, province
and district chiefs. Provincial leadership, for the most part, consisted of career service
officers who had a working knowledge of their province but were not typically from the
area or they lacked local popular support (Silverman 1970).
The HES survey was filled out by the District Senior Advisors. Province advisors
could provide accompanying comments but could not alter the scores provided by a
DSA. Each DSA was responsible for on average about 60 hamlets (and for some districts
over a 100). HES procedures required keeping a logbook of events during each month
that would then be used to update the HES scores at the end of the month.23 DSAs were
encouraged to accumulate as much information from as many sources as possible,
preferably from direct observation through hamlet visits. In practice, DSAs depended 21 A small subset of districts were headed by civilians, usually from USAID. 22 Positions were normally assigned, and were held consecutively for either a 12-month rotation or were
voluntarily extended to 18 to 24 months. 23 We would expect a strong temporal correlation because the DSAs were provided with last month’s
scores and only made changes when necessary.

28
heavily on their Vietnamese counterparts for the information they used to generate their
responses (de Sola Pool at al. 1968, 32).
2.3.4 Validity and the HES Questions
The major criticism of the validity of HES is that it was built to estimate
“pacification” in counterinsurgency for which there was not, and still is not, a clear
theoretical foundation. For some, HES focused too much on tangible security related
factors to the detriment of relevant social factors (Race 1972, 223). For others, using
security conditions in time as an indication for “pacification” in missed the
whole point of security being a conditional outcome on the forces present at the time
(Elliot 2003, 857; Race 1972, 223). Local security would naturally change when
government forces left and rebel forces came back. A broader review of the search for
metrics in Vietnam found that “Defining security, however, remained one of the more
complicated aspects of MACV’s measurement system. Indeed, imprecise definitions
plagued nearly all facets of U.S. reporting. How should “security” be defined?
Quantitative reports like the HES never really said” (Daddis 2011).
There is nothing in these criticisms that suggest that HES is incapable of the more
limited task of measuring territorial control and its change over time. There are two
aspects of control, monopoly presence and monopoly access. The HES designers were
very interested in both as metrics for counterinsurgency and included a number of
questions regarding each. There are 13 HAMLA questions pertaining to the presence of

29
military forces and administration by either side. A list of questions and topics appear
in Table 2.2, and the full E to A response descriptions appear in Appendix A.1. There
are 21 hamlet level questions from HES70/71 that pertain to control. A list of questions
and topics appear in Table 3, and the full E to A response descriptions appear in
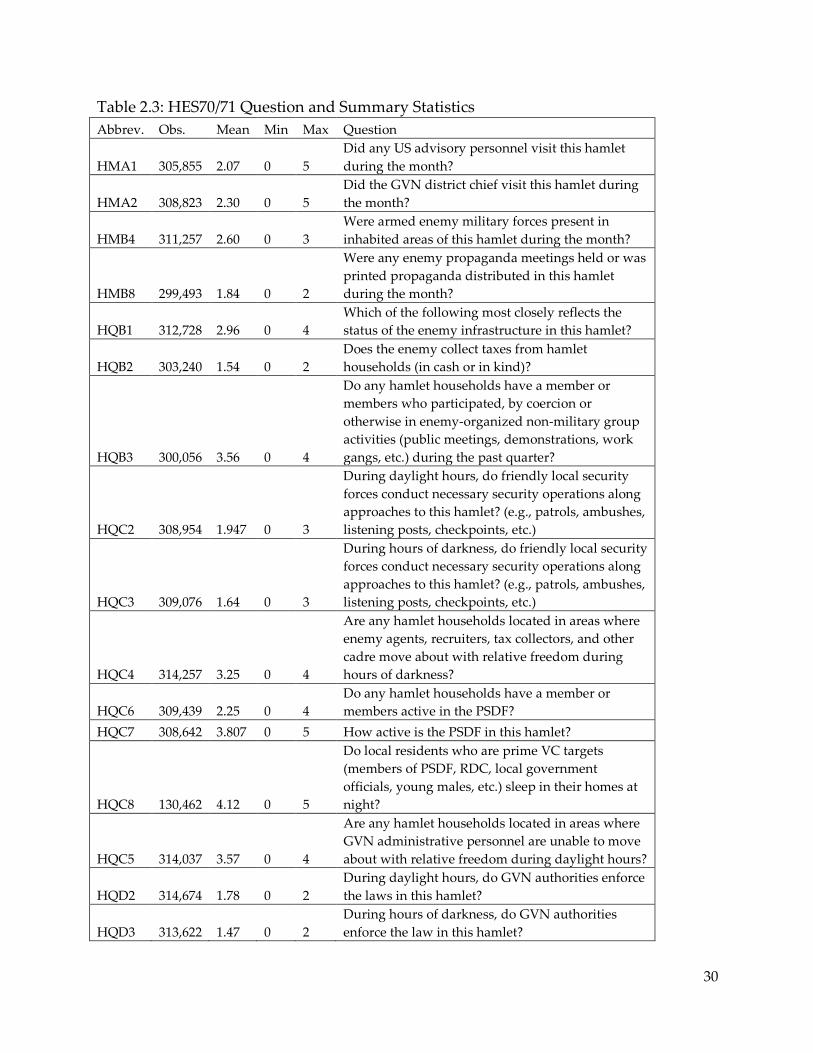
Appendix A.2.24 HES70/71 also includes a large number of village level questions that
will be the subject of future analysis and are not included here.25
Table 2.2: HAMLA Questions and Summary Statistics
Abbrev. Obs. Mean Min Max Question
MLAC1 271273 3.455014 1 6 VC Village Guerrilla Unit
MLAC2 271183 3.125399 1 6 VC External Forces
PLAC1 271258 3.283682 1 6 VC Hamlet Infrastructure
PLAC2 271259 3.383637 1 6 VC Village Infrastructure
SECU1 271275 3.263596 1 6 Hamlet Defense Plan and Organization
SECU2 271280 3.405316 1 6 Friendly External Force Assistance
SECU3 271251 3.307295 1 6 Internal Security Activities
ADPL1 271266 3.494275 1 6 GVN Governmental Management
ADPL2 271265 3.220062 1 6 GVN Response to Popular Aspirations
GVNTAX 175358 0.8337914 0 1 GVN Taxes Area
NOVCTAX 148672 0.5770017 0 1 Viet Cong Do Not Tax Area
XPROB17 164682 3.664298 1 5 Safety of US Advisor Access- Surface
XPROB18 163305 3.739598 1 5 Safety of US Advisor Access - Airstrip
24 All HAMLA questions are monthly. For HES70/71, “HM” indicates a monthly question and “HQ”
indicates a quarterly question. 25 Specifically, future work will consider a multilevel item response model that can properly aggregate
observations recorded simultaneously for overlapping and nested geographic spaces.
30
Table 2.3: HES70/71 Question and Summary Statistics
Abbrev. Obs. Mean Min Max Question
HMA1 305,855 2.07 0 5
Did any US advisory personnel visit this hamlet
during the month?
HMA2 308,823 2.30 0 5
Did the GVN district chief visit this hamlet during
the month?
HMB4 311,257 2.60 0 3
Were armed enemy military forces present in
inhabited areas of this hamlet during the month?
HMB8 299,493 1.84 0 2
Were any enemy propaganda meetings held or was
printed propaganda distributed in this hamlet
during the month?
HQB1 312,728 2.96 0 4
Which of the following most closely reflects the
status of the enemy infrastructure in this hamlet?
HQB2 303,240 1.54 0 2
Does the enemy collect taxes from hamlet
households (in cash or in kind)?
HQB3 300,056 3.56 0 4
Do any hamlet households have a member or
members who participated, by coercion or
otherwise in enemy-organized non-military group
activities (public meetings, demonstrations, work
gangs, etc.) during the past quarter?
HQC2 308,954 1.947 0 3
During daylight hours, do friendly local security
forces conduct necessary security operations along
approaches to this hamlet? (e.g., patrols, ambushes,
listening posts, checkpoints, etc.)
HQC3 309,076 1.64 0 3
During hours of darkness, do friendly local security
forces conduct necessary security operations along
approaches to this hamlet? (e.g., patrols, ambushes,
listening posts, checkpoints, etc.)
HQC4 314,257 3.25 0 4
Are any hamlet households located in areas where
enemy agents, recruiters, tax collectors, and other
cadre move about with relative freedom during
hours of darkness?
HQC6 309,439 2.25 0 4
Do any hamlet households have a member or
members active in the PSDF?
HQC7 308,642 3.807 0 5 How active is the PSDF in this hamlet?
HQC8 130,462 4.12 0 5
Do local residents who are prime VC targets
(members of PSDF, RDC, local government
officials, young males, etc.) sleep in their homes at
night?
HQC5 314,037 3.57 0 4
Are any hamlet households located in areas where
GVN administrative personnel are unable to move
about with relative freedom during daylight hours?
HQD2 314,674 1.78 0 2
During daylight hours, do GVN authorities enforce
the laws in this hamlet?
HQD3 313,622 1.47 0 2
During hours of darkness, do GVN authorities
enforce the law in this hamlet?
31
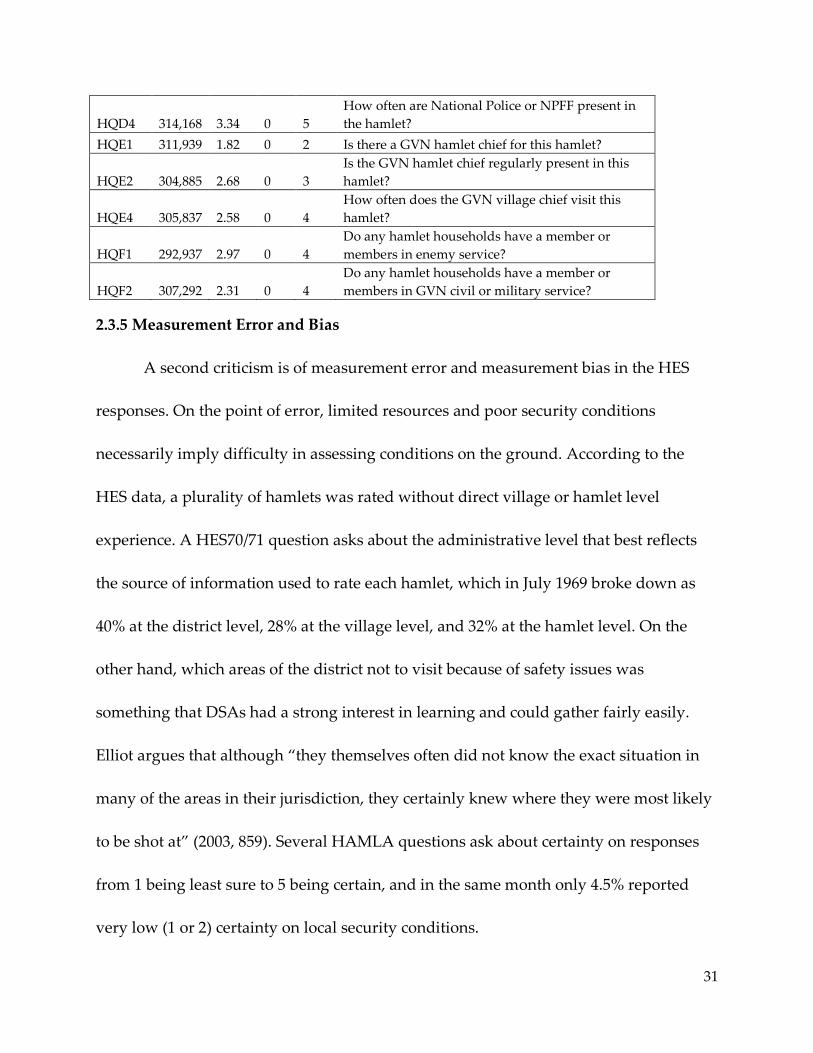
HQD4 314,168 3.34 0 5
How often are National Police or NPFF present in
the hamlet?
HQE1 311,939 1.82 0 2 Is there a GVN hamlet chief for this hamlet?
HQE2 304,885 2.68 0 3
Is the GVN hamlet chief regularly present in this
hamlet?
HQE4 305,837 2.58 0 4
How often does the GVN village chief visit this
hamlet?
HQF1 292,937 2.97 0 4
Do any hamlet households have a member or
members in enemy service?
HQF2 307,292 2.31 0 4
Do any hamlet households have a member or
members in GVN civil or military service?
2.3.5 Measurement Error and Bias
A second criticism is of measurement error and measurement bias in the HES
responses. On the point of error, limited resources and poor security conditions
necessarily imply difficulty in assessing conditions on the ground. According to the
HES data, a plurality of hamlets was rated without direct village or hamlet level
experience. A HES70/71 question asks about the administrative level that best reflects
the source of information used to rate each hamlet, which in July 1969 broke down as
40% at the district level, 28% at the village level, and 32% at the hamlet level. On the
other hand, which areas of the district not to visit because of safety issues was
something that DSAs had a strong interest in learning and could gather fairly easily.
Elliot argues that although “they themselves often did not know the exact situation in
many of the areas in their jurisdiction, they certainly knew where they were most likely
to be shot at” (2003, 859). Several HAMLA questions ask about certainty on responses
from 1 being least sure to 5 being certain, and in the same month only 4.5% reported
very low (1 or 2) certainty on local security conditions.
32
On the point of measurement bias, HES was validated in a number of ways
during the war. Concerned about inflated HES scores, the 9th Infantry Division G-2
undertook a conservative reassessment of every hamlet in Dinh Tuong province and
found that their scores differed by only 10% with the scores by the District Senior
Advisor (Hunt 2010, 82). Contemporary comparisons of HES scores to event data such
as military attacks, ambushes, anti-aircraft fire, and terrorism have also shown a strong
correlation (Thayer 1975, 61). An extensive review of combat data found HES responses
to be reasonable and informative (Prince and Adkins 1973). A Simulatics Corporation
study compared DSA responses to an original survey of hamlet chiefs and hamlet
citizens, and found a strong correlation between them (Pool et al. 1968). There is
anecdotal evidence that there was pressure to elevate scores (the mean may be biased
upward), but there are also accounts of scores being biased downward as well.
Bergerud (1993, 279) notes that despite significant pressure by the 25th Infantry Division
commander General Williamson to inflate HES scores, the advisor team in Hau Nghia
actually rated hamlets too pessimistically.
2.3.6 Contemporary Aggregations Used during the War
Before turning to a more complicated method of aggregation, it is worth
reviewing the picture of control provided by the three contemporary measures used
during the war: a dichotomous categorization of hamlets as fully rebel controlled and
33
thus un-ratable, a linear additive aggregation of V to A scores on each HAMLA
question, and a Bayesian aggregation of specific questions from HES70/71.
2.3.6.1 Dichotomous Measure of Viet Cong Control
The simplest metric of control is a dichotomous scoring of hamlets as ratable or
completely rebel controlled and thus unratable. The distribution of unratable hamlets
over time is presented in Figure 2.1. By this metric, about a third of hamlets were under
full Viet Cong control for 1967 and 1968. Starting in November 1968, the share began to
drop to only 10% by mid-1969, to under 5% by mid-1970, and to practically nonexistent
by 1971.26 The Northern-led and largely conventional Easter Offensive in 1972
temporarily reversed these trends bringing the share momentarily back up to 10%
primarily in Military Regions 1 and 2 where most of the fighting took place. The decline
coincides with the major losses suffered by the Viet Cong from the Tet Offensive and
the subsequent wave of defections in 1969. The decline also begins prior to the shift in
systems, so it is unlikely that the effect is solely because of the change in surveys.
There is further concern that fully rebel controlled hamlets may have simply left
the sample. They could leave in one of two ways, either by being destroyed/abandoned
or by simply disappearing off the roll. A relatively small share of hamlets, 1,375, exited
unexpectedly from the sample. The other 11,490 exited at expected times with 7,983
26 However, the dichotomous measure is crude and one can imagine a number of reasons for the decline
in 1969. Two years in, more resources might have meant an increased ability to rate hamlets that would
have been considered unratable before.

34
exiting due to missing data in December of 1971 and 3,507 lasting until the end of the
sample in December 1972. Of those premature exits, a disproportionate share were Viet
Cong hamlets, 610, and another 198 were listed as having been destroyed.27 This
accounts for some, but not the entire disappearance of the 2,357 hamlets that were rated
V in the first month of the survey.28
27 Data missingness in the latter half of 1969 and all of 1972 make it difficult to identify permanent exits
from destruction in those windows. 28 A more interesting possibility is that a V hamlet was temporarily closed and then reopened with some
degree of government control. There were 2,058 hamlets that were shown as destroyed at least at one
point.
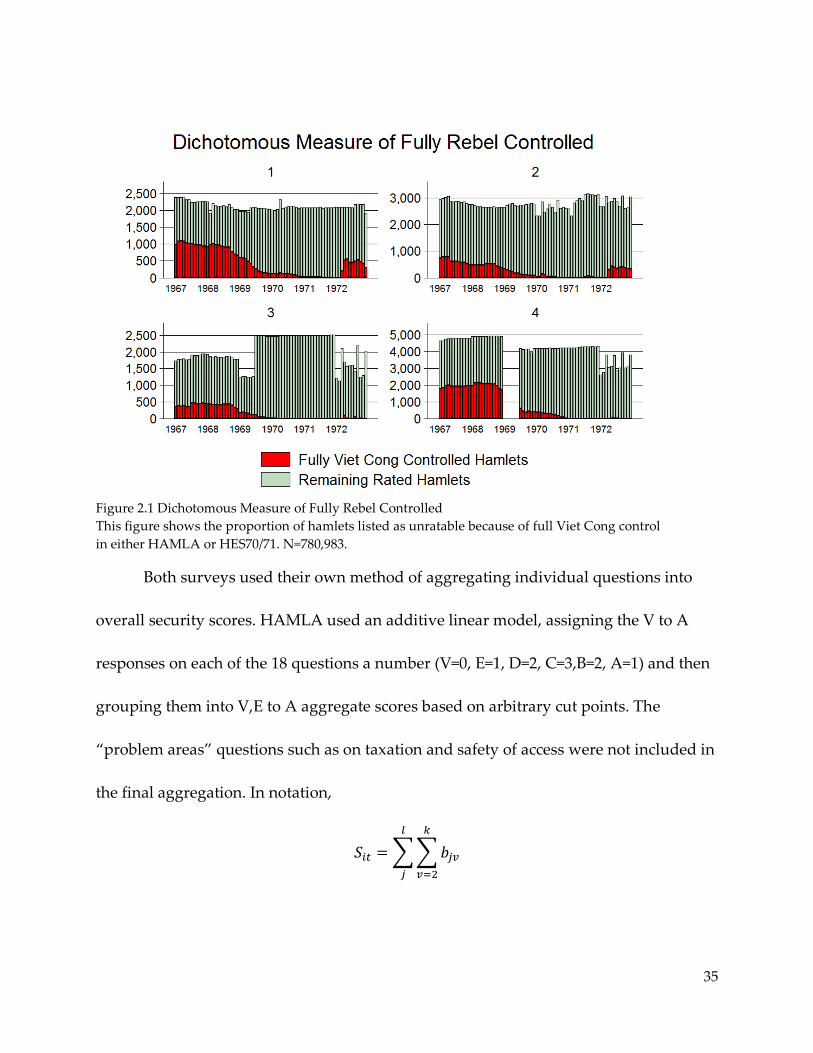
35
Figure 2.1 Dichotomous Measure of Fully Rebel Controlled
This figure shows the proportion of hamlets listed as unratable because of full Viet Cong control
in either HAMLA or HES70/71. N=780,983.
Both surveys used their own method of aggregating individual questions into
overall security scores. HAMLA used an additive linear model, assigning the V to A
responses on each of the 18 questions a number (V=0, E=1, D=2, C=3,B=2, A=1) and then
grouping them into V,E to A aggregate scores based on arbitrary cut points. The
“problem areas” questions such as on taxation and safety of access were not included in
the final aggregation. In notation,
∑∑
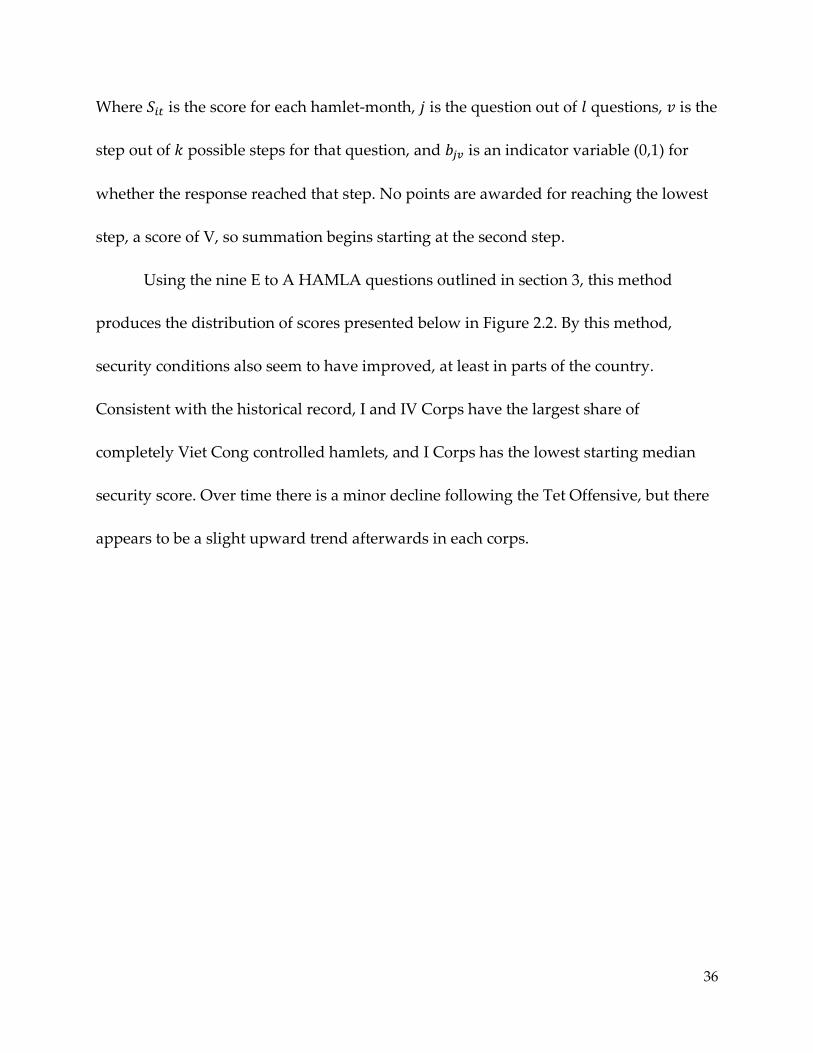
36
Where is the score for each hamlet-month, is the question out of questions, is the
step out of possible steps for that question, and is an indicator variable (0,1) for
whether the response reached that step. No points are awarded for reaching the lowest
step, a score of V, so summation begins starting at the second step.
Using the nine E to A HAMLA questions outlined in section 3, this method
produces the distribution of scores presented below in Figure 2.2. By this method,
security conditions also seem to have improved, at least in parts of the country.
Consistent with the historical record, I and IV Corps have the largest share of
completely Viet Cong controlled hamlets, and I Corps has the lowest starting median
security score. Over time there is a minor decline following the Tet Offensive, but there
appears to be a slight upward trend afterwards in each corps.

37
Figure 2.2: HAMLA Additive Aggregation 1967-1969
This figure shows an additive aggregation of responses to 9 main HAMLA questions relevant to
territorial control. N= 271,273.
2.3.6.3 Bayesian Aggregate HES70/71 Measure
The HES70/71 system used a Bayesian weighting scheme to produce aggregate
scores.29 At each month, each hamlet was considered to have equal probability of laying
in one of the five aggregate ratings (E to A). The designers handpicked the conditional
probabilities for several models that mapped each question answer to low potential
letter scores. The aggregation function and examples of conditional probability tables
are available in Appendix A.3. Village scores were composed of population-weighted 29 “Civil Operations and Rural Development Support Research and Analysis, Hamlet Evaluation System
(HES) Program R7105P, Bayesian Score Program,” no date, folder: Hamlet Evaluation System, RG 472,
National Archives at College Park.
38
hamlet scores. The assigned letter score on each aggregation was the category with the
highest probability as given by Bayes rule.
The E to A scores from one of the Bayesian aggregations, MOD3A, that comes
closest to the control related questions I have selected appears below in Figure 2.3. The
overall upward trend remains. From the beginning of 1969 onward, D and E hamlets
shrink as a proportion of all hamlets, while the share of B hamlets grows to become the
largest plurality. By this metric, the government made major security gains until the
1972 Easter Offensive. The increase in government controlled hamlets in 1971 resulted
from the inclusion of major cities for the first time, broken down into individual wards.
Again, the drops in total observations for 1970 in the II Corps and 1972 in the III and IV
Corps are due to data preservation problems unrelated to security conditions during
the war.
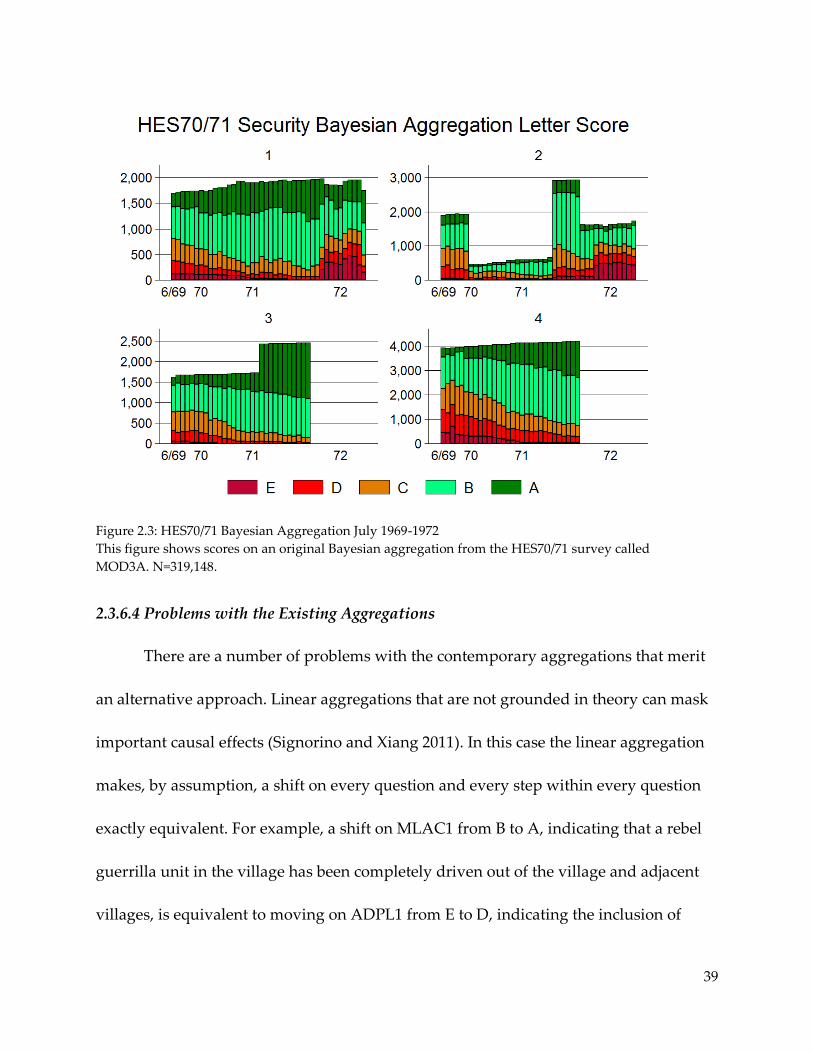
39
Figure 2.3: HES70/71 Bayesian Aggregation July 1969-1972
This figure shows scores on an original Bayesian aggregation from the HES70/71 survey called
MOD3A. N=319,148.
2.3.6.4 Problems with the Existing Aggregations
There are a number of problems with the contemporary aggregations that merit
an alternative approach. Linear aggregations that are not grounded in theory can mask
important causal effects (Signorino and Xiang 2011). In this case the linear aggregation
makes, by assumption, a shift on every question and every step within every question
exactly equivalent. For example, a shift on MLAC1 from B to A, indicating that a rebel
guerrilla unit in the village has been completely driven out of the village and adjacent
villages, is equivalent to moving on ADPL1 from E to D, indicating the inclusion of
40
some local participation in hamlet management. That equivalency would not be true if
we thought some aspects of control were necessary conditions for others, if some levels
of control were more difficult to reach than others, or if advisors defaulted to middling
responses when they lacked good information.
Similarly, the Bayesian aggregation depends on a priori decisions about the
relative importance of various question-answers. This is disadvantageous if we want to
test hypotheses about which questions should be most important. Also, the aggregation
is not replicable because, with few exceptions, the original conditional probability tables
have not been located. Finally, there is no easy means of matching aggregations from
each system against one another. Accordingly, the analysis is necessarily limited to
short periods rather than the full 72 month panel.
2.4 Item Response for Cross Sectional Comparison
Broadly, the item response modeling strategy is to treat answers to HES
questions as realizations of an underlying and unobserved latent trait. In almost every
case, HES questions on topics of local security can be treated as ordinal responses
ranging from least government control to most government control. In political science,
item response models have been used for estimating a wide range of important but
unobservable concepts like democracy (Treier and Jackman 2008; Pemstein et al. 2010),
legislative accomplishments (Clinton and Lapinski 2006), the ideology of legislators
41
(Poole and Rosenthal 2000), judges (Jesse and Tahk 2011), and agencies (Clinton and
Lewis 2007).
This approach is consistent with the view of territorial control as a relative
measure. Contemporary analysts suggested a similar interpretation of security as a
relative measure (Prince 1973), and factor analysis showed HAMLA questions reflected
only two distinct underlying traits: security and development (Sweetland 1968). It also
directly addresses a concern that is repeatedly raised about HES—that subjective
classifications do not translate into real world measures of security. A recent review
goes so far as to argue that “this kind of dissociated quantitative response would make
the aggregated data all but meaningless because there would be no standard associated
with the numbers…The kinds of quantitative and graphic reports produced from the
data would be meaningless” (Connable 2012, 118).
The item response theory approach allows for subjective questions to map into
an unobserved objective measure. We do not have to know beforehand which values on
which questions distinguish the most difficult to achieve levels of control; the responses
themselves will provide that ordering. To the degree that we are concerned with this
process varying substantially from rater to rater, we can check for differences in the
structure of this mapping from region to region.30 It places both surveys (and their
30 Another concern is of inter-rater reliability. Without information on the raters, or preferably multiple
raters, there is not much that can be done for controlling for individual raters proclivities. Future research
will tackle this question specifically.
42
changes over time) onto a single consistent scale. The IRT model also produces
estimates of uncertainty that can then be taken into account in other analyses.
2.4.1 Question Selection and Screening
2.4.1.1 Dimensionality
Below in Figure 2.4 is a plot of the pairwise correlation between all of the
candidate HES questions related to control. Questions are clustered by their degree of
association using a seriation algorithm suggested by Kastellec and Leoni (2007). Two
points are of note. First, the HAMLA questions are highly clustered relative to
HES70/71 questions. This observation suggests there may be less information available
in the HAMLA survey than the HES70/71 survey overall. Second, after reordering the
responses to point substantively in the same direction, the correlation is positive for
almost every question. There are two exceptions that are candidates for removal,
government taxation (GVNTAX) and visitation by U.S. personnel (HMA1), which is
actually positively correlated with Viet Cong taxation (or in this case negatively
correlated with “not taxing”), and negatively correlated with several other questions.
Further investigation shows that hamlets were almost always recorded as having
government taxation, 146,212 (83.38%) to 29,146 (16.62%). Responses about visitation by
U.S. personnel were more evenly divided across possible answers, but the weak
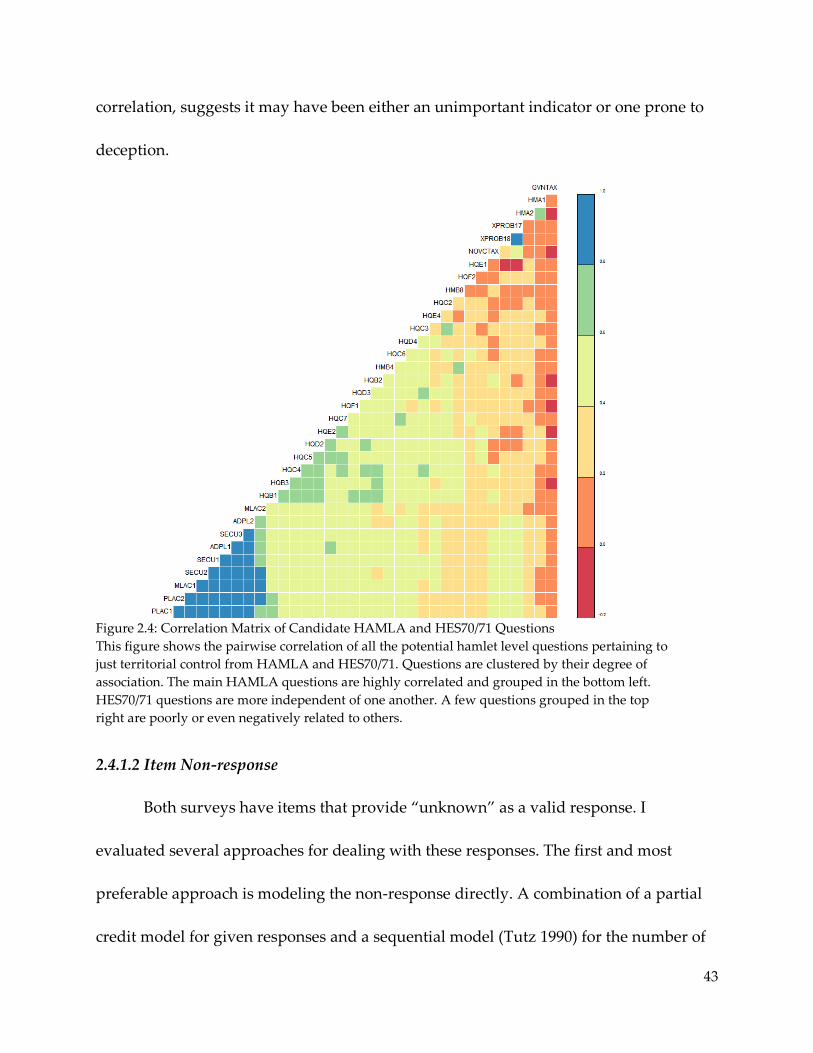
43
correlation, suggests it may have been either an unimportant indicator or one prone to
deception.
Figure 2.4: Correlation Matrix of Candidate HAMLA and HES70/71 Questions
This figure shows the pairwise correlation of all the potential hamlet level questions pertaining to
just territorial control from HAMLA and HES70/71. Questions are clustered by their degree of
association. The main HAMLA questions are highly correlated and grouped in the bottom left.
HES70/71 questions are more independent of one another. A few questions grouped in the top
right are poorly or even negatively related to others.
2.4.1.2 Item Non-response
Both surveys have items that provide “unknown” as a valid response. I
evaluated several approaches for dealing with these responses. The first and most
preferable approach is modeling the non-response directly. A combination of a partial
credit model for given responses and a sequential model (Tutz 1990) for the number of
44
missing responses would properly attribute both answer and missingness to the
underlying latent trait (Glas and Pimentel 2008). I attempted a version of the sequential
model and latent tree framework (De Boeck and Partchev 2012) and found it to be
computationally infeasible given the number of questions and time periods.31 A second
approach is to simply score the missing questions as the lowest possible category,
equating unknown with fully rebel controlled. However this approach is known to
produce biased estimates (Rose et al. 2010). A third approach is to consider each non-
response as missing at random. The Generalized Partial Credit Models (GPCM) handles
these missing observations by giving them a weight of zero in the conditional likelihood
(Fischer 1994, 181). In this application, this option is not unrealistic given that often only
one or two questions were marked unknown and overall missingness was very low.
Usually, only a few percent of responses were missing except for two questions that
have a missing rate of just over 5%.
2.4.2 Partial Credit Item Response Models
Many HES questions are categorical, ordered along the same latent dimension of
control. The partial credit model allows each question and each step within each
question to have varying difficulties (Andersen 1983, Masters 1982).32 Assume that each
31 Specifically, even with subsampling the number of hamlets the memory requirements rise nonlinearly
with the number of time periods. The approach failed on a server with 128gigs of ram using the lme4 R
package (Bates and Sarkar 2007). 32 An alternative for polytomous items is the Graded Response Model. I prefer the partial credit model
because it allows the ordering of difficulty of the responses to vary if that is reflected in the data. This is
45
HES question can be broken into steps such that each step represents a greater degree of
government control than the prior step. For example, question HQB2 asks “Does the
enemy collect taxes from hamlet households (in cash or in kind)?” and has three
ordered responses: “No,” “Yes, sporadically,” and “Yes, regularly and systematically.”
From the government’s perspective, an answer of No indicates greater control than
sporadically, which is also better than regularly and systematically. In notation, let
represent the number of correct steps by respondent on question out of possible
steps for that question. The partial credit model takes the following form:
( | ) [∑ ( )
]
∑ [∑ ( ) ]
Where the parameter represents the individual’s ability on a single underlying latent
trait. The parameter is a step parameter, the item’s difficulty (how hard it is for the
whole group). The item’s discrimination parameter represents how much harder it is
for individuals of low ability compared to individuals of high ability and is represented
by (Baker 2001). The parameter is a scaling constant. In terms of HES, we would
consider to be the degree of the unobserved control by the government; how
common it is to have positive reports on that particular security question; and how
common it is to have positive reports on that particular security question for
communities with very poor security relative to communities of generally high security.
particularly important for HES questions because responses to rebel presence and government presence
could interact in unpredictable ways.
46
Probabilities are expressed in terms of the base category, for which I have reordered
responses so that the base category always represents the most Viet Cong controlled. I
estimate the model using marginal maximum likelihood with the Gauss-Hermite
quadrature rule implemented in the R package ltm (Rizopoulos 2006).
For each month, there are three estimated parameters, a discrimination
parameter for each question, , a difficulty parameter for each step within each
question, , and a person parameter for each hamlet, . I have included 13 HAMLA
questions and 22 HES70/71 questions, which means there are 79 question parameters
per month for HAMLA alone. Rather than present 72 models and a few thousand
parameters, I instead organize the results around three questions. First, how did the
HES questions map into control? Second, how did control vary across space in South
Vietnam? Third, how did control vary across groups within South Vietnam?
2.4.3 How Did Different Questions Map onto Control?
Control Estimates
One way of examining relative control between areas is to compare the estimates
of , representing the underlying latent degree of government territorial control. In the
IRT literature these are called person parameters or factor scores. The scale itself is
determined by the chosen functional form and does not have inherent theoretical
properties (Reckase 2009, 17). Each unadjusted estimate of reflects the relative degree
47
of control between hamlets in that given month. This estimate of latent control is on an
interval scale which could in principal run from negative infinity to positive infinity but
for this sample ranges from -4.65 to 3.07, see Figure 2.5. Figure 2.6 shows that the
estimated measure of control varies nonlinearly with the additive aggregation, and that
there is a great deal of overlap in the distribution of theta for different final letter
scores from the Bayesian aggregation.
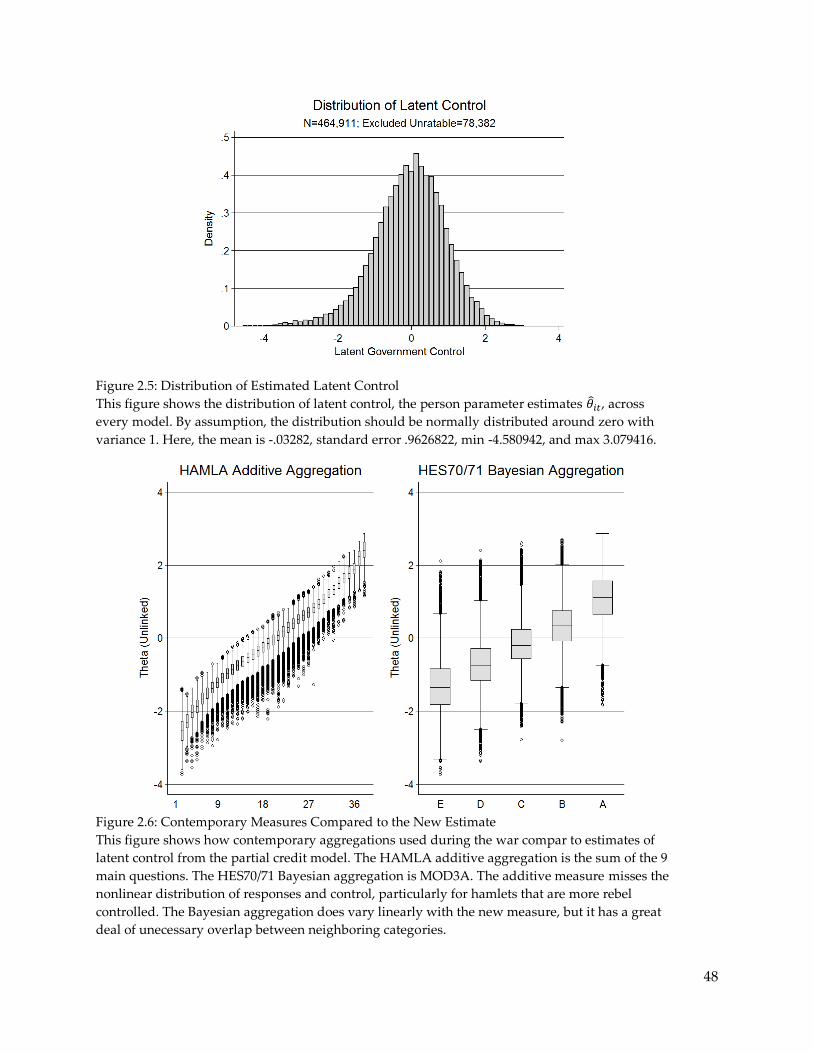
48
Figure 2.5: Distribution of Estimated Latent Control
This figure shows the distribution of latent control, the person parameter estimates , across
every model. By assumption, the distribution should be normally distributed around zero with
variance 1. Here, the mean is -.03282, standard error .9626822, min -4.580942, and max 3.079416.
Figure 2.6: Contemporary Measures Compared to the New Estimate
This figure shows how contemporary aggregations used during the war compar to estimates of
latent control from the partial credit model. The HAMLA additive aggregation is the sum of the 9
main questions. The HES70/71 Bayesian aggregation is MOD3A. The additive measure misses the
nonlinear distribution of responses and control, particularly for hamlets that are more rebel
controlled. The Bayesian aggregation does vary linearly with the new measure, but it has a great
deal of unecessary overlap between neighboring categories.
49
Item Difficulties
Each step of each question has an estimated difficulty parameter , which is the
point on the latent scale where reaching a given category is equally likely as staying at
the previous category. There are then difficulty parameters for levels of answer
for each question. In every case the base category is the lowest category, , for the
answer signifying the most Viet Cong control. A person item map is a convenient way
of graphically representing difficulty parameters against the distribution of the latent
trait.33 I provide person item maps for two cross-sections: October 1967 and its HAMLA
based questions, and October 1970 and its HES70/71 based questions. Along the top is a
histogram of estimated hamlet control levels. Below, each question’s difficulty
parameters are represented by numbered open circles arranged in order of increasing
difficulty. A solid black circle indicates the item’s threshold difficulty, which is an
average of all of the individual item difficulty parameters.
Figure 2.7 summarizes item difficulty for HAMLA questions asked in October
1967.34 Overall the polytomous responses do a good job of distinguishing shades of
control along the whole latent dimension, with a bit more information provided at the
higher end of government control. The model captures the way that some letter grades
on some questions are very different from one another while others are for all practical
33 The person-item maps were generated using a modified version of the plot functions in the R package
eRm (Mair and Hatzinger 2007). 34 Recall that being fully Viet Cong controlled serves as a type of left censoring, where no information is
available and thus further variation in control is impossible to determine.
50
purposes interchangeable. It also captures how responses are sometimes not strictly
ordered along the dimension of control. Consider the two questions on US Advisor
access to the hamlet, XPROB17 and XPROB18. A second level response states “not
feasible except by accompanying an operation,” which scores higher on government
control than the third level, “special security arrangements necessary.” In this case, the
ambiguity of the responses and the likely extra dimension of where “operations” are
conducted overrode the intended ordering on the form. The partial credit model is
specifically designed to catch these types of unordered responses.
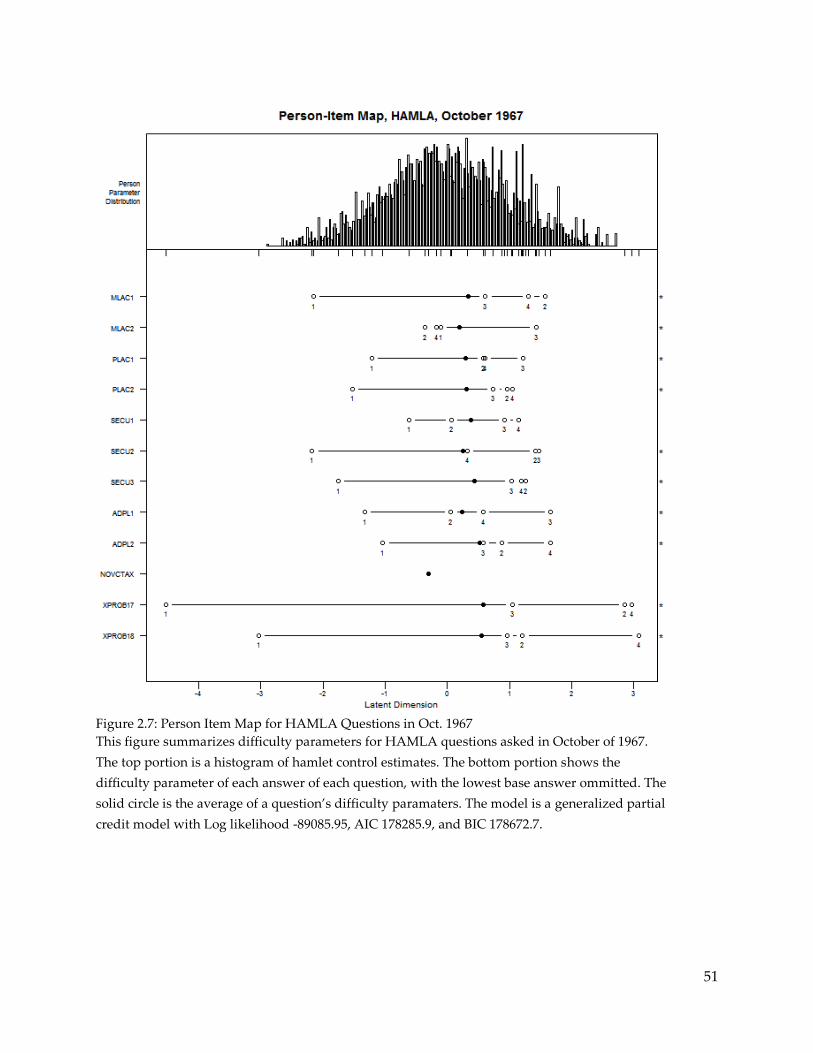
51
Figure 2.7: Person Item Map for HAMLA Questions in Oct. 1967
This figure summarizes difficulty parameters for HAMLA questions asked in October of 1967.
The top portion is a histogram of hamlet control estimates. The bottom portion shows the
difficulty parameter of each answer of each question, with the lowest base answer ommitted. The
solid circle is the average of a question’s difficulty paramaters. The model is a generalized partial
credit model with Log likelihood -89085.95, AIC 178285.9, and BIC 178672.7.
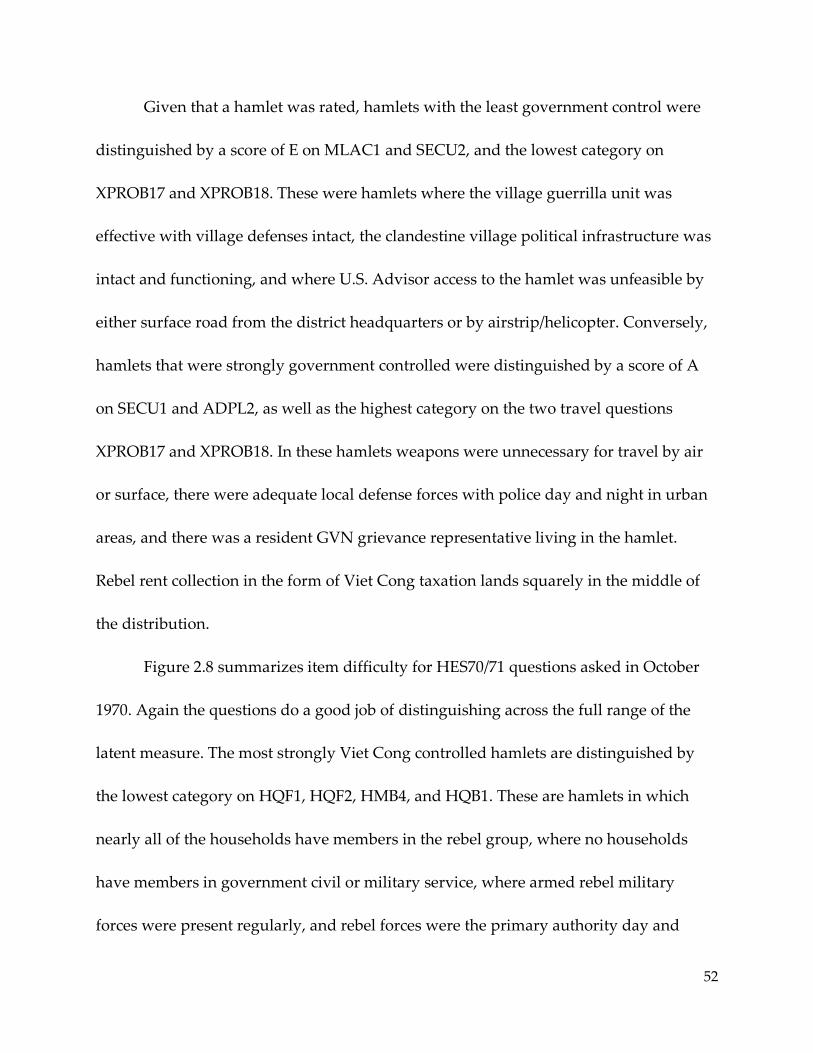
52
Given that a hamlet was rated, hamlets with the least government control were
distinguished by a score of E on MLAC1 and SECU2, and the lowest category on
XPROB17 and XPROB18. These were hamlets where the village guerrilla unit was
effective with village defenses intact, the clandestine village political infrastructure was
intact and functioning, and where U.S. Advisor access to the hamlet was unfeasible by
either surface road from the district headquarters or by airstrip/helicopter. Conversely,
hamlets that were strongly government controlled were distinguished by a score of A
on SECU1 and ADPL2, as well as the highest category on the two travel questions
XPROB17 and XPROB18. In these hamlets weapons were unnecessary for travel by air
or surface, there were adequate local defense forces with police day and night in urban
areas, and there was a resident GVN grievance representative living in the hamlet.
Rebel rent collection in the form of Viet Cong taxation lands squarely in the middle of
the distribution.
Figure 2.8 summarizes item difficulty for HES70/71 questions asked in October
1970. Again the questions do a good job of distinguishing across the full range of the
latent measure. The most strongly Viet Cong controlled hamlets are distinguished by
the lowest category on HQF1, HQF2, HMB4, and HQB1. These are hamlets in which
nearly all of the households have members in the rebel group, where no households
have members in government civil or military service, where armed rebel military
forces were present regularly, and rebel forces were the primary authority day and
53
night. The most highly government controlled hamlets were distinguished by the
highest category on HQC2, HMA1, HMA2, and HQF1. These were hamlets in which
local security patrols were not needed at night because there was no rebel threat, US
advisory personnel were resident in the hamlets, and no households had members in
the rebel organization.
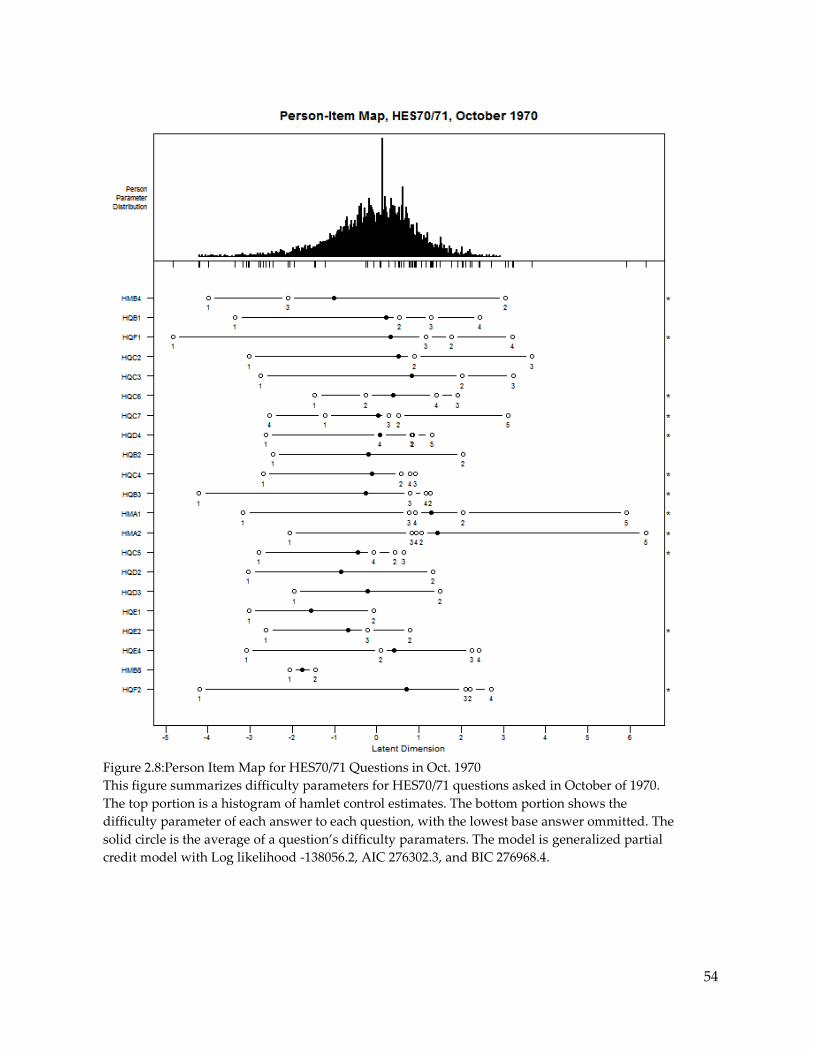
54
Figure 2.8:Person Item Map for HES70/71 Questions in Oct. 1970
This figure summarizes difficulty parameters for HES70/71 questions asked in October of 1970.
The top portion is a histogram of hamlet control estimates. The bottom portion shows the
difficulty parameter of each answer to each question, with the lowest base answer ommitted. The
solid circle is the average of a question’s difficulty paramaters. The model is generalized partial
credit model with Log likelihood -138056.2, AIC 276302.3, and BIC 276968.4.
55
Item Discrimination
In addition to item difficulty, there is the question of how well an item
discriminates between hamlets on low and high levels of control. Ideally, a question
would be perfectly discriminating such that every hamlet that scored positive on that
question was, for certain, above a particular level of control and a negative response
would indicate control was, for certain, below a particular level. In practice, items will
not perfectly discriminate but instead will have a slope for which steeper is more
informative.
Figure 2.9 presents discrimination parameters for HAMLA questions from
October 1967, where higher values imply greater ability to discriminate Viet Cong
controlled hamlets from government-controlled hamlets. The results are what we
would expect based on the wording of the questions and responses, and are strong
evidence for the internal validity of HES. For example, the discrimination of questions
varies directly with the specificity of the question wording. The most discriminating
question, PLAC1, asks about Viet Cong political infrastructure stationed directly in that
hamlet, while most other questions refer to the village overall. The least discriminating
question, MLAC2, refers to the broadest area, general military capabilities across an
entire district, “within a few hours travel to the hamlet.” Another interesting pattern is
that questions on security factors trump questions on political factors, with both
administration questions ADPL2 and ADPL1 ranking next to lowest in discrimination.

56
Security could be a pre-requisite for political infrastructure, or raters completing the
survey could have been more familiar with military matters in each hamlet.
Interestingly, no Viet Cong taxation places highly in discrimination, up with guerrilla
and political infrastructure presence, suggesting that lack of rent collection in an area is
a strong indicator of no rebel presence.
Figure 2.9: Discrimination Parameters for HAMLA Questions Oct. 1967
This figure shows the item discrimination paramaters for the 12 HAMLA questions available
in October 1967. Item discrimination is the slope of the item’s response function. Highly
discriminating questions are more difficult for hamlets with lower government control than
hamlets with high government control.
Figure 2.10 presents discrimination parameters for HES70/71 questions from
October 1970. The four least discriminating questions, HMA1 and HMA2, HQD4, and
HQE4 all pertain to the frequency of visits by U.S. and GVN personnel to the hamlet.
57
This could either mean that security conditions did not greatly influence the likelihood
of visiting, which is unlikely, or there was a tendency to exaggerate the frequency or
importance of visits. In contrast, the most discriminating questions are directly in line
with the theoretical understanding of control proposed in section 2. HQD2 and HQD3
ask about the government’s ability to actually enforce law in the hamlet. This is nice
confirmation of the view that there is a tendency for governments to claim security in
areas if a few administrators visit in day time while accompanied by guards, but in
reality these areas are either ungoverned or rebel governed. As it was before, Viet Cong
taxation, HQB2, is a highly revealing question.
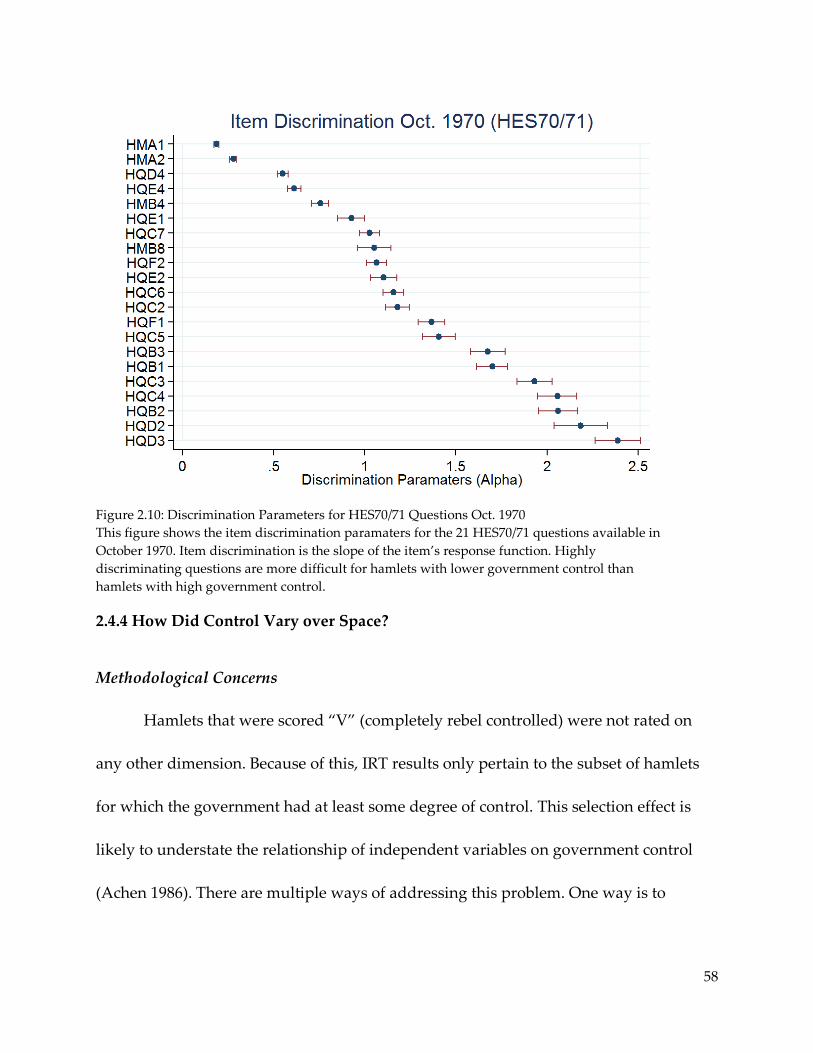
58
Figure 2.10: Discrimination Parameters for HES70/71 Questions Oct. 1970
This figure shows the item discrimination paramaters for the 21 HES70/71 questions available in
October 1970. Item discrimination is the slope of the item’s response function. Highly
discriminating questions are more difficult for hamlets with lower government control than
hamlets with high government control.
2.4.4 How Did Control Vary over Space?
Methodological Concerns
Hamlets that were scored “V” (completely rebel controlled) were not rated on
any other dimension. Because of this, IRT results only pertain to the subset of hamlets
for which the government had at least some degree of control. This selection effect is
likely to understate the relationship of independent variables on government control
(Achen 1986). There are multiple ways of addressing this problem. One way is to
59
impute an IRT score for hamlets under rebel control, setting it to ( ) in each
month.
Additionally, special care has to be taken when using an estimate of a latent trait
as a dependent variable instead of a directly observed trait.35 In the latter, uncertainty is
rooted in measurement error and sampling. In the former both of those are present as
well as uncertainty from the estimation process. Variation in the estimation uncertainty
acts as a type of heterosketasticity in ordinary least squares (OLS). This will not bias the
OLS estimates, but it will affect the standard errors. Employing White (1980) or Efron
(1982) heteroscedastic consistent standard error estimators will address this
heterosketasticity, but we can do better by directly incorporating the information we
have on the uncertainty of the estimates as reported alongside the IRT estimates. I use
the two-step procedure implemented by Lewis and Linzer (2005) and first described by
Hanushek (1974). In that procedure, a set of weights for observations are
constructed such that:
√
35 See Borjas and Sueyoshi (1994), Lewis and Linzer (2005), and Huber and Kernell (2005).
60
Where, is the known variance of the sampling error and is the usual variance
from the OLS procedure. Those weights are then fed into Feasible Generalized Least
Squares.36
Variation in Control by Province
To gauge relative control across provinces for the entire period, I estimate a
FGLS model with the following form,
where is the estimate of latent control generated by the GPCM, is an intercept
term, is a month fixed effect, is a province fixed effect, and is hamlet-
month error term.37 I estimate 95% confidence intervals using robust standard errors
clustered on each hamlet and the two-step correction described in the previous section.
I estimate the model twice, setting the base province the second time to the one with the
mean estimate on the province fixed effect, which in this case was Ba Xuyen. The
province fixed effects can then be interpreted as the relative change in latent
government control averaged across hamlets within a province and across time periods
for which data are available.
36 The procedure is implemented in Stata as edvreg 1.1, http://svn.cluelessresearch.com/twostep/trunk/ 37 The control estimates used here are not linked, as described in the next section. How then can we
compare estimates from different models? The estimates of control are relative to one another, and the
distribution is imposed by the IRT process, mean zero and variance one. We are then effectively only
asking whether a particular province was above or below average in each individual period.
61
The province estimates are below in Figure 2.11. Even at this level of aggregation,
many provinces are statistically distinguishable from one another in control and the
results compare favorably to historical accounts of the conflict. The cities, Da Nang,
Hue, Saigon, Vung Tau, all appear toward the top end of government control. An Giang
which was home to the strongly anti-communist Hoa Hao sect is the second most
government controlled province (Kalyvas and Kocher 2007). Provinces that ranked
lowest in government control are not surprising either. Hau Nghia, Dinh Tuong, and
Long An were all selected for detailed historical case studies based on their centrality to
the conflict in III Corps near Saigon (Bergerud 1993, Race 1972, Elliot 2003).
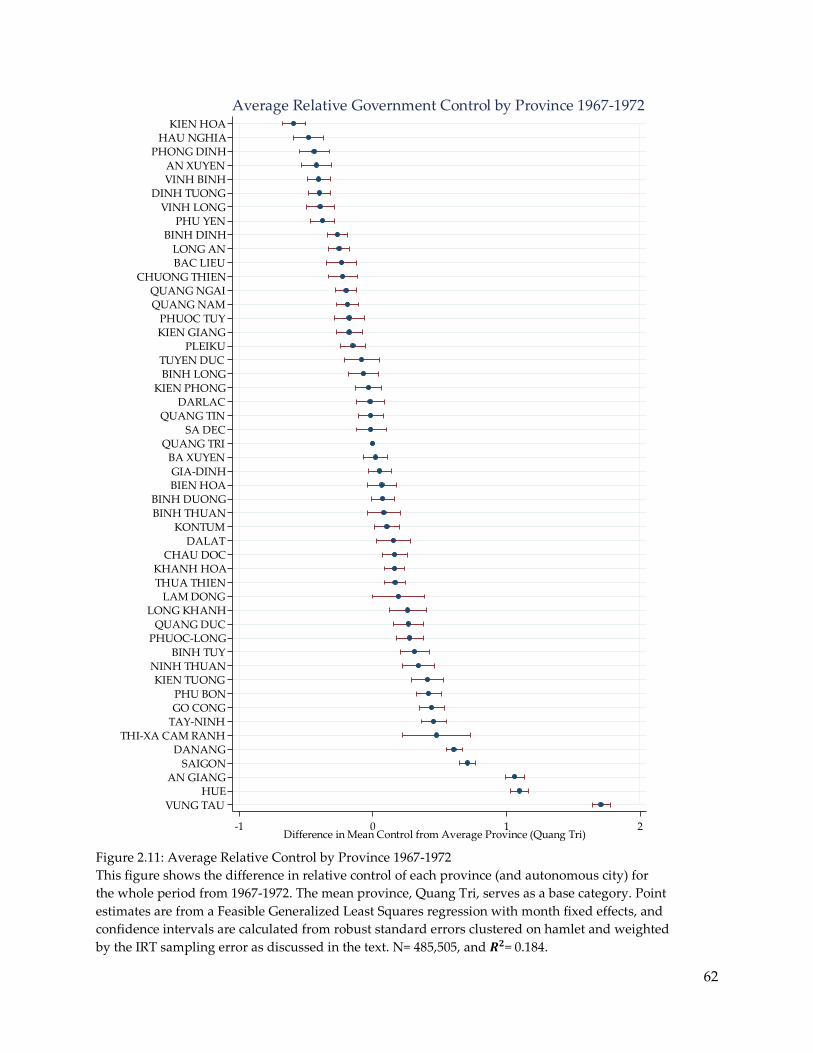
62
Figure 2.11: Average Relative Control by Province 1967-1972
This figure shows the difference in relative control of each province (and autonomous city) for
the whole period from 1967-1972. The mean province, Quang Tri, serves as a base category. Point
estimates are from a Feasible Generalized Least Squares regression with month fixed effects, and
confidence intervals are calculated from robust standard errors clustered on hamlet and weighted
by the IRT sampling error as discussed in the text. N= 485,505, and = 0.184.
KIEN HOAHAU NGHIA
PHONG DINH
AN XUYENVINH BINH
DINH TUONG
VINH LONGPHU YEN
BINH DINH
LONG ANBAC LIEU
CHUONG THIENQUANG NGAIQUANG NAM
PHUOC TUYKIEN GIANG
PLEIKU
TUYEN DUCBINH LONG
KIEN PHONGDARLAC
QUANG TIN
SA DECQUANG TRI
BA XUYEN
GIA-DINHBIEN HOA
BINH DUONG
BINH THUANKONTUM
DALATCHAU DOC
KHANH HOA
THUA THIENLAM DONG
LONG KHANH
QUANG DUCPHUOC-LONG
BINH TUYNINH THUANKIEN TUONG
PHU BONGO CONG
TAY-NINH
THI-XA CAM RANHDANANG
SAIGONAN GIANG
HUE
VUNG TAU
-1 0 1 2Difference in Mean Control from Average Province (Quang Tri)
Average Relative Government Control by Province 1967-1972
63
A more focused comparison over space is provided in Figure 2.12 which plots
average latent control (imputed for fully rebel control) for a single cross section of
October 1967. Quang Tri which directly faced North Vietnam, Binh Long which was a
major jumping off point for the Hoi Chi Minh Trail, An Xuyen which was extremely
rural and remote from the government’s perspective, all have the lowest levels of
government control. The inset displays variation in control by village that picks up the
spatial clustering of control. One can see both the pro government areas, like the Hoa
Hao villages which are white in the upper left, as well as fully Viet Cong controlled
villages which are black, particularly along the border with Cambodia.
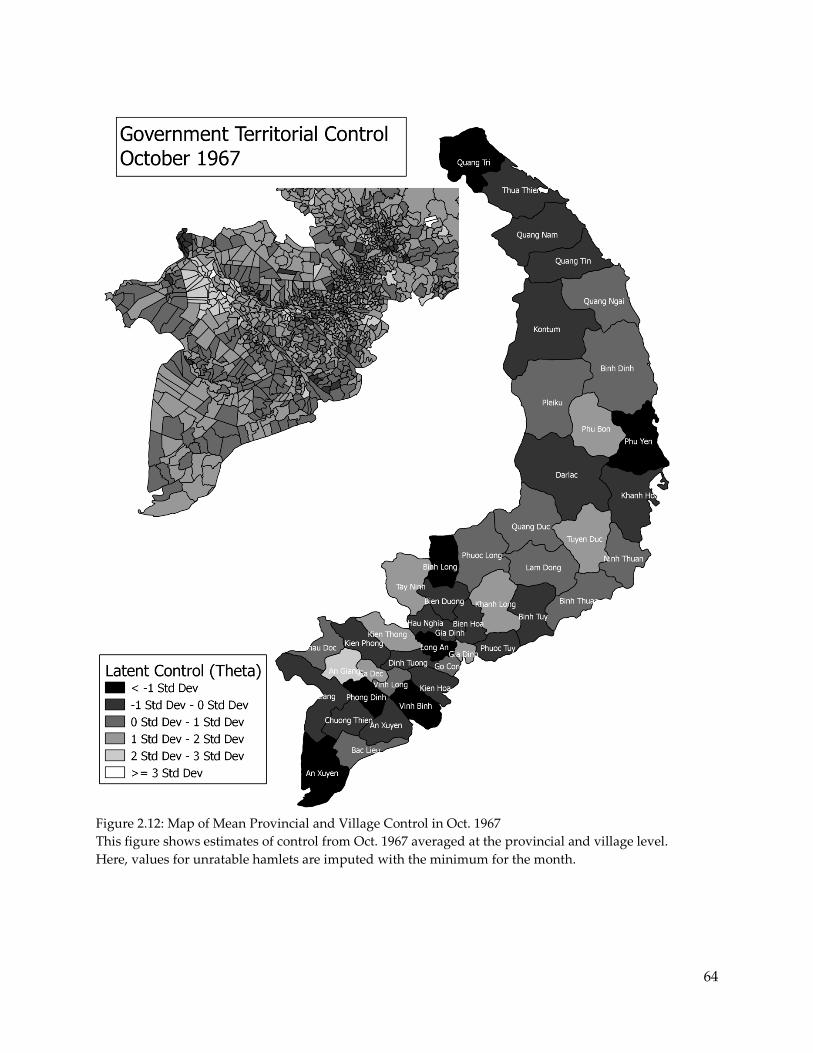
64
Figure 2.12: Map of Mean Provincial and Village Control in Oct. 1967
This figure shows estimates of control from Oct. 1967 averaged at the provincial and village level.
Here, values for unratable hamlets are imputed with the minimum for the month.

65
2.4.5 How Did Control Vary by Local Conditions/Demographics?
Without a strong theoretical reason for why some hamlets are considered fully
Viet Cong controlled and unratable while others are not, it is important to consider the
effects of a regressor on both the probability of being rated and the degree of control if
rated. In comparing variation in control across subgroups, I estimate two models. The
first is, as before, an estimate of latent control in a linear framework with a global
intercept, month fixed effects, and a series of dummy variables for each nominal
category of the variable of interest. The second uses a logistic regression to estimate the
probability of being rated, with robust standard errors clustered on hamlet. For both
models, I include the log population of the hamlet.
Variation in Control by Demographics and Economic Conditions
Territorial control varied widely. Both sides invented terms to describe their hold
over territory, including “oil spots,” “iron bands,” “security belts,” etc. Both sides
attempted to employ fortifications to move hamlets from contested or partially
controlled into fully controlled. The Viet Cong built “combat hamlets” and the GVN
attempted a failed program to relocate civilians to new fortified communities closer to
the main roads called “New Life Hamlets.” Urban areas contained communist
infiltrators and sympathizers yet communists were rarely able to raise or maneuver
large units in those areas. In repeated attempts from 1951 to 1968, both the Viet Minh
and Viet Cong repeatedly failed to seize control over urban areas. Despite its dominant
66
advantages in manpower and firepower, the government similarly found it difficult to
take and hold territory outside urban areas. At the tactical level, the modal strategy was
to deliver forces into an area, establish a defensive position, and then to rely on air and
artillery fire if the rebels chose to engage (Clodfelter 1995,72).38 Figure 2.13 shows
differences in ratability and control by the type of hamlet, its prominence as an
administrative center, and its urban or rural status. As expected, urban status and status
as an administrative center have strong positive relationship with government control,
even while controlling for population size. Refugee camps appear slightly more
government controlled than others, but older hamlets, recently built hamlets, and
refugee camps were not statistically distinguishable from one another.
38 The Viet Cong were aided by a number of geographic features. Dense jungles provided concealment,
allowing rebels to close with government forces unnoticed. In other parts of the country, the soil was
amenable to tunneling, and the Viet Cong dug an estimated 30,000km of tunnels including some under
U.S. bases. (Clodfelter 1995,77).
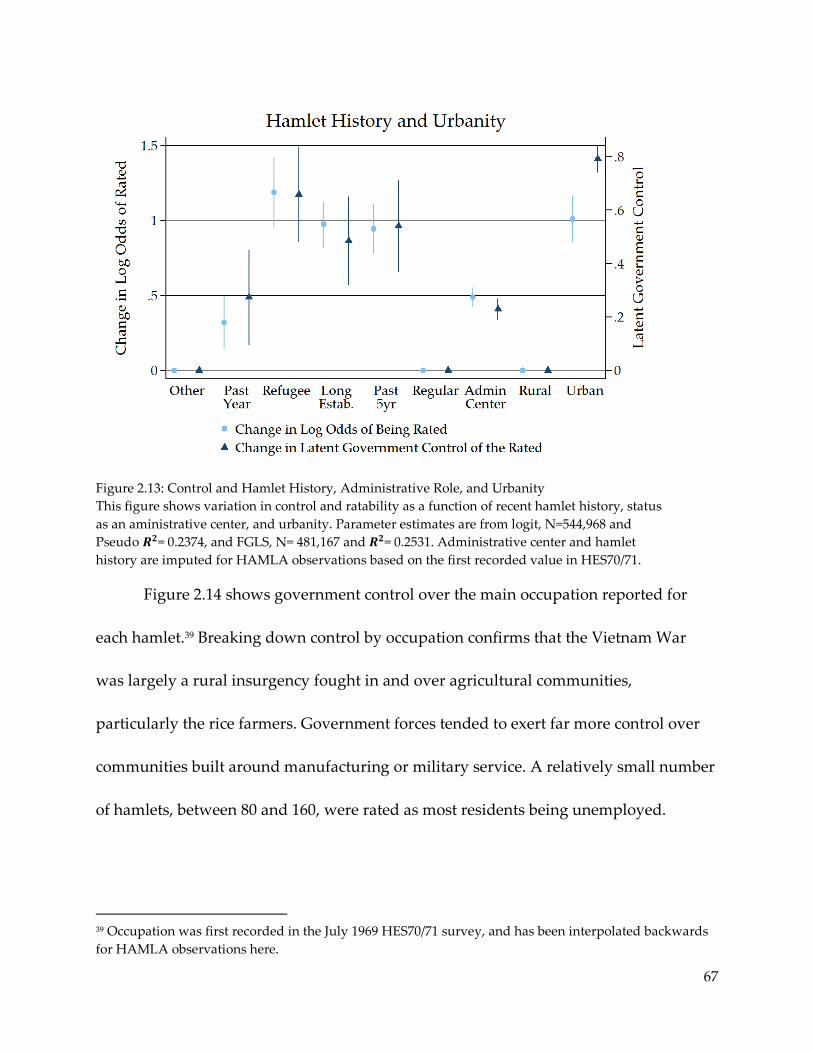
67
Figure 2.13: Control and Hamlet History, Administrative Role, and Urbanity
This figure shows variation in control and ratability as a function of recent hamlet history, status
as an aministrative center, and urbanity. Parameter estimates are from logit, N=544,968 and
Pseudo = 0.2374, and FGLS, N= 481,167 and = 0.2531. Administrative center and hamlet
history are imputed for HAMLA observations based on the first recorded value in HES70/71.
Figure 2.14 shows government control over the main occupation reported for
each hamlet.39 Breaking down control by occupation confirms that the Vietnam War
was largely a rural insurgency fought in and over agricultural communities,
particularly the rice farmers. Government forces tended to exert far more control over
communities built around manufacturing or military service. A relatively small number
of hamlets, between 80 and 160, were rated as most residents being unemployed.
39 Occupation was first recorded in the July 1969 HES70/71 survey, and has been interpolated backwards
for HAMLA observations here.
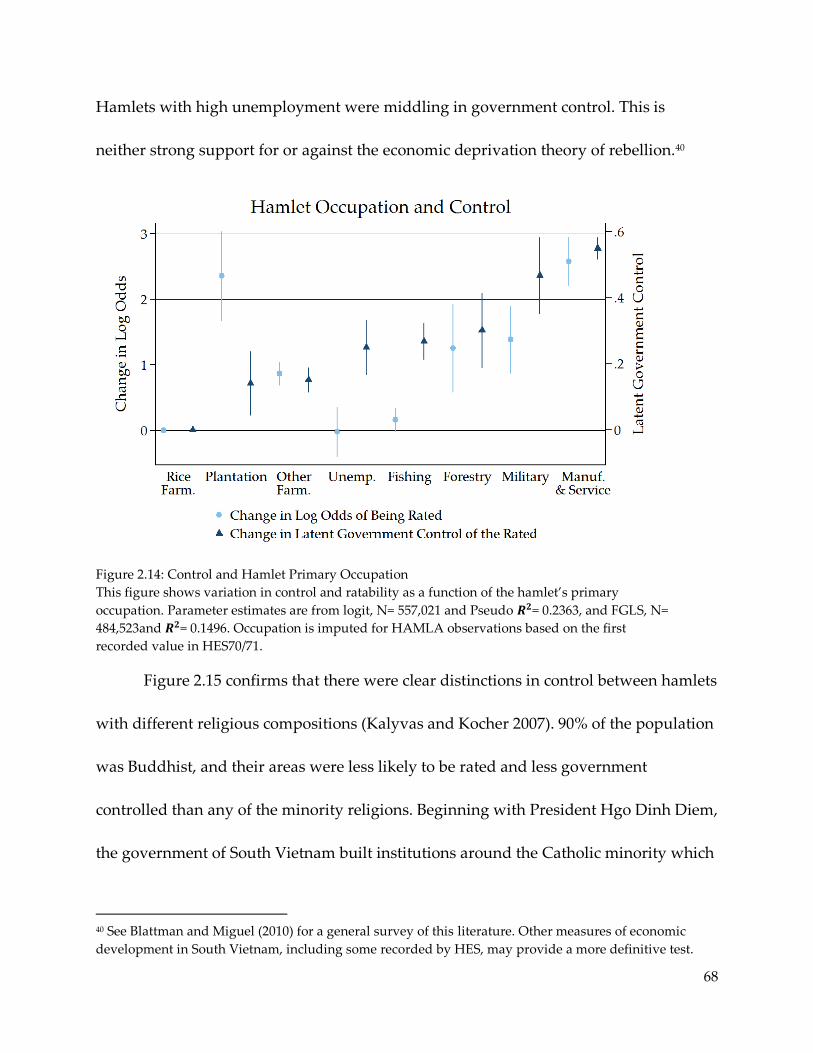
68
Hamlets with high unemployment were middling in government control. This is
neither strong support for or against the economic deprivation theory of rebellion.40
Figure 2.14: Control and Hamlet Primary Occupation
This figure shows variation in control and ratability as a function of the hamlet’s primary
occupation. Parameter estimates are from logit, N= 557,021 and Pseudo = 0.2363, and FGLS, N=
484,523and = 0.1496. Occupation is imputed for HAMLA observations based on the first
recorded value in HES70/71.
Figure 2.15 confirms that there were clear distinctions in control between hamlets
with different religious compositions (Kalyvas and Kocher 2007). 90% of the population
was Buddhist, and their areas were less likely to be rated and less government
controlled than any of the minority religions. Beginning with President Hgo Dinh Diem,
the government of South Vietnam built institutions around the Catholic minority which
40 See Blattman and Miguel (2010) for a general survey of this literature. Other measures of economic
development in South Vietnam, including some recorded by HES, may provide a more definitive test.
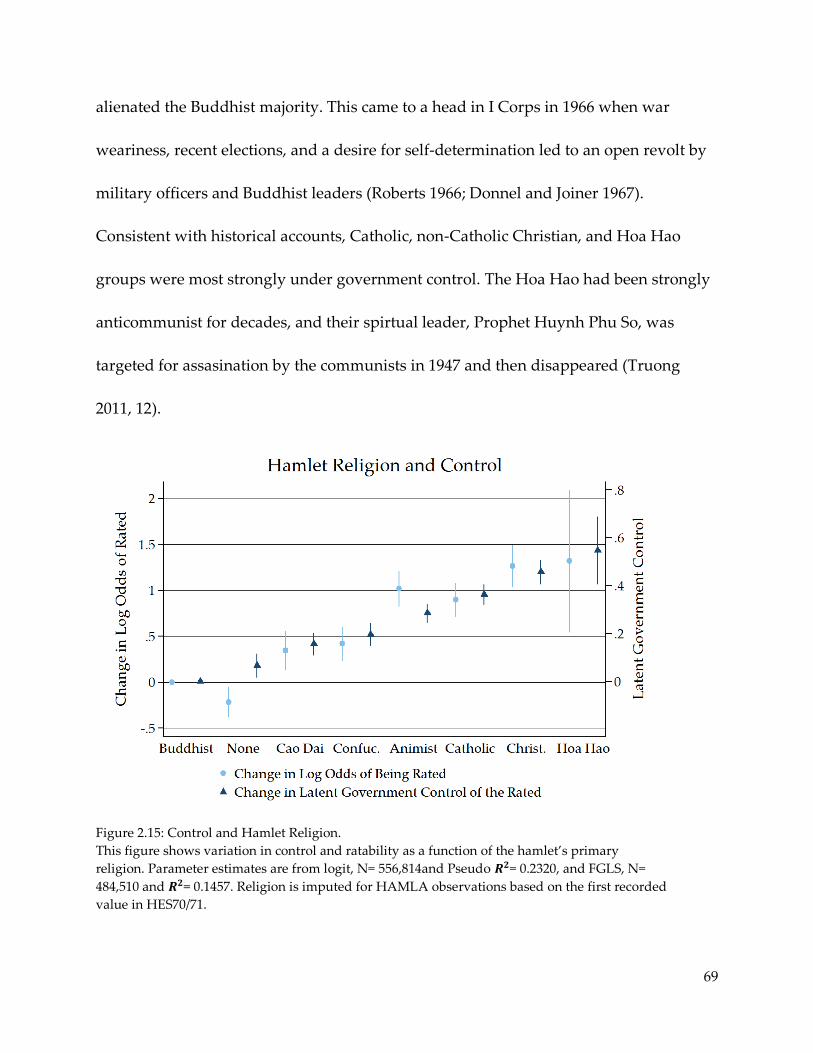
69
alienated the Buddhist majority. This came to a head in I Corps in 1966 when war
weariness, recent elections, and a desire for self-determination led to an open revolt by
military officers and Buddhist leaders (Roberts 1966; Donnel and Joiner 1967).
Consistent with historical accounts, Catholic, non-Catholic Christian, and Hoa Hao
groups were most strongly under government control. The Hoa Hao had been strongly
anticommunist for decades, and their spirtual leader, Prophet Huynh Phu So, was
targeted for assasination by the communists in 1947 and then disappeared (Truong
2011, 12).
Figure 2.15: Control and Hamlet Religion.
This figure shows variation in control and ratability as a function of the hamlet’s primary
religion. Parameter estimates are from logit, N= 556,814and Pseudo = 0.2320, and FGLS, N=
484,510 and = 0.1457. Religion is imputed for HAMLA observations based on the first recorded
value in HES70/71.
70
Finally, Figure 2.16 shows that patterns of control in South Vietnam followed a
clear ordering along the type of units that were tasked with maintaining security. The
ordering supports a theoretical conception of pacification sometimes called “clear,
build, hold,” where big units engage and remove rebel units and then transfer
responsibility of security to regional forces, then local militias, and eventually
professional police forces (Pirnie and O’Connell 2008). Large regular combat units from
the U.S., RVN, or allied nations operated in the most dangerous rebel controlled areas.
Behind them were irregular regional forces, including the Rural Forces and the Civilian
Irregular Defense Group (locally raised militias which were eventually converted to
forward operating Vietnam Army Ranger units). Popular Forces were militias raised
and stationed at the village level. National police field forces traveled out of the cities at
the district level. The People’s Self Defense Forces were members of the local
community provided with light arms. Finally, National Police were what we would
recognize today as professional law enforcement rather than a military agency.
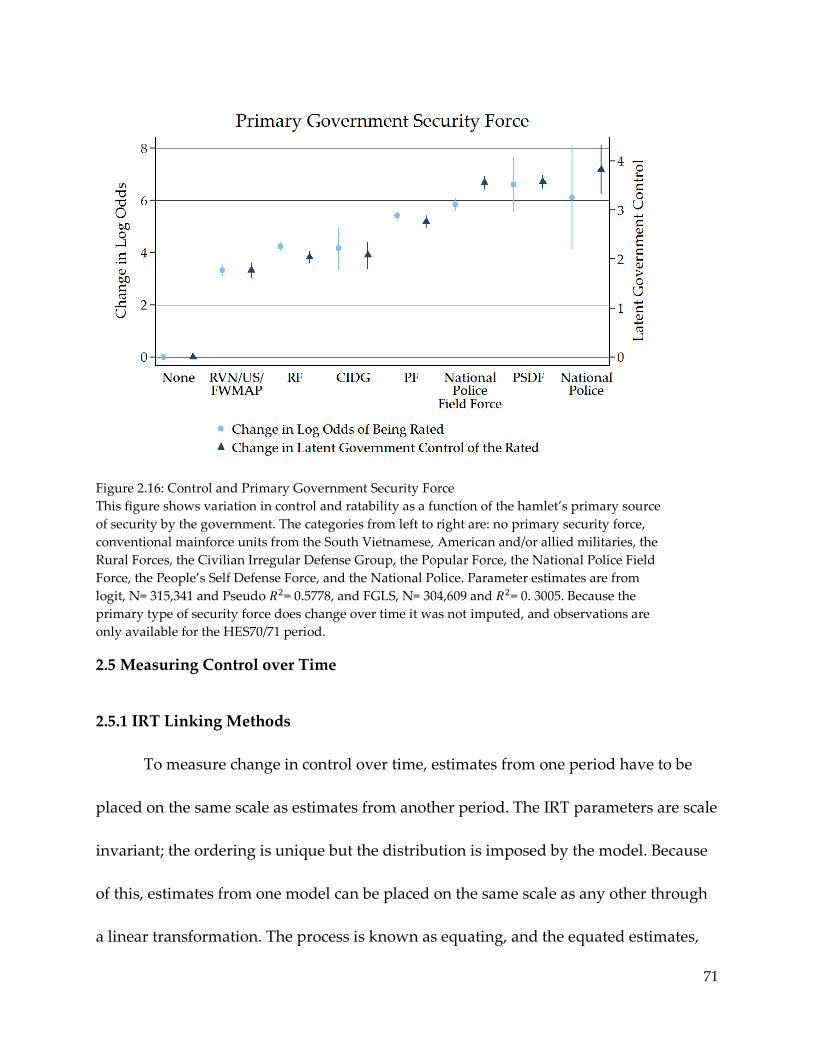
71
Figure 2.16: Control and Primary Government Security Force
This figure shows variation in control and ratability as a function of the hamlet’s primary source
of security by the government. The categories from left to right are: no primary security force,
conventional mainforce units from the South Vietnamese, American and/or allied militaries, the
Rural Forces, the Civilian Irregular Defense Group, the Popular Force, the National Police Field
Force, the People’s Self Defense Force, and the National Police. Parameter estimates are from
logit, N= 315,341 and Pseudo = 0.5778, and FGLS, N= 304,609 and = 0. 3005. Because the
primary type of security force does change over time it was not imputed, and observations are
only available for the HES70/71 period.
2.5 Measuring Control over Time
2.5.1 IRT Linking Methods
To measure change in control over time, estimates from one period have to be
placed on the same scale as estimates from another period. The IRT parameters are scale
invariant; the ordering is unique but the distribution is imposed by the model. Because
of this, estimates from one model can be placed on the same scale as any other through
a linear transformation. The process is known as equating, and the equated estimates,
72
, can then be compared month to month in the same way as relative degrees of
government control. There are at a minimum 9 common questions asked between any
two months and a maximum of 34 because of the six-month overlap in the two surveys.
This is known as a common-item nonequivalent groups design (Kolen and Brennan
2004).
There are two general methods of equating scores from multiple surveys,
concurrent calibration and separate calibration (Hanson and Béguin, 2002).41 The size of
HES precludes concurrent calibration that involves estimating all of the parameters
using all of the data simultaneously. Instead, separate calibration is used to estimate
item parameters for each month. Then, using a linear relationship of the parameter
estimates, parameters are made comparable from month to month and between the
different HES systems.42 There are several linking procedures, but the Stocking-Lord
method is preferred (Kolen and Brennan, 2004; Hanson and Béguin, 2002; Kim and
Kolen, 2006). The procedure is as follows: (1) Estimate the IRT model of choice on each
test separately; (2) Identify common or similarly discriminating questions on both tests;
(3) Using those questions as anchors, find the linear transformation which minimizes
the sum of squared differences between the test characteristic curves on those questions
41 For a review of the distinction between prediction, scaling, linking, and the stronger method of
equating, see (Dorans et al. 2011) 42 For a review of the literature on linking methods, see (Holland and Rubin 1982; Kolen & Brennan, 2004;
von Davier 2011)
73
(Stocking and Lord 1983). The Stocking-Lord method is implemented in the R package
Plink (Weeks 2010).
2.5.2 How Did Control Vary over Time?
Figure 2.17 presents the monthly mean linked estimate of latent control over time
and by province. Plots are ordered from top left to bottom right by increasing steepness
of the time trend in control. Even at this level of aggregation, several clear temporal
patterns are discernable. First, HES was not a constantly improving metric as one would
expect if raters were trying to create a false impression of progress.43 Second, overall
trends reflect major events, particularly the Tet Offensive which occurred in January of
1968. Thirty of the provinces exhibited at least a minor decline in ratings of control
following Tet. Tet also reduced both scores on hamlets and also the number of hamlets
being scored (Kamras 1969, 38). Tantalizingly, eight of those provinces show at least a
slight decline in security prior to Tet. Gayver (2010, 7) notes that early indications of Tet
appear in several of the HES indicators in the months leading up to the event.44
43 A more difficult problem would be a cyclical reporting style, with raters dropping scores at the
beginning of their tour in order to raise them by the time they leave (Connable 2012, 224). Coding of the
accompanying advisor reports will allow a comparison of an expert survey to qualitative narrative
reports in the same environment. I am in the process of gathering information on the rotation of district
senior advisors so that observations can be further clustered on the specific individual filling out the
form. 44 Future analysis could retroactively compare shifts in latent control leading up to Tet in areas where
rebel forces were staging to control areas matched on a number of criteria.
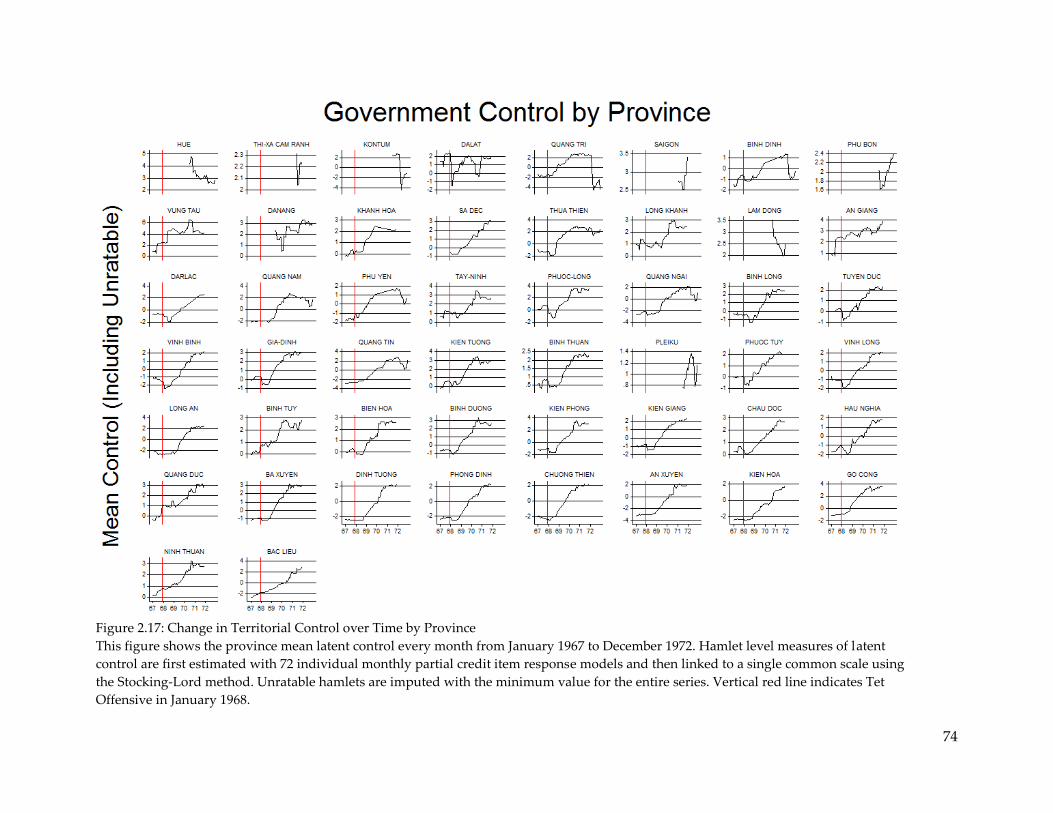
74
Figure 2.17: Change in Territorial Control over Time by Province
This figure shows the province mean latent control every month from January 1967 to December 1972. Hamlet level measures of latent
control are first estimated with 72 individual monthly partial credit item response models and then linked to a single common scale using
the Stocking-Lord method. Unratable hamlets are imputed with the minimum value for the entire series. Vertical red line indicates Tet
Offensive in January 1968.
75
2.5.3 Robustness and Item Parameter Drift
Unfortunately, there are two different states of the world that are observationally
equivalent.45 The first is that the common anchor items function the same way across
every group and every time point, and differences in the scores are completely due to
differences in the underlying trait of interest. The second is that the groups actually
have the same measure on the latent trait, and the difference in score is completely
attributable to differences in the way the test behaves for each group.46 The degree to
which this occurs is called differential item functioning (DIF) or the case of multiple
time points parameter drift/longitudinal invariance (Goldstein 1983). The absence of
DIF is formally defined as (Osterlind and Everson 2009):
( | ) ( | )
where is the response to particular test item, the latent trait is , ( ) is the probability
distribution of responses given the trait, and is either the focal group or the
reference group . For a test to have zero differential item functioning, the probability
of a correct response must be equal for two individuals from different groups that share
the same level of that trait.
45 For a practical guide to checking measurement invariance in longitudinal IRT models see Millsap
(2010). 46 Items can vary in difficulty, discrimination, or both and even when close to one another from one
month to the next they can still exhibit a long term linear shift across the whole sample (Demars 2004).
Another case is when items shift in opposing directions over time (Han et al. 2012).
76
Analysis of the parameter estimates show differential item functioning both
across months and between groups within months. Items with DIF can be flagged
automatically using a logistic regression method of detecting differential item
functioning proposed by Swaminathan and Rogers (1990), extended to polytomous
items (French and Miller 1996; Miller and Spray 1993; Zumbo 1999), and implemented
as in R package lordif (Choi et al. 2011). For several months and several different
subsets of the data, many if not every item was flagged for DIF. Consider a visual
comparison of discrimination parameter for each question over time, shown below in
Figure 2.18. The ordering of questions remains relatively constant, but items tend to
become more discriminating over time. The estimates also become more noisy month to
month in periods where missingness reduces the sample size, in 1969 and again in 1972.
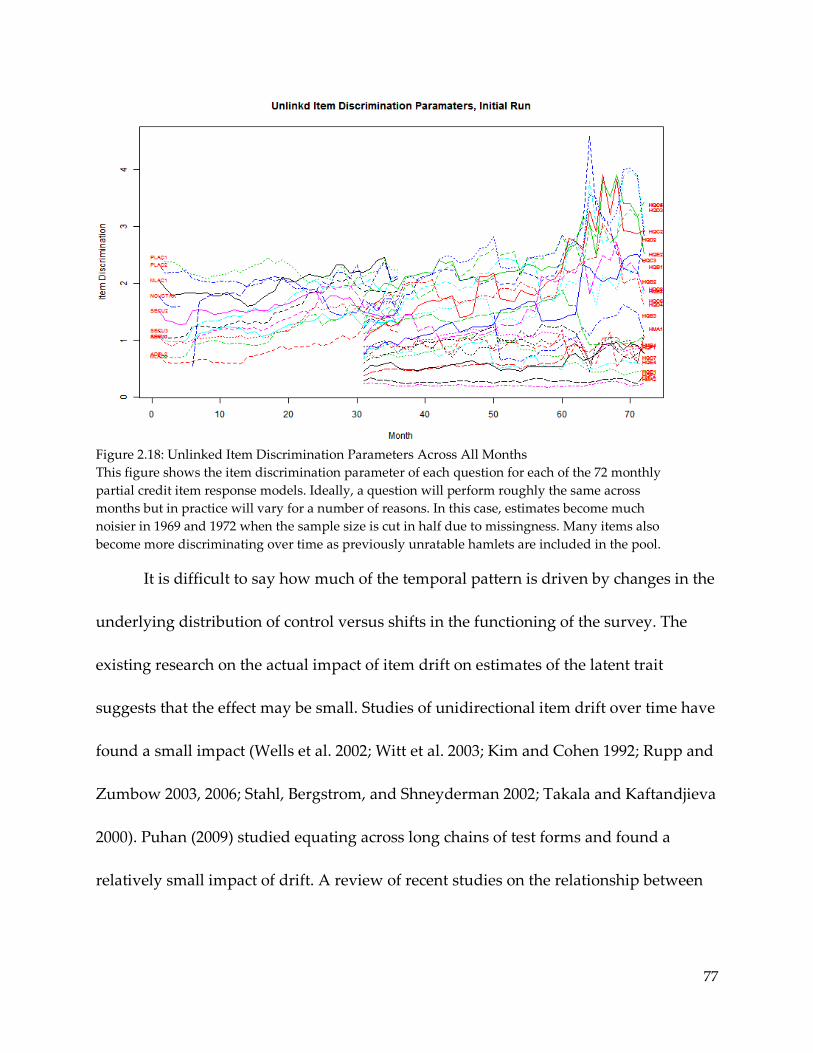
77
Figure 2.18: Unlinked Item Discrimination Parameters Across All Months
This figure shows the item discrimination parameter of each question for each of the 72 monthly
partial credit item response models. Ideally, a question will perform roughly the same across
months but in practice will vary for a number of reasons. In this case, estimates become much
noisier in 1969 and 1972 when the sample size is cut in half due to missingness. Many items also
become more discriminating over time as previously unratable hamlets are included in the pool.
It is difficult to say how much of the temporal pattern is driven by changes in the
underlying distribution of control versus shifts in the functioning of the survey. The
existing research on the actual impact of item drift on estimates of the latent trait
suggests that the effect may be small. Studies of unidirectional item drift over time have
found a small impact (Wells et al. 2002; Witt et al. 2003; Kim and Cohen 1992; Rupp and
Zumbow 2003, 2006; Stahl, Bergstrom, and Shneyderman 2002; Takala and Kaftandjieva
2000). Puhan (2009) studied equating across long chains of test forms and found a
relatively small impact of drift. A review of recent studies on the relationship between

78
DIF and item parameters suggests that there is only a small effect on estimates of the
latent trait (Li 2009).
Item drift in this case likely results from a number of sources. First, the sample
changes over time in a number of ways. Previously unratable hamlets gradual begin
entering the full sample as strongly rebel controlled. III and IV Corps are missing data
in 1969 and again in 1972. A large group of urban hamlets representing wards of the
major cities are first included in 1971. Second, this analysis has assumed a single
underlying dimension of control when there may in fact be several underlying
dimensions to this data related to control, reporting, or other aspects of the war.
Chapter 4 capitalizes on this fact by disaggregating control into rebel and government
control using the original HES70/71 Bayesian aggregations. Future work should
specifically investigate these sources of parameter drift in HES and similar surveys of
security conditions.
2.6 Conclusion
For the task of gauging relative government control in a given cross-section of
time, HES exhibited several desirable properties. HES included many questions directly
pertaining to control, both the physical presence of competing forces and their
monopoly access. Those questions and answers ranged in difficulty along the entire
latent dimension, allowing hamlets to be distinguished from one another at both the
79
high and low ends of government control. Question difficulty varied in ways expected
by the theoretical conception of territorial control. Question discrimination varied in
clear predictable ways with the specificity of the questions asked and the theory of
control. Cross-sectional comparisons of territorial control show variation between areas
that conform to the existing historical narratives. Cross-sectional variation in control
also varies in the expected ways when compared across the types of security forces
present, the demographic characteristics of the communities, and their occupation. The
temporal variation in control also reflected contemporaneous real world events. In sum,
the understandable pessimism with which scholars and policy makers have levied
toward the HES experiment would appear far overstated.
By the single metric of territorial control, the government of South Vietnam and
its allies did manage to expand control into a great deal of rural country side from 1969
onward. This supports the historical hypothesis that the Viet Cong were largely
decimated by the Tet Offensive and the following government counterattack
(Bullington 2012; Moyar 2006; Colby and McCargar 1989; Lewy 1978; Woodruff 1999).
The rapid expansion of militia and police forces provided the manpower to reoccupy
areas not held by the government in years. This result is important to the historical
debate over the degree to which the United States “won” or “lost” the
counterinsurgency campaign in the rural areas of South Vietnam. There is an argument
that pacification was ultimately doomed, and American efforts were too little too late to
80
make a difference (Sorely 2011, Hunt 1998). This finding would support an alternate
conclusion that the focus on pacification, development, and regional security forces
resulted in a genuine counterinsurgency victory that was later undone by a
conventional invasion by the North. Chapter 3 investigates this finding more closely in
terms of rates of rebel defection during this period of government expansion in
territorial control.
The modeling approach could be strengthened in a number of ways. The
multilevel nature of the data, responses nested within questions, which are nested
within hamlets, in villages, in districts, etc. can be handled by estimating the Rasch
model in a mixed effects GLM framework (Doran et al. 2007). Further, the ordered
categorical nature of the response, nonrandom missingness, and autocorrelation
structure can be handled through an IRTree model proposed by De Boeck and Partchev
(2012). The missingness of data should also be modeled explicitly as a function of
control. This too can be handled directly within the IRT framework (Rosas and Shomer
2008; Wahab 2012).
Ultimately, HES did more in Vietnam with punch cards than is typical in modern
wars because the need for accurate metrics and institutional resources came together at
the right time. Despite relatively primitive technology, the HES system did well because
of the remarkable resources that were made available. Even at peak deployments in Iraq
and Afghanistan, the U.S. committed only a fraction of the resources that were made
81
available to the metrics program in Vietnam. With the drawdown in forces in those
conflicts, and the coming shift in resources away from irregular war fighting, it is
unlikely that the United States or others will be able to replicate the HES experiment.
How should we measure territorial control in future conflicts? HES provides
several important lessons that inform a potential solution. First, even abstract concepts
like territorial control in an irregular conflict can be approximated with a level of
accuracy that is useful for many policy and academic questions. Second, expert surveys
require direct local experience, which in this case meant relatively educated personnel
working directly in the areas for which they were responsible for measuring. If nothing
else, they learned which areas not to travel to for their own personal safety which is a
key equilibrium outcome in irregular war. Third, determining where information is
lacking is just as important as correctly measuring an important concept. Drawing
confidence intervals and highlighting areas on the map where nothing is known are key
pieces of information for policy makers. The approach taken here does this in only one
limited sense by showing just how differentiated two hamlets can be given the
similarity in answer on the same underlying survey. Future work will look specifically
at modeling uncertainty as an outcome of interest.
I propose a modern version of HES grounded in the idea that individual soldiers,
aid workers, journalists, contractors, and civilians, are the key sources of real time
information about the economic, political, and military conditions in different areas.
82
Ad-hoc grassroots intelligence collection has already been suggested as a replacement
for the rigid command centered structure in Afghanistan (Flynn et al. 2010). Methods
are available today that can aggregate disparate reports over time and location from
multiple individuals into a coherent picture of at least some measures of civil war, such
as territorial control. The application would be very straightforward. The individual
would be presented with a basic web-applet where they would select their geographic
boundary of experience, perhaps their hometown or their area of operation. They
would be given a survey of a few important questions about that area within a given
timeframe. In a Bayesian framework, that individual’s responses would be combined
with other raters to form a sparse network of estimates on key metrics. The end user
could weight those responses however they saw fit, comparing civilian to military
sources, down weighting older information, etc. The system could identify in real time
areas where information has become outdated or where there is no consensus among
raters. With ubiquitous access to cell phones and PDAs, policy makers could request
new information with one or two questions through an SMS message to those trouble
areas. A system like this would have wide application, not just in warzones, but also in
nation building, humanitarian disaster operations, and in law enforcement.
83
Chapter 3 Why Not Just Bribe the Rebels? The Determinants of
Rebel Defection in the Vietnam War
Abstract
Because incentives to free ride and defect make rebellion difficult, existing work on the
causes of civil war focuses primarily on pre-conflict factors conducive to collective
action like shared ethnicity, ideology, or class. However, rebel cohesion varies wildly
within conflicts over time and therefore cannot be explained by initial conditions alone.
I investigate two important factors which vary during a conflict: (1) the taking and
holding of previously controlled rebel territory by the government and (2) the roll out
of propaganda and amnesty-related political infrastructure at the community level. In
the Vietnam War, over 200,000 Viet Cong fighters formally defected to the government
side at varying rates across time and space. Using data on Viet Cong defections at the
province-month level for over eight years, I show that the government induced
defection by expanding into previously rebel held areas with military and political
infrastructure. The point is subtle, but important: conquest and territorial expansion led
to greater political realignment than did consolidation and pacification of existing
government areas.
84
3.1 Introduction
Why in civil wars do rebel groups sometimes retain their ranks and other times
shed members in droves? All organizations, including corporations, universities, sports
teams, and street gangs, face the same problems of recruitment and retention. When a
member leaves for a rival with military or trade secrets, the cost to the organization can
be immense. In civil wars, both government and rebel group’s ability to recruit and
retain members varies widely across time and location. We do not yet have well-
developed theories for addressing this ebb and flow over time, nor do we have much in
the way of empirical evidence.
We should care a great deal about rebel defection because it bears directly on the
conduct and outcome of civil wars.47 Rebel inability to retain recruits has led to
disastrous manpower shortages. For example, General Robert E. Lee reported that a
high desertion rate was what forced him to retreat from Maryland (Martin 1932, 235),
and desertion may have doomed the entire Confederate war effort overall (Weitz 2005).
Moreover, inducing rebel desertion through political bargains could make peaceful
outcomes more likely by fracturing the rebel movement. Indeed, research suggests that
in the context of self-determination movements, internal divisions are more likely to
generate peaceful war ending concessions from the government (Cunningham 2011). 47 There is also growing interest in the effect of desertion and military cohesion on the outcome of
international conflicts. The participatory effects of democracy are seen as one of the major sources of
Western military power (Biddle and Long 2004). Similarly, it is seen as one of the major weaknesses of
corrupt and autocratic government. Both Jason Lyall and Allan C. Stam have major ongoing projects on
the role of military cohesion and desertion in world politics.

85
Further, the risk of defection hinders command and control. A government officer
complained that he could not discipline his troops for human rights abuses for fear that
they would defect to the Khmer Rouge (Pokempner et al. 1995, 47).
In irregular civil wars where cover and concealment are key to survival,
defections leak critical intelligence information to government forces. Interrogations of
captured rebel fighters and intelligence provided by defectors provided crucial
targeting information in the Malayan Emergency (Comber 2008, 82) and the Vietnam
War (Moyar 2007, 86-107). In 1951, rebel leaders during the Malayan Emergency
expressed concern about the increase in government reward offers (Ramakrishna 2002,
341), and the Viet Cong repeatedly attacked government defection centers and
personnel (Koch 1973, 57). The defection of even a few members can be devastating to
organizations that rely on secrecy for survival, like insurgent groups, terrorist
organizations, and criminal gangs (Berman 2009). Captured members of the Irish
Republican Army provided the best source of operational intelligence during The
Troubles in Northern Ireland (Jeffery 1987). The defection of mob underboss Salvatore
“Sammy the Bull” Gravano led to testimony that took down the Gambino crime family
(Davis 1994).
This study investigates patterns of defection during one of the largest and
longest wartime defection program ever carried out, the Chieu Hoi program of the
Vietnam War. A recent review notes that despite the direct relevance of the American
86
experience in Vietnam with Chieu Hoi to present conflicts, “there is still no
comprehensive research on this program” (Tovy 2012, 142). The Vietnam case is
interesting for a number of reasons. First, unlike many conflicts, there was a standing
amnesty offer implemented early in the war. Observers have noted that in other
conflicts such as Iraq, the incumbent has suffered from a lack of a broad amnesty offer
that could have provided badly needed human source intelligence (Pirnie and
O’Connell 2008). Second, for much of the war the rebel group’s agricultural resource
base made them dependent on broad popular support for recruitment and resources
(Weinstein 2007).48 Third, the government of South Vietnam had the financial and
bureaucratic resources to implement a national amnesty program with offices in each
province. Finally, rates of defection varied wildly across location and time. Figure 3.1
presents that variation in the monthly rate of defection across the 44 provinces of South
Vietnam.
48 It is estimated that 80 to 90 percent of rebel finances were obtained from rice taxes (McChristian 1994,
167).
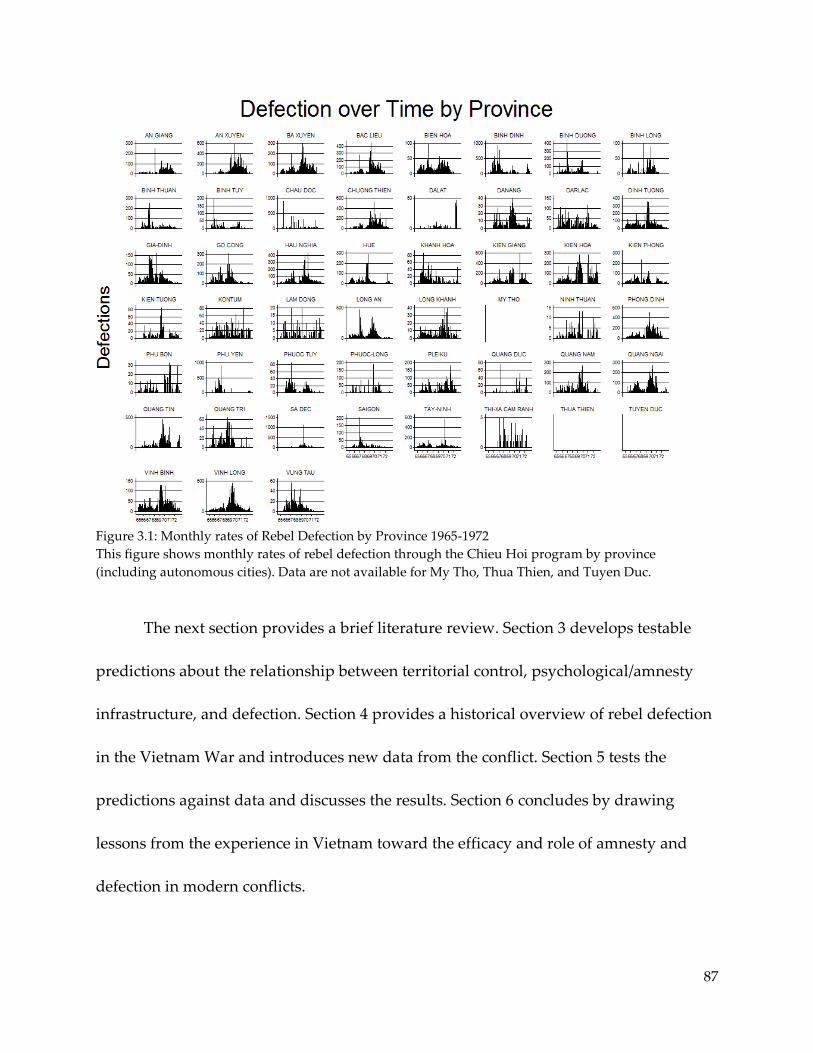
87
Figure 3.1: Monthly rates of Rebel Defection by Province 1965-1972
This figure shows monthly rates of rebel defection through the Chieu Hoi program by province
(including autonomous cities). Data are not available for My Tho, Thua Thien, and Tuyen Duc.
The next section provides a brief literature review. Section 3 develops testable
predictions about the relationship between territorial control, psychological/amnesty
infrastructure, and defection. Section 4 provides a historical overview of rebel defection
in the Vietnam War and introduces new data from the conflict. Section 5 tests the
predictions against data and discusses the results. Section 6 concludes by drawing
lessons from the experience in Vietnam toward the efficacy and role of amnesty and
defection in modern conflicts.

88
3.2 Literature
There are three interrelated strands of literature related to rebel defection—
individual motivation, outside options in the legal labor market, and organizational
design. 49 This section briefly reviews these three strands and highlights several stylized
facts about defection in civil war which should inform theoretical expectations about
patterns of defection over time.
3.2.1 Individual Motivation
A number of studies emphasize the role of ideas and grievances amongst
members of the rebel organization and the communities from which they recruit. Early
sociological research dating back to World War II emphasized the bond between
individuals in the same unit as the primary reason for continued participation
(McPherson 1997, 86; Stouffer et al. 1949, 109). Government brutality and violence
generates collective anger and grievance which provides individual moral rewards to
participating (Wood 2003), and rebel indiscriminate violence similarly provides
incentives to join the government (Kalyvas 2008).50 In Algeria, for example, the
increased use of violence by the FLN in civilian areas reportedly caused, at least in part,
large numbers of civilians to defect to the government’s side, particularly ethnic
Muslims (Hamoumou 1993, 157). A survey of American volunteers in the Spanish Civil
49 The wider literature on violent organizations, rebellion, and civil war is massive (Lichbach 1995,
Blattman and Miguel 2010). 50 The Revolutionary Armed Forces of Colombia (FARC), for example, does not pay its members
(Gutiérrez Sanín 2008, 14).
89
War found ideology to be an important correlate of fear in battle (Dollard 1943, 555).
Records of desertion from the American Civil War suggest that soldiers recruited from
pro-war communities were less likely to desert (Costa and Kahn 2008). Others
emphasize how strong leadership provides an important and compelling justification
for continued participation (Hanson 1999).
However, a growing number of surveys of captured, defecting, and retired rebels
suggests that changes in ideology or grievances do not explain the decision to join or
leave rebel groups (Scaff 1955, 116-129; de Posada 2009; Arjona and S. N Kalyvas;
Borrego, Ballén, and Percipiano 2002; Pye 1981; Guichaoa 2007; Obeyesekere 1974;
Carrier 1966; Berman 1974).51 Modal rebel responses report personal ambitions and
concern for personal or familial safety as their proximate cause for either joining or
leaving an organization. Joiners report a desire to acquire a level of income or position
not available to them in the private sector or that they hope to spare themselves or their
family retribution for refusing to join. Defectors and deserters sometimes indicate
disillusionment with the rebel organization itself, but rarely do they report changes in
their fundamental beliefs about the cause or the government. Those who leave do so
because of the hardships of military life, a falling out with their organization, and/or
incentives provided by the government.
51 For a compilation of post conflict surveys see “Post-Conflict and Ex-Combatant
Surveys,“ http://www.columbia.edu/~mh2245/XCSURVEYS/
90
Exposure to extreme violence and personal setbacks are argued to impose
important psychological costs and to cause individuals to reevaluate the expected
utility of continued participation. For example, in World War I, soldiers rebelled when
casualty figures became too high (Keegan 1976, 276). Desertion was higher in Union
units of the American Civil War that had suffered the greater casualties (Costa and
Kahn 2008). Additionally, protection from violence can be a primary motivation for
joining an organization in the first place (Goodwin 2001; Kalyvas and Kocher 2007).
Similarly, in cases like the Nepalese Civil War, where rebel groups had to resort to
coerced recruitment during periods of combat but otherwise could rely on ideological
appeals, the risks of military combat influenced the propensity to join (Eck 2010).
3.2.2 Outside Options
Determining what type of life might be waiting for defecting rebels in the legal
labor market is central to the question of why rebels might leave or stay with an
organization. Those that have couched rebellion in terms of a collective action problem
(Olson 1965), point to the importance of short and long term material incentives (Popkin
1979; Collier and Hoeffler 1998; Weinstein 2007) and the many available strategies for
delivering selective rewards and punishments (Lichbach 1995). The literature on
disarmament, demobilization, and reintegration (DDR) following the end of a conflict
(Colletta, Kostner, and Wiederhofer 1996; Humphreys and J Weinstein 2005; Muggah

91
2009) focuses largely on the availability of jobs in the private market and on providing
vocational training to soldiers in order to ease the transition to a new career.
The importance of short term economic conditions on participation during war
has been studied indirectly with participation serving as an intervening variable for
aggregate levels of violence. In Columbia, a decline in coffee prices depressed wages
and was associated with an increase in violence in coffee growing regions (Dube and
Vargas 2008). Higher spending on aid projects through the Commander's Emergency
Response Program in Iraq is associated with lower levels of subsequent violence
(Berman et al. 2011), and the effect is greater for more labor intensive projects (Lyengar
et al. 2011). There is conflicting evidence on the relationship between unemployment
and violence, with higher levels of unemployment related to lower levels of violence in
Afghanistan, Iraq, and the Philippines (Berman et al. 2011), but higher levels of violence
in Indonesia (Barron et al. 2004) and Nepal (Do and Lyer 2007).
Evidence on the relationship between economic conditions and recruitment has
come primarily from field surveys. A survey in Burundi finds a positive correlation
between civilian reporting of rebel recruitment in the past year and reporting of
negative crop conditions (Nillesen and Verwimp 2009). A survey in Sierra Leone finds
that poverty predicts joining fighting groups, but poor civilians were equally likely to
join either rebel or government forces (Humphreys and Weinstein 2008). Field work in
Uganda, Mozambique, and Peru suggests that the type of civilians who join rebel
92
groups suggest that conflicts with concentrated lootable resources attract more
opportunistic joiners with weaker ties to the local community (Weinstein 2007).
3.2.3 Organizational Design
Arguably, every problem faced by rebel groups entails an organizational
tradeoff.52 Decentralization and insurgent tactics are themselves an organizational
innovation which trades the ability to mass force for increased concealment and safety
from the government’s forces (Buhaug et al. 2009).53 Importantly for theories of
defection, the size of a violent organization is limited by the kinds of resources which
can be mustered. Mafias, for example, raise resources by inventing a market for
protection in individual communities (Gambetta 1996). Rebel groups, on the other
hand, sometimes raise revenues through lootable resources such as primary
commodities (Collier 2006). As a country grows in wealth, the size of the prize grows
but so does the difficulty in capturing that prize from a stronger more capable
government (Sánchez-Cuenca and Luis de la Calle 2009). Because rebel groups acquire
resources through looting and the government acquires resources through regular
52 In contrast, many of the interesting dynamic models of civil war assume that the organizations are
unitary actors (Fortna 2008; Walter 2011; Glassmyer and Sambanis 2008; Walter 1997). 53 A larger, centralized, conventional rebel force is preferable when safe havens are available, but is
suicide when there is no place to escape larger concentrated government forces (Sinno 2008).
93
taxation, the cost of fighting against the government tends to grow faster than the
potential spoils from war as the economy improves (Fearon 2008).54
Defection should also vary with the types of people who are recruited, which
vary depending on the available resources. When resources are concentrated, rebel
groups tend to attract opportunistic joiners looking for short term material benefits
(Weinstein 2007). Diffuse resources, such as agricultural commodities spread across a
large rural population, require a recruitment strategy of long-term career rebels
typically with stronger ties to the population. For smaller organizations, such as
terrorist groups, resource requirements are less of a problem than the risk of defectors
providing key intelligence to the government. For such organizations, religious or
ideological appeals that require severe hardships serve to screen out opportunistic
joiners that might be easily bribed (Berman and Laitin 2008).
There are still a number of cases, however, in which both large rebel groups and
governments have substantial resources (or at least the backing of a wealthy patron). It
is unlikely that rebel groups are simply outspending governments in terms of salary
and material rewards.55 How, then, do large rebel organizations persist even when
governments have sufficient resources to bribe their members? One possible answer is
54 The growth in the Iraqi economy, for example, greatly increased the operating costs of foreign
insurgents. The result was greater predation on civilians, alienating many of them (Berck and Lipow
2010). 55 In the American Civil War, Confederate Major General Patrick R. Cleburne found that his soldiers were
actually more likely to defect after having been paid than in periods with late and missing pay (Sears
1998).
94
that rebel groups maintain cohesion through the threat of selective punishment
strategies. The penalty for defection is often elevated to death in the course of a conflict.
Punishment strategies, however, are incredibly hard to implement in an ongoing
war. To understand why this is the case, consider the recent principal-agent approach to
rebel recruitment and command. Effective control requires both the ability to detect
deviations from desired behavior and the ability to sanction deviations. Conditions in
civil war rarely provide either opportunity (Gates 2002). Empirically, punishment is
ineffective. British executions for desertion in World War I were often commuted. They
had no deterrent effect when there were randomly carried out, and actually led to an
increase in desertion when the victim was falsely accused (Chen and Horton 2011). The
Viet Cong threatened execution of defectors, but in practice there were too many
defectors to do more than to try to selectively and arbitrarily punish some for egregious
defection (surrendering a weapon or providing intelligence) and momentary lapses in
heart (Carrier 1968).
Instead of punishment schemes, rebel groups are most likely to deter defection
through the physical separation of the individual and his family from government
control. Defectors are almost always from the local area, and rarely do soldiers defect
when fighting overseas. In his study of the Russian Civil War, Landis concludes that “it
was pointless to expect results when the principal areas targeted by the amnesty were
effectively outside government control” (2008, 107). Stathis Kalyvas (2008) examines
95
willingness for civilians to join pro-government militias and finds that government
units in the Greek Civil War were better able to recruit civilians for the local militia in
areas where they had greater territorial control and where there had been greater levels
of rebel indiscriminate violence. Holding and recruiting from areas that are primarily
supporters of the rebel group provides further benefits for the organization in the form
of unit homogeneity. Desertion rates from the American Civil War suggest that unit
homogeneity was actually more important than either unit casualty rates or proxy
measures of ideological commitment (Costa and Kahn 2008, 98-112)
Another possible answer is that amnesty offers are difficult for governments to
carry out in practice.56 On the one hand, there is evidence to support claims that
amnesty offers are effective. The British enjoyed much success with amnesty program in
the Malayan Emergency (Ramakrishna 2002) and the Dhofar Rebellion (Mockaitis 1995,
90). In the Soviet experience in Afghanistan, tribal allegiance often shifted toward the
best offer (Lynch 2010). The U.S. EDCOR defector program in the Huk rebellion
provided important intelligence toward the end of the war (Scaff 1955, McCormick et al.
2007, 340), and the Chieu Hoi program accepted over 200,000 defectors in the Vietnam
War. On the other hand, it is difficult to know whether the amnesty programs and their
financial and political concessions led to military success or whether they simply
56 Amnesty is derived from a Greek term amnestia which means forgetfulness or oblivion. It is “an act of
the legal sovereign conceding, from grace, a voluntary extinction from memory of certain crimes
committed against the state” (Seligman 1937, 36).
96
exploited existing success. Anecdotally, many of these programs picked up only after
major military progress on the battlefield. In other cases, amnesty programs have
floundered. In Afghanistan, there are at least eight formal and informal paths for
Taliban fighters and tribal leaders to reconcile with the government, but relatively few
have chosen to do so (Semple 2009).
Amnesty offers might actually incentivize rebellion.57 First, amnesties directly
lower the cost of joining in the first place. Civilians who might not have otherwise
joined will now do so because they can always defect. Second, civilians might actually
join in order to defect and claim the material rewards, education, and employment
offered by the government. Third, because militarily strong governments do not need to
offer amnesty, the offer might inadvertently embolden the rebel group by signaling
weakness or desperation. The same mechanisms partly explain why governments are
hesitant to negotiate with insurgent groups at all (Babat 2005).58
57 Both the empirical and theoretical literatures on tax amnesties suggest pessimism. First, tax amnesties
have at most only a limited effect on compliance. Second, the effect of amnesties on compliance cut in
both directions, potentially driving compliance up or down in both the short and long run. 58 These concerns often lead to weak amnesties that exclude senior leadership or condition on the
individual having never committed a serious offense. On August 7, 2004, the Iraqi interim Prime Minister
Iyad Allawi made the first amnesty of the Iraq war. It excluded anyone who had committed murder
(Napoleoni 2005, 163). A second attempt at a more comprehensive amnesty in 2006 was brought down by
Shi'ites who had suffered attacks by Sunnis and by American politicians opposed to pardoning anyone
who had killed American soldiers (Cordesman et al. 2008, 320). The Malayan Emergency also began with
a weak offer in 1949 to the rebel Malayan Communist Party (MCP) that excluded anyone with "blood on
their hands" (Ramakrishna 1999, 246).
97
3.2.4 Major Takeaways
In sum, existing research on rebel participation suggest several stylized facts
about the decision to defect. First, the security conditions and opportunities for
advancement play a larger role than changes in ideology or grievances. Those rebels
that are initially more ideologically committed, however, may be less likely to defect
overall. Second, exposure to violence may have countervailing effects. It may increase
the risk of defection by accumulating psychological costs and reducing the future
expected utility of participating. However, it may also reduce the risk of defection by
sinking costs and generating grievances. Third, the relationship between defection and
outside economic options is ambiguous; poverty can drive civilians into either the
hands of the rebels or the government. Fourth, problems of monitoring and punishment
mean that rebel groups are more likely to maintain cohesion through physical
separation provided by territorial control rather than selective punishment schemes.
Fifth, because positive inducements suffer from moral hazard problems, governments
have greater latitude in manipulating defection by varying the level of negative
sanctions.
98
3.3 Theory and Empirical Predictions
3.3.1 Shifts in Territorial Control
Under the territorial control thesis, defection varies with the government’s ability
to directly gain access to the communities from which the rebels were recruited. Shifts
in territorial control could influence defection through several mechanisms. First,
maintaining command and control through punishment and reward schemes is difficult
in wartime conditions. Rebel groups may prevent defection primarily by limiting
opportunities to defect, which they do by maintaining control over territory. Second,
civilians often join rebel groups to maintain security and so switch sides to whomever
better provides protection of their home area. Komer, reflecting on the amnesty
program in Malaya, argued that, above a certain level of reward money, defectors cared
most about which side was best able to protect them from violence by the other side
(1972, 74). Third, family ties serve both as collateral that can be threated over defection
and as a sociological motivation for participation. If the family changes hands, the
individual may switch in order to stay with them. Fourth, physical access reduces the
transaction costs of defecting by collocating defector offices with the defectors.
However, the relationship between territorial control and defection is not
obvious. Areas already under government control should have relatively few rebels,
and thus fewer defections. A related literature on violence toward civilians suggests
that most of the realignment in collaboration should occur during the shift in territorial
99
control rather than before or after (Metelitis 2010; Ziemke 2008; Eck and Hultman 2007).
Local defections should then increase in times of shifts in relative control toward the
government and away from the rebel group. I cast these predictions as Hypothesis 1A
and 1B.
H1A: Local levels of defection will be higher in times of government expansion of territorial
control into previously rebel held areas.
H1B: Local levels of defection will be lower for areas with strong government control, all else
being equal.
3.3.2 Propaganda, Chieu Hoi Centers, and Political Persuasion
Given the focus on security and control, what is the role of the infrastructure of
persuasion such as local amnesty offices, propaganda, and political cadre? The existing
literature suggests that changes in ideology are a relatively rare trigger for defection.
However, there is a wide range of alternative mechanisms related to what are termed
“psychological” operations. In his thorough study of the evolution of the Malayan and
British amnesty program, Ramakrishna (1999) points to the content of the offer, the
credibility of the offer, and the military context as the three key factors in rate of
defection. In many cases, psychological operations provide real information on the state
100
of the war and events on the ground. Rebel fighters may then use this information,
weighted for likely bias, to update their beliefs about the likelihood of victory
(Battaglini 2002). The diversion of resources to the infrastructure around an amnesty
program is a sunk cost which could signal the credibility of an amnesty offer to a
potential defector (Schelling 1960; Fearon 1997). The institutions themselves may
increase defection simply by lowering the transaction cost of defecting. The number of
defections should increase as the political and propaganda infrastructure rolls out into
formerly rebel areas, a prediction I frame as Hypothesis 2A.
H2A: Local levels of defection will be higher in times of government expansion of
propaganda/defection infrastructure
Alternatively, critics suggest that governments in civil conflicts are generally
incapable of executing an amnesty program. Institutions like Chieu Hoi offices falsified
defections by recruiting civilians in order to pad their numbers. Many of the Taliban
defections in Afghanistan, for example, are attributed to the personnel in provincial
reconciliation offices recruiting friends and family to pose as defecting rebels (Semple
2009). There are observable implications that delineate the world in which amnesty
infrastructure cause real defections and the world in which they merely reflect the
extension of corrupt government bureaucracy to a new area. As suggested above,
101
defections should increase in times of expansion of infrastructure to new areas as the
local rebel population switches sides. As the rebel population declines, defections
should also decline and Chieu Hoi offices should effectively “put themselves out of
business.” However, if even after controlling for territorial control, defection rates
remained constant or continued to increase then that would be strong evidence that
offices produced “defections” regardless of changes in the underlying distribution of
rebels in the population. I frame this test as Hypothesis 2B.
H2B: Local levels of defection will be lower for areas with more sustained propaganda/defection
infrastructure, all else being equal.
A final concern is that amnesty infrastructure does not have any direct causal
impact. Instead, it might proxy for increased government control over an area in
general. In order to operate, amnesty personnel need a degree of safety. The decision to
allocate bureaucratic resources to an area is often a sign of consolidation, unrelated to
the preferences of the rebel population. This observation suggests that a placebo test
should be undertaken to differentiate the effect of amnesty related infrastructure from
other infrastructure tied to territorial control and consolidation but not directly to
defection. I cast this test as Hypothesis 3.
102
H3: After controlling for changes in territorial control, other types of village or hamlet
infrastructure will have either no effect or a smaller effect on defections compared to
propaganda/defection infrastructure.
3.4 The Vietnam War, the Chieu Hoi Program, and Data
3.4.1 Background on the Program
The period between partition in 1955 and the start of open revolution in 1958-9
was one of violent political consolidation by the Ngo Dinh Diem government (Race
1972). Upwards of 12,000 individuals were killed and another 40,000 were arrested
based on ties to the Viet Minh, membership in opposition parties or criminal groups,
and actual or suspected membership in the communist party (Kolko 1994, 89). Political
accommodation was not national policy.
From 1959 onwards, rebel activity escalated to the point where the government’s
position became threatened. Individual provinces began experimenting with returnee
programs (Swift 1999, 15). Modeled after the EDCOR program in the Philippines and
the British amnesty program in Malaya, rebel deserters were offered food, shelter,
clothing, and a position in some of the early strategic hamlets.59 In January 1963, the
59 In 1962, outside advisors such as Sir Robert Thompson from the British Advisory Mission and Rufus
Phillips from the U.S. Rural Affairs Office lobbied members of the executive for an amnesty program
(Koch 1973, 20).
103
Chieu Hoi, or "Open Arms", program rolled out nationally.60 Over time, government
forces established Chieu Hoi centers in every province and even in some individual
villages. Conditions varied across Chieu Hoi centers, but the modal defector experience
included: (1) an initial intelligence gathering interview; (2) processing; (3) a 60-day stay
at the center with indoctrination and training courses; (4) provision of a small stipend;
(5) and resettlement in a strategic hamlet or their home village. Importantly, defectors
were exempt from government draft for only 6 months and could secure a position
closer to home by volunteering immediately for a local militia.61 Organizational control
over and support for the program fluctuated over time, but the program continued until
the fall of South Vietnam in 1975.
3.4.2 The Rebel Group
The organizations that the Government of South Vietnam and its allies faced in
the early 1960s had been in development since 1930 with the formal founding of the
Communist Party of Vietnam, or the Party. In Mao Tse-tung’s strategy of guerrilla
warfare, as adapted by the Party, political and military strategy is directly linked at
multiple levels (dau tranh). Rebellion is developed in stages beginning with an emphasis
on political recruitment and party building, a transition to open irregular warfare, and
60 The programs original full name was “Phong-Trao Chieu-Tap Khang-Chien Lam Duong” or “The
Movement to Regroup Misled Members of the Resistance” (Swift 1999). It was later shortened to “Chieu
Hoi” or “call to return.” Those that defected through the program are said to have “rallied.” 61 The options available included the Regional Forces, Provincial Forces, Armed Propaganda Teams, Kit
Carson Scouts, and later Provincial Reconnaissance Units. Otherwise, they could join the Army of
Vietnam (RVN).
104
finally a consolidation period and takeover of urban areas. By 1960, the Party had
cycled between political development and open warfare no less than three times: the
failed Nghe-Tinh revolt in 1930-31 against the French, the resistance against the
Japanese occupation loosely allied with French administration in 1940-1945 followed by
all out warfare against the French from 1946-1954, and then again in South Vietnam
from 1959.
Vietnamese civilians were astute at avoiding commitment to just one side.
However, a number of events made nonalignment more difficult. The first was the
government’s use of repression to eliminate political opposition. Between 1956 and
1959, government crackdowns created an environment of terror and allowed for abuse
and corruption at very low levels of government. In May 1959, the proclamation of Law
10/59 broadened crimes of treason to include not just affiliation with communism or
past ties to the Viet Minh but any and all political opposition (Elliott 2003, 198; Race
1972, 183). Arrests and assassinations were often arbitrary among the civilian
population, reducing the difference between remaining neutral and actually joining the
rebel group (Kalyvas and Kocher 2007).
The Viet Cong Liberation Army (Quan Doi Giai Phong) consisted of both
conventional and irregular forces. The lowest levels of irregular forces were self-defense
forces (tu ve) consisting of persons not fit for guerrilla forces yet able to train recruits,
construct booby traps, and collect intelligence. Guerrilla forces were organized both at
105
the hamlet level (du kich ap) – in anywhere between 3-man and full 12-man squads -
and at the village level (du kich xa) - one or more platoons of about 36 to 48 men (Blood
2005, 62-63, Adams 1995, 55). Long An District Advisor Robert Black referred the
guerrilla forces at this level as the “goons who collected taxes, spread terror or sabotage,
and served as bodyguards” (Black 2003, 176). The lowest level conventional force was
the regional/territorial forces (dai doi doc lop) or Viet Cong (VC) Local Force (LF),
which was subordinate to a provincial or district party committee and normally
operated only within a province or district (MACV Order of Battle Reference Manual
1967, 2). Local forces were organized into companies of 3 or 4 platoons, and were
normally based in a safe haven in the district from which they could launch attacks. LF
were tasked with launching raids into incumbent areas for both propaganda and
assassination. In addition to the district level forces, each Vietcong Province
Headquarters typically had one or two battalions of 300 to 700 men each (Blood
2005,63). Even larger, the main forces (Quan Doi Chu Luc) were organized into larger
regiments and divisions at the regional level. The largest forces, and the ones that took
most responsibility for the fighting after 1968, were provided by People's Army of
Vietnam (PAVN) which were also referred to as the North Vietnamese Army (NVA).
3.4.3 Who Defected and Why?
We know a great deal about those rebels that defected, at least from the 1965-
1968 period, thanks to a number of interview studies carried out by the Rand
106
Corporation (Davison 1972).62 The interviews include both thousands of captured rebel
fighters that did not choose to leave their units and twenty thousand defectors that
opted to formally defect through the government program (Goure 1968; Kellen et al.
1969). More directly and equally impressive is the work done by Rand researcher
Joseph Carrier and his team. They translated and coded tens of thousands of defector
entrance interview cards (Carrier 1966). The interviews are analyzed in a number of
technical reports. These reports highlight patterns and cross-reference oral evidence
with captured documents, interrogation reports, and intelligence coming in from the
field (Gurtov and Kellen 1969; Benoit 1970; Chandler 1981).
In total, over 200,000 individuals officially defected through the government
program. Some portion of those counted were not actual rebels but rather ordinary
civilians.63 North Vietnamese troops rarely defected, even as they took on a greater
share of combat operations towards the end of the war. Defectors were less likely to be
full party members than Viet Cong that were captured in battle (Berman 1974, 93).
Coercive recruiting was actually more prominent in Viet Cong controlled areas than in
contested or government areas (Berman 1974, 69), and conscripts were particularly
likely to defect (Koch 1973, 6). Desertion was much more common than defection, with
62 For recent reviews of this literature see Tovy (2010) 63 Advisors estimated that of the first 16,000 ralliers, probably 50-60% were genuine rebels (Koch 1973,
22).
107
RAND and CIA analysts estimating about seven deserters for every defector (Adams
1994, 46, 63).
3.4.4 The Data
This paper uses two kinds of data. The first set of data tracks rates of defection as
measured at the province-month level through the Chieu Hoi reports. Defection reports
were then aggregated at the province level and then forwarded to Saigon. The second
set consists of responses from a longitudinal expert survey called the Hamlet Evaluation
System (HES). Responses are used to measure province level government control as
well as the diffusion of Chieu Hoi centers. This paper focuses on the period from 1967
to 1972, starting where data at the hamlet level first began to be collected. The unit of
analysis for this study is the province-month. Civilians lived 44 provinces and five
autonomous cities. The U.S. military further divided the country into four Corps
Tactical Areas.
3.4.5 Dependent Variable - Defection
Defection is measured at the province-month level through archived Chieu Hoi
records.64 The data from Chieu Hoi show 172,326 defections over eight years, which is
about 86% of the 200,000 defections typically attributed to the entire program. Only 400
province-months of 4,380 with data show zero defections, or 9%. The number of
64 “Returnee Statistics, compiled 1967-1973, documenting the period 1963-1973,” no date, Record Group
472, Records of the U.S. Forces in Southeast Asia, 1950-1976, Archives II Reference Section (Military),
Textual Archives Services Division (NWCT2R[M]), National Archives at College Park.
108
defections range from 0 to 1,136 with an average of 39.34 per province-month and a
median of 16. Figure 3.2 shows the broad pattern of defection for the entire country.
This countrywide pattern is evidence against defection being driven
mechanically by the number of rebels under arms or the intensity of combat. Defections
climb every year of American intervention but fall in anticipation of American
withdrawal and bottom out around January 1968 when the Viet Cong launched a
country-wide attack called the Tet Offensive. In no other period was irregular, hamlet-
to-hamlet fighting as intense. Nor were rebel casualties as high as they were in 1968.
However, defection rates climb with the governments counter offensive in the latter half
of 1968 and accelerate even more during the pacification campaign of 1969.

109
Figure 3.2: Monthly Rebel Defections in South Vietnam 1965-1972
This figure shows monthly total defections across all of South Vietnam from January 1965 to
December 1972. The black line shows the 9 month running average.
Defections broken down by individual corps tell a similar story, presented in
Figure 3.3. III and IV Corps were primarily embroiled in insurgent conflict against
locally raised forces. Both exhibit the sharp drop in defections around the Tet Offensive
and then a large spike during the period of government pacification in 1969. The big
conventional unit war fought by II Corps was over before Tet, and the pattern of
defection remains fairly constant afterward. I Corps saw some of the worst of both
types of fighting, but was almost entirely a conventional war fought by North
Vietnamese regular units in the 1971 and 1972 years. The complete drop in defections
reflects both the conventional nature of the fighting and that the burden had been
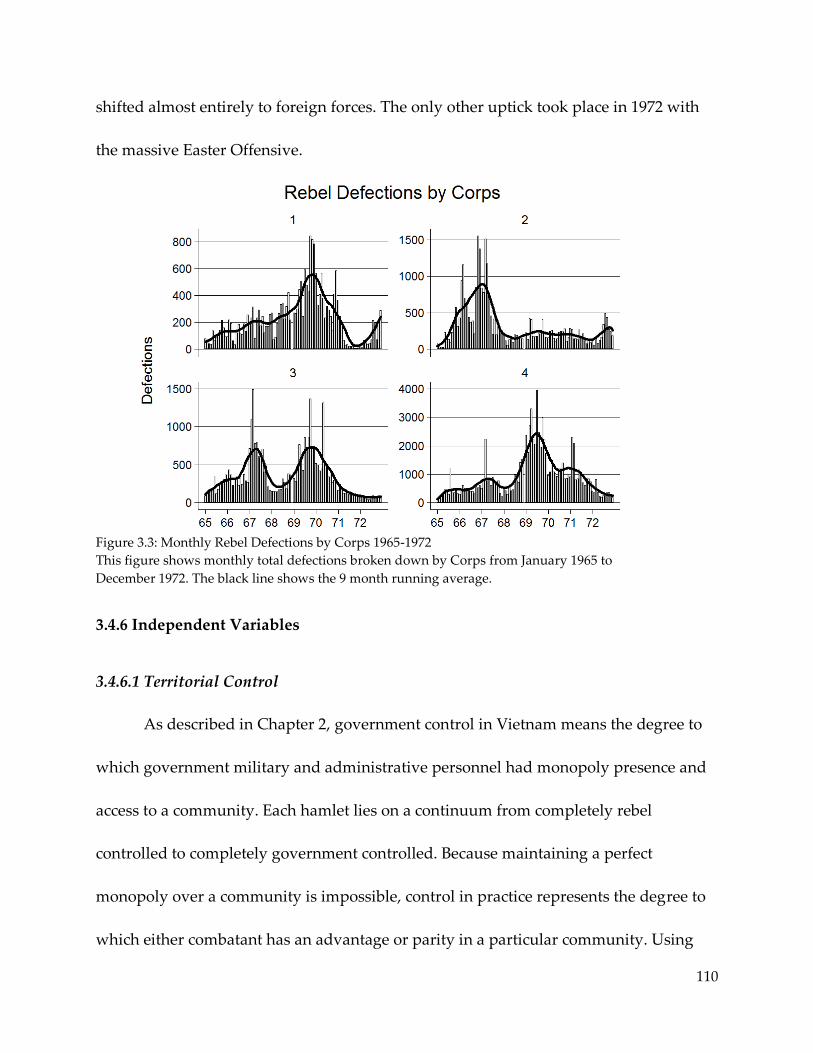
110
shifted almost entirely to foreign forces. The only other uptick took place in 1972 with
the massive Easter Offensive.
Figure 3.3: Monthly Rebel Defections by Corps 1965-1972
This figure shows monthly total defections broken down by Corps from January 1965 to
December 1972. The black line shows the 9 month running average.
3.4.6 Independent Variables
3.4.6.1 Territorial Control
As described in Chapter 2, government control in Vietnam means the degree to
which government military and administrative personnel had monopoly presence and
access to a community. Each hamlet lies on a continuum from completely rebel
controlled to completely government controlled. Because maintaining a perfect
monopoly over a community is impossible, control in practice represents the degree to
which either combatant has an advantage or parity in a particular community. Using
111
the approach described in Chapter 2, I measure government control as an unobserved
latent trait realized through answers on the longitudinal expert survey called the
Hamlet Evaluation System (HES). The Military Assistance Command Vietnam, Civil
Operations and Rural Development Support created HES in 1967 in order to gauge
pacification efforts of hamlets in villages and to help in the allocation of men and
resources. U.S. District Advisers filled it out in collaboration with their South
Vietnamese counterparts. There were three versions of the HES survey. From 1967 to
1969, they used a system called HAMLA which had the responding officer subjectively
rank the hamlet along an E to A scale (worse to better) on several military, political, and
economic dimensions. In 1969 the system was replaced by the HES7 questionnaire and
then again in 1971 by the HES71 questionnaire, both of which moved in the direction of
objective ‘yes’ or ‘no’ questions.
Filled out monthly for over 12,000 hamlets, HES asked high ranking American
military officers and civilians to rate conditions on dozens of specific questions. There
are at a minimum 9 and as many as 31 questions per month that bear directly on
presence of rebel forces, government forces, safety of access to administrators, and
more. I use a partial credit item response model which provides an estimate of difficulty
for each question-response, the discrimination of each question, and a latent estimate of
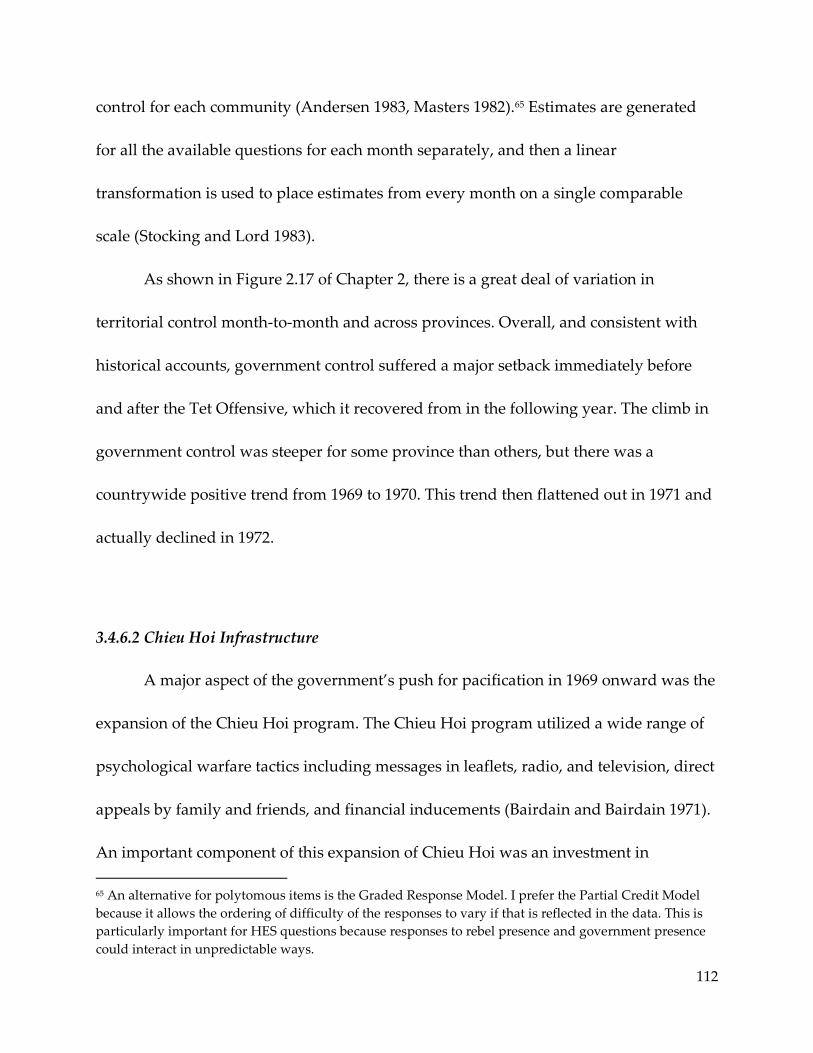
112
control for each community (Andersen 1983, Masters 1982).65 Estimates are generated
for all the available questions for each month separately, and then a linear
transformation is used to place estimates from every month on a single comparable
scale (Stocking and Lord 1983).
As shown in Figure 2.17 of Chapter 2, there is a great deal of variation in
territorial control month-to-month and across provinces. Overall, and consistent with
historical accounts, government control suffered a major setback immediately before
and after the Tet Offensive, which it recovered from in the following year. The climb in
government control was steeper for some province than others, but there was a
countrywide positive trend from 1969 to 1970. This trend then flattened out in 1971 and
actually declined in 1972.
3.4.6.2 Chieu Hoi Infrastructure
A major aspect of the government’s push for pacification in 1969 onward was the
expansion of the Chieu Hoi program. The Chieu Hoi program utilized a wide range of
psychological warfare tactics including messages in leaflets, radio, and television, direct
appeals by family and friends, and financial inducements (Bairdain and Bairdain 1971).
An important component of this expansion of Chieu Hoi was an investment in
65 An alternative for polytomous items is the Graded Response Model. I prefer the Partial Credit Model
because it allows the ordering of difficulty of the responses to vary if that is reflected in the data. This is
particularly important for HES questions because responses to rebel presence and government presence
could interact in unpredictable ways.

113
infrastructure to provide Chieu Hoi cadres not just at the province level but also down
to the village and even individual hamlet levels. Rebels could surrender at these local
offices, and then be transferred to the province office for housing, reeducation, and
stipend (Tho 1977). If weapons or documents were confiscated, it would be done at this
initial level and receipt would be issued for possible reward or compensation at the
main center (Prugh 1975, 127). After transfer to the main center, defectors were
provided food, medical care, and were immediately fingerprinted and photographed to
establish their identity and compromise them with the Viet Cong (Grinter 1967).
HES documents the rise of Chieu Hoi centers across South Vietnam at both the
village and hamlet level from July 1969 to December 1972. In January of 1970, almost
fifty percent of hamlets had no trained Chieu Hoi cadre, and only 37% had cadre living
directly in the community. The picture at the village level was somewhat better with
60% of villages in January 1970 having a Chieu Hoi cadre living directly in the
community. Figures 3.4 and 3.5 show the growth of the Chieu Hoi offices over time. The
rate of expansion varied by region, with III Corps seeing the greatest gains in the first
part of 1970, II Corps remaining stagnate, and I and IV Corps gradually improving
throughout the period before leveling off at the end of 1971 through 1972.
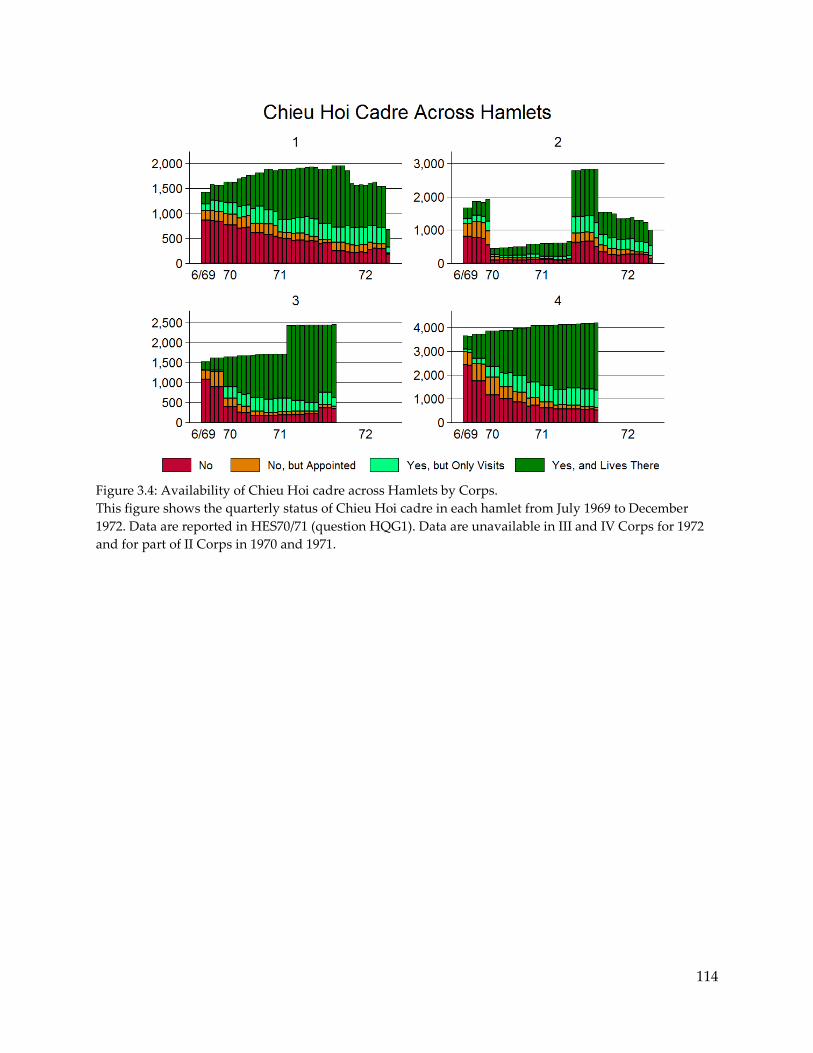
114
Figure 3.4: Availability of Chieu Hoi cadre across Hamlets by Corps.
This figure shows the quarterly status of Chieu Hoi cadre in each hamlet from July 1969 to December
1972. Data are reported in HES70/71 (question HQG1). Data are unavailable in III and IV Corps for 1972
and for part of II Corps in 1970 and 1971.
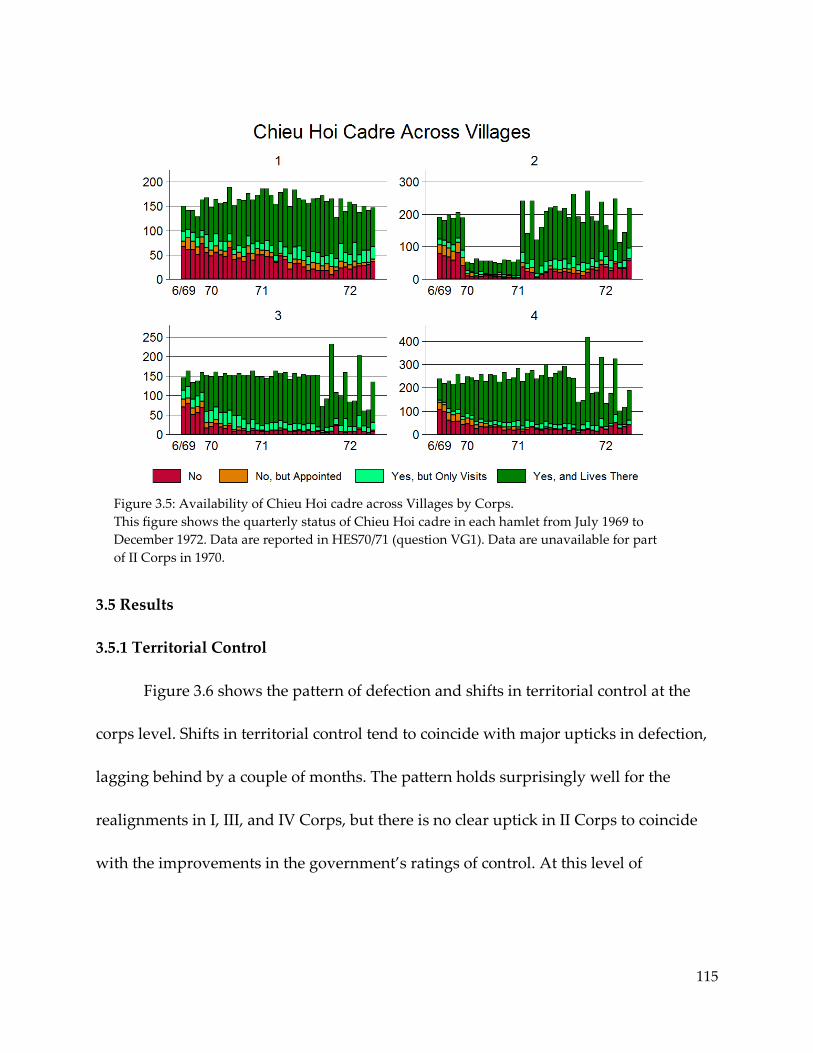
115
Figure 3.5: Availability of Chieu Hoi cadre across Villages by Corps.
This figure shows the quarterly status of Chieu Hoi cadre in each hamlet from July 1969 to
December 1972. Data are reported in HES70/71 (question VG1). Data are unavailable for part
of II Corps in 1970.
3.5 Results
3.5.1 Territorial Control
Figure 3.6 shows the pattern of defection and shifts in territorial control at the
corps level. Shifts in territorial control tend to coincide with major upticks in defection,
lagging behind by a couple of months. The pattern holds surprisingly well for the
realignments in I, III, and IV Corps, but there is no clear uptick in II Corps to coincide
with the improvements in the government’s ratings of control. At this level of
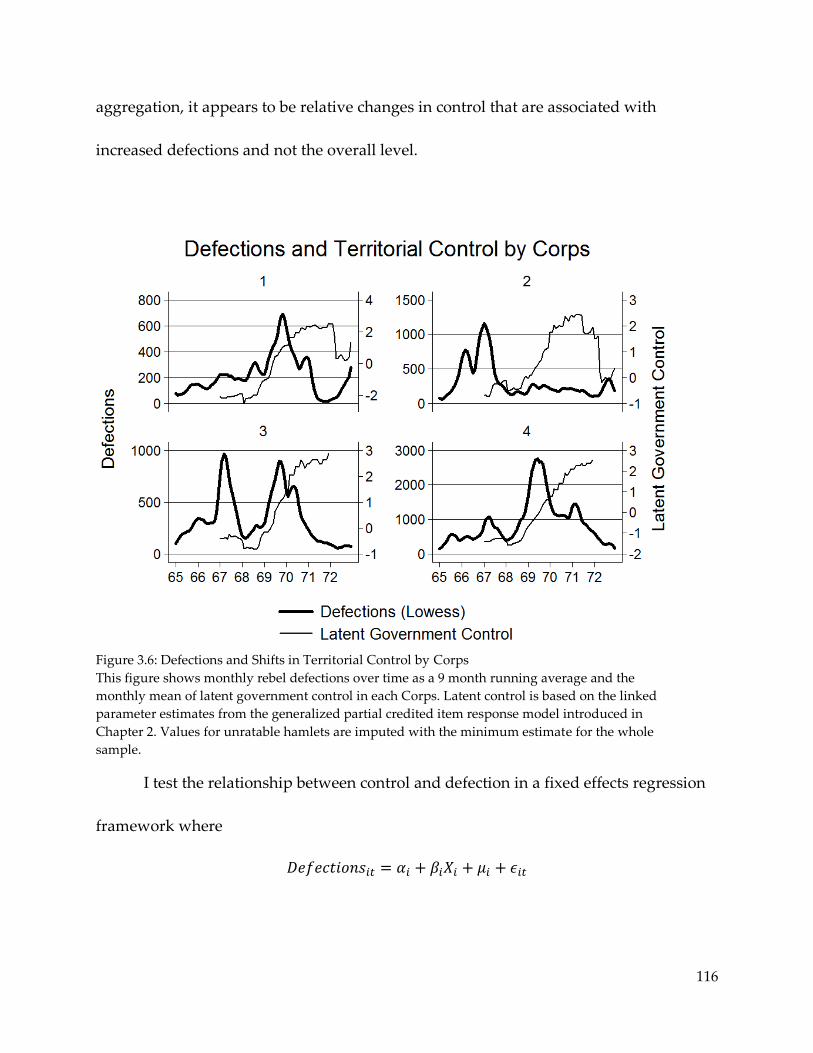
116
aggregation, it appears to be relative changes in control that are associated with
increased defections and not the overall level.
Figure 3.6: Defections and Shifts in Territorial Control by Corps
This figure shows monthly rebel defections over time as a 9 month running average and the
monthly mean of latent government control in each Corps. Latent control is based on the linked
parameter estimates from the generalized partial credited item response model introduced in
Chapter 2. Values for unratable hamlets are imputed with the minimum estimate for the whole
sample.
I test the relationship between control and defection in a fixed effects regression
framework where
117
The unit of observation is the province-month and is a province fixed effect.
Coefficients on the independent variables reflect changes in the within-province level of
defection as a one unit change in the regressor. I estimate robust standard errors
clustered on the province. Models 1 and 2 in Table 1 show that absolute levels of control
do not predict within-province levels of defection. The inclusion of the time and time
squared trends, show that defection varies quadratically with time, as was evident the
plots above. Models 3 and 4 show that shifts in territorial control over time do predict an
increased number of defections, and that this effect is in addition to the general time
trend. Model 5 shows that changes in government control predict defection even when
controlling for the current level of control, though the effect attenuates slightly. The
immediate question to ask is whether the effect is being driven only by the major
pacification campaign in 1969, when both control and defections spike. Model 6 shows
that the relationship still holds even when observations from 1969 are omitted. The next
question is whether the pattern holds for all of South Vietnam. Model 7 is restricted to
just observations from II Corps where the pattern was visually weakest. The coefficients
point in the expected directions, but become insignificant. This is largely due to the
reduced power from a quarter of the sample, and the coefficients on changes in control
become significant again if the time trend is dropped.

118
Table 3.1: Shifts in Territorial Control and Defection
(1) (2) (3) (4) (5) (6) (7)
Gov.
Control
0.592
(2.480)
3.230
(3.068)
2.657
(2.951)
4.945
(2.965)
-5.244
(4.112)
Gov.
Control
20.05**
(6.207)
17.75**
(5.665)
16.15**
(5.289)
10.06*
(3.780)
7.335
(4.815)
Time 5.056* 4.654 4.237 -0.262 -6.039
(2.363) (2.330) (2.232) (2.092) (3.392)
Time^2 -0.0232* -0.0205* -0.0194* -0.000678 0.0246
(0.0100) (0.00967) (0.00948) (0.00879) (0.0140)
Constant 44.62*** -223.4 42.95*** -212.8 -182.1 74.51 385.0
(1.898) (136.4) (0.246) (137.0) (128.8) (121.2) (201.8)
N 2550 2550 2477 2477 2477 2068 678
R2 0.000 0.018 0.010 0.023 0.025 0.016 0.059
Sample Full Full Full Full Full Exclude
1969
Just II
Corps
Unit of Observation Province-Month; Model OLS; Province Fixed Effects, Robust Standard Errors
Clustered on Province. Standard Errors in Parentheses * p < 0.05, ** p < 0.01, *** p < 0.001
In terms of Hypothesis 1A and Hypothesis 1B, this is strong evidence that rebel
fighters defect in periods of government expansion into rebel areas and not in periods
of government consolidation. Allegiance shifts with rapid changes in the local security
condition, not through a process of gradual pacification and winning of the hearts and
minds.
In terms of the theories discussed in section 2, the implication is only partially
decisive. On the one hand, it supports the view that military events, personal security,
and the security of one’s family and community trump justifications for participation
like grievances or ideology. On the other hand, it cannot distinguish between the
119
physical aspects of taking and holding territory and the informational aspects of what
fighters learn about the likelihood of their group winning the overall conflict and of
themselves personally dying in the next engagement. Viet Cong defectors often cited
the inability to hold captured territory after the Tet Offensive as a major reason for
defecting (Connable and Libicki 2010, 23). In either case, the result suggests that
defector programs like the one in Afghanistan are failing in large part because of the
government’s inability to take and hold the sparse rural areas from which rebels are
recruited.
3.5.2 Infrastructure
The next question is whether avenues exist for promoting defection in the
consolidation phase once territory has fallen into the government’s hands. I focus on
one program in particular, the creation of propaganda/defection infrastructure at
increasingly lower levels of political administration. These investments represent
credible commitments to respecting the terms of amnesty for defectors. They also serve
as important tools of persuasion and recruitment at the community level, which mirrors
the innovation of political cadres that were used so effectively by communist forces. I
model within-province shifts in defection in the same fixed effects regression
framework used in the previous section. Models 1 and 4 in Table 2 show that higher
absolute levels of infrastructure at the village and hamlet level, respectively, actually
predict fewer defections over time. Models 2, 5, and 7 show that even though higher
120
levels of infrastructure are associated with fewer defections, the period when offices are
being brought to new communities is associated with an increase in defections. The next
question to ask is whether the development of infrastructure is just a proxy for
improvements in government control in the areas. Models 3, 6, and 8, show that the
relationship still holds even while controlling for government control and shifts in
government control, though as before the relationship attenuates slightly.
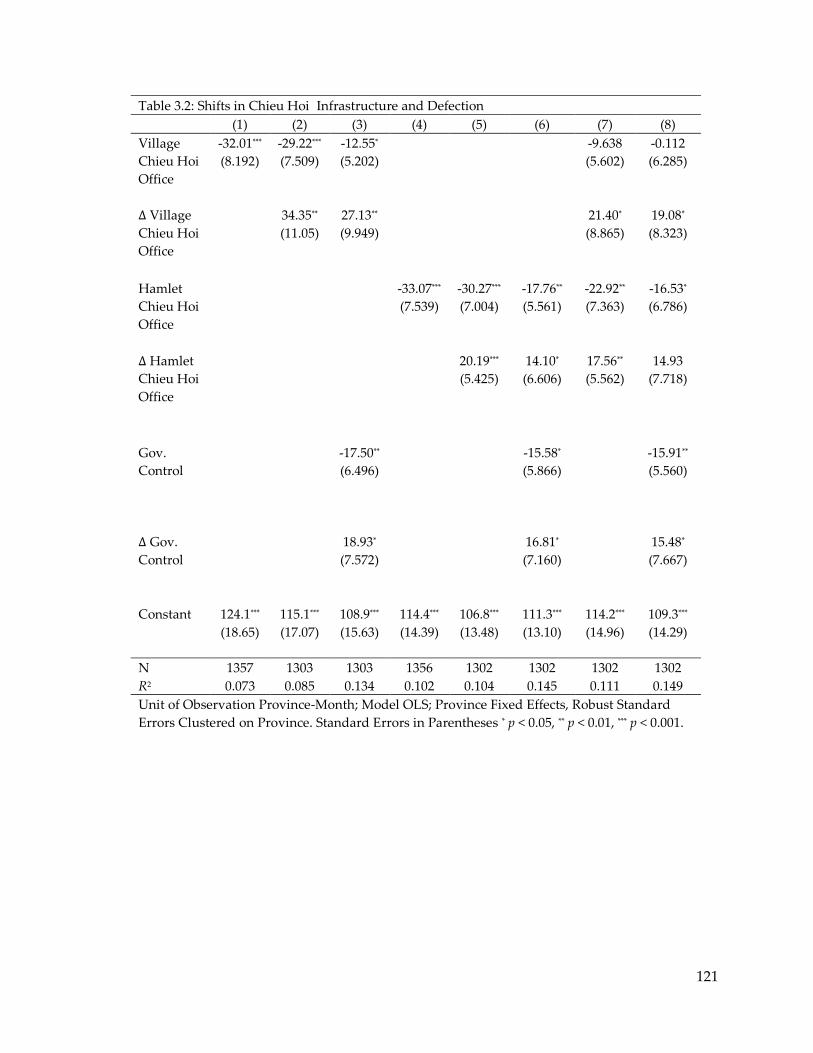
121
Table 3.2: Shifts in Chieu Hoi Infrastructure and Defection
(1) (2) (3) (4) (5) (6) (7) (8)
Village
Chieu Hoi
Office
-32.01***
(8.192)
-29.22***
(7.509)
-12.55*
(5.202)
-9.638
(5.602)
-0.112
(6.285)
Village
Chieu Hoi
Office
34.35**
(11.05)
27.13**
(9.949)
21.40*
(8.865)
19.08*
(8.323)
Hamlet
Chieu Hoi
Office
-33.07***
(7.539)
-30.27***
(7.004)
-17.76**
(5.561)
-22.92**
(7.363)
-16.53*
(6.786)
Hamlet
Chieu Hoi
Office
20.19***
(5.425)
14.10*
(6.606)
17.56**
(5.562)
14.93
(7.718)
Gov.
Control
-17.50**
(6.496)
-15.58*
(5.866)
-15.91**
(5.560)
Gov.
Control
18.93*
(7.572)
16.81*
(7.160)
15.48*
(7.667)
Constant 124.1*** 115.1*** 108.9*** 114.4*** 106.8*** 111.3*** 114.2*** 109.3***
(18.65) (17.07) (15.63) (14.39) (13.48) (13.10) (14.96) (14.29)
N 1357 1303 1303 1356 1302 1302 1302 1302
R2 0.073 0.085 0.134 0.102 0.104 0.145 0.111 0.149
Unit of Observation Province-Month; Model OLS; Province Fixed Effects, Robust Standard
Errors Clustered on Province. Standard Errors in Parentheses * p < 0.05, ** p < 0.01, *** p < 0.001.
122
In terms of Hypothesis 2A and 2B, the result confirms the importance of on the
ground infrastructure for recruiting defectors at the community level. The process is not
cumulative. Defections go up when offices start working in a new place, and then level
out or actually decline. This is consistent with the view that when offices open up for
the first time in a new place, local fighters who were near the cut point for deciding to
defect are pushed over the edge. The result is also important from the perspective of
data quality and concerns about the validity of the Chieu Hoi program overall. Given
the argument that defector programs are highly corrupt, and that bureaucrats either
recruit friends and family or invent defectors out of thin air, the number of defections
should increase, within reason, with the number of bureaucrats regardless of the
underlying distribution of rebels. What we see here is the opposite. Provinces actually
report fewer defectors after rolling out new Chieu Hoi offices than beforehand.
3.5.3 Placebo Test
A final question is whether the propaganda/defection infrastructure is simply a
proxy for some part of government control that is not captured by the aggregation of
over a dozen security related questions. Perhaps the relationship is idiosyncratic and
the infrastructure program just happened to be implemented during a spike prior to a
lull. In order to guard against these two possibilities, I construct a placebo test set up
exactly as before using two measures related to government control but unrelated
directly to defection. The first measure asks about the status of a village office where
123
official business is regularly conducted or where village administrative records are
maintained. This measure captures both the idea of security, being able to have a GVN
office operating normally without threat, and infrastructure, the presence of
government infrastructure down to the village level. The second measure asks about the
presence of a GVN-sponsored maternity clinic in the village or an adjacent village. It
captures the potential public good provision of a Chieu Hoi office. Models 1 and 2 show
that both types of infrastructure show the same pattern as the Chieu Hoi offices and
give cause for concern. Models 3 and 4, however, show that neither relationship
survives the inclusion of measures on territorial control in general. Models 5 and 6
show that the Chieu Hoi offices continue to have a statistically significant relationship
in addition to whatever correlation the presence of the two placebos might have with
defection.
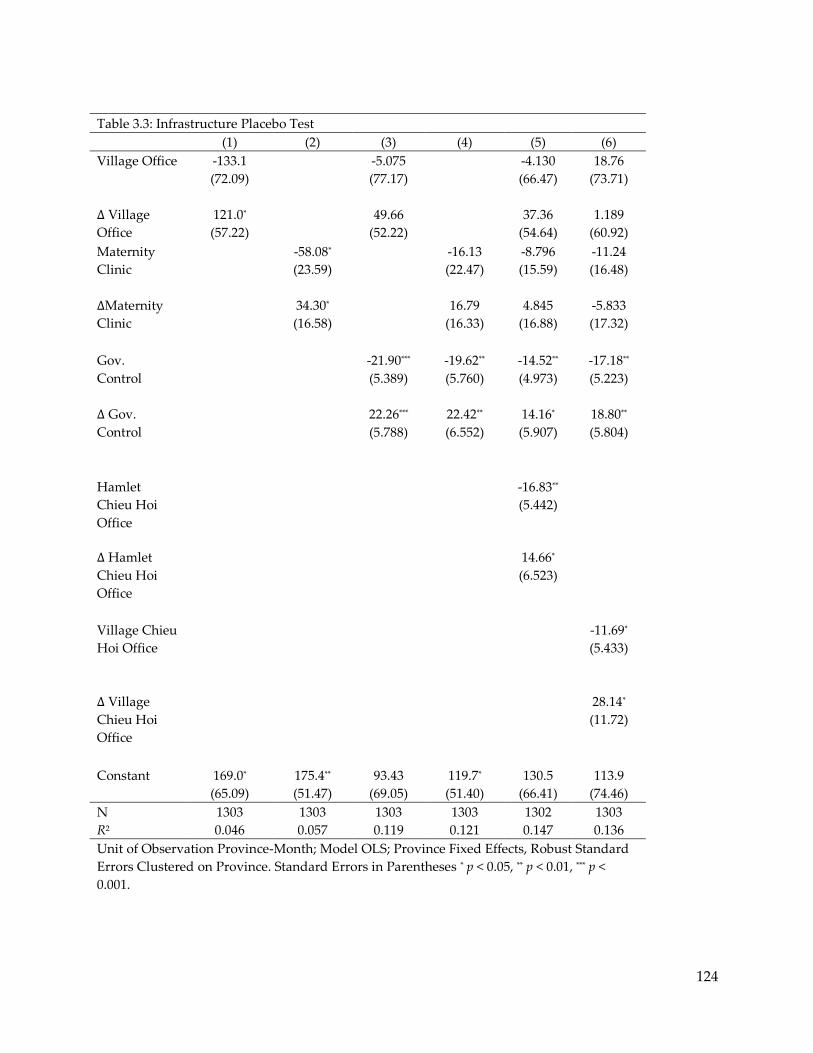
124
Table 3.3: Infrastructure Placebo Test
(1) (2) (3) (4) (5) (6)
Village Office -133.1 -5.075 -4.130 18.76
(72.09) (77.17) (66.47) (73.71)
Village
Office
121.0*
(57.22)
49.66
(52.22)
37.36
(54.64)
1.189
(60.92)
Maternity
Clinic
-58.08*
(23.59)
-16.13
(22.47)
-8.796
(15.59)
-11.24
(16.48)
Maternity
Clinic
34.30*
(16.58)
16.79
(16.33)
4.845
(16.88)
-5.833
(17.32)
Gov.
Control
-21.90***
(5.389)
-19.62**
(5.760)
-14.52**
(4.973)
-17.18**
(5.223)
Gov.
Control
22.26***
(5.788)
22.42**
(6.552)
14.16*
(5.907)
18.80**
(5.804)
Hamlet
Chieu Hoi
Office
-16.83**
(5.442)
Hamlet
Chieu Hoi
Office
14.66*
(6.523)
Village Chieu
Hoi Office
-11.69*
(5.433)
Village
Chieu Hoi
Office
28.14*
(11.72)
Constant 169.0* 175.4** 93.43 119.7* 130.5 113.9
(65.09) (51.47) (69.05) (51.40) (66.41) (74.46)
N 1303 1303 1303 1303 1302 1303
R2 0.046 0.057 0.119 0.121 0.147 0.136
Unit of Observation Province-Month; Model OLS; Province Fixed Effects, Robust Standard
Errors Clustered on Province. Standard Errors in Parentheses * p < 0.05, ** p < 0.01, *** p <
0.001.
125
3.6 Conclusion
This chapter investigates the determinants of rebel defection in an ongoing
conflict. Observable implications were derived from two overarching views of
counterinsurgency. In the first, fighters lay down their arms primarily during periods of
government consolidation. Areas are first secured and segregated from rebel main
forces, and then pacified through the provision of public goods, the extension of time
horizons from repeated interaction, and from persistent protection. The second view is
that the decision to defect is influenced primarily through rapid shifts in government
presence into formally rebel controlled areas. Fighters switch sides as their communities
fall under enemy control, or alternatively when their areas are liberated and the risk of
rebel retaliation disappears.
Evidence on rates of defection in 44 provinces measured monthly over a long
time span supports the government expansion view over the consolidation view. Rebel
defection did not increase in areas under greater government control, and in fact they
actually went down. As the underlying distribution of rebels was eliminated or
dispersed, there were fewer fighters to defect. In contrast, rapid shifts in government
control into a previously rebel controlled area opened up a new set of fighters who until
then may not have even had the opportunity to defect. Amnesty offers and government
offensive operations tap these pockets of potential defectors.
126
The pattern is not limited to military expansion into a new area. The rollout of
the political infrastructure of defection, measured here with the deployment of Chieu
Hoi cadres, also has a clear but temporary effect on local rates of defection. A placebo
test shows that the Chieu Hoi cadres were associated with increased defections in ways
that other proxies for government control do not. There was also good news in terms of
the validity of the defection data. While data were surely manipulated in at least some
cases, there does not appear to have been a countrywide systematic impulse to invent
“defections” to create the appearance of progress. That the pattern of defection mirrors
changes in control also provides additional confidence in the item response model used
to estimate latent government control.
There are at least four ways in which this research could be extended. The first is
to test the above hypothesis at a lower level of aggregation. Using the data that I have
collected on defections through the Phoenix selective violence program, it is possible to
conduct tests at the village-month level. The second is to bring in the role of economic
conditions. Success or failure of the local rice crop has direct effects on the labor market
which are hypothesized to have direct effects on participation in rebellion. The third is
to directly include information about violent events and military clashes. Currently,
theories about rebel participation are often tested using violent events as a proxy for the
underlying rebel labor market. The Vietnam data allow me to test the effect of
exogenous factors on participation directly which then may or may not have
127
downstream effects on levels of violence. Finally, data on defection rates of government
forces over time provide insight to otherwise of the conflict. The symmetry and
asymmetry between rebel and government participation over time can provide
important clues about the degree to which recruitment and participation in civil war is a
zero-sum contest.
128
Chapter 4 Hearts, Minds, or Bodies: The Strategy of Selective
Violence in Civil War
Abstract
Selective government targeting of civilians in civil wars is often simultaneously
described as both effective and incompetent. How can programs that routinely fail to
target the right people still generate concern among rebels and induce some civilian
cooperation? I develop a model of selective violence where informed targeting based on
good intelligence, random targeting based on profiling, and community sharing of
information all emerge endogenously. I show that a credible threat of random targeting
can induce civilians to provide information which then in turn enables the direct
targeting of specific individuals. This mechanism is feasible even in the presence of
rebel retaliation and even when the government has lost the “hearts and minds” of the
people. Using data on nearly 50,000 government targeted attacks recorded by the
Phoenix Program during the latter part of the Vietnam War, I find support for the
model’s predictions about the relationship between violence, information, and military
control.
129
4.1 Introduction
Civil wars are particularly dangerous for civilians because they blend traditional
law enforcement tasks with military operations and outright repression. Arrests,
abductions, and targeted killings make up a substantial share of the human costs of civil
war. Combatants selectively target civilians in order to punish collaboration, fill quotas,
generate leads, and to deter future transgressions (Huntchinson 1972, 384; Price 1977,
56-58; Goodwin 2006; Kalyvas 2006). These acts of selective targeting are ubiquitous
among civil conflicts, including in recent years, with thousands killed and arrested by
International Security Assistance Force “capture-or-kill” raids in Afghanistan (van
Linschoten and Kuehn 2011), U.S. CIA drone strikes over northwest Pakistan (Johnston
and Sarbahi 2012), targeted killings by the Israeli Defense Forces (Jaeger and Paserman
2009), and torture and execution of officials and civilians in the drug violence in Mexico
(Molzahn et al. 2012). One puzzling aspect of this violence is that while it is often
characterized as corrupt, incompetent, and dangerous, it is simultaneously described as
useful for coercing the population and eliminating the enemy.
A major review of selective violence across civil wars concludes that combatants
regularly target innocent victims but often still achieve positive results (Kalyvas 2006,
183-192). The Irish Republican Army regularly targeted civilians that were not actually
cooperating with police (Hart 1999, 300). In the Greek Civil War many killings were
erroneously targeted but had a chilling effect of the civilian population (Kalyvas 2006,
130
190). Immediately following the signing of the Geneva Accords in 1954, the government
of South Vietnam (GVN) launched a campaign of repression which was an
“unparalleled disaster” for the Communist Party of Vietnam (Race 1972, 30-43), but in
later periods was described as leading to popular resentment and backlash against the
GVN (Race 1972, 71-2; Elliott 2003, 944). U.S. drone strikes over Pakistan rarely correctly
target high-level leaders (Bergen and Tiedemann 2011), but appear to still lead to
decline in militant attacks (Johnston and Sarbahi 2012). Similarly, cross-national
comparisons of targeted assassinations of rebel leadership note many failed attempts
but find substantial benefits of selective violence on a number of counterinsurgency
metrics (Johnston 2012).
What explains the mixed record of selective violence programs? Why are these
programs described as both effective but largely incompetent and corrupt in their
operation? How are intelligence-driven attacks and profiling based attacks related to
one another? Are they substitute or complementary strategies? To address these
questions, I develop a model of how government selective violence programs operate in
potentially hostile communities. I generate testable predictions on the relationship
between informed and random violence, civilian information sharing, and military
control over territory. I proceed to test these hypotheses using new data on government
selective violence from the Phoenix Program (Chiến dịch Phụng Hoàng), a major
selective targeting program developed during the latter part of the Vietnam War.
131
The model and data build on our existing understanding of selective violence in
three important ways. First, they disaggregate a phenomenon that is typically lumped
together as selective violence into two types: informed targeting and random targeting
(profiling). When based on good intelligence about specific individuals, selective
violence approximates legitimate police investigations (Jeffery 1987; Moyar 2007;
Comber 2008). However, selective violence based on no prior or poor intelligence comes
closer to police profiling where individuals are targeted because of where they live or
because they fit a certain schema (Goodman 1973, Valentine 1990; Gelman et al. 2007;
Natapoff 2009). Profiling uses arbitrary methods such as police checkpoints, cordon and
search operations, and random arrests, but falls short of the indiscriminate violence of
aerial bombing, free fire zones, and terrorism (Hultman 2007; Valentino 2000; Lyall
2009; Kocher et al. 2011). I show how falsely aggregating informed and random
targeting can lead to incorrect inferences about the relationship between intelligence
and the use of selective violence in civil war.
Second, building on recent research, I consider the incentives civilians have for
sharing intelligence with government officials that enables governments to use
informed targeting instead of random targeting (Akerlof and Yellen 1994; Kalyvas 2006;
Bhavnani et al. 2011). This work rightly argues that civilians will be deterred from
sharing information if they fear retaliation by the other side. It does not, however, ask
what the costs might be for not sharing that information. Governments do not simply
132
stop targeting in the absence of intelligence. They switch to more random and arbitrary
tactics that generate their own costs. In effect, the community must decide how much
information to withhold or share in order to limit the total amount of pain inflicted by
both sides of a civil conflict. This insight illustrates how the ability of rebels to hide
amongst the civilian population creates not just a problem for the government but a
problem for civilians as well.
Combined with the fact that informed violence makes random violence less
useful by taking targets out of circulation, this simple tradeoff has some surprising
implications. The threat of random violence by the government can induce civilians to
provide tips even in rebel areas, where there should be little or no cooperation due to
fear of rebel retaliation for sharing information with the government. The government
has a credible threat to inflict random violence on a community in a rebel area because
each random targeting has a relatively high probability of catching a genuine rebel or
rebel supporter. The government can also credibly assure communities that it will not
inflict random violence if given information because each rebel caught as a result of
good intelligence removes a target from the pool of suspects, thereby reducing the
utility of future random violence. However, this does not prevent communities in rebel
areas from keeping some information from the government. By selecting a minimal
amount of information to share, the communities can limit the net amount of violence
they suffer from government random targeting and rebel retaliation for cooperating

133
with officials. These tradeoffs can occur entirely out of self-preservation. Concern for
human life or the alienation of civilians are not necessary for the government to limit its
total amount of violence. Nor is winning the “hearts and minds” of the population a
necessary conditions for obtaining civilian collaboration.
The third contribution of this article is to test the model against new data on
selective violence during the Vietnam War. I analyze government and rebel targeting
for a set of over 3,000 villages tracked quarterly between July 1969 and December 1972. I
provide original data from the Phoenix Program, which detail whether attacks were
based on informed targeting or random/unintended targeting. I further introduce
previously unavailable data from the Hamlet Evaluation System survey, which records
how much intelligence on local rebels was available in each village over time.
I find that contrary to existing theories (Kalyvas 2006, Kalyvas and Kocher 2009),
government selective violence in Vietnam disproportionately targeted contested and
partially rebel-controlled areas where civilians should have been afraid to share
information due to the risk of rebel retaliation. Using data on intelligence available in
each village from the Hamlet Evaluation System, I find that the government reported
knowledge of rebel identities even in contested and rebel-controlled villages. The model
accounts for this finding, predicting that random violence should generate high returns
in rebel areas and that this violence can translate into at least some begrudging
cooperation from civilians. The data support these predictions: (1) Intelligence was
134
available to government forces even in contested and rebel areas; (2) Both informed and
random violence disproportionately target rebel areas; and (3) Communities that
provided more information suffered more informed violence but less random violence.
The next section provides a brief literature review. Section 3 develops the model
and makes empirically testable predictions. Section 4 provides a historical overview of
selective violence against civilians in the Vietnam War and introduces new data from
the conflict. Section 5 tests the predictions against data and discusses the results. Section
6 concludes by drawing lessons from the experience in Vietnam toward the efficacy and
role of selective violence in modern conflicts.
4.2 Literature
Violence toward civilians varies along at least two dimensions: specificity (Price
1977, 56-58; Goodwin 2006; Kalyvas 2006) and severity (Shultz 1978). Shelling, aerial
bombardment, forced relocation, market bombings, mass killing, and other acts
typically described as indiscriminate violence are high-severity acts that lie “beyond the
norms of violent political agitation that are accepted by a given society” (Thorton 1964,
76; Huntchinson 1972, 384).66 In contrast, police checkpoints, cordon and search
operations, targeted assassinations, reeducation, mass arrests, targeted home
66 Severe and specific violence is used as collective punishment and is intended to alter a community’s
behavior through acts such as terrorism, decimation, harassment, and interdiction fire, etc. (Wood 2010,
Steele 2009, 422–23; Pape 2003; Hultman 2007; Lyall 2009). Acts that are both severe and directed against
populations as opposed to communities involve mass killings, genocide, and depopulation (Valentino et
al. 2004; Downes 2007, 2008, 2011; Verwimp 2005; Kocher et al. 2011).
135
demolitions, kill and capture raids, drone strikes, and other acts typically described as
selective violence generally fall within the norms of violence typical of law enforcement
or special operations.
Severity describes the means but not the motivations that direct violence toward
a particular individual or community. 67 Informed violence sets out to punish an
individual or community based on their specific behavior. Executing a warrant for a
specific individual who has been denounced as a rebel agent is an example of informed
violence. Another example is burning a community’s crops as collective punishment for
refusing to pay taxes. In contrast, random violence targets an individual or community
not because of their behavior but because of their guilt by association.
Actionable intelligence serves as a hard constraint on the amount of informed
violence that combatants can direct toward civilians. In civil wars fought by irregular
forces, the key pieces of intelligence pertain to the identities and location of enemy
forces and their supporters. Because rebels hide in or near populated areas, civilians are
the most abundant agents for monitoring and providing this kind of intelligence. 68
Counterinsurgency theory and doctrine place significant emphasis on providing public
goods and security to civilians in order to elicit information against rebels (Trinquier
67 I thank David Laitin for this framing of the definitional issues of political violence. 68 There are alternative sources, including denunciations by prisoners or defectors, material evidence such
as captured documents, confessions by the accused, and paid tips by informants. Principal agent
problems make purchasing information particularly difficult in a wartime environment, and according to
at least one Phoenix program advisor the flood of paid tips were only sources that were “uniformly
inaccurate” (Finlayson 2007).
136
1964; Army 2007). An increasing number of studies use civilian willingness to provide
information as an intervening variable in explaining changes in levels of violence
resulting from aid provision (Berman et al. 2010), civilian casualties (Condra et al. 2010),
access to communications technology (Shapiro and Nils B. Weidmann 2011), and co-
ethnic military sweeps (Lyall 2010). Others have pointed out that police efforts against
criminal gangs similarly depend on civilian willingness to provide information against
their neighbors (Akerlof and Yellen 1994).
Civilians both volunteer information and provide it under duress. Recent studies
point to political motivations (Balcells 2011) and narrow personal gains (Kalyvas 2006)
as possible motivations for civilian denunciations. Alternatively, the threat of collective
punishment provides a powerful incentive for self-policing and cooperation by
communities (Hechter 1988, 153; Lichbach 1998, 215). The degree to which information
can be solicited or coerced with violence or repression depends on the ability to couple
threats with credible assurances to withhold that violence given a change in behavior
(Schelling 1960; Machain et al. 2011).
Coercive approaches to eliciting information have a long track record in civil
conflict. Galula describes this strategy, as employed in the Algerian War: “...every
villager normally knows who the cell members are...This suggests that the indirect
approach could be easier and more certain than the direct one. The procedure would be:
1) To arrest simultaneously a large group of minor suspects. 2) On the basis of their
137
disclosures, to arrest the cell members” (1964, 91). A more sophisticated version of this
procedure, the French Dispositif de Protection Urbaine (DPU) relied on a formal
network of Muslims who were responsible for providing names in their given sector,
and those named suspects were arrested at night and tortured in order to provide more
names for another round of arrests in the morning (Porch 2003, 383). Likewise, in
Vietnam, police or military forces would capture and interrogate a large number of
relatively unimportant Viet Cong “sympathizers,” from whom they would acquire
information about high-level rebel members (Valentine 1990, 287). In Colombia,
communities developed institutions specifically designed to limit random violence by
investigating suspects for the combatants (Kaplan 2009).
Why would civilians succumb to the pressure of these tactics? More precisely,
why do rebels not raise the costs of retaliation to the point necessary to fully deter
cooperation? First, the government may have a preponderance of power such that it can
threaten greater violence than the rebels can promise in retaliation.69 Second, the
quantity of information required to appease the government might elicit sufficiently
few rebel retaliations that the community suffers a net decrease in violence. Third,
retaliation is difficult. In Vietnam, Census Grievance Teams and later Rural
Development Teams met one-on-one with every resident of a village in order to
anonymously collect intelligence on Viet Cong forces (Moyar 2007, 74). This innovation
69 Random violence might also create a space for informed violence by decreasing rebel access to civilians
(Lyall 2009, Toft and Zhukov 2012).
138
was so effective that it became one of the primary means of clandestinely contacting
paid agents. Finally, rebels may have few local allies to facilitate retaliation for
denunciations against them — or the government may have sufficient local allies to
suppress counterdenunciation.70
The constraints posed by the government’s ability to project threats of random
violence and its ability to protect informants from rebel retaliation, suggest that the
state’s capacity and territorial control play a strong role in the distribution of violence
(Fearon and Laitin 2003). In a study of the Spanish Civil War, Balcells (2010, 2011)
examines a conventional civil war in which territorial control was close to absolute,
making the risks of retaliation for providing tips low. She finds that civilians were
willing to use denunciations to eliminate local political opponents. Kalyvas and Kocher
(2009) examine rebel violence in the Vietnam War when the Viet Cong were relatively
weak and find that they had limited ability to project targeted assassinations and
kidnappings outside of their areas of control.71 Kalyvas (2006) examines violence in the
Greek Civil War where the actors were near parity and found symmetrical distributions
of selective violence, each limited to their own area. Bhavnani et al. (2011) examine a
case of an asymmetrical distribution of power in favor of the government and find that
70 The III Corps Provincial Reconnaissance Unit (PRU) Director Col. Viet Lang noted that his forces
operated effectively in contested and rebel areas using family connections and avoided intelligence
coming in from the central government (Moyar 2007, 82). 71 I confirm this finding below with new data on Viet Cong violence provided over a longer period.
139
Israeli selective violence was used much more frequently than random violence in areas
controlled by the opposition.
In sum, the strategic interaction surrounding selective violence is characterized
by: (1) A government interested in finding and eliminating rebels from a larger
population; (2) An improvement in targeting capability with the aid of local intelligence
over random targeting without information; (3) A threat to communities from both
rebel retaliation for providing information and government random violence; (4) The
need for both credible threats and promises from the government in order to elicit
information; (5) A strong influence of control in shaping the cost of targeting and the
potential for retaliation; and (6) A strong influence of control in shaping the returns to
random violence for the government. The next section develops a model based on these
characteristics and uses it to determine the relationship between informed targeting,
random targeting, and the provision of information by communities.
4.3 A Model of Civilian Targeting in Civil War
Consider an interaction between two actors, a community and a government
The community contains a subset of the population of size , normalized to 1, who
could reasonably be suspected of being rebels.72 The subset of the population, , are
72 The pool could either be the entire population of the community or a particular demographic such as
military age males.
140
actually rebels or rebel collaborators, and . is common knowledge, though
only the community knows which suspects are actually rebels.73
The community makes one decision: the number of rebel identities to reveal to
the government, where . The government makes two decisions: the amount of
informed targeting to commit against the community, , and the amount of random
targeting to commit against the community . At the most, , , and
.
In the interaction, the community moves first, selecting a value to reveal to the
government.74 The government moves second, selecting an amount of informed and
random targeting to commit against the community. Finally, outcomes are realized and
payoffs are provided.
Define the expected amount of rebels correctly targeted (arrested or killed) by the
government as ( ), where
( ) (
) (
( )
)
73 The assumption of a known R follows from three observations. First, in practice the government knows
the rebel organizational structure of a typical village and even used it to estimate the number of rebels
based on the number of villages that were out of government control. Second, profiling is a strong
component of civil war where some communities are thought to harbor a greater number than others
based on their proximity to rebel areas, the number of attacks against military targets, etc. Finally, a
system of quotas used in Vietnam in many ways provided the answer of how many rebels there were
which security forces then had to produce. An extension could relax this assumption so that R is an
unknown random variable drawn from a known distribution that varies with rebel control. 74 Informed targeting suggests that information was provided prior to the operation or while forces were
on location.
141
Assume 0. The function ( ) is twice continuously differentiable, strictly
convex, and strictly increasing in . The probability of catching a rebel with
information is (
) where ( ) , and ( ) is both strictly increasing and
twice differentiable. Even with full revelation of information by the community, not all
rebels may be caught because of poor targeting technology or false denunciations.75 The
probability of catching a rebel with random targeting is ( (
)
) where
( ) , ( (
)
) as
(
)
, and ( ) is both strictly increasing and
twice differentiable. Every real rebel caught with informed targeting decreases the
usefulness of random targeting because there is one less rebel available in the suspect
population. Further, make the weak assumption that informed violence has a strictly
higher probability of catching a real rebel than random violence, (
) (
(
)
)
for all , , and . Substantively, this means that information can be relatively unhelpful
to government forces, but it cannot lead them to worse outcomes than if they had just
selected randomly from the population.
There are two key points to the model. Random targeting generates at least some
returns as long as there are some rebels but informed targeting always generates greater
returns. Second, informed and random targeting are substitutes rather than
75 For the U.S. Military in Iraq or Afghanistan the technology of targeting might be very good such that
(
) as , while for the Uganda People’s Defense Force it could be the case that (
) as
.
142
complements. Increasing the amount of informed targeting reduces the number of real
rebels left in the population thereby decreasing the returns on random targeting.76
The expected number of rebels caught under two different information regimes
and a higher are plotted in Figure 4.1. In the solution constructed below, the
government increases informed violence before random violence, and therefore the
effect of increased information is an increase in the number of correctly targeted rebels
(shown on the 45 degree slope and ) and a reduction of the returns of randomly
targeting the remaining suspects (shown in the difference in slopes between and ).
76 One can imagine cases where this would not be true. If the government was very uncertain about rebel
presence in a community, R, then tips might bring undue attention on the community that it might not
have otherwise received. Here, I consider differences in violence between communities where the
government has established clear scores of rebel control and thus where doubt over R is unlikely.
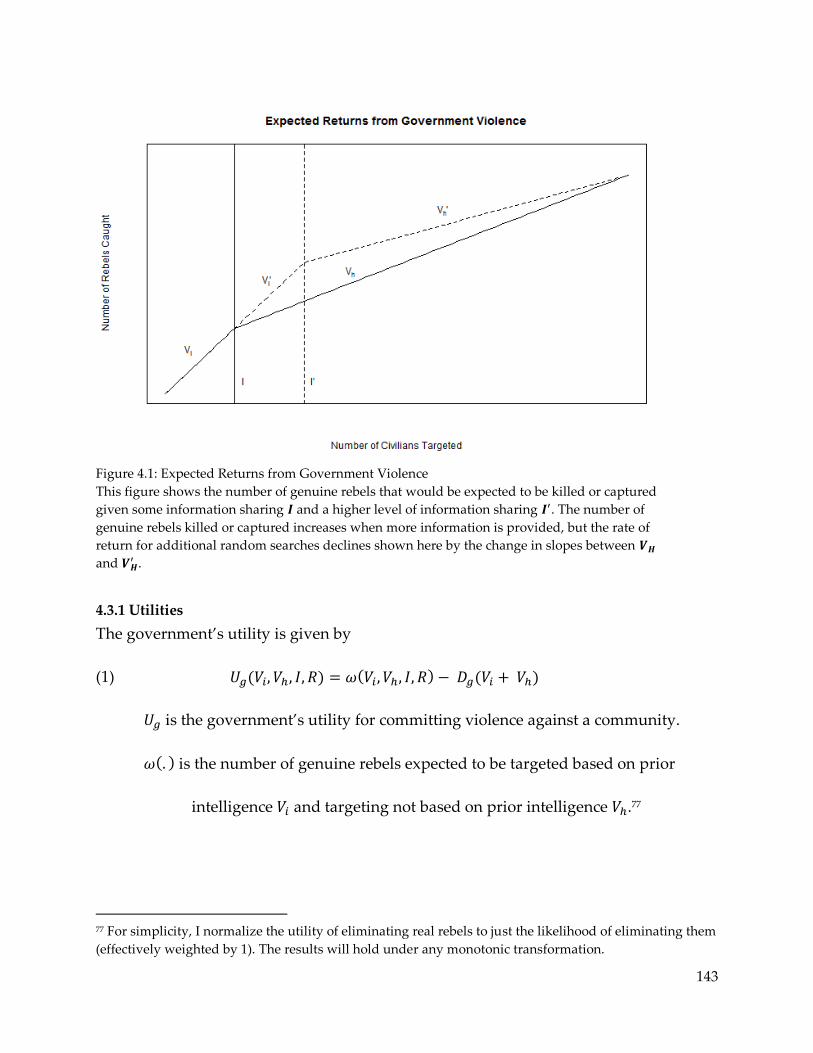
143
Figure 4.1: Expected Returns from Government Violence
This figure shows the number of genuine rebels that would be expected to be killed or captured
given some information sharing and a higher level of information sharing . The number of
genuine rebels killed or captured increases when more information is provided, but the rate of
return for additional random searches declines shown here by the change in slopes between
and .
4.3.1 Utilities
The government’s utility is given by
(1) ( ) ( ) ( )
is the government’s utility for committing violence against a community.
( ) is the number of genuine rebels expected to be targeted based on prior
intelligence and targeting not based on prior intelligence .77
77 For simplicity, I normalize the utility of eliminating real rebels to just the likelihood of eliminating them
(effectively weighted by 1). The results will hold under any monotonic transformation.
144
( ) is the disutility or cost of each additional act of violence. It is assumed that
( ) , that it is strictly convex, and that it is twice differentiable.78 The
cost for both types of violence are assumed to be the same.79
The government gains utility in the first term from the number of genuine rebels it
expects to target and suffers a disutility for each additional act of violence it commits.
The community’s utility is given by
(2) ( )
is the utility of a representative community member resulting from violence
and sharing information with the government.
is a positive or negative constant representing the community’s affinity to
those targeted with names provided to the government (potentially rebels
or innocent persons).80
is the number of suspects targeted based on names provided by the
community.
78 The assumption of escalating cost for each additional civilian targeted is consistent with the manpower
requirements in Vietnam. Small Special Forces units could target specific individuals and medium sized
police or militia forces were required for questioning and detaining a large number of people, while an
entire division could be required for a large cordon and search missions that resulted in the destruction
and relocation of an entire village. Further, legal and detention resources were a major constraint in
Vietnam (Lewy 1980, 288-9). 79 Relaxing this assumption changes Lemma 1 below such that the government prefers informed to
random violence only when the difference in the marginal gains to informed violence are proportional to
the difference in costs of random violence. This is unlikely to hold only when informed violence is not
particularly useful in general, where the technology of informed violence is very poor, or when the
population is almost exclusively made up of rebels. I propose this as a constraint/scope condition below. 80 Downes (2007) finds evidence in the Second Anglo-Boer War that selective violence is insufficient to
induce collaboration when civilian loyalties are inflexible.
145
is the number of suspects targeted randomly without community information.
( ) is a function representing the probability of rebel retaliation for an act of
information sharing.81 It is differentiable and strictly increasing in the
share of rebels in the population
.82
is the amount of information shared with the government and falls between
and .
The community suffers disutility from two sources, government violence and rebel
retaliation, for sharing information. Rebel control in a community is represented in two
places, the share of rebels to the suspect population and the rebel’s technology of
retaliation in that community ( ).
4.3.2 Equilibrium
The solution will be a subgame perfect Nash equilibrium in pure strategies,
solved through backwards induction starting first at the government’s selection of
violence given a level of community-provided information.
The Government’s Best Response
The government selects nonnegative levels of targeting and to
maximize utility,
( ) ( ) ( )
81 Retaliation could come either from rebels upset at losing one of their own, or from a counter-
denunciation by the friends of the innocent victim. 82 To see how the shape might vary, consider varying technologies for monitoring and retaliation.
Anonymizing tips was made possible through mass interviews, anonymous drop points, etc.
146
An interior solution for
equates the marginal benefit of an additional
targeting to the marginal cost of that targeting. A single optima is guaranteed by the
strict convexity of ( ) and ( ). The following lemma that governments will always
prefer to shift indiscriminate targeting to informed targeting when information is
available guarantees that optima is achieved through a unique pair of and
. The
intuition is that informed violence provides greater returns but costs the same as
random violence.
Lemma 1: The government will never choose to allocate resources to indiscriminate targeting,
, when there are still targets available with specific information, . See Appendix A.3 for a
formal proof.
Substituting in the function for the expected number of rebels captured and
taking the derivatives with respect and provide the following first order
conditions,
(
)
( (
)
)
( )
( ) ( )
(
( )
) ( )
and
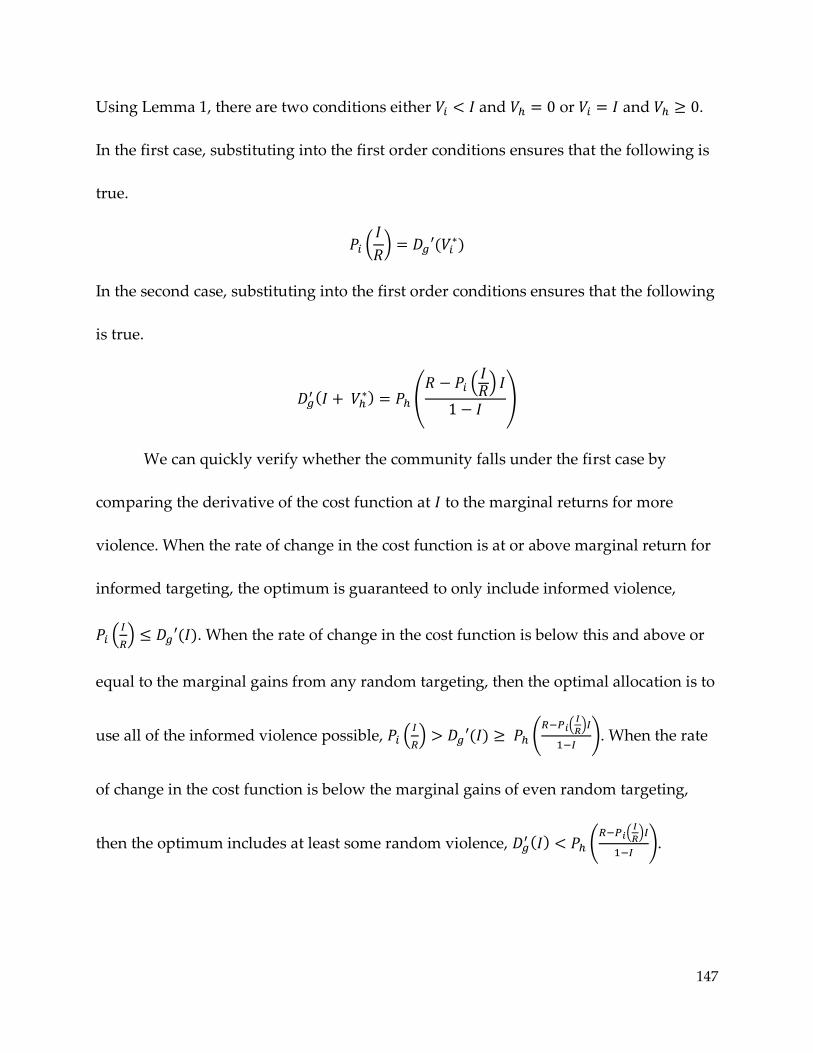
147
Using Lemma 1, there are two conditions either and or and .
In the first case, substituting into the first order conditions ensures that the following is
true.
(
) (
)
In the second case, substituting into the first order conditions ensures that the following
is true.
(
) ( (
)
)
We can quickly verify whether the community falls under the first case by
comparing the derivative of the cost function at to the marginal returns for more
violence. When the rate of change in the cost function is at or above marginal return for
informed targeting, the optimum is guaranteed to only include informed violence,
(
) ( ). When the rate of change in the cost function is below this and above or
equal to the marginal gains from any random targeting, then the optimal allocation is to
use all of the informed violence possible, (
) ( ) (
(
)
). When the rate
of change in the cost function is below the marginal gains of even random targeting,
then the optimum includes at least some random violence, ( ) (
(
)
).
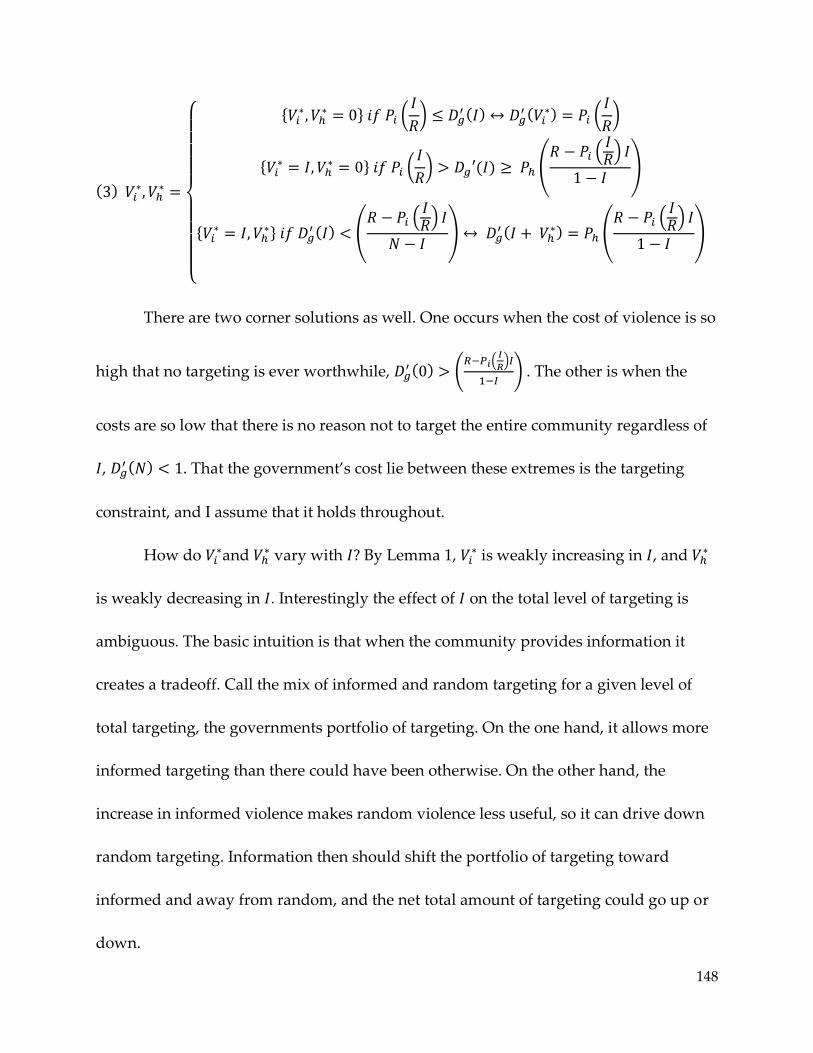
148
( )
{
{
} (
)
( ) (
) (
)
{
} (
) ( ) (
( )
)
{
} ( ) (
( )
)
( ) (
( )
)
There are two corner solutions as well. One occurs when the cost of violence is so
high that no targeting is ever worthwhile, ( ) (
(
)
) . The other is when the
costs are so low that there is no reason not to target the entire community regardless of
, ( ) . That the government’s cost lie between these extremes is the targeting
constraint, and I assume that it holds throughout.
How do and
vary with By Lemma 1, is weakly increasing in , and
is weakly decreasing in . Interestingly the effect of on the total level of targeting is
ambiguous. The basic intuition is that when the community provides information it
creates a tradeoff. Call the mix of informed and random targeting for a given level of
total targeting, the governments portfolio of targeting. On the one hand, it allows more
informed targeting than there could have been otherwise. On the other hand, the
increase in informed violence makes random violence less useful, so it can drive down
random targeting. Information then should shift the portfolio of targeting toward
informed and away from random, and the net total amount of targeting could go up or
down.
149
The Community’s Best Response
Information sharing affects the community’s utility in two ways, through the
amount of violence selected by the government and through the degree of retaliation by
the rebel group. The community selects a nonnegative level of information to share
that maximizes
( ( )) ( )
Given the targeting constraint holds, the first order condition given the government’s
and
is
( )
An interior solution equates the marginal losses from rebel retaliation and affection
toward the denounced to the marginal gains from less government violence,
( )
.
How does the optimal vary with and
? Anticipating the portfolio of
targeting that the government will use given a level of information, the community
selects so as to shape that portfolio to best suit its preferences. Three interesting cases
merit consideration. In the first case, the community suffers no rebel retaliation and has
no additional affinity or hatred of the denounced victims, and ( ) . The
community selects the minimum that makes the government indifferent between
using informed targeting and switching to additional random targeting, ( )
150
( (
)
). Interestingly, the number of denounced victims falls short of the number
of real rebels since the community is providing just enough information to appease the
government. In the second case, the community has affinity toward the victims or faces
positive risk of retaliation by the rebel group, or ( ) . Here, the community is
willing to absorb some government random targeting and provides even less
information. In a third case, the community dislikes the potential victims , and
provides as much information against them as is practicable given rebel retaliation.
There are values of the parameters for which cooperation is never in the
community’s interest. The cost of targeting for the government might be so high that it
would do no random targeting at all in the absence of information, ( ) ( ).
There might be so many rebels that every random targeting guarantees a real rebel,
, so that providing information has no positive effect. For at least some
cooperation then, ( ) ( ) and , which is the targeting constraint
constructed above. The extreme case when both R and the cost of targeting are high is
exactly when we see combatants use technological substitutions like aerial
bombardment and free fire zones, tactics which are typically referred to as
indiscriminate violence.
4.3.3 Comparative Statistics and Hypotheses
When looking at conflict data, how should informed violence, random violence,
and the flow of information from the community,
and , co-vary? How should
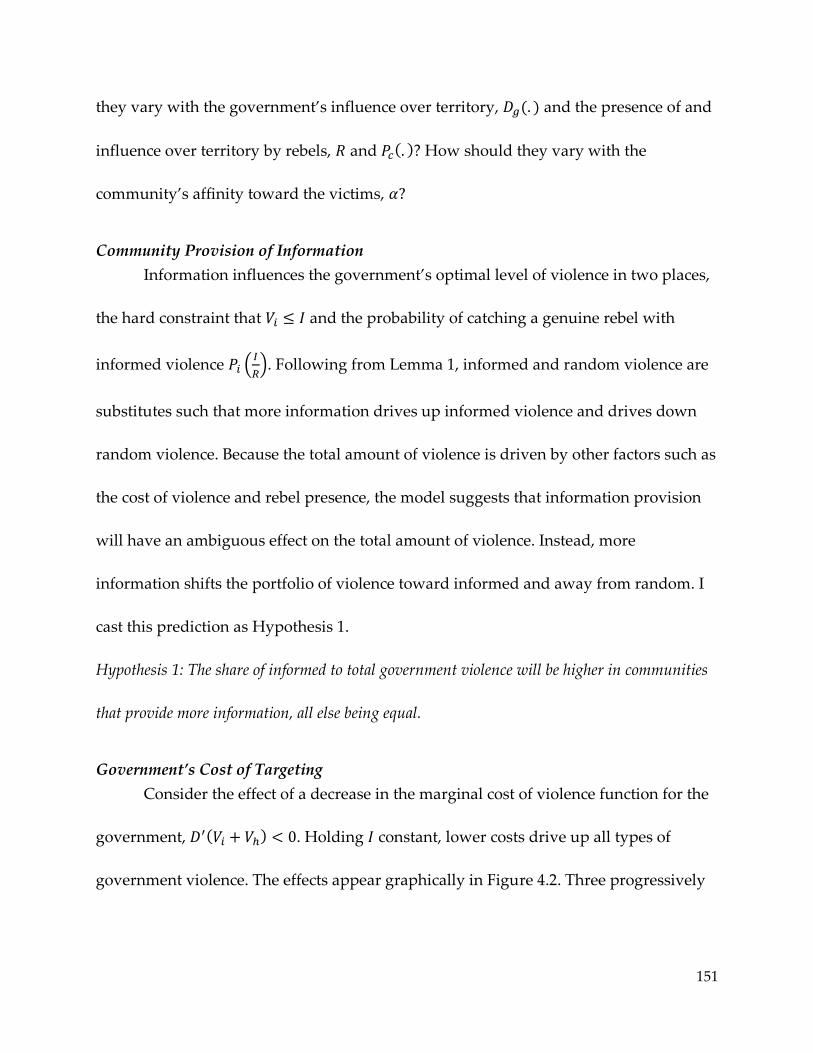
151
they vary with the government’s influence over territory, ( ) and the presence of and
influence over territory by rebels, and ( )? How should they vary with the
community’s affinity toward the victims,
Community Provision of Information
Information influences the government’s optimal level of violence in two places,
the hard constraint that and the probability of catching a genuine rebel with
informed violence (
). Following from Lemma 1, informed and random violence are
substitutes such that more information drives up informed violence and drives down
random violence. Because the total amount of violence is driven by other factors such as
the cost of violence and rebel presence, the model suggests that information provision
will have an ambiguous effect on the total amount of violence. Instead, more
information shifts the portfolio of violence toward informed and away from random. I
cast this prediction as Hypothesis 1.
Hypothesis 1: The share of informed to total government violence will be higher in communities
that provide more information, all else being equal.
Government’s Cost of Targeting
Consider the effect of a decrease in the marginal cost of violence function for the
government, ( ) . Holding constant, lower costs drive up all types of
government violence. The effects appear graphically in Figure 4.2. Three progressively
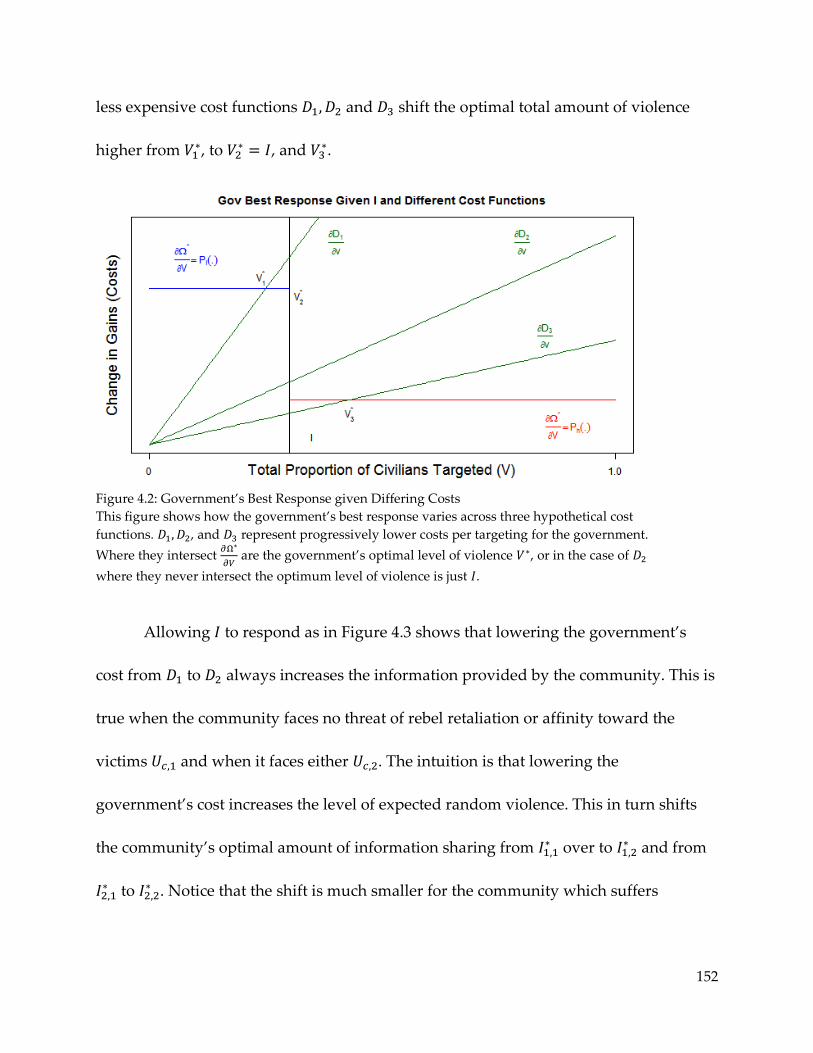
152
less expensive cost functions and shift the optimal total amount of violence
higher from , to
, and .
Figure 4.2: Government’s Best Response given Differing Costs
This figure shows how the government’s best response varies across three hypothetical cost
functions. , and represent progressively lower costs per targeting for the government.
Where they intersect
are the government’s optimal level of violence , or in the case of
where they never intersect the optimum level of violence is just .
Allowing to respond as in Figure 4.3 shows that lowering the government’s
cost from to always increases the information provided by the community. This is
true when the community faces no threat of rebel retaliation or affinity toward the
victims and when it faces either . The intuition is that lowering the
government’s cost increases the level of expected random violence. This in turn shifts
the community’s optimal amount of information sharing from over to
and from
to
. Notice that the shift is much smaller for the community which suffers
153
retaliation and loss from affinity toward victims than it does for the community that
does not. I cast these predictions as Hypothesis 2A and 2B.
Hypothesis 2A: Government informed targeting, random targeting, and total targeting should
be higher in communities with greater government control, all else being equal.
Hypothesis 2B: Provision of information should be higher in communities with greater
government control, all else being equal.
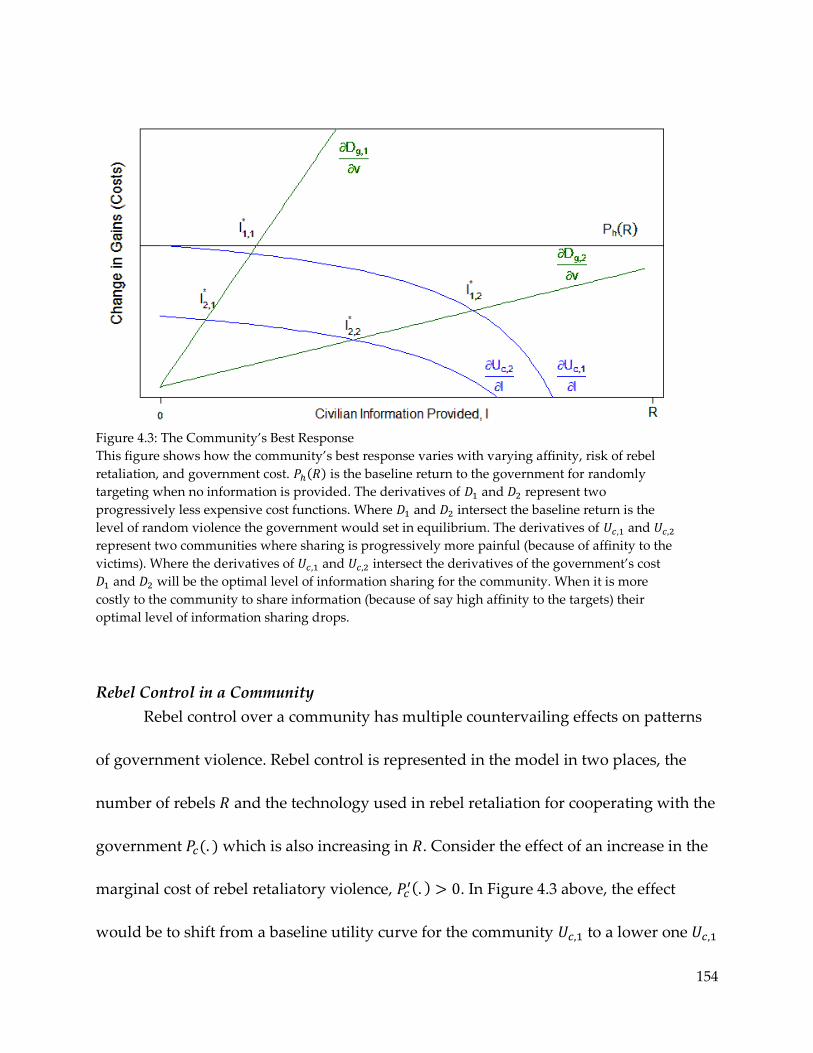
154
Figure 4.3: The Community’s Best Response
This figure shows how the community’s best response varies with varying affinity, risk of rebel
retaliation, and government cost. ( ) is the baseline return to the government for randomly
targeting when no information is provided. The derivatives of and represent two
progressively less expensive cost functions. Where and intersect the baseline return is the
level of random violence the government would set in equilibrium. The derivatives of and
represent two communities where sharing is progressively more painful (because of affinity to the
victims). Where the derivatives of and intersect the derivatives of the government’s cost
and will be the optimal level of information sharing for the community. When it is more
costly to the community to share information (because of say high affinity to the targets) their
optimal level of information sharing drops.
Rebel Control in a Community
Rebel control over a community has multiple countervailing effects on patterns
of government violence. Rebel control is represented in the model in two places, the
number of rebels and the technology used in rebel retaliation for cooperating with the
government ( ) which is also increasing in . Consider the effect of an increase in the
marginal cost of rebel retaliatory violence, ( ) . In Figure 4.3 above, the effect
would be to shift from a baseline utility curve for the community to a lower one

155
where it is less beneficial to provide information. Information provision will decline,
resulting in a shift in the portfolio of violence from informed targeting to random
targeting. Ceteris paribus, the total amount of violence, would also weakly decrease
since some violence that information made affordable is now converted to less
worthwhile random targeting.
However, increasing the number of rebels in the population , also increases the
marginal returns for random violence because every chance encounter has a higher
probability of finding a genuine rebel. Thus random targeting should be increasing with
rebel control. Surprisingly, this should also drive up informed violence because a
community’s incentives for cooperating with the government depend on the credible
threat of random violence. The more rebels per capita, the more credible a threat of
abuse the government can hold over the community’s head when soliciting
information. The net effect then is an increase in both informed and random targeting,
but a shift in portfolio toward informed and away from random. I cast these predictions
as hypothesis 3A and 3B.
Hypothesis 3A: Government informed targeting, random targeting, and total targeting should
be higher in communities with greater rebel control, all else being equal.
156
Hypothesis 3B: Provision of information should be lower in communities with greater rebel
control, all else being equal.
Affinity
Finally, communities have a wide range of motivations to denounce or protect
certain individuals that the model captures as a measure of affinity, . A strong affinity
for the victims drives down the amount of information shared with the
government and a strong dislike drives up the amount of information shared. An
implication is that when comparing communities, there will be a drop in intelligence in
one community and a windfall in another due to affinity even when conditioning on
rebel control and government control. This result suggests that measures of popular
attitudes and affiliation are important for predicting patterns of selective targeting or at
a minimum we should include community level fixed effects in an empirical model.
4.4 The Empirical Setting: Violence toward Civilians in the Vietnam War
In a country of just 17 million people, estimates put the number of total civilian
casualties in the Vietnam War at two hundred thousand at the lowest and as high as
one million (Hirschman et al. 1995).83 The Communist Party of South Vietnam
distributed a broad list of 15 groups that rebels might target that included government
83 Civilians lived primarily in one of about 30,000 hamlets, organized into about 3,000 villages, which
were inside 237 political districts, inside 44 provinces. The country was further divided into 4 Corps
Tactical Areas by the U.S. military.
157
administrators, popular local leaders, persons who collaborated with the government,
and family members of the above (Pike 1970, 30-31). The government in return targeted
members of the rebel organization commonly referred to as the Viet Cong
Infrastructure (VCI), which was either an overt cadre that openly performed
governmental and support functions or a covert cadre that clandestinely worked for the
rebel forces while blending into the population.84 The government compiled a large list
of political positions controlled by the Viet Cong and assigned them A, B, and C letter
scores representing their priority to the targeting program. Government figures show
that between 15,000 and 22,000 Viet Cong suspects were captured or killed annually
from when the program became fully operational in 1968 to when it was mostly
disbanded in 1972. In the same period, a substantial share of aerial bombardment and
artillery shelling was targeted toward populated areas that were considered to be under
rebel control (Thayer 1985, Kocher et al. 2011).
The Vietnam War is a uniquely transparent case due to the availability of
extensive sources of information on violence toward civilians during the war. Rebel
violence toward civilians is detailed in interviews with civilians (Pohle 1969; Leites
1969), interviews with captured rebel combatants (Davison 1972; Hunt 1974, 2009),
captured rebel documents (Hosmer 1970), province histories (Race 1972; Bergerud 1993;
84 Overt cadre were referred to as “illegal” because they did not have government issued identification
whereas covert cadre were “legal” because they did have government issued identification and could
pass openly through checkpoints.
158
Elliot 2003), and military and police databases used during the war (Thayer 1985).
Incumbent selective violence is described in personal accounts by American intelligence
officers (Herrington 1987; DeForest and Chanoff 1991), interviews with former
participants (Andradé 1990; Valentine 2000; Moyar 2007), declassified primary
documents, and the actual database of suspects used by the Phoenix Program (Kalyvas
and Kocher 2007).
4.4.1 Dependent Variable- Selective Targeting
I have compiled the details of 47,404 government killings and arrests committed
with the support of or documented by the Phoenix Program between July 1969 and
December 1972. Of those, 8,617 were recovered from archived printouts of “Monthly
Neutralization Reports” from the Viet Cong Infrastructure Neutralization System from
July 1969 to June 1970.85 Another 38,787 are detailed in the archived electronic copy of
the National Police Infrastructure Analysis System (NPIASS).86 Each act is
georeferenced to the nearest village. Temporal resolution varies between the two
systems, but I aggregate the unit of analysis to the village-quarter. Total violence is 85 Because of an incomplete preservation of documents, only data for Forth Corp is available from January
1970 to July 1970. The full country is available otherwise. For a description of the data see “Vietcong
Infrastructure Neutralization Systems (VCINS)”, no date, Folder 065, US Marine Corps History Division
Vietnam War Documents Collection, The Vietnam Center and Archive, Texas Tech University. Accessed
23 Mar. 2012. <http://www.vietnam.ttu.edu/virtualarchive/items.php?item=1201065056> 86 For a description of the data see National Archives and Records Administration, “Reference Copy of
Technical Documentation for National Police Infrastructure Analysis Subsystem (NPIASS) I & II Master
Files,” 2008, Records of the Joint Commands, RG 349. The genesis of the database is described by
McChristian (1994), and for a recent analysis see Kalyvas and Kocher (2007).
159
measured by the sum of killings and arrests committed in that village-quarter. Both
systems record whether the victim was specifically targeted by the operation or if
they were identified concurrently or following the operation .87 About a third of
Phoenix targeting were operations launched based on prior information, 15,313 versus
32,803.88
The model speaks primarily to government selective violence, where costs for
targeting may be relatively low thanks to greater manpower, superior technology, and
the availability of highly mobile units. However, for comparison I include rebel
selective violence recorded at the level of individual attacks by the Terrorist Incident
Reporting System (TIRSA).89 TIRSA records whether an act was selective or general in
nature, the means used, the target, and the number of casualties inflicted. I use the
original coding of selective and general, with the minor change that general acts against
public officials with only one or two casualties were probably selective acts because of
the target and the close proximity of the violence, which I recode accordingly. The data
show that between July 1969 and December 1972, the Viet Cong selectively killed or
87 NIPIASS records whether the victim was a “Specific Target” or “Non-specific target.” VCINS records
whether the victim was a “Specific target,” “General target,” “Cordon and Search,” “Main Force Sweep,”
or “Other.” 88 Random violence (profiling) took many forms, including cordon and sweep operations and road
blocks. In operation Barking Sands, the 25th Infantry Division temporarily detained over 35,000 people
over a seventh month period in Hua Nghai and Binh Duong Provinces (Bergerud 1993, 166). In the
cordon and search operation Cedar Falls, 106 villagers were arrested out of six thousand over a one
month period (Schell 1967). 89 The data are documented in National Archives and Record Administration (NARA), Reference Copy of
Technical Documentation for Accessioned Electronic Records The Terrorist Incident Reporting System
(TIRSA) October 1967-February 1973, RG330, Records of the Office of the Secretary of Defense.
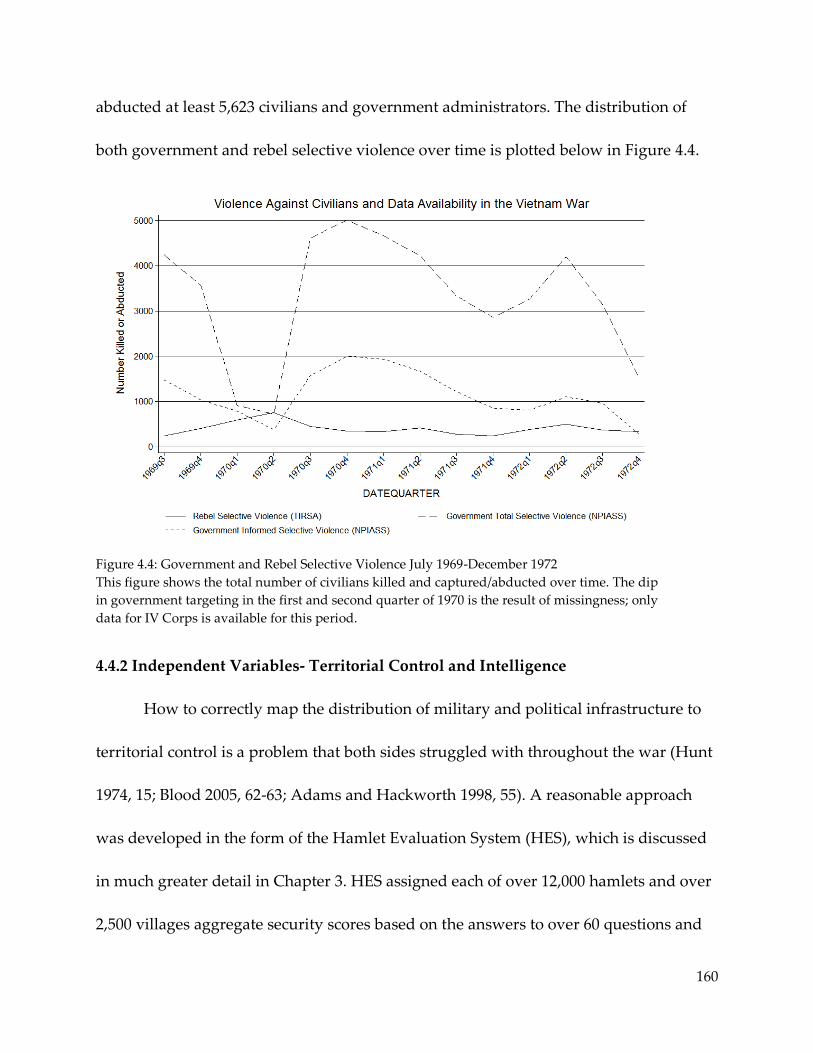
160
abducted at least 5,623 civilians and government administrators. The distribution of
both government and rebel selective violence over time is plotted below in Figure 4.4.
Figure 4.4: Government and Rebel Selective Violence July 1969-December 1972
This figure shows the total number of civilians killed and captured/abducted over time. The dip
in government targeting in the first and second quarter of 1970 is the result of missingness; only
data for IV Corps is available for this period.
4.4.2 Independent Variables- Territorial Control and Intelligence
How to correctly map the distribution of military and political infrastructure to
territorial control is a problem that both sides struggled with throughout the war (Hunt
1974, 15; Blood 2005, 62-63; Adams and Hackworth 1998, 55). A reasonable approach
was developed in the form of the Hamlet Evaluation System (HES), which is discussed
in much greater detail in Chapter 3. HES assigned each of over 12,000 hamlets and over
2,500 villages aggregate security scores based on the answers to over 60 questions and
161
was updated monthly using a weighted Bayesian procedure (Kalyvas and Kocher
2009b, 17). In each case, answers were provided by American District Senior Advisors
along with their South Vietnamese military counterparts.90 For simplicity, in this
chapter I follow Kalyvas and Kocher (2009) and use aggregate Bayesian measures used
in the original HES survey. Chapter 3 develops more refined measures based on an item
response model, but the original HES aggregations are more than sufficient to illustrate
and test the model proposed here.91
The first aggregate measure, , takes into account the presence of both
government and rebel forces and roughly categorizes a village into fully government
control, partial government control, fully contested, partially rebel controlled, and fully
rebel controlled.92 To measure , I use a constituent aggregation of
questions pertaining only to the presence of government military forces.93 The measure
includes questions on the government forces in or nearby the village, availability of
outside fire support, and the ability for government personnel to safely travel. To
90 A full discussion of the controversies surrounding data collection and generation in the Vietnam War
are beyond the scope of this article. For a representative critique of the first HES system see Tunney
(1969), and for a supportive external validity check of HES see Pool et al. (1968). For a modern critique of
the misuse of metrics in Vietnam see Daddis (2011). 91 In addition to substantially streamlining the discussion of the evidence, using the original measures
provides access to a number of observations for which the original questions and responses are not
available. 92 The aggregation is known as VMOD6B and is a population weighted aggregation of hamlet and village
level questions. Kalyvas and Kocher (2009b) describe the qualitative interpretation of each category in
terms of the Hamlet Evaluation System score for a similar aggregation. See Kalyvas (2006, 421) for a more
thorough account of territorial control and Samson (1970) for the five zone scheme’s applicability to the
Vietnam case. Chapter 2 examines this measure in much greater detail. 93 The aggregate HES measure is called VMOD1D.
162
measure RebelControl, I use a constituent aggregation of questions pertaining to the
presence of rebel military forces.94 The measure includes questions on whether rebel
forces physically occupy the hamlet, make the area around the hamlet unsafe for travel,
are able to tax or recruit, and the estimated size of guerrilla and main force units in the
area. The constituent questions for both aggregations appear in Appendix A.4 and A.5.
As expected, the two measures are negatively correlated (-0.61), but there is
considerable overlap. The distribution of each type of control and the joint distribution
of and appear below in Figure 4.5. Of particular
interest in a conflict such as Vietnam is the fractured nature territorial control; rebel
pockets directly border government pockets of control throughout the country as
shown in Figure 4.6.
94 The aggregate HES measure is called VMOD1A.

163
Figure 4.5: Control Disaggregated into Rebel and Government Control
This figure shows the distribution of total control and two disaggregated constituents of
government control and rebel control. Measures are based on Bayesian village level aggregations
from the HES70/71 system, VMOD6B for total control, VMOD1D for government control, and
VMOD1A for rebel control. To maintain comparison to the existing literature, the order is
reversed from an earlier chapter; Full Government=1; Partial Government=2, Mixed=3, Partial
Rebel Control=4; and Full Rebel Control=5. The disaggregations of government control and rebel
control increase in number so that 1 is least control and 5 is most.

164
Figure 4.6: Map of Village Control in Oct. 1970
This figure shows estimates of control from Oct. 1970 based on the Bayesian village level
aggregation from HES70/71 VMOD6B.
165
To measure the availability of intelligence in a community, I use two Hamlet
Evaluation Survey quarterly questions that ask the District Senior Advisor to rate the
portion of rebel identities known to friendly intelligence personnel. The first, which I
refer to as IntelligenceVCI, asks, “Are the identities of members of the enemy
infrastructure for this village known to friendly intelligence personnel?” The second,
, asks, “Are the identities of the members of the enemy village
guerrilla unit known to friendly intelligence personnel?” The answer to both is an
ordered response: “No”; “one”; “Yes, a few (less than 10%)”; “Yes, some (10%-40%)”;
“Yes, many (41%-90%)”; “Yes, all or nearly all”; and “No enemy infrastructure [village
guerilla unit] exists for this village.” I create dummy variables and
indicating the complete absence of rebels (and thus no intelligence to have). I further
create a composite index where
( ) which is
normalized to take a value between 0 and 1. The composite is necessary and useful due
to the similarity between concepts represented in the individual questions. This is
reflected in their high correlation (0.831).95 Figure 4.7 shows the levels of
TotalIntelligence.
95 Correlation calculated by excluding responses of no rebels present.
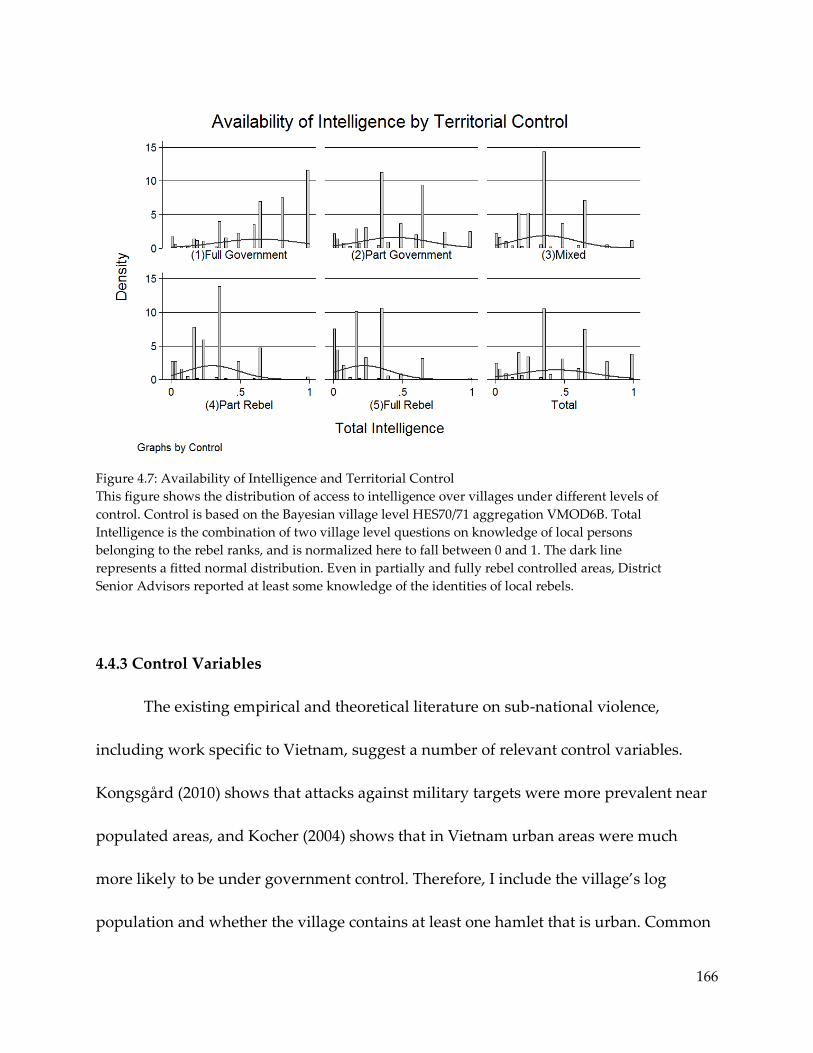
166
Figure 4.7: Availability of Intelligence and Territorial Control
This figure shows the distribution of access to intelligence over villages under different levels of
control. Control is based on the Bayesian village level HES70/71 aggregation VMOD6B. Total
Intelligence is the combination of two village level questions on knowledge of local persons
belonging to the rebel ranks, and is normalized here to fall between 0 and 1. The dark line
represents a fitted normal distribution. Even in partially and fully rebel controlled areas, District
Senior Advisors reported at least some knowledge of the identities of local rebels.
4.4.3 Control Variables
The existing empirical and theoretical literature on sub-national violence,
including work specific to Vietnam, suggest a number of relevant control variables.
Kongsgård (2010) shows that attacks against military targets were more prevalent near
populated areas, and Kocher (2004) shows that in Vietnam urban areas were much
more likely to be under government control. Therefore, I include the village’s log
population and whether the village contains at least one hamlet that is urban. Common
167
demographic traits such as ethnicity and religion can help solve the collective action
problems inherent to organizing rebellion, so I include whether the hamlet is primarily
of the majority ethnicity, Vietnamese, or the major religion, Buddhist (Lichbach 1995;
Popkin 1979; Kalyvas and Kocher 2007). I include a dummy variable for whether the
primary occupation of the village is farming because resource extraction is thought to
influence propensity for violence, and at one point 80 to 90 percent of rebel finances
were obtained from rice taxes (McChristian 1994, 167).
4.5 Results
4.5.1 Violence over Aggregate Territorial Control
According to the theory of selective violence proposed by Kalyvas (2006) and
applied to the Vietnam War by Kalyvas and Kocher (2009), each side’s selective violence
should peak in their own area of partial control and enemy areas should be relatively
absent of such violence. The prediction depends on the argument that violence ought to
only be directed towards places where civilians are willing to provide information, and
they are only willing to do so when protected from the retaliatory violence by the
opponent. There is strong evidence that civilians in Vietnam weighed their security
situation carefully when considering whether to cooperate with the government, but
the overall suggested pattern does not match contemporaneous accounts.
168
Civilians in rebel areas were disproportionately targeted for arrest and
assassination by government forces. Based on interviews with South Vietnamese
legislators and policy makers, Goodman (1973, 227) finds, “One of the major sources of
'Viet Cong Suspects' are military operations that move into a Viet Cong area and pick
up all the civilians they encounter. This method is called the 'snatch' and on official
reports the suspect is 'linked' to the Viet Cong because he was found in an insecure
area.” An American military Phoenix Program advisor similarly reports that “The
touchables are generally those living in VC havens and low level legals. If they are
neutralized no one really cares. They have no money, political power, or religious
influence. They are non-influential entities. They are touchable - neutralizable.”96
Contested areas were sometimes particularly dangerous. When the city of Hue fell to
Viet Cong forces during the Tet Offensive, it experienced a purge of 2,500 to 3,500
civilians based on precompiled lists provided by local informants. It then experienced
another purge by government forces liberating the city based on names compiled by the
CIA’s base chief (Prados 2009, 240).
Were contested and rebel areas relatively free of government random or
informed targeting? I interpret this in a regression framework where government
violence is represented by (indexed by or when specifically applying to informed
96 Endy, Major Clarence E. “Phung Hoang (Thua Thien Province) advisor, gives his views on Phung
Hoang based on his experience in that province 10/71-9/72”, September 19, 1972. CK3100198059.
Declassified Documents Reference System. Farmington Hills, Mich.
169
or random targeting), communities are indexed by , and time periods by . Define to
be the ratio of informed violence to all violence,
. I estimate violence as a
function of an aggregate measure of territorial control which roughly divides
communities into five zones: (1) Full Government Control, (2) Partial Government
Control, (3) Mixed, (4) Partial Rebel Control, and (5) Full Rebel Control. I break each
zone into dummy variables with full government control as the base category. I further
include controls for population, urbanity, administrative center, ethnicity, religion, and
occupation, along with district and quarter fixed effects. Throughout, I use ordinary
least squares with errors clustered by village.w
The results in Table 1, which are displayed graphically in Figure 4.8, show that
violence disproportionately targeted mixed and rebel areas, with a sharp drop off in
fully rebel controlled areas. Informed violence is distributed rather uniformly across
contested, partially rebel-controlled, and fully rebel-controlled areas. Government
random violence actually peaks in rebel areas of partial control, but across models both
fully contested and rebel controlled areas are statistically indistinguishable from one
another. Importantly, the more prevalent areas of government and partial government
control are underrepresented in violence overall. In the final two columns, I include
Viet Cong selective violence as a base of a comparison. Rebel violence peaks in fully
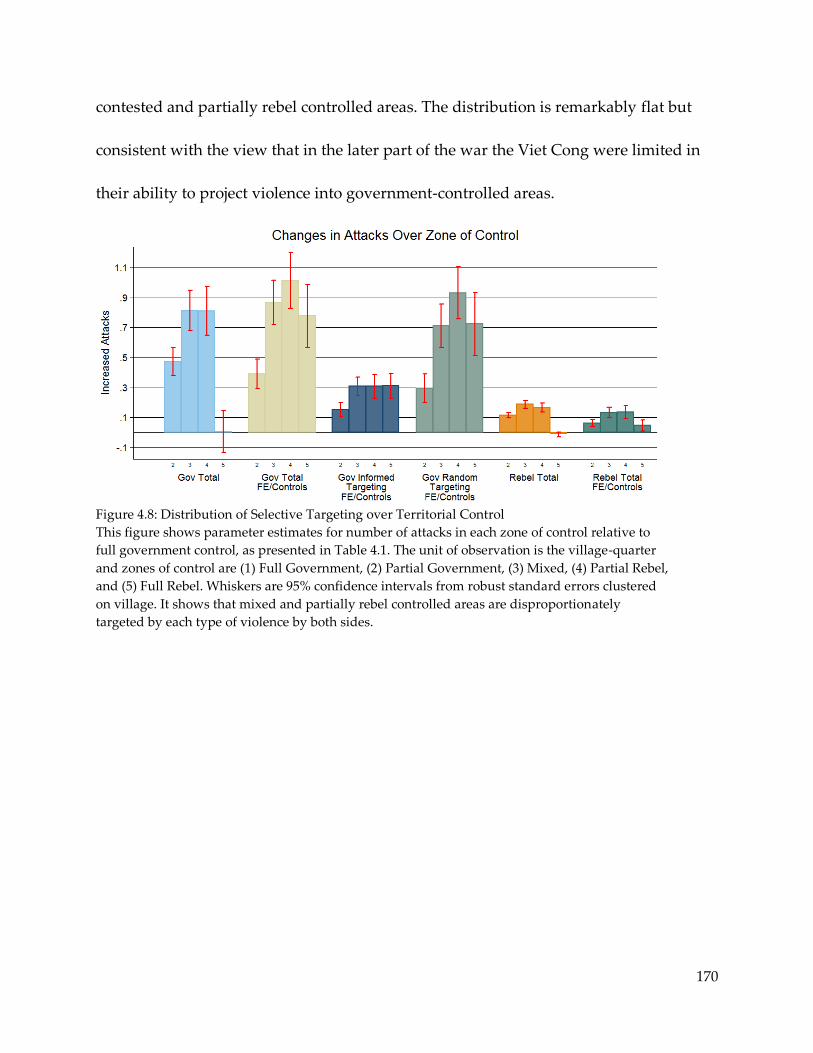
170
contested and partially rebel controlled areas. The distribution is remarkably flat but
consistent with the view that in the later part of the war the Viet Cong were limited in
their ability to project violence into government-controlled areas.
Figure 4.8: Distribution of Selective Targeting over Territorial Control
This figure shows parameter estimates for number of attacks in each zone of control relative to
full government control, as presented in Table 4.1. The unit of observation is the village-quarter
and zones of control are (1) Full Government, (2) Partial Government, (3) Mixed, (4) Partial Rebel,
and (5) Full Rebel. Whiskers are 95% confidence intervals from robust standard errors clustered
on village. It shows that mixed and partially rebel controlled areas are disproportionately
targeted by each type of violence by both sides.
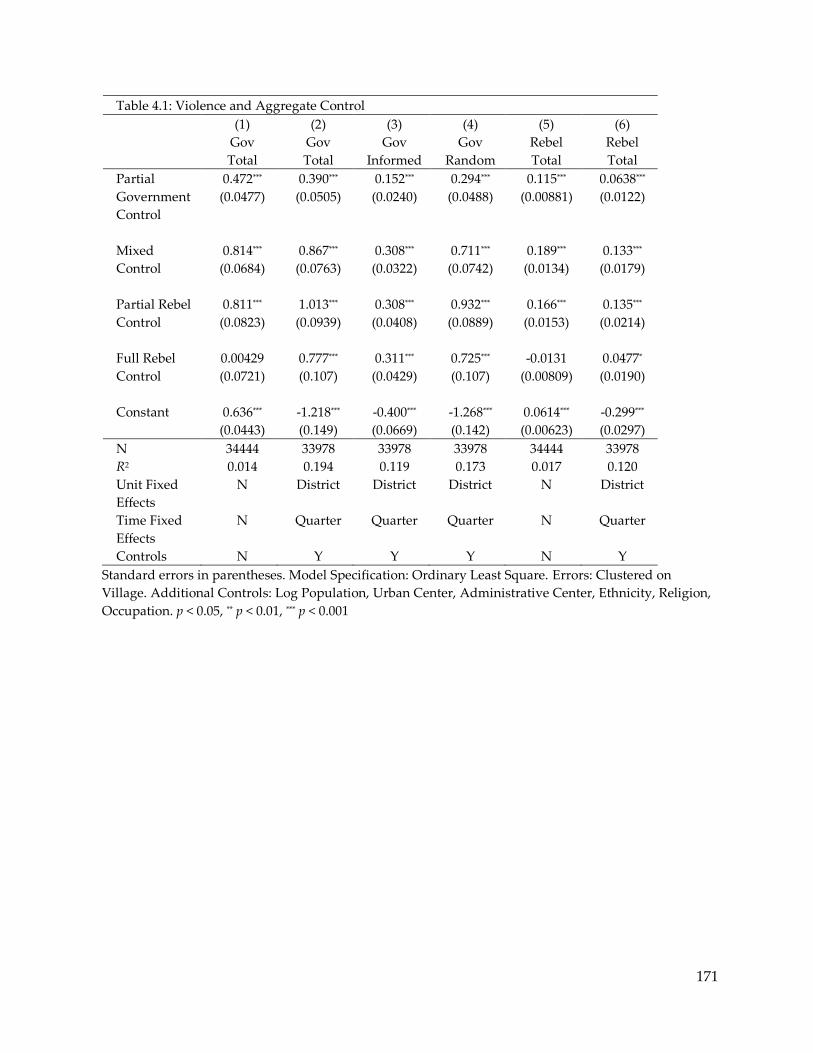
171
Table 4.1: Violence and Aggregate Control
(1) (2) (3) (4) (5) (6)
Gov
Total
Gov
Total
Gov
Informed
Gov
Random
Rebel
Total
Rebel
Total
Partial
Government
Control
0.472*** 0.390*** 0.152*** 0.294*** 0.115*** 0.0638***
(0.0477) (0.0505) (0.0240) (0.0488) (0.00881) (0.0122)
Mixed
Control
0.814*** 0.867*** 0.308*** 0.711*** 0.189*** 0.133***
(0.0684) (0.0763) (0.0322) (0.0742) (0.0134) (0.0179)
Partial Rebel
Control
0.811*** 1.013*** 0.308*** 0.932*** 0.166*** 0.135***
(0.0823) (0.0939) (0.0408) (0.0889) (0.0153) (0.0214)
Full Rebel
Control
0.00429 0.777*** 0.311*** 0.725*** -0.0131 0.0477*
(0.0721) (0.107) (0.0429) (0.107) (0.00809) (0.0190)
Constant 0.636*** -1.218*** -0.400*** -1.268*** 0.0614*** -0.299***
(0.0443) (0.149) (0.0669) (0.142) (0.00623) (0.0297)
N 34444 33978 33978 33978 34444 33978
R2 0.014 0.194 0.119 0.173 0.017 0.120
Unit Fixed
Effects
N District District District N District
Time Fixed
Effects
N Quarter Quarter Quarter N Quarter
Controls N Y Y Y N Y
Standard errors in parentheses. Model Specification: Ordinary Least Square. Errors: Clustered on
Village. Additional Controls: Log Population, Urban Center, Administrative Center, Ethnicity, Religion,
Occupation. p < 0.05, ** p < 0.01, *** p < 0.001
172
4.5.2 Violence and Information
How does violence vary with the information provided by communities? Below,
I estimate violence as a function of an aggregate composite of the two HES measures of
available information in each village. The comparative statics indicate that the
relationship is contingent on the proportion of rebels to the population, community
affinity to the victims, cost of government targeting, and the probability of rebel
retaliation. As a first cut, I include a village fixed effect which partially captures these
unobserved factors. A quarter fixed effect, , captures countrywide shifts in strategy,
capabilities, and measurement over the period. I further include a dummy indicator for
whether the village is in the extreme of rebel control as indicated by the aggregate
measure of territorial control or in the extreme of government control as indicated by
“no VCI” or “no guerrillas” by the HES intelligence questions. I also include the log of
village population and a dummy for whether the population is recorded as dropping to
zero.
The results appear in Table 2. Hypothesis 1 predicts that holding all else
constant, more information should be associated with more informed violence and less
random violence, and thus an increase in the share of informed violence to all violence.
Columns 2-4 confirm this prediction. A shift from no intelligence to full knowledge of

173
rebel identities is associated with an increase in about 18 more informed attacks per
village-quarter and a drop of about 19 random attacks per village quarter.97 Similarly,
more intelligence leads to a statistically significant increase in the share of informed
violence to total violence. This suggests that not only does government violence
increase with greater intelligence, but the portfolio also shifts internally. A conjecture
but not a prediction of the model is that, controlling for all else, the relationship
between total violence and information should be ambiguous. Column 1 shows that in
this sample, intelligence does not predict within-village levels of total violence over
time. This is keenly important for studies where only the outcome, an attack, is
observed but not the process leading the government launching the attack. If all we had
available were aggregate data, we would conclude better access to intelligence, or other
proxies such as popular support, are unrelated to the government’s use of selective
targeting.
97 The negative coefficient on TotalIntelligence for random violence just misses significance at the 0.1 level
in an OLS specification but becomes highly significant with other specifications such as negative
binomial.
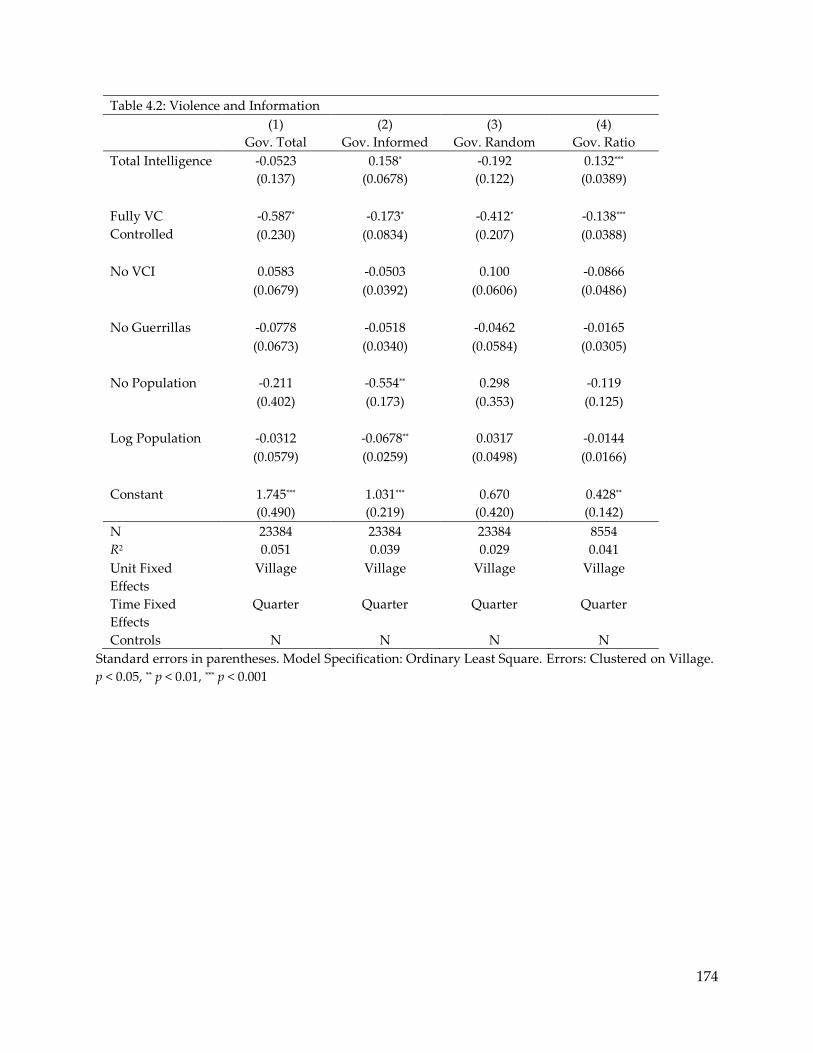
174
Table 4.2: Violence and Information
(1) (2) (3) (4)
Gov. Total Gov. Informed Gov. Random Gov. Ratio
Total Intelligence -0.0523 0.158* -0.192 0.132***
(0.137) (0.0678) (0.122) (0.0389)
Fully VC
Controlled
-0.587* -0.173* -0.412* -0.138***
(0.230) (0.0834) (0.207) (0.0388)
No VCI 0.0583 -0.0503 0.100 -0.0866
(0.0679) (0.0392) (0.0606) (0.0486)
No Guerrillas -0.0778 -0.0518 -0.0462 -0.0165
(0.0673) (0.0340) (0.0584) (0.0305)
No Population -0.211 -0.554** 0.298 -0.119
(0.402) (0.173) (0.353) (0.125)
Log Population -0.0312 -0.0678** 0.0317 -0.0144
(0.0579) (0.0259) (0.0498) (0.0166)
Constant 1.745*** 1.031*** 0.670 0.428**
(0.490) (0.219) (0.420) (0.142)
N 23384 23384 23384 8554
R2 0.051 0.039 0.029 0.041
Unit Fixed
Effects
Village Village Village Village
Time Fixed
Effects
Quarter Quarter Quarter Quarter
Controls N N N N
Standard errors in parentheses. Model Specification: Ordinary Least Square. Errors: Clustered on Village.
p < 0.05, ** p < 0.01, *** p < 0.001
175
4.5.3 Violence, Government Control, and Rebel Control
Hypothesis 2A predicts that reducing the government’s costs leads to an increase
in all types of violence. Likewise, Hypothesis 3A predicts that increasing rebel control
will increase all kinds of government violence. Modifying the within-village
specification above, I include a five-category measure of GovernmentControl as a proxy
for the government costs of projecting violence against a community and a five category
measure of RebelControl to proxy for rebel presence in an area and ability to retaliate
against civilians. The results in Table 3 find moderate support for these hypotheses. In
column 1, conditional on rebel control and shifts into or out of the extremes of rebel
control and government control, an increase in government control is associated with
an increase in total government violence. The effect is not statistically significant for
either informed or random violence alone, columns 2 and 3. When village fixed effects
are dropped the relationship reverses. More rebel control strongly predicts each type of
government violence, and more government control strongly predicts lower levels of
each type of violence. This is to be expected given the strong negative correlation
between the two measures and suggests the need to develop measures of government
costs which are not mechanically related to the presence of rebel forces.

176
Table 4.3: Violence and Disaggregated Control
(1) (2) (3) (4) (5) (6)
Gov. Total Gov.
Informed
Gov.
Random
Gov.
Total
Gov.
Informed
Gov.
Random
Rebel
Control
0.000227 0.0227 -0.0364 0.554*** 0.146*** 0.397***
(0.0419) (0.0202) (0.0363) (0.0411) (0.0165) (0.0347)
Gov.
Control
0.0914* 0.0422 0.0614 -0.164*** -0.0783*** -0.0765*
(0.0461) (0.0228) (0.0408) (0.0433) (0.0193) (0.0362)
Total
Intelligence
-0.0819 0.148* -0.220 0.607*** 0.251*** 0.350***
(0.141) (0.0682) (0.125) (0.128) (0.0561) (0.103)
Fully VC
Controlled
-0.460 -0.142 -0.279 -0.883*** -0.373*** -0.463**
(0.262) (0.0949) (0.234) (0.172) (0.0584) (0.152)
No VCI 0.0675 -0.0458 0.107 -0.362*** -0.160*** -0.200***
(0.0685) (0.0400) (0.0612) (0.0714) (0.0404) (0.0542)
No
Guerrillas
-0.0728 -0.0431 -0.0527 -0.628*** -0.148*** -0.482***
(0.0675) (0.0350) (0.0577) (0.0794) (0.0448) (0.0540)
No
Population
-0.318 -0.580*** 0.198 1.977*** 0.528*** 1.421***
(0.413) (0.174) (0.365) (0.312) (0.121) (0.250)
Log
Population
-0.0482 -0.0716** 0.0155 0.400*** 0.122*** 0.274***
(0.0580) (0.0259) (0.0502) (0.0308) (0.0159) (0.0219)
Constant 1.563** 0.851*** 0.689 -2.826*** -0.664*** -2.204***
(0.538) (0.230) (0.466) (0.309) (0.136) (0.252)
N 23201 23201 23201 23201 23201 23201
R2 0.051 0.040 0.030 0.094 0.053 0.066
Unit Fixed
Effects
Village Village Village N N N
Time Fixed
Effects
Quarter Quarter Quarter Quarter Quarter Quarter
Controls N N N Y Y Y
Standard errors in parentheses. Model Specification: Ordinary Least Square. Errors: Clustered on
Village. Additional Controls: Log Population, Urban Center, Administrative Center, Ethnicity, Religion,
Occupation. * p < 0.05, ** p < 0.01, *** p < 0.001
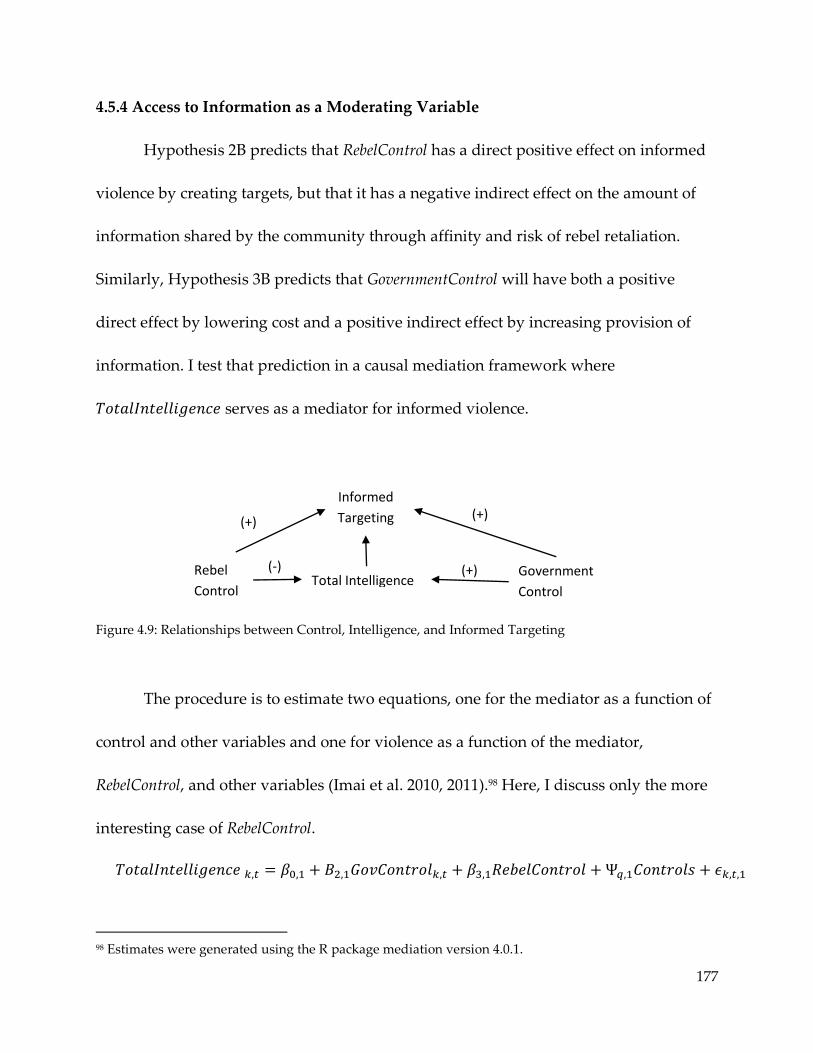
177
4.5.4 Access to Information as a Moderating Variable
Hypothesis 2B predicts that RebelControl has a direct positive effect on informed
violence by creating targets, but that it has a negative indirect effect on the amount of
information shared by the community through affinity and risk of rebel retaliation.
Similarly, Hypothesis 3B predicts that GovernmentControl will have both a positive
direct effect by lowering cost and a positive indirect effect by increasing provision of
information. I test that prediction in a causal mediation framework where
serves as a mediator for informed violence.
Figure 4.9: Relationships between Control, Intelligence, and Informed Targeting
The procedure is to estimate two equations, one for the mediator as a function of
control and other variables and one for violence as a function of the mediator,
RebelControl, and other variables (Imai et al. 2010, 2011).98 Here, I discuss only the more
interesting case of RebelControl.
98 Estimates were generated using the R package mediation version 4.0.1.
Informed
Targeting
Government
Control Total Intelligence
Rebel
Control
(-)
(+)
(+)
(+)
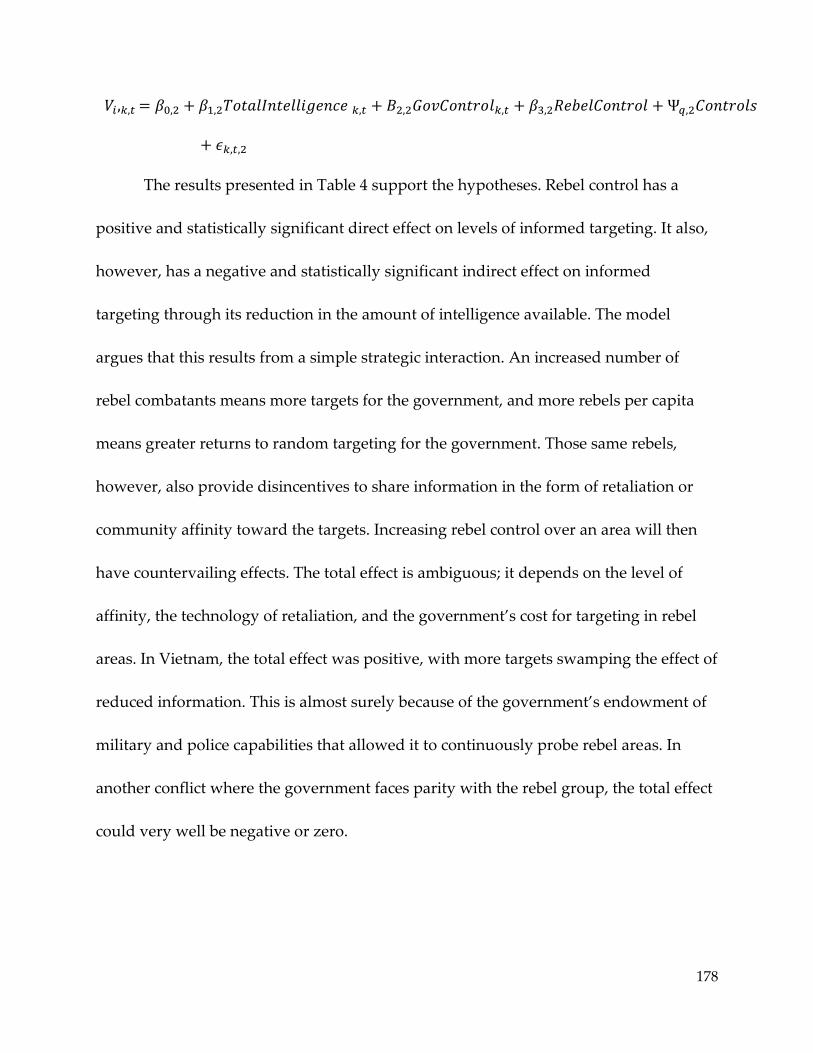
178
The results presented in Table 4 support the hypotheses. Rebel control has a
positive and statistically significant direct effect on levels of informed targeting. It also,
however, has a negative and statistically significant indirect effect on informed
targeting through its reduction in the amount of intelligence available. The model
argues that this results from a simple strategic interaction. An increased number of
rebel combatants means more targets for the government, and more rebels per capita
means greater returns to random targeting for the government. Those same rebels,
however, also provide disincentives to share information in the form of retaliation or
community affinity toward the targets. Increasing rebel control over an area will then
have countervailing effects. The total effect is ambiguous; it depends on the level of
affinity, the technology of retaliation, and the government’s cost for targeting in rebel
areas. In Vietnam, the total effect was positive, with more targets swamping the effect of
reduced information. This is almost surely because of the government’s endowment of
military and police capabilities that allowed it to continuously probe rebel areas. In
another conflict where the government faces parity with the rebel group, the total effect
could very well be negative or zero.
179
Table 4.4: Rebel Control and the Mediating Effect of Reduced Intelligence
Effect 95% CI
Rebel Control Mediation
Effect Through Changes
in Total Intelligence
-0.007843 -0.010759 -0.004761
Rebel Control Direct
Effect
0.1355 0.1100 0.1627
Rebel Control Total
Effect
0.1277 0.1031 0.1539
Proportion of Total Effect
via Mediation
0.06125 -0.09204 -0.03512
N 23,014
Notes: Confidence Intervals Based on Nonparametric Bootstrap.
4.6 Conclusion
Together, the model and evidence provides a plausible answer to several puzzles
about selective violence. First, why do selective violence programs appear to work
despite including relatively high levels of ineffective targeting? The model suggests that
informed and random targeting are important strategic complements to one another.
Even if random targeting is not particularly useful and has a very low rate of return, it
can nonetheless induce a community to provide useful intelligence when they might
not have cooperated otherwise. A similar logic may explain findings for positive effects
of indiscriminate violence in general. This observation does not mean that selective
violence programs are not corrupt, incompetent, or highly political. Rather, it means
there is also a strategic rationale for violent coercion of which one of the byproducts is
the kind of cooperation that enables more restrained methods.
180
Second, why do civilians ever cooperate when there are risks of retaliation by the
other side? In short, the rebels are not the only ones threatening violence. If providing
some names reduces the amount of government harassment by more than the amount
of rebel retaliatory harassment, then it can be a worthwhile trade for a community.
Finally, why do governments appear to have occasional success in rebel areas,
sometimes even without the cooperation of local civilians? Assuming that the area is
not so remote or dangerous that no government forces can randomly target there, rebel
areas provide a particularly high rate of return for random targeting. The government
has a very credible threat of mass arrests in the absence of information, thereby
inducing community cooperation.
What do these findings imply for our understanding of the Vietnam War? The
Phoenix Program did not primarily concentrate on civilians that were easier to reach
militarily. This, in addition to the fact that most of the incumbent’s indiscriminate
violence targeted rebel controlled areas, suggest that the strategy in the later years of
the Vietnam War was one of harassment and population displacement in rebel areas.
This puts selective violence back into the context of the overall strategic goals of
military campaigns rather than a solely locally generated process. Having established
the general pattern of selective violence in Vietnam, future work should directly
address the question of whether selective violence actually works as a long term
counterinsurgency strategy. The Vietnam data make it possible to investigate whether
181
selective violence reduces overall rebel effectiveness or whether it exacerbates conflict
by generating new grievances.
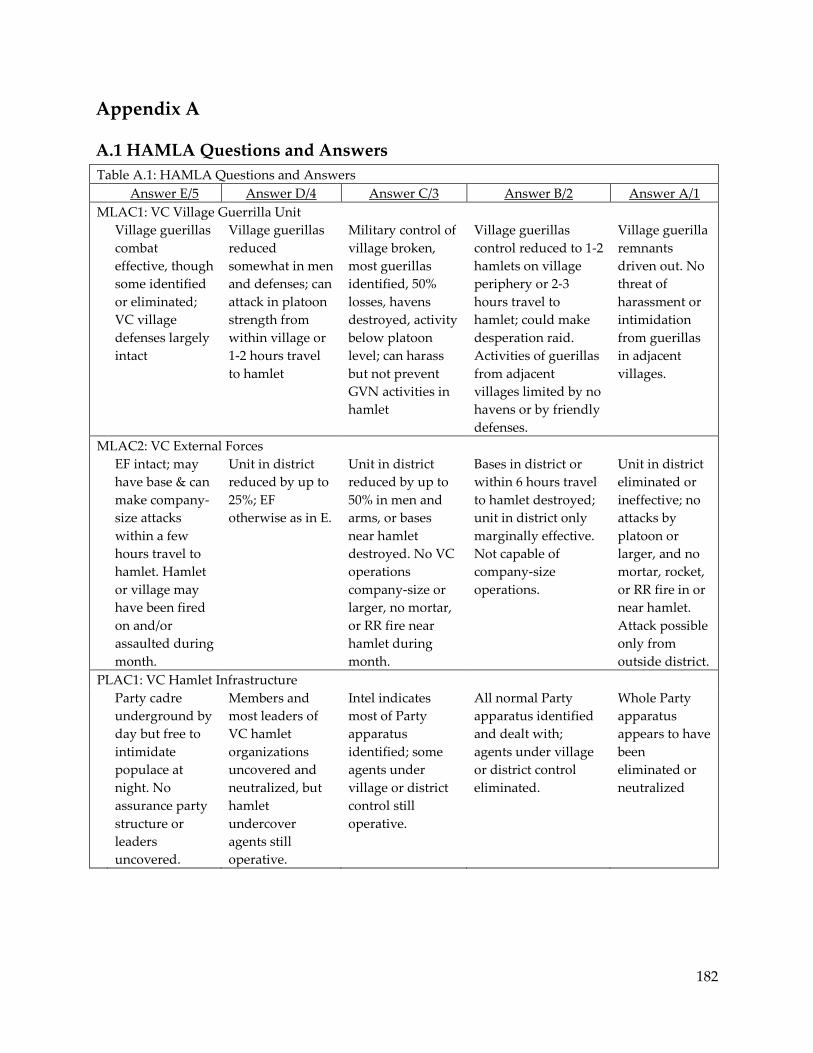
182
Appendix A
A.1 HAMLA Questions and Answers
Table A.1: HAMLA Questions and Answers
Answer E/5 Answer D/4 Answer C/3 Answer B/2 Answer A/1
MLAC1: VC Village Guerrilla Unit
Village guerillas
combat
effective, though
some identified
or eliminated;
VC village
defenses largely
intact
Village guerillas
reduced
somewhat in men
and defenses; can
attack in platoon
strength from
within village or
1-2 hours travel
to hamlet
Military control of
village broken,
most guerillas
identified, 50%
losses, havens
destroyed, activity
below platoon
level; can harass
but not prevent
GVN activities in
hamlet
Village guerillas
control reduced to 1-2
hamlets on village
periphery or 2-3
hours travel to
hamlet; could make
desperation raid.
Activities of guerillas
from adjacent
villages limited by no
havens or by friendly
defenses.
Village guerilla
remnants
driven out. No
threat of
harassment or
intimidation
from guerillas
in adjacent
villages.
MLAC2: VC External Forces
EF intact; may
have base & can
make company-
size attacks
within a few
hours travel to
hamlet. Hamlet
or village may
have been fired
on and/or
assaulted during
month.
Unit in district
reduced by up to
25%; EF
otherwise as in E.
Unit in district
reduced by up to
50% in men and
arms, or bases
near hamlet
destroyed. No VC
operations
company-size or
larger, no mortar,
or RR fire near
hamlet during
month.
Bases in district or
within 6 hours travel
to hamlet destroyed;
unit in district only
marginally effective.
Not capable of
company-size
operations.
Unit in district
eliminated or
ineffective; no
attacks by
platoon or
larger, and no
mortar, rocket,
or RR fire in or
near hamlet.
Attack possible
only from
outside district.
PLAC1: VC Hamlet Infrastructure
Party cadre
underground by
day but free to
intimidate
populace at
night. No
assurance party
structure or
leaders
uncovered.
Members and
most leaders of
VC hamlet
organizations
uncovered and
neutralized, but
hamlet
undercover
agents still
operative.
Intel indicates
most of Party
apparatus
identified; some
agents under
village or district
control still
operative.
All normal Party
apparatus identified
and dealt with;
agents under village
or district control
eliminated.
Whole Party
apparatus
appears to have
been
eliminated or
neutralized

183
PLAC2: VC Village Infrastructure
Despite some
identification,
village
apparatus intact,
functioning.
Some village
cadre eliminated
but apparatus
fairly effective.
Most key
members of
village apparatus
identified, up to
half neutralized;
effectiveness
curtailed.
Most of village
apparatus leaders
eliminated; almost all
members identified.
Little coordinated VC
activity in village.
Village
organization
wiped out. Few
covert agents
directed from
outside but
stymied by
friendly
security
organizations.
SECU1: Hamlet Defense Plan and Organization
No night
defense except
by external
forces although
required. PF
present during
day.
Day and night
defense by
external forces
and PF but local
defense force
recruiting and
training may be
underway.
Local warning and
communication
systems operative;
some armed local
defenders, but
main reliance on
PF and/or RD
team or external
defense. In urban
areas, police
during day but
inadequate.
Defense force
organized, but only
partially effective;
adequate plan and
communications for
its use. In urban
areas, adequate
police by day.
Adequate
defense force
and adequate
defense plan,
following
provincial RD
plan. Where
applicable, in
urban areas,
adequate police
day and night.
SECU2: Friendly External Force Assistance
FEF are
inadequate in
strength to meet
needs for
artillery, air
support,
reaction ground
forces, etc.
FEF meets needs,
but only
marginally, e.g.
delayed
response, no
night response,
not aggressive,
etc.
Availability and
effectiveness of
FEF generally
meets needs.
Need for FEF less
than C; can be met
adequately.
Need for FEF
very slight; can
be met
adequately.
SECU3: Internal Security Activities
No agents, no
intelligence
from public
except possibly
sporadic police
informants.
No complete
intelligence
system; a few
trained or
voluntary
informants; some
data from census
grievance where
operative.
Hamlet chief gets
useful info from
informants and
some volunteers,
and from census
grievance where
present.
Effective informants
system; considerable
useful info from
public.
Effective
internal
security
apparatus
covers hamlet:
hamlet security
deputy, police,
informant
system, willing
public
participation.
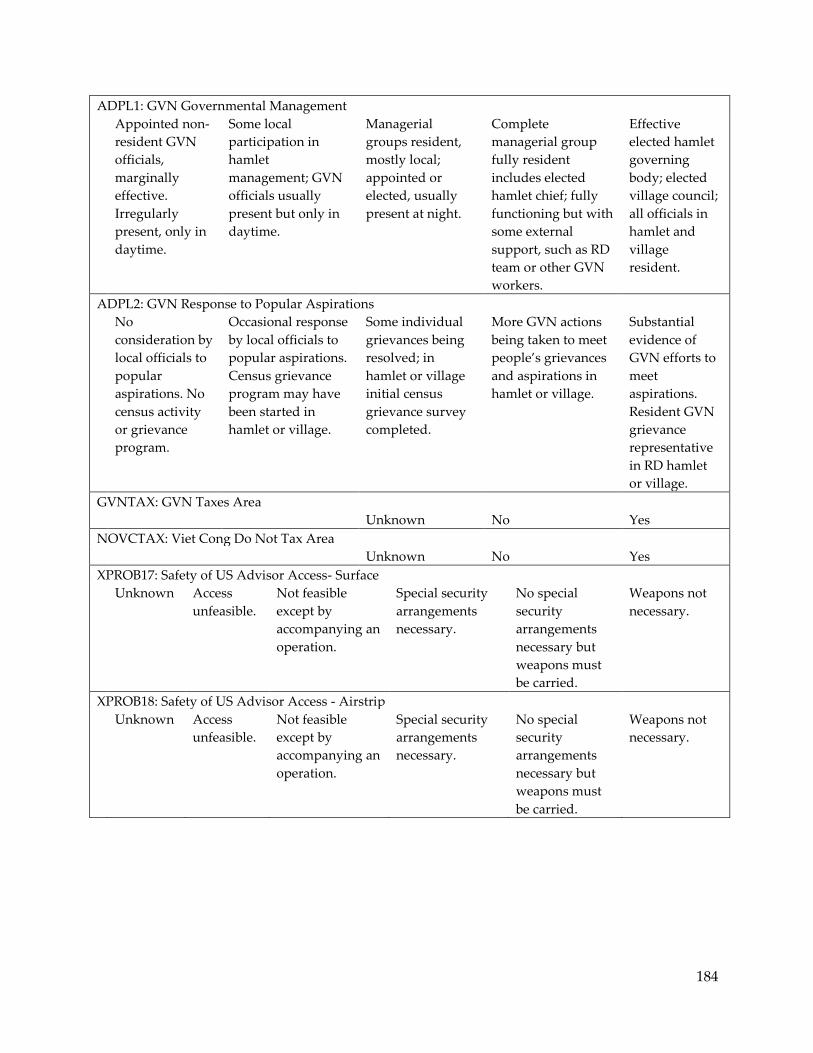
184
ADPL1: GVN Governmental Management
Appointed non-
resident GVN
officials,
marginally
effective.
Irregularly
present, only in
daytime.
Some local
participation in
hamlet
management; GVN
officials usually
present but only in
daytime.
Managerial
groups resident,
mostly local;
appointed or
elected, usually
present at night.
Complete
managerial group
fully resident
includes elected
hamlet chief; fully
functioning but with
some external
support, such as RD
team or other GVN
workers.
Effective
elected hamlet
governing
body; elected
village council;
all officials in
hamlet and
village
resident.
ADPL2: GVN Response to Popular Aspirations
No
consideration by
local officials to
popular
aspirations. No
census activity
or grievance
program.
Occasional response
by local officials to
popular aspirations.
Census grievance
program may have
been started in
hamlet or village.
Some individual
grievances being
resolved; in
hamlet or village
initial census
grievance survey
completed.
More GVN actions
being taken to meet
people’s grievances
and aspirations in
hamlet or village.
Substantial
evidence of
GVN efforts to
meet
aspirations.
Resident GVN
grievance
representative
in RD hamlet
or village.
GVNTAX: GVN Taxes Area
Unknown No Yes
NOVCTAX: Viet Cong Do Not Tax Area
Unknown No Yes
XPROB17: Safety of US Advisor Access- Surface
Unknown Access
unfeasible.
Not feasible
except by
accompanying an
operation.
Special security
arrangements
necessary.
No special
security
arrangements
necessary but
weapons must
be carried.
Weapons not
necessary.
XPROB18: Safety of US Advisor Access - Airstrip
Unknown Access
unfeasible.
Not feasible
except by
accompanying an
operation.
Special security
arrangements
necessary.
No special
security
arrangements
necessary but
weapons must
be carried.
Weapons not
necessary.
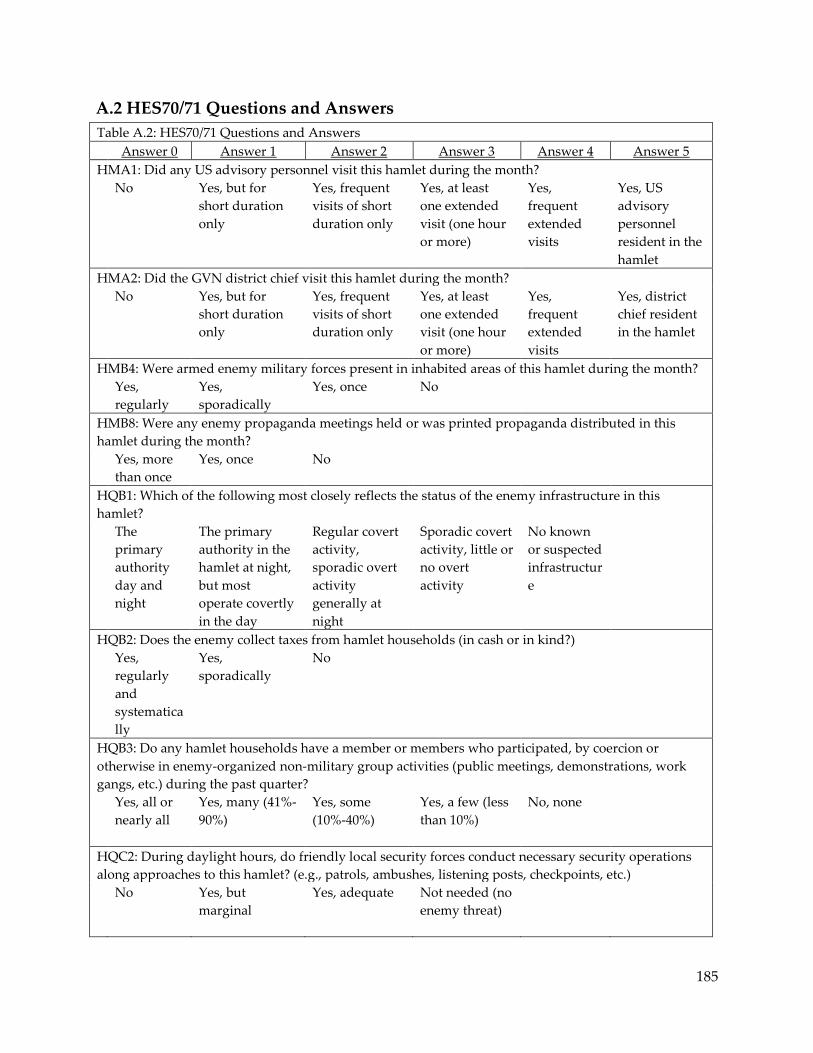
185
A.2 HES70/71 Questions and Answers
Table A.2: HES70/71 Questions and Answers
Answer 0 Answer 1 Answer 2 Answer 3 Answer 4 Answer 5
HMA1: Did any US advisory personnel visit this hamlet during the month?
No Yes, but for
short duration
only
Yes, frequent
visits of short
duration only
Yes, at least
one extended
visit (one hour
or more)
Yes,
frequent
extended
visits
Yes, US
advisory
personnel
resident in the
hamlet
HMA2: Did the GVN district chief visit this hamlet during the month?
No Yes, but for
short duration
only
Yes, frequent
visits of short
duration only
Yes, at least
one extended
visit (one hour
or more)
Yes,
frequent
extended
visits
Yes, district
chief resident
in the hamlet
HMB4: Were armed enemy military forces present in inhabited areas of this hamlet during the month?
Yes,
regularly
Yes,
sporadically
Yes, once No
HMB8: Were any enemy propaganda meetings held or was printed propaganda distributed in this
hamlet during the month?
Yes, more
than once
Yes, once
No
HQB1: Which of the following most closely reflects the status of the enemy infrastructure in this
hamlet?
The
primary
authority
day and
night
The primary
authority in the
hamlet at night,
but most
operate covertly
in the day
Regular covert
activity,
sporadic overt
activity
generally at
night
Sporadic covert
activity, little or
no overt
activity
No known
or suspected
infrastructur
e
HQB2: Does the enemy collect taxes from hamlet households (in cash or in kind?)
Yes,
regularly
and
systematica
lly
Yes,
sporadically
No
HQB3: Do any hamlet households have a member or members who participated, by coercion or
otherwise in enemy-organized non-military group activities (public meetings, demonstrations, work
gangs, etc.) during the past quarter?
Yes, all or
nearly all
Yes, many (41%-
90%)
Yes, some
(10%-40%)
Yes, a few (less
than 10%)
No, none
HQC2: During daylight hours, do friendly local security forces conduct necessary security operations
along approaches to this hamlet? (e.g., patrols, ambushes, listening posts, checkpoints, etc.)
No
Yes, but
marginal
Yes, adequate
Not needed (no
enemy threat)
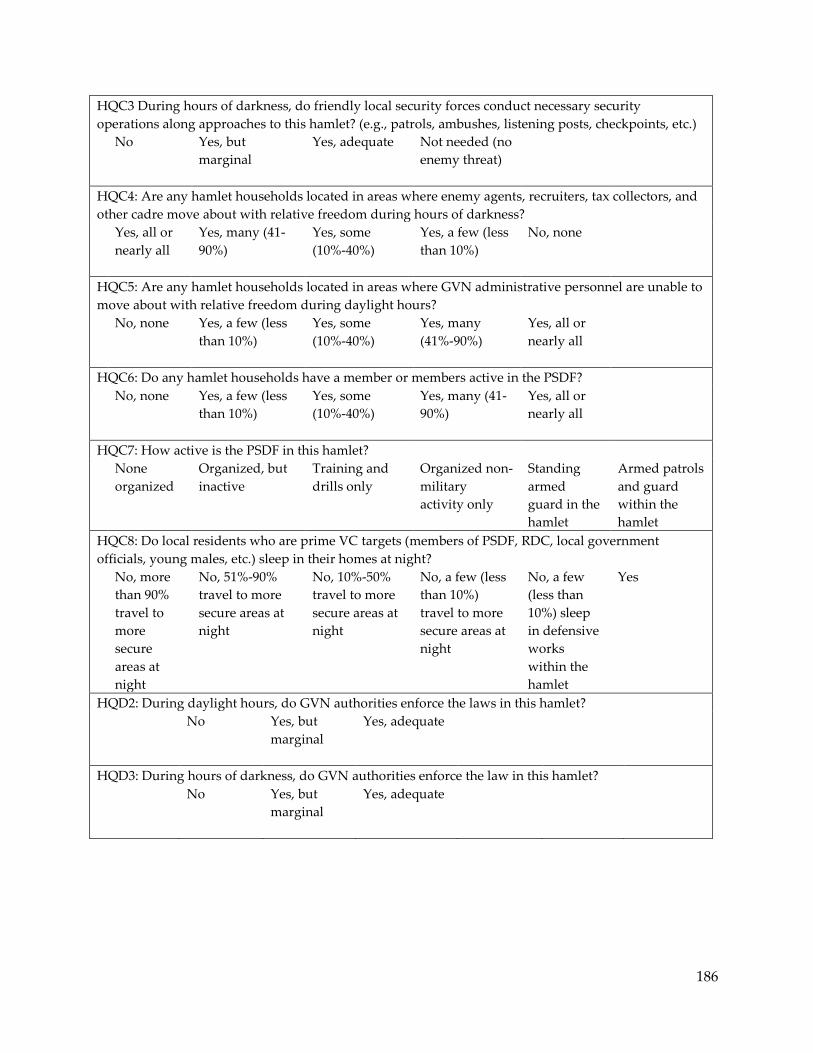
186
HQC3 During hours of darkness, do friendly local security forces conduct necessary security
operations along approaches to this hamlet? (e.g., patrols, ambushes, listening posts, checkpoints, etc.)
No
Yes, but
marginal
Yes, adequate
Not needed (no
enemy threat)
HQC4: Are any hamlet households located in areas where enemy agents, recruiters, tax collectors, and
other cadre move about with relative freedom during hours of darkness?
Yes, all or
nearly all
Yes, many (41-
90%)
Yes, some
(10%-40%)
Yes, a few (less
than 10%)
No, none
HQC5: Are any hamlet households located in areas where GVN administrative personnel are unable to
move about with relative freedom during daylight hours?
No, none
Yes, a few (less
than 10%)
Yes, some
(10%-40%)
Yes, many
(41%-90%)
Yes, all or
nearly all
HQC6: Do any hamlet households have a member or members active in the PSDF?
No, none
Yes, a few (less
than 10%)
Yes, some
(10%-40%)
Yes, many (41-
90%)
Yes, all or
nearly all
HQC7: How active is the PSDF in this hamlet?
None
organized
Organized, but
inactive
Training and
drills only
Organized non-
military
activity only
Standing
armed
guard in the
hamlet
Armed patrols
and guard
within the
hamlet
HQC8: Do local residents who are prime VC targets (members of PSDF, RDC, local government
officials, young males, etc.) sleep in their homes at night?
No, more
than 90%
travel to
more
secure
areas at
night
No, 51%-90%
travel to more
secure areas at
night
No, 10%-50%
travel to more
secure areas at
night
No, a few (less
than 10%)
travel to more
secure areas at
night
No, a few
(less than
10%) sleep
in defensive
works
within the
hamlet
Yes
HQD2: During daylight hours, do GVN authorities enforce the laws in this hamlet?
No
Yes, but
marginal
Yes, adequate
HQD3: During hours of darkness, do GVN authorities enforce the law in this hamlet?
No
Yes, but
marginal
Yes, adequate
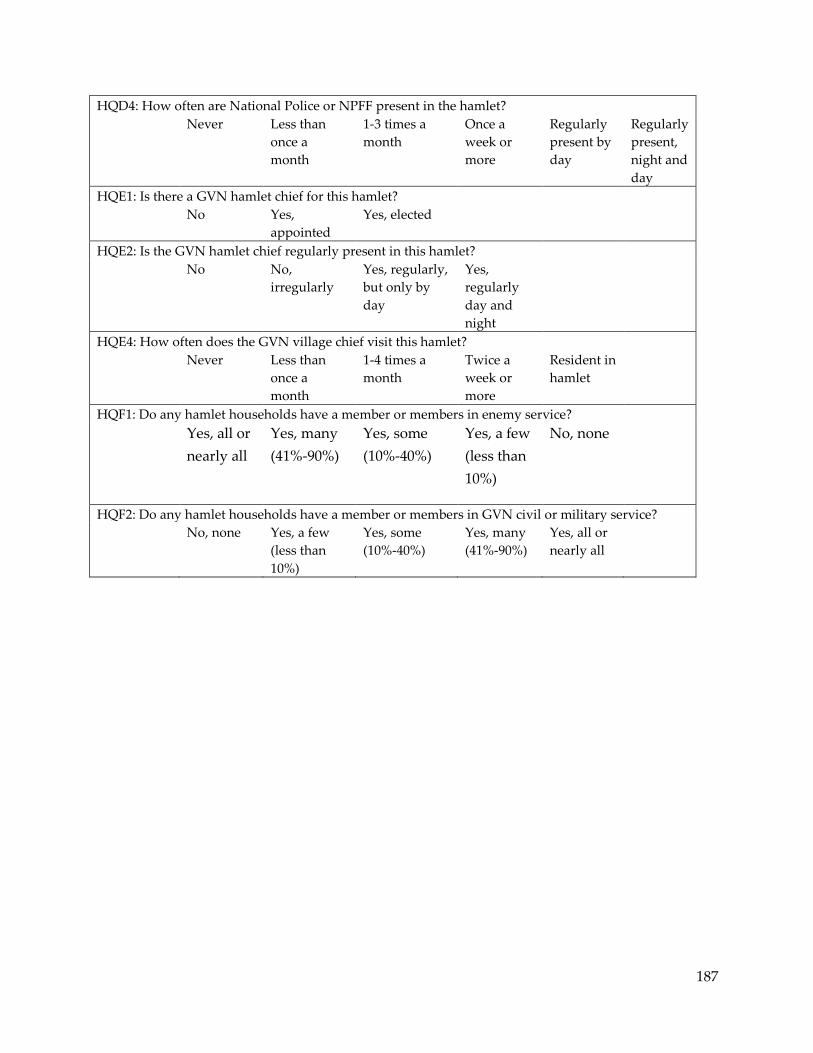
187
HQD4: How often are National Police or NPFF present in the hamlet?
Never
Less than
once a
month
1-3 times a
month
Once a
week or
more
Regularly
present by
day
Regularly
present,
night and
day
HQE1: Is there a GVN hamlet chief for this hamlet?
No
Yes,
appointed
Yes, elected
HQE2: Is the GVN hamlet chief regularly present in this hamlet?
No
No,
irregularly
Yes, regularly,
but only by
day
Yes,
regularly
day and
night
HQE4: How often does the GVN village chief visit this hamlet?
Never Less than
once a
month
1-4 times a
month
Twice a
week or
more
Resident in
hamlet
HQF1: Do any hamlet households have a member or members in enemy service?
Yes, all or
nearly all
Yes, many
(41%-90%)
Yes, some
(10%-40%)
Yes, a few
(less than
10%)
No, none
HQF2: Do any hamlet households have a member or members in GVN civil or military service?
No, none
Yes, a few
(less than
10%)
Yes, some
(10%-40%)
Yes, many
(41%-90%)
Yes, all or
nearly all
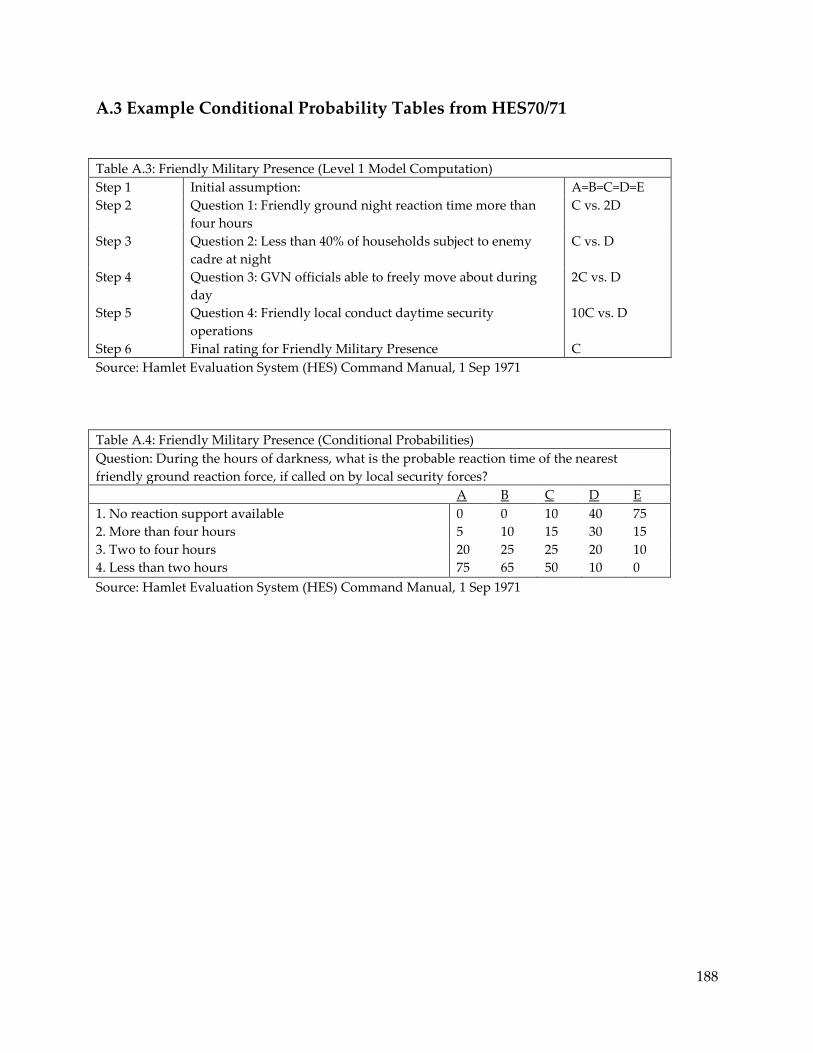
188
A.3 Example Conditional Probability Tables from HES70/71
Table A.3: Friendly Military Presence (Level 1 Model Computation)
Step 1 Initial assumption: A=B=C=D=E
Step 2 Question 1: Friendly ground night reaction time more than
four hours
C vs. 2D
Step 3 Question 2: Less than 40% of households subject to enemy
cadre at night
C vs. D
Step 4 Question 3: GVN officials able to freely move about during
day
2C vs. D
Step 5 Question 4: Friendly local conduct daytime security
operations
10C vs. D
Step 6 Final rating for Friendly Military Presence C
Source: Hamlet Evaluation System (HES) Command Manual, 1 Sep 1971
Table A.4: Friendly Military Presence (Conditional Probabilities)
Question: During the hours of darkness, what is the probable reaction time of the nearest
friendly ground reaction force, if called on by local security forces?
A B C D E
1. No reaction support available 0 0 10 40 75
2. More than four hours 5 10 15 30 15
3. Two to four hours 20 25 25 20 10
4. Less than two hours 75 65 50 10 0
Source: Hamlet Evaluation System (HES) Command Manual, 1 Sep 1971
189
A.3 Proof of Lemma 1
Lemma 1: The government will never choose to allocate resources to indiscriminate
targeting, , when there are still targets available with specific information, .
Proof: Assume it was not the case and there is an equilibrium strategy where and
, and
. The cost of both types of violence are the same by assumption,
so there are two possibilities. First, the probability of correctly targeting an insurgent
with the additional random violence is greater than the cost of that additional random
violence. In that case, ( ) ( ) by assumption which means that additional violence
would provide an even higher expected utility if diverted to informed violence. Thus,
this is not an equilibrium strategy for the government. The second possibility is that the
probability of correctly targeting an insurgent with random violence is lower than the
cost of that additional random violence. In that case, the government would be better
off not committing that additional random violence, and again this is not an
equilibrium strategy. Having exhausted the cases, the proof is complete.
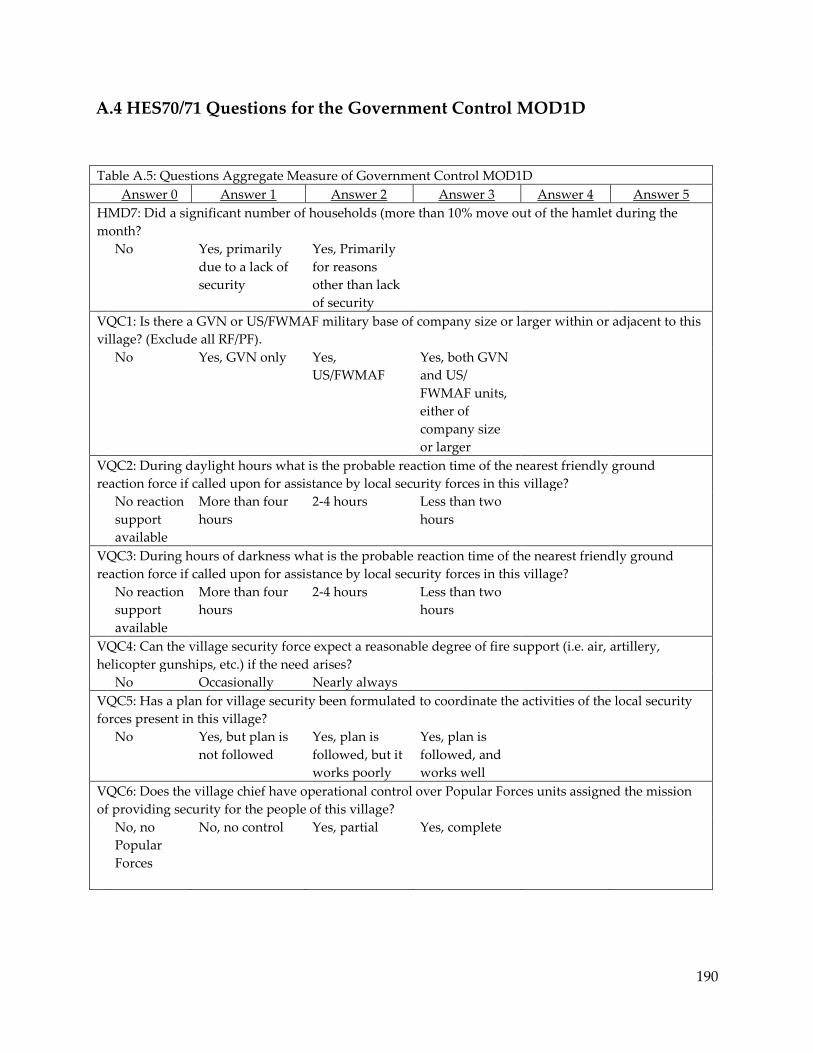
190
A.4 HES70/71 Questions for the Government Control MOD1D
Table A.5: Questions Aggregate Measure of Government Control MOD1D
Answer 0 Answer 1 Answer 2 Answer 3 Answer 4 Answer 5
HMD7: Did a significant number of households (more than 10% move out of the hamlet during the
month?
No Yes, primarily
due to a lack of
security
Yes, Primarily
for reasons
other than lack
of security
VQC1: Is there a GVN or US/FWMAF military base of company size or larger within or adjacent to this
village? (Exclude all RF/PF).
No Yes, GVN only Yes,
US/FWMAF
Yes, both GVN
and US/
FWMAF units,
either of
company size
or larger
VQC2: During daylight hours what is the probable reaction time of the nearest friendly ground
reaction force if called upon for assistance by local security forces in this village?
No reaction
support
available
More than four
hours
2-4 hours Less than two
hours
VQC3: During hours of darkness what is the probable reaction time of the nearest friendly ground
reaction force if called upon for assistance by local security forces in this village?
No reaction
support
available
More than four
hours
2-4 hours Less than two
hours
VQC4: Can the village security force expect a reasonable degree of fire support (i.e. air, artillery,
helicopter gunships, etc.) if the need arises?
No Occasionally Nearly always
VQC5: Has a plan for village security been formulated to coordinate the activities of the local security
forces present in this village?
No
Yes, but plan is
not followed
Yes, plan is
followed, but it
works poorly
Yes, plan is
followed, and
works well
VQC6: Does the village chief have operational control over Popular Forces units assigned the mission
of providing security for the people of this village?
No, no
Popular
Forces
No, no control
Yes, partial
Yes, complete
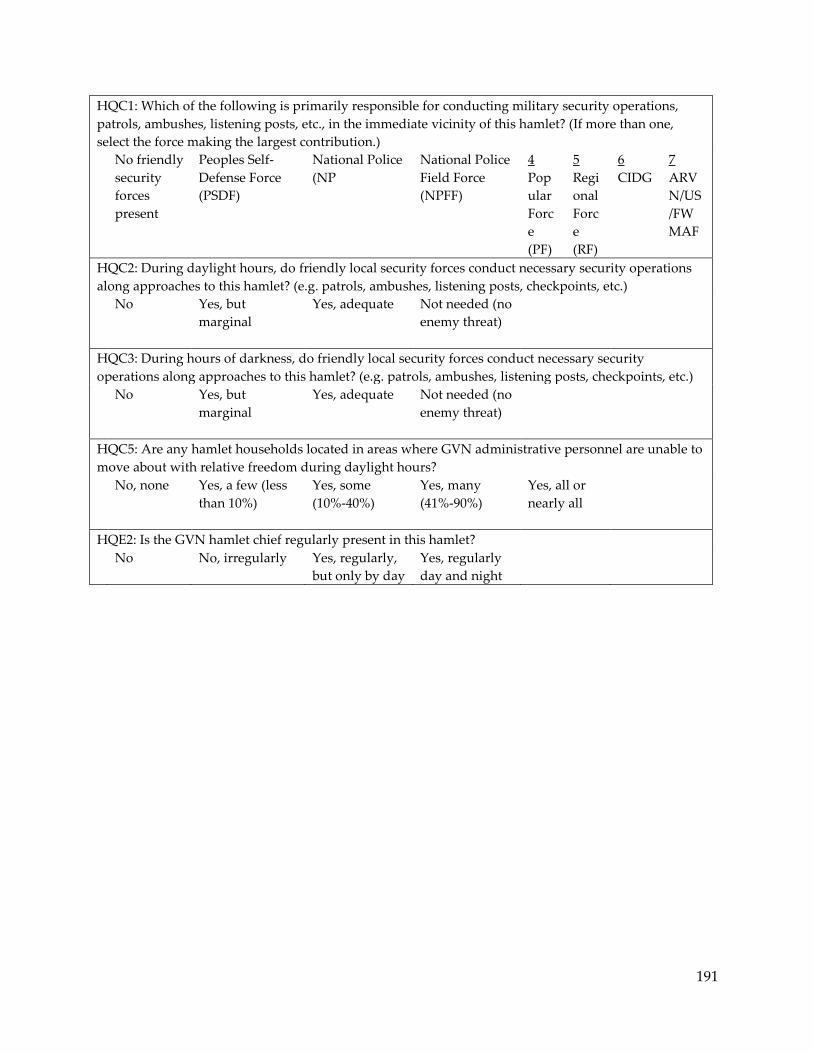
191
HQC1: Which of the following is primarily responsible for conducting military security operations,
patrols, ambushes, listening posts, etc., in the immediate vicinity of this hamlet? (If more than one,
select the force making the largest contribution.)
No friendly
security
forces
present
Peoples Self-
Defense Force
(PSDF)
National Police
(NP
National Police
Field Force
(NPFF)
4
Pop
ular
Forc
e
(PF)
5
Regi
onal
Forc
e
(RF)
6
CIDG
7
ARV
N/US
/FW
MAF
HQC2: During daylight hours, do friendly local security forces conduct necessary security operations
along approaches to this hamlet? (e.g. patrols, ambushes, listening posts, checkpoints, etc.)
No
Yes, but
marginal
Yes, adequate
Not needed (no
enemy threat)
HQC3: During hours of darkness, do friendly local security forces conduct necessary security
operations along approaches to this hamlet? (e.g. patrols, ambushes, listening posts, checkpoints, etc.)
No
Yes, but
marginal
Yes, adequate
Not needed (no
enemy threat)
HQC5: Are any hamlet households located in areas where GVN administrative personnel are unable to
move about with relative freedom during daylight hours?
No, none
Yes, a few (less
than 10%)
Yes, some
(10%-40%)
Yes, many
(41%-90%)
Yes, all or
nearly all
HQE2: Is the GVN hamlet chief regularly present in this hamlet?
No
No, irregularly
Yes, regularly,
but only by day
Yes, regularly
day and night

192
A.5 HES70/71 Questions for Rebel Control MOD1A
Table A.6: Questions Included in Aggregate Measure of Rebel Control MOD1A
Answer 0 Answer 1 Answer 2 Answer 3 Answer 4 Answer 5
VMB2: During the month, was the main surface route leading from this village to the province capital
open during daylight hours?
No Yes, but regular
enemy
harassment or
taxation
Yes, sporadic
enemy
harassment or
taxation
Yes, no enemy
harassment or
taxation
HMB1: Do enemy forces physically control this hamlet?
No Yes Yes, defensive
works have
been
constructed by
enemy forces to
establish a
“combat
hamlet”
HQC4: Are any hamlet households located in areas where enemy agents, recruiters, tax collectors, and
other cadre move about with relative freedom during hours of darkness?
Yes, all or
nearly all
Yes, many (41-
90%)
Yes, some (10-
40%
Yes, a few (less
than 10%)
No, none
VQB2: What is the estimated size of the village guerilla unit regularly present in this village? (Do not
include local or main force units.)
None Less than a
squad
About a squad About a
platoon
More than a
platoon
VQB3: What is the estimated size of the largest enemy main or local force unit regularly present in this
village or adjacent villages?
None Less than a
platoon
About a
platoon
About a
company
A battalion
or more
VQB4: Are there areas in or adjacent to this village which enemy forces use as assembly areas for
operations against friendly activities in this general area?
No
Yes, temporary
havens
Yes, small base
areas
Yes, major base
areas
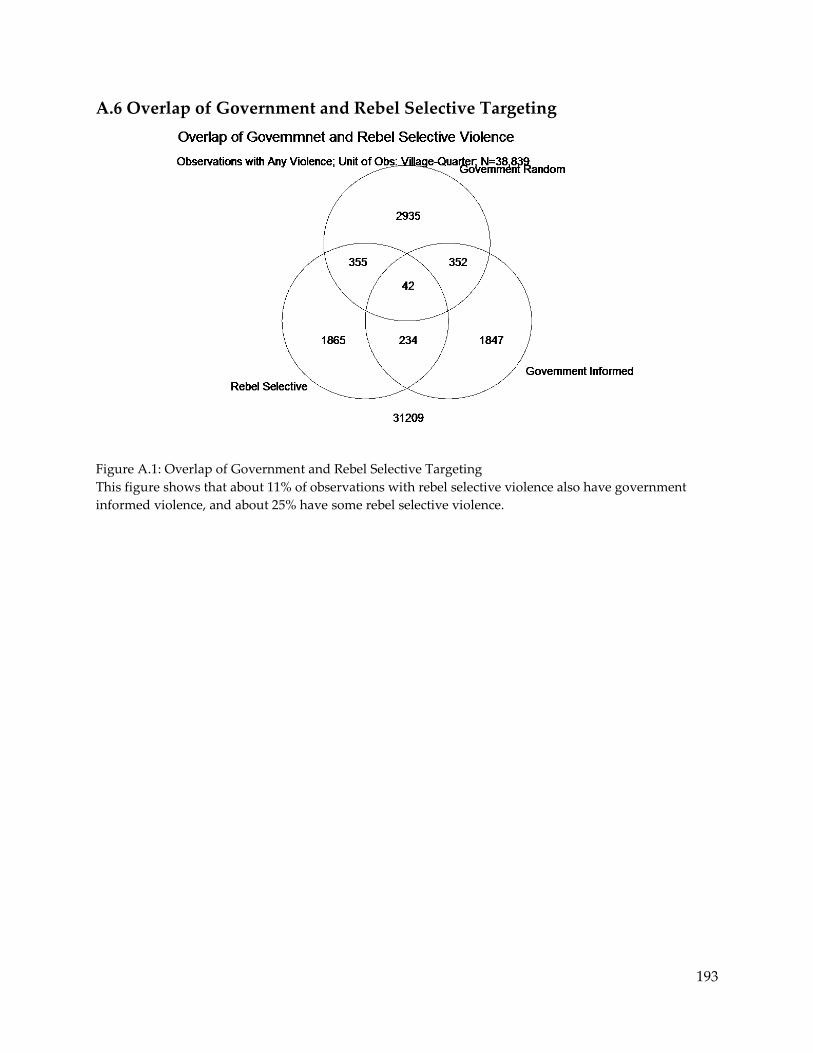
193
A.6 Overlap of Government and Rebel Selective Targeting
Figure A.1: Overlap of Government and Rebel Selective Targeting
This figure shows that about 11% of observations with rebel selective violence also have government
informed violence, and about 25% have some rebel selective violence.
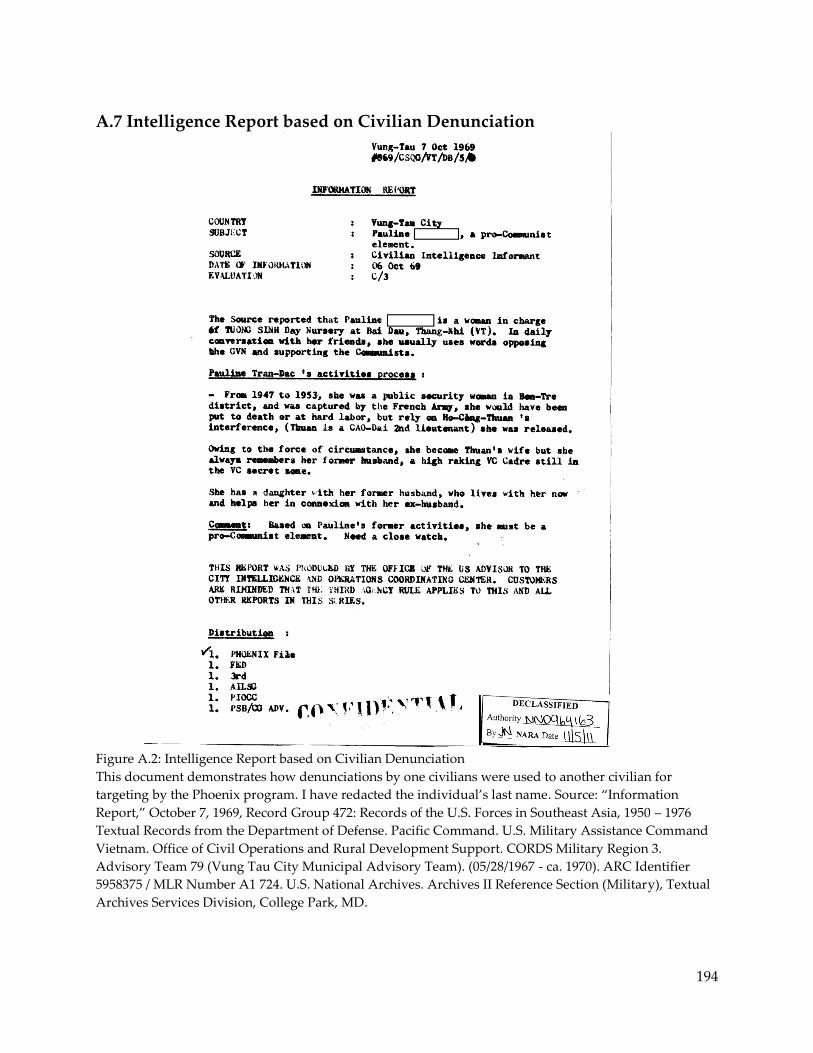
194
A.7 Intelligence Report based on Civilian Denunciation
Figure A.2: Intelligence Report based on Civilian Denunciation
This document demonstrates how denunciations by one civilians were used to another civilian for
targeting by the Phoenix program. I have redacted the individual’s last name. Source: “Information
Report,” October 7, 1969, Record Group 472: Records of the U.S. Forces in Southeast Asia, 1950 – 1976
Textual Records from the Department of Defense. Pacific Command. U.S. Military Assistance Command
Vietnam. Office of Civil Operations and Rural Development Support. CORDS Military Region 3.
Advisory Team 79 (Vung Tau City Municipal Advisory Team). (05/28/1967 - ca. 1970). ARC Identifier
5958375 / MLR Number A1 724. U.S. National Archives. Archives II Reference Section (Military), Textual
Archives Services Division, College Park, MD.
195
References
Achen, Christopher H. 1986. Statistical Analysis of Quasi-Experiments. University of California
Press.
Adams, Sam. 1994. War of Numbers: An Intelligence Memoir. South Royalton, VT: Steerforth Press.
---. 1995. New Spies: Exploring the Frontiers of Espionage. Random House UK.
Ahern, Thomas L. 2009. Vietnam Declassified: The CIA and Counterinsurgency. University Press of
Kentucky.
Akerlof, George. 1970. “The Market for ‘Lemons’: Quality Uncertainty and the Market
Mechanism.” The Quarterly Journal of Economics 84(3): 488–500.
Akerlof, G., and J. Yellen. 1994. “Gang Behavior, Law Enforcement, and Community Values.” In
Values and Public Policy, eds. Henry Aaron, Thomas Mann, and Taylor Timothy.
Washington, D.C.: Brookings.
Andersen, E.B. 1983. “A general latent structure model for contingency table data.” In Principals
of modern psychological measurement, Hillsdale, NJ: Erlbaum, p. 117–138.
Anderson, David M., and David Killingray, eds. 1992. Policing and Decolonisation: Nationalism,
Politics and the Police, 1917-1965. Manchester: Manchester University Press.
Andradé, Dale. 1990. Ashes to ashes: the Phoenix program and the Vietnam War. Lexington Books.
Annan, Jeannie, Christopher Blattman, and Roger Horton. 2006. The State of Youth and Youth
Protection in Northern Uganda: Findings from the Survey for War Affected Youth. UNICEF
Uganda.
196
Annan, Jeannie, Christopher Blattman, Khristopher Carlson, and Dyan Mazurana. 2007.
“Making Reintegration Work for Youth in Northern Uganda.” Survey of War Affected
Youth.
Arjona, Ana M., and Stathis N. Kalyvas. 2008. “Rebelling Against Rebellion: Comparing
Insurgent and Counterinsurgent Recruitment.” In Center for Research on Inequality,
Human Security and Ethnicity.
Army, United States. Dept. of the, United States. Marine Corps, and John A. Nagl. 2007. The U.S.
Army/Marine Corps counterinsurgency field manual: U.S. Army field manual no. 3-24 : Marine
Corps warfighting publication no. 3-33.5. University of Chicago Press.
Baer, Katherine, and Eric Le Borgne. 2008. Tax Amnesties: Theory, Trends, and Some Alternatives.
International Monetary Fund.
Bairdain, Ernest F, and Edith M Bairdain. 1970. Vol. 1 Psychological Operations Studies--Vietnam.
Volume 1. McLean, VA: Human Sciences Research Inc.
Baker, Frank B. 2001. The Basics of Item Response Theory. 2nd ed. ERIC Clearinghouse on
Assessment and Evaluation.
Balcells, Laia. 2010. “Rivalry and Revenge: Violence against Civilians in Conventional Civil
Wars.” International Studies Quarterly 54(2): 291–313.
---. 2011. “Continuation of Politics by Two Means: Direct and Indirect Violence in Civil War.”
Journal of Conflict Resolution 55(3): 397 –422.
Barron, Patrick, Kai Kaiser, and Menno Pradhan. 2004. “Local conflict in Indonesia: Measuring
incidence and identifying patterns.” The World Bank Policy Research Working Paper–3384.
197
Bates, Douglas, and Deepayan Sarkar. 2007. “lme4: Linear mixed-effects models using S4
classes.” In R package version,.
Battaglini, Marco. 2002. “Multiple Referrals and Multidimensional Cheap Talk.” Econometrica
70(4): 1379–1401.
Benmelech, Efraim, Claude Berrebi, and Esteban Klor. 2010. “Counter-Suicide-Terrorism:
Evidence from House Demolitions.” National Bureau of Economic Research Working Paper
Series No. 16493.
Benoit, Charles. 1970. Coversations with Rural Vietnamese. Santa Monica, CA: Rand.
Berck, Peter, and Jonathan Lipow. 2010. “Did Monetary Forces Help Turn the Tide in Iraq?”
Defense & Security Analysis 26(2): 181–188.
Bergerud, Eric M. 1993. Dynamics of Defeat: The Vietnam War in Hau Nghia Province. Westview
Press.
Berman, Eli. 2000. “Sect, Subsidy, and Sacrifice: An Economist’s View of Ultra-Orthodox Jews.”
The Quarterly Journal of Economics 115(3): 905–953.
---. 2009. Radical, religious, and violent: the new economics of terrorism. MIT Press.
---. 2011. “‘Hearts, Minds’ & Development: Recent Research Challenges the Model.”
Berman, Eli, and David Laitin. 2008. “Religion, terrorism and public goods: Testing the club
model.” Journal of Public Economics 92(10-11): 1942–1967.
Berman, Eli, Michael Callen, Joseph H. Felter, and Jacob N. Shapiro. 2011. “Do Working Men
Rebel? Insurgency and Unemployment in Afghanistan, Iraq, and the Philippines.”
Journal of Conflict Resolution 55(4): 496 –528.
198
Berman, Paul. 1974. Revolutionary organization : institution-building within the People’s Liberation
Armed Forces. Lexington Mass.: Lexington Books.
Bhavnani, Ravi, Dan Miodownik, and Hyun Jin Choi. 2011. “Three Two Tango: Territorial
Control and Selective Violence in Israel, the West Bank, and Gaza.” Journal of Conflict
Resolution 55(1): 133 –158.
Biddle, Stephen, and Stephen Long. 2004. “Democracy and Military Effectiveness: A Deeper
Look.” The Journal of Conflict Resolution 48(4): 525–546.
Black, Robert W. 2003. A Ranger Born. Random House Digital, Inc.
Blattman, Christopher, and Edward Miguel. 2010. “Civil War.” Journal of Economic Literature
48(1): 3–57.
Blood, Jake. 2005. The Tet effect: intelligence and the public perception of war. Psychology Press.
Bonsignore, Ezio, David Eshel, and Richard Garland. 2006. “Countering the IED Threat.”
Military Technology 30(6): 108.
Borjas, G.J., and G.T. Sueyoshi. 1994. “A two-stage estimator for probit models with structural
group effects.” Journal of Econometrics 64: 165–182.
Borrego, M. E.P, A. V Ballén, and Y. L Percipiano. 2003. Diagnóstico del programa de reinserción en
Colombia: mecanismos para incentivar la desmovilización voluntaria individual. DNP.
Bradley, Efron. 1982. The Jackknife, the Bootstrap and Other Resampling Plans. Philadelphia, PA:
Society for Industrial and Applied Mathematics.
Braithwaite, Alex. 2010. “Resisting infection: How state capacity conditions conflict contagion.”
Journal of Peace Research 47(3): 311–319.
199
Brandt, Patrick T, and Todd Sandler. 2012. “A Bayesian Poisson Vector Autoregression Model.”
Political Analysis.
Brück, Tilman, Patricia Justino, Philip Verwimp, and Alexandra Avdeenko. 2010. Identifying
conflict and violence in micro-level surveys. Bonn: Institute for the Study of Labor. Technical
report.
Buhaug, H., and P. Lujala. 2005. “Accounting for scale: Measuring geography in quantitative
studies of civil war.” Political Geography 24: 399–418.
Bullington, J.R. 2012. “Assessing Pacification in Vietnam: We Won the Counterinsurgency
War!” Small Wars Journal.
Burnham, Gilbert M. 2008. “Violence-related mortality in Iraq, 2002-2006.” The New England
Journal of Medicine 359(4): 431–434.
Burnham, Gilbert M., Riyadh Lafta, Shannon Doocy, and Les Roberts. 2006. “Mortality after the
2003 invasion of Iraq: A cross-sectional cluster sample survey.” The Lancet 368: 1421–
1428.
Carrier, J.M. 1966. Viet Cong Motivation and Morale: The Special Case of Chieu Hoi. Santa Monica,
CA: Rand.
---. 1968. A profile of Viet Cong returnees July 1965 to June 1967. Santa Monica, CA: Rand.
Chandler, Robert W. 1981. War of ideas: The U.S. propaganda campaign in Vietnam. Westview
Press.
Chen, D., and J. Horton. 2011. “The Deterrent Effect of the Deatlh Penalty? Evidence from
British Commutations During World War I.” Working paper.
200
Choi, Seung W., Laura E. Gibbons, and Paul K. Crane. 2011. “lordif: An R Package for
Detecting Differential Item Functioning Using Iterative Hybrid Ordinal Logistic
Regression/Item Response Theory and Monte Carlo Simulations.” Journal of Statistical
Software 39(8): 1–30.
Clinton, Joshua D., and John S. Lapinski. 2006. “Measuring Legislative Accomplishment, 1877-
1994.” American Journal of Political Science 50(1): 232–249.
Clinton, Joshua D., and David E. Lewis. 2008. “Expert Opinion, Agency Characteristics, and
Agency Preferences.” Political Analysis 16: 3–20.
Clodfelter, Micheal. 1995. Vietnam in military statistics: A history of the Indochina wars, 1772-1991.
Jefferson, N.C.: McFarland & Co.
Colby, William Egan, and James McCargar. 1989. Lost victory: a firsthand account of America’s
sixteen-year involvement in Vietnam. Contemporary Books.
Colletta, Nat J., Markus Kostner, and Ingo Wiederhofer. 1996. Case studies in war-to-peace
transition: the demobilization and reintegration of ex-combatants in Ethiopia, Namibia, and
Uganda. World Bank Publications.
Collier, P. 2007. “Economic Causes of Civil Conflict and their Implications for Policy.” In Leasing
the Dogs of War: Conflict Management in a Divided World, eds. Chester A. Crocker, Fen
Osler Hampson, and Pamela Aall. United States Institute of Peace.
Collier, P., and A. Hoeffler. 1998. “On economic causes of civil war.” Oxford economic papers
50(4): 563.
Comber, Leon. 2008. Malaya’s secret police 1945-60: the role of the Special Branch in the Malayan
Emergency. Institute of Southeast Asian Studies.
201
Condra, Luke N., and Jacob N. Shapiro. 2012. “Who Takes the Blame? The Strategic Effects of
Collateral Damage.” American Journal of Political Science 56(1): 167–187.
Condra, Luke N., Joseph H. Felter, Radha K. Iyengar, and Jacob N. Shapiro. 2010. “The Effect of
Civilian Casualties in Afghanistan and Iraq.” National Bureau of Economic Research
Working Paper Series No. 16152.
Connable, Ben. 2012. Embracing the Fog of War: Assessment and Metrics in Counterinsurgency. Santa
Monica, CA: Rand.
Connable, Ben, and Martin C. Libicki. 2010. How Insurgencies End. Rand.
Cooper, Chester L, Judith E Corson, Laurence J Legere, David E Lockwood, and Donald M
Weller. 1972. Volume 3: History of Pacification. The American Experience with Pacification
in Vietnam. Arlington, VA: Institute for Defense Analysis.
Cordesman, Anthony H. 2012. The need to refocus Afghan metrics and narratives on key local areas
and population centers. Center for Strategic & International Studies.
Cordesman, Anthony H., Emma R. Davies, and Center for Strategic and International Studies
(Washington D.C.). 2008. Iraq’s insurgency and the road to civil conflict. Greenwood
Publishing Group.
Costa, Dora L., and Matthew E. Kahn. 2008. Heroes & Cowards: The Social Face of War. Princeton:
Princeton University Press.
Cunningham, David E. 2011. Barriers to Peace in Civil War. Cambridge University Press.
Daddis, Gregory A. 2011. No Sure Victory: Measuring U.S. Army Effectiveness and Progress in the
Vietnam War. Oxford University Press.
202
Darby, J., and J. Rae. 1999. “Peace Processes from 1988–1998: Changing Patterns.” Ethnic Studies
Report 18(1): 45–59.
Davenport, Christian, and Allan C. Stam. 2009. “What Really Happened in Rwanda?” Miller-
McCune. http://www.psmag.com/politics/what-really-happened-in-rwanda-3432/
(August 18, 2012).
Davis, John H. 1994. Mafia Dynasty: The Rise and Fall of the Gambino Crime Family. HarperCollins.
Davison, W. Phillips. 1972. User’s Guide to the Rand Interviews in Vietnam. Santa Monica, CA:
Rand.
De Boeck, Paul, and Ivailo Partchev. 2012. “IRTrees: Tree-Based Item Response Models of the
GLMM Family.” Journal of Statistical Software - Code Snippets 48(1): 1–28.
de Posada, Cristina Villegas. 2009. “Motives for the Enlistment and Demobilization of Illegal
Armed Combatants in Colombia.” Peace and Conflict: Journal of Peace Psychology 15(3):
263.
de Sola Pool, Ithiel, Gordon Fowler, Peter McGrath, and Richard Peterson. 1968. Hamlet
Evaluation System Study. Cambridge, MA: Simulmatics Corporation.
DeForest, Orrin, and David Chanoff. 1991. Slow Burn. Pocket Books.
DeMars, Christine E. 2004. “Detection of Item Parameter Drift over Multiple Test
Administrations.” Applied Measurement in Education 17(3): 265–300.
Do, Q.T., and L. Iyer. 2007. “Poverty, Social Divisions and Conflict in Nepal.” World Bank Policy
Research Working Paper–4228.
Dollard, John. 1943. Fear in Battle. New Haven: Institute of Human Relations, Yale University.
203
Donnell, John C., and Charles A. Joiner. 1967. “South Vietnam: ‘Struggle’ Politics and the Bigger
War.” Asian Survey 7(1): 53–68.
Doran, H., D. Bates, P. Bliese, and M. Dowling. 2007. “Estimating the Multilevel Rasch Model:
With Ime4 Package.” Journal of Statistical Software 20.
Downes-Martin, Stephen. 2011. “Operations Assessment in Afghanistan Is Broken: What Is to
Be Done?” Naval War College Review 64(4): 103–125.
Downes, Alexander. 2007. “Draining the sea by filling the graves: investigating the effectiveness
of indiscriminate violence as a counterinsurgency strategy.” Civil Wars 9(4): 420.
---. 2008. Targeting civilians in war. Cornell University Press.
Dube, O., and J. Vargas. 2011. “Commodity price shocks and civil conflict: Evidence from
Colombia.” Working paper.
Eck, Kristine, and Lisa Hultman. 2007. “One-Sided Violence Against Civilians in War.” Journal
of Peace Research 44(2): 233 –246.
Eck, Kristine. 2010. “Raising Rebels: Participation and Recruitment in Civil War.” Dissertation.
Uppsala University.
Elliott, David W. P. 2003. The Vietnamese war: revolution and social change in the Mekong Delta,
1930-1975. M.E. Sharpe.
Enterline, Andrew J., J. Michael Greig, and Yoav Gortzak. 2008. “Testing Shinseki: Speed, Mass
& Insurgency in Postwar Iraq.” Working paper.
Fearon, J. D. 1995. “Rationalist explanations for war.” International Organization 49(03): 379–414.
Fearon, J.D., and D.D. Laitin. 2003. “Ethnicity, insurgency, and civil war.” American Political
Science Review 97(1): 75–90.
204
Fearon, James D. 1997. “Signaling Foreign Policy Interests: Tying Hands versus Sinking Costs.”
The Journal of Conflict Resolution 41(1): 68–90.
---. 2008. “Economic development, insurgency, and civil war.” In Institutions and Economic
Performance, ed. Elhanan Helpman. Cambridge: Harvard University Press, p. 292–328.
Finch, Holmes. 2008. “Estimation of Item Response Theory Parameters in the Presence of
Missing Data.” Journal of Educational Measurement 45(3): 225–245.
Fischer, G.H. 1974. Einführung in die Theorie psychologischer Tests: Grundlagen und Anwen- dungen.
H. Huber.
---. 1977. “Some probabilistic models for measuring change.” In Mathematical models for social
psychology, Berne: Huber, p. 102–151.
---. 1989. “An IRT-based model for dichotomous longitudinal data.” Psychometrika 52: 599–624.
---. 1995. “Linear logistic models for change.” In Rasch models. Foundations, Recent developments,
and Applications, New York: Springer, p. 157–181.
Fischer, G.H., and I. Ponocny. 1994. “An Extension of the Partial Credit Model with an
Application to the Measurement of Change.” Psychometrika 59: 177–192.
Flynn, Michael T., Matt Pottinger, and Paul D. Batchelor. 2010. Fixing Intel: A Blueprint for
Making Intelligence Relevant in Afghanistan. Center for New American Security.
Fortna, Virginia Page. 2008. Does Peacekeeping Work?: Shaping Belligerents’ Choices After Civil War.
Princeton: Princeton University Press.
French, AW, and TR Miller. 1996. “Logistic Regression and Its Use in Detecting Differential Item
Functioning in Polytomous Items.” Journal of Educational Measurement 33: 315–332.

205
Galula, David. 1964. Counterinsurgency warfare: theory and practice. Greenwood Publishing
Group.
Gambetta, Diego. 1996. The Sicilian Mafia: The Business of Private Protection. Harvard University
Press.
Gates, Scott. 2002. “Recruitment and Allegiance: The Microfoundations of Rebellion.” The
Journal of Conflict Resolution 46(1): 111–130.
Gayvert, David. 2010. “Teaching New Dogs Old Tricks: Can the Hamlet Evaluation System
Inform the Search for Metrics in Afghanistan?” Small Wars Journal.
Gelman, Andrew, Jeffrey Fagan, and Alex Kiss. 2007. “An Analysis of the New York City Police
Department’s ‘Stop-and-Frisk’ Policy in the Context of Claims of Racial Bias.” Journal of
the American Statistical Association 102: 813–823.
Giap, Vo Nguyen. 1962. People’s War People’s Army: The Viet Cong Insurrection Manual for
Underdeveloped Countries. Reprint: University Press of the Pacific, 2001.
Glas, C.A.W. 1989. “Contributions to estimating and testing Rasch models.” Doctoral
dissertation. University of Twente, Department of Education.
---. 1992. “A Rasch model with a multivariate distribution of ability.” In Objective measurement:
Theory into practice, Norwood, NJ: Ablex, p. 236–258.
Glas, C.A.W., and J.L. Pimentel. 2008. “Modeling Nonignorable Missing Data in Speeded Tests.”
Educational and Psychological Measurement 68: 907–922.
Glassmyer, Katherine, and Nicholas Sambanis. 2008. “Rebel—Military Integration and Civil
War Termination.” Journal of Peace Research 45(3): 365 –384.
206
Goldstein, H.A.R.V. 1983. “Measuring changes in educational attainment over time: problems
and possibilities.” Journal of Educational Measurement 20(4): 369–377.
Gons, Eric, Jonathan Schroden, Ryan McAlinden, Marcus Gaul, and Bret Van Poppel. 2012.
“Challenges of measuring progress in Afghanistan using violence trends: the effects of
aggregation, military operations, seasonality, weather, and other causal factors.” Defense
& Security Analysis 28(2): 100–113.
Goodwin, Jeff. 2001. No Other Way Out: States and Revolutionary Movements, 1945-1991.
Cambridge, MA: Cambridge University Press.
---. 2006. “A Theory of Categorical Terrorism.” Social Forces 84(4): 2027–2046.
Goure, Leon. 1968. Inducements and Deterrents to Defection: An Analysis of the Motives of 125
Defectors. Santa Monica, CA: Rand.
Grinter, Lawrence E. 1967. Amensty in South Viet Nam: An Analysis of the Chieu Hoi (Open Arms)
Program in the Republic of Viet Nam. Simulmatics Corporation.
Guichaoa, Yvan. 2007. “Who joins ethnic militas? A survey of the Oodua people’s congress in
south-western Nigeria.” Crise Working Paper (44).
Gurtov, Melvin, and Konrad Kellen. 1969. “Vietnam: Lessons and Mislessons.” Rand.
Gutiérrez Sanín, Francisco. 2008. “Telling the Difference: Guerrillas and Paramilitaries in the
Colombian War.” Politics & Society 36(1): 3 –34.
Haebara, T. 1980. “Equating logistic ability scales by a weighted least squares method.” Japanese
Psychological Research 22: 144–149.
Hamoumou, Mohand. 1993. Et ils sont devenus harkis. Paris: Fayard.
207
Han, Kyung T., Craig S. Wells, and Stephen G. Sireci. 2012. “The Impact of Multidirectional
Item Parameter Drift on IRT Scaling Coefficients and Proficiency Estimates.” Applied
Measurement in Education 25: 97–117.
Hanson, B.A., and A.A. Béguin. 2002. “Obtaining a common scale for item response theory item
parameters using separate versus concurrent estimation in the common-item equating
design.” Applied Psychological Measurement 26: 3–24.
Hanson, Victor Davis. 1999. The Soul of Battle: From Ancient Times to the Present Day, How Three
Great Liberators Vanquished Tyranny. New York: Anchor Books.
Hanushek, Eric A. 1974. “Efficient Estimators for Regressing Regression Coefficients.” American
Statistician 28: 66–67.
Hatzinger, Reinhold, and Thomas Rusch. 2009. “IRT models with relaxed assumptions in eRm:
A manual-like instruction.” Psychology Science Quarterly 51(1): 87–120.
Hechter, Michael. 1988. Principles of Group Solidarity. University of California Press.
Hegre, Håvard, Gudrun Østby, and Clionadh Raleigh. 2009. “Poverty and Civil War Events.”
Journal of Conflict Resolution 53(4): 598 –623.
Herrington, Stuart A. 1987. Silence Was a Weapon: The Vietnam War in the Villages. Random
House.
Hirschman, Charles, Samuel Preston, and Vu Manh Loi. 1995. “Vietnamese Casualties During
the American War: A New Estimate.” Population and Development Review 21(4): 783–812.
Hoijtink, H. 1995. “On person parameter estimation on the dichotomous Rasch model.” In Rasch
models: Foundations, recent developments, and applications, New York: Springer, p. 53–68.
Holland, P.W., and D.B. Rubin. 1982. Test Equating. New York: Academic Press, Inc.
208
Hosmer, Stephen T. 1970. Viet Cong Repression and Its Implications for the Future. Santa Monica,
CA: Rand.
Huber, J.D., G. Kernell, and E.L. Leoni. 2005. “Institutional Context, Cognitive Resources and
Party Attachments Across Democracies.” Political Analysis 13: 365–386.
Humphreys, Macartan, and Jeremy Weinstein. 2005. “Disentangling the Determinants of
Successful Demobilization and Reintegration.” In annual meeting of the American Political
Science Association, Washington, DC,.
---. 2006. “Handling and manhandling civilians in civil war.” American Political Science Review
100(03): 429–447.
---. 2008. “Who fights? The determinants of participation in civil war.” American Journal of
Political Science 52(2): 436–455.
Hunt, David. 1974. “Villagers at War: The National Liberation Front In My Tho Province, 1965-
1967.” Radical America 8(1-2).
Hunt, Ira Augustus. 2010. The 9th Infantry Division in Vietnam: Unparalleled and Unequaled.
Lexington, KY: University Press of Kentucky.
Hunt, Richard A. 1998. Pacification: The American Struggle For Vietnam’s Hearts And Minds.
Westview Press.
Hutchinson, Martha Crenshaw. 1972. “The Concept of Revolutionary Terrorism.” The Journal of
Conflict Resolution 16(3): 383–396.
Imai, Kosuke. 2010. “Identification, Inference and Sensitivity Analysis for Causal Mediation
Effects.” Statistical Science 25(1): 51–71.
209
Imai, Kosuke, Luke Keele, Dustin Tingley, and Teppei Yamamoto. 2010 “Causal Mediation
Analysis Using R.” In Advances in Social Science Research Using R, Lecture Notes in
Statistics, ed. Hrishikesh D. Vinod. Springer New York, p. 129–154.
---. 2011. “Unpacking the Black Box of Causality: Learning about Causal Mechanisms from
Experimental and Observational Studies.” American Political Science Review 105(4): 765–
789.
International Security Assistance Force. 2010. “ISAF Joint Command District Assessments
100408.” http://info.publicintelligence.net/ISAFdistrictassessments.pdf (August 18, 2012).
Iyengar, Radha, Jonathan Monten, and Matthew Hanson. 2011. “Building Peace: The Impact of
Aid on the Labor Market for Insurgents.” National Bureau of Economic Research Working
Paper Series No. 17297.
Jacobson, Daniel, and Edward H. Kaplan. 2007. “Suicide Bombings and Targeted Killings in
(Counter-) Terror Games.” Journal of Conflict Resolution 51(5): 772 –792.
http://jcr.sagepub.com/content/51/5/772.abstract (January 24, 2012).
Jaeger, David A., Esteban F. Klor, Sami H. Miaari, and M. Daniele Paserman. 2012. “The
struggle for Palestinian hearts and minds: Violence and public opinion in the Second
Intifada.” Journal of Public Economics 96(3–4): 354–368.
Jeffery, Keith. 1987. “Intelligence and Conter-Intelligence: Some Reflections on the British
Experience.” Intelligence & National Security 2(1).
Jessee, Stephen, and Alex Tahk. 2011. “What Can We Learn About the Ideology of the Newest
Supreme Court Justices?” PS: Political Science & Politics 44(3): 524–529.
210
Johnston, Patrick. 2012. “Does Decapitation Work? Assessing the Effectiveness of Leadership
Targeting in Counterinsurgency Campaigns.” International Security 36(4): 47–79.
Kalyvas, Stathis N. 2006. The Logic of Violence in Civil War. Cambridge University Press.
---. 2008. “Ethnic Defection in Civil War.” Comparative Political Studies 41(8): 1043 –1068.
Kalyvas, Stathis N., and Matthew Adam Kocher. 2007a. “How ‘Free’ Is Free Riding in Civil
Wars?: Violence, Insurgency, and the Collective Action Problem.” World Politics 59(02):
177–216.
---. 2007b. “Ethnic Cleavages and Irregular War: Iraq and Vietnam.” Politics & Society 35: 183–
223.
---. 2009a. “The Dynamics of Violence in Vietnam: An Analysis of the Hamlet Evaluation System
(HES).” Journal of Peace Research 46(3): 335 –355.
---. 2009b. “Web Only Appendix To: Kalyvas & Kocher. 2009. The Dynamics of Violence in
Vietnam: An Analysis of the Hamlet Evaluation System (HES), Journal of Peace
Research.”
http://www.prio.no/misc/Download.aspx?file=%2Fcscw%2Frd%2FReplication+Data%2F
KK_appendix.doc (April 12, 2011).
Kamrass, Murray. 1969. Internal and external checks of the Hamlet Evaluation System (U).
Alexandria, VA: Institute for Defense Analyses.
Kaplan, O.R. 2010. “Civilian Autonomy in Civil War.” Stanford University.
Kastellec, Jonathan P., and Eduardo L. Leoni. 2007. “Using Graphs Instead of Tables in Political
Science.” Perspectives on Politics 5(4): 755–771.
Keegan, John. 1976. The face of battle. Viking Press.
211
Kellen, Konrad. 1969. A View of the VC: Elements of Cohesion in the Enemy Camp in 1966-1967.
Santa Monica, CA: Rand.
Kim, S.-H., and A. Cohen. 1992. “Effects of linking methods on detection of DIF.” Journal of
Educational Measurement 29: 51–66.
Kim, S., and M.J. Kolen. 2006. “Robustness to format effects of IRT linking methods for mixed-
format tests.” Applied Measurement in Education 19: 357–381.
Kim, S., and W. Lee. 2006. “An Extension of Four IRT Linking Methods for Mixed-Format
Tests.” Journal of Educational Measurement 43(1): 53–76.
Kinnard, Douglas. 1991. The War Managers. Da Capo Press.
Koch, J.A. 1973. The Chieu Hoi Program in South Vietnam, 1963-1971. Santa Monica, CA: Rand.
Kocher, Matthew Adam. 2004. “Human ecology and civil war.” Dissertation. University of
Chicago.
Kocher, Matthew Adam, Thomas B Pepinsky, and Stathis N Kalyvas. 2011. “Aerial Bombing
and Counterinsurgency in the Vietnam War.” American Journal of Political Science 55(2):
201–218.
Kolen, M.J., and R.L. Brennan. 2004. Test equating, linking, and scaling: Methods and practices. 2nd
ed. New York: Springer-Verlag.
Kolko, Gabriel. 1985. Anatomy of a War: Vietnam and the Modern Historical Experience. New York:
The New Press.
---. 1994. Century of War: Politics, Conflicts, and Society Since 1914. New York: New Press.
Komer, R.W. 1972. The Malayan Emergency in Retrospect: Organization of A Successful
Counterinsurgency Effort. Santa Monica, CA: Rand.
212
Kongsgård, Håvard Wahl. 2010. “Geography matters, but people are the key; The location of
Viet Cong initiated incidents.” Master’s Thesis. Norwegian University of Science and
Technology.
Kulka, Richard A., and United States Veterans Administration. 1988. Contractual report of
findings from the National Vietnam Veterans Readjustment Study. Research Triangle, Park,
N.C.: Research Triangle Institute.
Landis, Erik C. 2008. Bandits and partisans: the Antonov movement in the Russian Civil War.
University of Pittsburgh Press.
Lawson, Edward H., and Mary Lou Bertucci. 1996. Encyclopedia of human rights. Taylor &
Francis.
Leites, Nathan. 1969. The Viet Cong Style of Politics. Santa Monica, CA: Rand.
Levitt, S.D., and S.A. Venkatesh. 2000. “An Economic Analysis of a Drug-Selling Gang’s
Finances.” Quarterly Journal of Economics 115(3): 755–789.
Lewis, Jeffrey B., and Drew A. Linzer. 2005. “Estimating Regression Models in Which the
Dependent Variable Is Based on Estimates.” Political Analysis 13: 345–364.
Lewy, Guenter. 1980. America In Vietnam. Oxford University Press.
Li, Zhen. 2009. “Impact of Differential Item Functioning on Statistical Conclusions.” Thesis.
University of British Columbia.
Lichbach, Mark I. 1998. The Rebel’s Dilemma. University of Michigan Press.
Little, R.J.A., and D.B. Rubin. 2002. Statistical Analysis with Missing Data. 2nd ed. New York:
Wiley.
213
Lohman, Andrew Davies. 2010. “The geography of insurgency: An urban network insurgency
model of the Viet Nam War.” Dissertation. University of Illinois at Urbana-Champaign.
Long, A. 2007. “Counterinsurgency in Vietnam.” In Managing Defense Transformation: Agency,
Culture, and Service Change, eds. Adam N. Stulberg and Michael D. Salomone.
Burlington, VT: Ashgate.
Lyall, Jason. 2009. “Does indiscriminate violence insight insurgent attacks?: Evidence from
Chechnya.”
---. 2010. “Are coethnics more effective counterinsurgents? Evidence from the second Chechen
War.” American Political Science Review 104: 1–20.
Lyall, Jason, and Isaiah Wilson. 2009. “Rage Against the Machines: Explaining Outcomes in
Counterinsurgency Wars.” International Organization 63(01): 67–106.
Lynch, Timothy J. 2010. “Switching Sides: Coalition Warfare in Recent Afghan History.”
Strategy Research Project. U.S. Army War College.
Machain, Carla Martinez, T. Clifton Morgan, and Patrick M Regan. 2011. “Deterring Rebellion.”
Foreign Policy Analysis 7(3): 295–316.
Mair, Patrick, and Reinhold Hatzinger. 2007a. “CML based estimation of extended Rasch
models with the eRm package in R.” Psychology Science 49(1): 26–43.
---. 2007b. “Extended Rasch Modeling: The eRm Package for the Application of IRT Models in
R.” Research Report Series/Department of Statistics and Mathematics 47.
Martin, B. 1932. Desertion of Alabama troops from the Confederate Army: a study in sectionalism. New
York: Columbia University Press.
Masters, G.N. 1982. “A Rasch model for partial credit scoring.” Psychometrika 47: 149–174.
214
McChristian, Joseph A., and U. S. Army. 1994. The role of military intelligence, 1965-1967. Dept. of
the Army.
Mccormick, Gordon H., Steven B. Horton, and Lauren A. Harrison. 2007. “Things fall apart: the
endgame dynamics of internal wars.” Third World Quarterly 28(2): 321.
McPherson, James M. 1997. For Cause and Comrades: Why Men Fought in the Civil War. Oxford
University Press.
Metelits, Claire. 2010. Inside Insurgency: On the Front Lines with the FACR, SPLA and PKK. New
York: New York University Press.
Miller, TR, and JA Spray. 1993. “Logistic Discriminant Function Analysis for DIF Identification
of Polytomously Scored Items.” Journal of Educational Measurement 30: 107–122.
Millsap, Roger E. 2010. “Testing Measurement Invariance Using Item Response Theory in
Longitudinal Data: An Introduction.” Child Development Perspectives 4(1): 5–9.
Milner, Helen. 1991. “The Assumption of Anarchy in International Relations Theory: A
Critique.” Review of International Studies 17(01): 67–85.
Mislevy, R. 1985. “Estimation of latent group effects.” Journal of the American Statistical
Association 80: 993–997.
Mockaitis, Thomas R. 1995. British counterinsurgency in the post-imperial era. Manchester
University Press.
Moyar, Mark. 2006. Triumph Forsaken: The Vietnam War, 1954-1965. 1st ed. Cambridge University
Press.
---. 2007. Phoenix and the Birds of Prey: Counterinsurgency and Counterterrorism in Vietnam.
University of Nebraska Press.
215
Muggah, Robert. 2009. Security and post-conflict reconstruction: dealing with fighters in the aftermath
of war. Taylor & Francis US.
Mvukiyehe, E., and C. Samii. 2010. “Quantitative Impact Evaluation of the United Nations
Mission in Liberia.”
Mvukiyehe, E., C. Samii, and G. Taylor. 2007. Wartime and post-conflict experiences in Burundi: an
individual level survey. Dep. Polit. Sci., Columbia Univ. and New York Univ.
Napoleoni, Loretta. 2005. Insurgent Iraq: Al Zarqawi and the new generation. Seven Stories Press.
Natapoff, Alexandra. 2009. Snitching: criminal informants and the erosion of American justice. New
York: New York University Press.
Nillesen, Eleonora E., and Philip Verwimp. 2009. “Grievance, Commodity Prices and Rainfall: A
Village-level Analysis of Rebel Recruitment in Burundi.” MICRON Research Working
Paper 11.
O’Hanlon, Michael, and Ian S. Livingston. 2012. “Iraq Index.”
http://www.brookings.edu/about/centers/saban/iraq-index (August 18, 2012).
Obeyesekere, G. 1974. “Some comments on the social backgrounds of the April 1971 insurgency
in Sri Lanka (Ceylon).” The Journal of Asian Studies: 367–384.
Olson, Mancur. 1971. The logic of collective action: public goods and the theory of groups. Cambridge:
Harvard University Press.
Osborne, W.V. 2012. “The Critical Capability: CORDS District Advisor Teams in Vietnam.”
Master’s Thesis. Marine Corps Command and Staff College.
Osterlind, Steven J., and Howard T. Everson. 2009. Differential Item Functioning. Second ed. Sage
Publications, Inc.
216
Pemstein, Daniel, Stephen A. Meserve, and James Melton. 2010. “Democratic Compromise: A
Latent Variable Analysis of Ten Measures of Regime Type.” Political Analysis 18(4): 426–
449.
Pfeffer, Jeffrey. 1997. New Directions for Organization Theory: Problems and Prospects. New York:
Oxford University Press.
Pike, Douglas. 1970. “The Viet-Cong Strategy of Terror.” Indochina Archive.
---. 1986. PAVN: People’s Army of Vietnam. Presidio Press.
Pirnie, Bruce R., and Edward O’Connell. 2008. Counterinsurgency in Iraq (2003-2006). Santa
Monica, CA: Rand.
Pohle, Victoria. 1969. The Viet Cong in Saigon: Tactics and Objectives During the Tet Offensive. Santa
Monica, CA: Rand.
PoKempner, Dinah, Human Rights Watch/Asia, Arms Project (Human Rights Watch), and
Human Rights Watch (Organization). 1995. Cambodia at war. Human Rights Watch.
Pool, Ithiel de Sola, Gordon Fowler, Peter McGrath, and Richard Peterson. 1968. Hamlet
Evaluation System Study. Cambridge, MA : Simulmatics Corporation.
Poole, Keith T., and Howard Rosenthal. 2000. Congress: A Political-Economic History of Roll Call
Voting. Oxford University Press, USA.
Popkin, Samuel L. 1979. The Rational Peasant: The Political Economy of Rural Society in Vietnam.
University of California Press.
Powell, R. 1999. In the shadow of power: States and strategies in international politics. Princeton:
Princeton University Press.
217
Prados, John. 2009. Vietnam: The History of an Unwinnable War, 1945-1975. University Press of
Kansas.
Price, H. Edward. 1977. “The Strategy and Tactics of Revolutionary Terrorism.” Comparative
Studies in Society and History 19(01): 52–66.
Prince, W.G., and J.H. Adkins. 1973. Analysis of Vietnamization: Hamlet Evaluation System
Revisions. Ann Arbor, MI: Bendex.
Prugh, George S. 1975. Law at War: Vietnam, 1964-1973. Washington, D.C.: Department of the
Army.
Pye, L.W. 1981. Guerrilla Communism in Malaya: Its social and political meaning. Greenwood Press.
Race, Jeffrey. 1972. War Comes to Long An: Revolutionary Conflict in a Vietnamese Province.
Berkeley: University of California Press.
Raleigh, Clionadh, Andrew Linke, Håvard Hegre, and Joakim Karlsen. 2010. “Introducing
ACLED: An Armed Conflict Location and Event Dataset.” Journal of Peace Research 47(5):
652–660.
Ramakrishna, Kumar. 1999. “Content, credibility and context: Propaganda government
surrender policy and the Malayan communist terrorist mass surrenders of 1958.”
Intelligence and National Security 14(4): 242–266.
---. 2002a. “‘Bribing the Reds to Give Up’: Rewards Policy in the Malayan Emergency.” War in
History 9(3): 332 –363.
---. 2002b. Emergency propaganda: the winning of Malayan hearts and minds, 1948-1958. Psychology
Press.
Reckase, Mark D. 2009. Multidimensional Item Response Theory. New York: Springer.
218
Rizopoulos, Dimitris. 2006. “ltm: An R Package for Latent Variable Modeling and Item
Response Theory Analyses.” Journal of Statistical Software 17(5).
Roberts, Adam. 1966. “The Buddhists, the War, and the Vietcong.” The World Today 22(5): 214–
222.
Roberts, Les, Riyadh Lafta, Richard Garfield, Jamal Khudhairi, and Gilbert M. Burnham. 2004.
“Mortality before and after the 2003 invasion of Iraq: Cluster sample survey.” The Lancet
364: 1857–1864.
Rosas, G., and Y. Shomer. 2008. “Models of Nonresponse in Legislative Politics.” Legislative
Studies Quarterly 33: 573–601.
Rose, Norman, Matthias von Davier, and Xueli Xu. 2010. Modeling Nonignorable Missing Data
With Item Response Theory (IRT). Princeton, NJ: Educational Testing Services.
Rubin, Donald B. 1976. “Inference and Missing Data.” Biometrika 63(3): 581–592.
Rupp, A.A., and B.D. Zumbo. 2003. “Which model is best? Robustness properties to justify
model choice among unidimensional IRT models under item parameter drift.” The
Alberta Journal of Educational Research 49: 264–276.
Samson, Robert L. 1970. The economics of insurgency in the Mekong Delta of Vietnam. Cambridge,
Mass: MIT Press.
Sánchez-Cuenca, Ignacio, and Luis de la Calle. 2009. “Domestic Terrorism: The Hidden Side of
Political Violence.” Annual Review of Political Science 12(1): 31–49.
Scaff, Alvin H. 1955. The Philippine answer to communism. Stanford University Press.
Schelling, Thomas C. 1960. The strategy of conflict. Cambridge, MA: Harvard University Press.
219
Schroden, Jonathan J. 2009. “Measures for Security in a Counterinsurgency.” Journal of Strategic
Studies 32(5): 715–744.
---. 2011. “Why Operations Assessments Fail: It’s Not Just the Metrics.” Naval War College Review
64(4): 89–102.
Scoville, Thomas W. 1982. Reorganizing for Pacification Support. Washington, D.C.: United States
Army.
Sears, Stephen W. 1998. Chancellorsville. Houghton Mifflin Harcourt.
Seligman, Edwin Robert Anderson, and Alvin Saunders Johnson. 1930. “Amnesty.” In
Encyclopaedia of the social sciences, The Macmillan company.
Semple, M. 2009. Reconciliation in Afghanistan. United States Institute of Peace Press.
Shapiro, J.N., and N.B. Weidmann. 2011. “Talking About Killing: Cell Phones, Collective Action,
and Insurgent Violence in Iraq.”
Sharp, Ulysses S. Grant, and William C. Westmoreland. 1968. Report on the War in Vietnam (As of
Jun 1968). Washington: GPO.
Sheehan, Neil. 1988. A Bright Shining Lie: John Paul Vann and America in Vietnam. New York:
Random House.
Shrout, Michael S. 2011. “Biometrically Supported Census Operations as a Population Control
Measure in Counterinsurgency.” Master’s Thesis. United States Army Command and
General Staff College.
Shultz, Richard. 1978. “The Limits of Terrorism in Insurgency Warfare: The Case of the Viet
Cong.” Polity 11(1): 67–91.

220
Signorino, C.S., and J. Xiang. 2011. “Averaging Away the Effects: Aggregation Bias in Indices of
Power and Democracy.” Working paper.
Signorino, C.S. and K. Yilmaz. 2003. “Strategic misspecification in regression models.” American
Journal of Political Science 47: 551–66.
Silverman, Jerry Mark. 1970. “Political Elites in South Vietnam: A National and Provincial
Comparison.” Asian Survey 10(4): 290–307.
Sinno, Abdulkader H. 2008. Organizations at War in Afghanistan and Beyond. 1st ed. Cornell
University Press.
Sobek, David. 2010. “Masters of their domains: The role of state capacity in civil wars.” Journal of
Peace Research 47(3): 267 –271.
Sorley, Lewis. 2011. Westmoreland: The General Who Lost Vietnam. New York: Houghton Mifflin
Harcourt.
Spagat, Michael, Andrew Mack, Tara Cooper, and Joachim Kreutz. 2009. “Estimating war
deaths: An arena of contestation.” Journal of Conflict Resolution 53: 934–950.
Spulber, Daniel F. 2009. The theory of the firm: microeconomics with endogenous entrepreneurs, firms,
markets, and organizations. Cambridge University Press.
Stahl, J.A., B.A. Bergstrom, and O. Shneyderman. 2002. “Impact of item drift on test-taker
measurement.” In Annual meeting of the American Educational Research Association, New
Orleans, LA.
Staniland, Paul. 2012. “States, Insurgents, and Wartime Political Orders.” Perspectives on Politics
10(2): 243–264.
221
Stocking, M.L., and F.M. Lord. 1983. “Developing a common metric in item response theory.”
Applied Psychological Measurement 7: 201–210.
Stouffer, S.A., E.A. Suchman, L.C. DeVinney, S.A. Starr, and R.M. Williams. 1949. Vol. 1 The
American soldier: Adjustment to army life. Princeton, NJ: Princeton University Press.
Swaminathan, H, and HJ Rogers. 1990. “Detecting Differential Item Functioning Using Logistic
Regression Procedures.” Journal of Educational Measurement 27: 361–370.
Sweetland, Anders. 1968. Item Analysis of the HES (Hamlet Evaluation System). Santa Monica, CA:
Rand.
Swift, Jeannine S. 1999. “Chieu Hoi: A US Pacification Program In Vietnam Revisited, 1963-
1972.” http://www.vietnam.ttu.edu/virtualarchive/items.php?item=15250103001 (August
18, 2012).
Takala, S., and F. Kaftandjieva. 2000. “Test fairness: A DIF analysis of an L2 vocabulary test.”
Language Testing 17: 323–340.
Thayer, Thomas C.. 1975. Volume 9: Population Security. A Systems Analysis View of the Vietnam
War 1965-1972. Washington, D.C.: OASD(SA)RP Southeast Asia Intelligence Division.
---. 1985. War without fronts: The American experience in Vietnam. Westview Press.
Tho, Tran Dinh. 1984. Pacification. Washington, D.C.: U.S. Army Center of Military History.
Toft, Monica Duffy, and Yuri M. Zhukov. 2012. “Denial and Punishment in the North Caucasus:
Evaluating the Effectiveness of Coercive Counterinsurgency.” Journal of Peace Research.
Tovy, Tal. 2010. “Peasants and Revolutionary Movements: The Viet Cong as a Case Study.” War
in History 17(2): 217–230.
222
---. 2012. “Learning from the Past for Present Counterinsurgency Conflicts The Chieu Hoi
Program as a Case Study.” Armed Forces & Society 38(1): 142–163.
Trier, Shawn, and Simon Jackman. 2008. “Democracy as a Latent Variable.” American Journal of
Political Science 52(1): 201–217.
Trinquier, Roger. 1964. Modern warfare: a French view of counterinsurgency. DIANE Publishing.
Truong, Hoa Minh. 2011. The Dark Journey: Inside the Reeducation Camps of Viet Cong. Eloquent
Books.
Tse-tung, Mao. 2000. On Guerrilla Warfare. Trans. Samuel B. Griffith. 2nd Revised ed. University
of Illinois Press.
Tunney, John V. 1969. Measuring Hamlet Security in Vietnam: Report of a Special Study Mission.
Govt. Print. Off.
Tutz, G. 1990. “Sequential item response models with an ordered response.” British Journal of
Mathematical and Statistical Psychology 49: 79–105.
United Nations. 2010. UN Department of Safety and Security, Afghanistan Security Situation Report,
Week 32, 6-12 August 2010. http://info.publicintelligence.net/SIOC-32.pdf (August 18,
2012).
United States Military Assistance Command, Vietnam. 1967. MACV Order of Battle Reference
Manual - Strength. San Francisco.
Valentine, Douglas. 1990. The Phoenix Program. 1st ed. New York: Morrow.
Valentino, B. 2000. “Final solutions: the causes of mass killing and genocide.” Security Studies
9(3): 1–59.

223
Verhelst, N.D., C.A.W. Glas, and H.H. de Vries. 1997. “A steps model to analyze partial credit.”
In Handbook of Modern Item Response Theory, New York: Springer, p. 123–138.
Verwimp, Philip. 2003. “Testing the Double-Genocide Thesis for Central and Southern
Rwanda.” The Journal of Conflict Resolution 47(4): 423–442.
---. 2005. “An economic profile of peasant perpetrators of genocide:: Micro-level evidence from
Rwanda.” Journal of Development Economics 77(2): 297–323.
Wahab, Abdul. 2012. “Using Item Response Theory to Understand Item-Nonresponse (Missing
Data) in Ghanian Surveys.” Master’s Thesis. Kwame Nkrumah University of Science and
Technology.
Walter, Barbara F. 1997. “The Critical Barrier to Civil War Settlement.” International Organization
51(03): 335–364.
---. 1999. “Designing transitions from civil war: Demobilization, democratization, and
commitments to peace.” International Security 24(1): 127–155.
---. 2009. “Bargaining failures and civil war.” Annual Review of Political Science 12: 243–261.
Waltz, Kenneth Neal. 1979. Theory of international politics. Addison-Wesley Pub. Co.
Weber, Max. 1991. “Politics as a Vocation.” In From Max Weber: Essays in Sociology, Abingdon,
Oxon.: Routledge.
Weeks, J.P. 2010. “plink: An R Package for Linking Mixed-Format Tests Using IRT-Based
Methods.” Journal of Statistical Software 35(12): 1–33.
Weinstein, Jeremy M. 2007. Inside rebellion: the politics of insurgent violence. Cambridge University
Press.
224
Weitz, Mark A. 2005. More Damning than Slaughter: Desertion in the Confederate Army. University
of Nebraska Press.
Wells, C.S., M.J. Subkoviak, and R.C. Sterlin. 2002. “The effect of item parameter drift on
examinee ability estimates.” Applied Psychological Measurement 26: 77–87.
West, Bing. 2006. No True Glory: A Frontline Account of the Battle for Fallujah. New York: Bantam
Dell.
Westerman, I.D. 2008. “Provincial Reconstruction in Afghanistan: An Examination of the
Problems of Integrating the Military, Political and Development Dimensions with
Reference to the US Experience in Vietnam.” Master’s Dissertation. Pembroke College,
Cambridge.
White, Halbert. 1980. “A Heteroscadastically-Consistent Covariance Matrix Estimator and a
Direct Test for the Heteroscasticity.” Econometrica 48: 817–838.
Witt, E.A., J.A. Stahl, B.A. Bergstrom, and T. Muckle. 2003. “Impact of item drift with non-
normal distributions.” In Annual meeting of the American Educational Research Association,
Chicago, IL.
Wood, Elisabeth Jean. 2003. Insurgent collective action and civil war in El Salvador. New York:
Cambridge University Press.
Wood, R.M. 2010. “Competing for Control: Conflict Power Dynamics, Civilian Loyalties and
Violence in Civil War.” University of North Carolina.
Woodruff, Mark W. 1999. Unheralded Victory: The Defeat of the Viet Cong and the North Vietnamese
Army, 1961-1973. First. Vandamere Pr.
225
Wright, B.D., and G.N. Masters. 1982. Rating scale analysis: Rasch measurement. Chicago: Mesa
Press.
Ziemke, Jen. 2008. “From Battles to Massacres.” In 3rd Annual Harvard-Yale-MIT Graduate
Student Conference on Order, Conference and Violence, Yale University.
Zumbo, BD. 1999. A Handbook on the Theory and Methods of Differential Item Functioning (DIF):
Logistic Regression Modeling as a Unitary Framework for Binary and Likert-Type (Ordinal)
Item Scores. Ottawa, ON: Department of National Defense.