
Why is Unemployment High in the Philippines?unpan1.un.org/intradoc/groups/public/documents/... ·...
25
WP/02/23 IMF Working Paper Why Is Unemployment High in the Philippines? Ray Brooks I N T E R N A T I O N A L M O N E T A R Y FUND
Transcript of Why is Unemployment High in the Philippines?unpan1.un.org/intradoc/groups/public/documents/... ·...

WP/02/23
IMF Working Paper
Why Is Unemployment High in thePhilippines?
Ray Brooks
I N T E R N A T I O N A L M O N E T A R Y F U N D
© 2002 International Monetary Fund WP/02/23
IMF Working Paper
Asia and Pacific Department
Why is Unemployment High in the Philippines?
Prepared by Ray Brooks1
Authorized for distribution by Joshua Felman
February 2002
Abstract
The views expressed in this Working Paper are those of the author(s) and do not necessarilyrepresent those of the IMF or IMF policy. Working Papers describe research in progress by theauthor(s) and are published to elicit comments and to further debate.
Unemployment has remained high in the Philippines, at almost twice the level of neighboringcountries, despite relatively fast employment growth in the past decade. Employment growthwas not sufficient to reduce unemployment because of rapid population growth and increasedlabor force participation. This paper shows that Philippine employment growth andunemployment declines were positively correlated with real GDP growth and, to a lesserextent, negatively with the real minimum wage. The key policy implications are that highereconomic growth and moderation of increases in the real minimum wage are required toreduce unemployment.
JEL Classification Numbers: J20, J64
Keywords: Philippines; unemployment; employment
Author's E-Mail Address: [email protected]
1 The author is grateful to: Bas Bakker, Nigel Chalk, Maple Kongsamut, Sean Nolan, andMarkus Rodlauer for helpful comments; and to Clara Eulate, Ioana Hussiada, andNong Jotikasthira for research and secretarial support.
- 2 -
Contents Page
I. Introduction 3
II. Labor Market Performance in the Past Twenty Years 3
III. Comparison with Other Countries in the Region 5
IV. Institutional Structure of the Labor Market 7
V. Factors Affecting Employment Growth in the Philippines 11
VI. Factors Affecting the Minimum Wage 17
VII. Conclusion 21
References 22
Box1. Determination of the Minimum Wage 10
Figures1. Selected Asian Countries: Labor Market Indicators, 1985-2000 62. Selected Asian Countries: Population, Productivity, and Real GDP Growth 83. Employment, Real GDP, and Real Wages, 1990-2000 16
Tables1. Labor Market Indicators 42. Aggregate Employment Equations 133. Employment Equations by Sector 144. Unemployment Equation 185. Unemployment Equation (including remittances) 196. Minimum Wage Equation 20
Annex I 23

- 3 -
FACTORS BEHIND HIGH UNEMPLOYMENT IN THE PHILIPPINES
I. INTRODUCTION
The unemployment rate in the Philippines remains high relative to other countries in the region.Unemployment fell to a cyclical low of 8 percent in 1996, prior to the onset of the Asian crisis,but rose to more than 11 percent in 2000 and 2001, more than twice the level of a number ofneighboring countries. While employment growth has been higher than in many other countriesin the region, this has not been sufficient to lower the unemployment rate given high populationgrowth and a rise in labor force participation.
This paper analyses the factors behind unemployment in the Philippines, by estimatingequations to explain employment growth and the unemployment rate. The paper first discussesthe performance of the labor market (including a comparison with neighboring countries) andits institutional features. It then presents the econometric analysis and discusses some policyconclusions.
II. LABOR MARKET PERFORMANCE IN THE PAST TWENTY YEARS
The unemployment rate has fluctuated in therange of 7-14 percent over the past twenty years(see chart). In 1996, the rate fell to a cyclical lowof about 8 percent, prior to the slow down ineconomic activity associated with the Asiancrisis. Unemployment did not rise sharply as aresult of the Asian crisis, but jumped in 2000 tomore than 11 percent, as employment contracteddue to a sharp fall in agricultural employment(Table 1). By October 2001, however, theseasonally adjusted unemployment rate haddeclined to 10 1/2 percent, due to some recovery inagricultural employment. In the late 1990s, theunder-employment rate3 was more than twice theunemployment rate, but fell to 17 1/4 percent in 2001.
Derived from a quarterly household labor survey (see data annex for details).
Defined as employed persons seeking additional hours of employment.

- 4 -
Table 1: Philippines Labor Market Indicators
(In percent)
Unemployment rateMaleFemale
UrbanRural
Underemployment rateMaleFemale
UrbanRural
Labor force participation rate 1/MaleFemale
UrbanRural
Share of labor forceMaleFemale
UrbanRural
Labour force (in millions)UnemployedEmployed
Agriculture, fishery, forestryIndustryServices
1982
9.4
8.8
10.5
61.179.143.2
64.435.6
18.51.7
16.8
1990
8.4
7.4
10.1
64.481.947.2
63.136.9
24.22.0
22.29.93.48.7
1995
9.5
8.8
10.7
12.36.8
20.021.816.9
17.122.6
65.882.948.4
63.168.6
63.136.9
48.751.3
28.42.7
25.711.14.1
10.3
1999
9.8
9.5
9.9
12.57.1
22.324.917.5
18.925.0
66.685.650.2
64.368.8
62.537.5
47.252.8
31.83.0
28.711.44.5
12.7
2000
11.210.811.6
14.08.4
21.724.017.8
18.524.6
65.081.548.6
63.166.9
62.038.0
47.852.2
31.83.5
28.310.74.5
13.1
2001
11.110.811.6
14.18.3
17.2
14.018.7
67.182.451.8
64.869.4
61.338.7
48.851.2
32.83.7
29.210.84.7
13.6
Source: CEIC database
1/ Defined as employed and unemployed persons as a percent of the population over 15 years old.

- 5 -
Unemployment has been higher among females than males. The female unemployment rate wasabout 2-2 1/2 percentage points higher than the male unemployment rate in the 1980s andearly 1990s, but the gap has narrowed to about 1 percentage point in recent years. Under-employment, however, has been significantly higher among males than females, averaging24 percent in 2000 for males compared with almost 18 percent for females.
Urban unemployment has been almost twice the rural rate. The urban unemployment ratein 2001 was 14 percent, while the rural unemployment rate was only 8 1/4 percent (the labor forceis about evenly split between rural and urban areas). However, the under-employment rate inrural areas has been higher than in urban areas, suggesting that rural workers are more likely towant additional hours of work than urban workers. Most of the rural workers are employed inthe agricultural sector, where part-time and seasonal work is more prevalent than in urban areas.
Employment growth has been strongest in the service sector. Employment in services grew byalmost 50 percent in the 1990s, well above growth in the industry sector (30 percent) andagriculture (8 percent). By 2001, the service sector had the largest share of employment at about47 percent of the total.
Labor force participation has increased by 6 percentage points over the past twenty years,mainly because of a large increase in participation by women. Nonetheless, the participationrate for males, at 82 percent in 2001, remains well above that for women, at 52 percent.
An important feature of the labor market is the large number of Filipinos working overseas.Partly in response to the lack of job opportunities at home, the number of workers formallydeployed overseas has increased substantially and reached 2.9 million by 1999, about 9 percentof the labor force. Worker remittances were equivalent to US$6.8 billion in 1999 (about8½ percent of GNP), up from less than US$1.2 billion in 1990.
III. COMPARISON W I T H OTHER COUNTRIES IN THE REGION
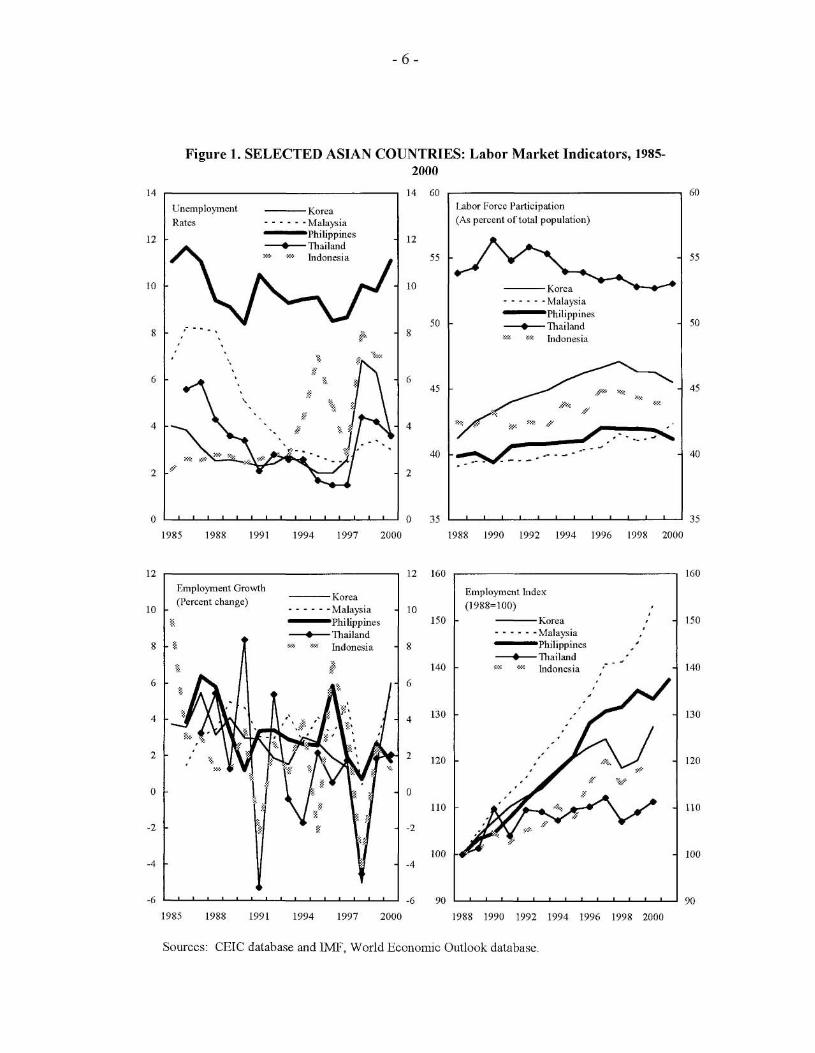
The unemployment rate in the Philippines is about twice the rate of other selected countries inthe region (Figure 1). While Philippine unemployment began to decline in the late 1980s, therecession in the early 1990s contributed to a jump in the unemployment rate. The Philippinesdid not experience the sharp increase in unemployment associated with the Asian crisis seen inother countries, but unemployment in the Philippines increased in 2000, as employment growthslowed in the agricultural sector. The sources and methods for calculating unemployment in thePhilippines and neighboring countries differs in some respects, but the measurement basisappears broadly comparable (see data annex).
- 6 -
Figure 1. SELECTED ASIAN COUNTRIES: Labor Market Indicators, 1985-2000
Sources: CEIC database and IMF, World Economic Outlook database.
- 7 -
Employment growth in the Philippines has been faster over the past decade than in most othercountries in the region, with the notable exception of Malaysia. Employment in the Philippinesgrew by almost 30 percent in the 1990s, compared with growth of less than 20 percent in Korea,Thailand and Indonesia over the same period. In Malaysia, however, employment grew byabout 40 percent in the 1990s, contributing to a significant fall in the unemployment rate frommore than 8 percent in 1988 to about 3 percent in 2000.
Employment growth has not been sufficient to reduce the unemployment rate given the increasein population and the rise in the labor force participation rate. Population growth in thePhilippines was among the fastest of Asian countries, and was only slightly slower than inMalaysia (Figure 2). The increase in the labor force participation rate in the Philippines wasabout in line with that experienced in other countries in the region.
The relatively fast employment growth contrasts with relatively slow real GDP growth in thePhilippines. In the 1990s, real GDP expanded by only one-third in the Philippines, comparedwith increases of 50-100 percent in Indonesia, Korea, Malaysia, and Thailand. The highemployment growth combined with the slow GDP growth is reflected in the relatively poorlabor productivity performance in the Philippines. Labor productivity increased by less than7 percent in the past decade in the Philippines,4 compared with increases of 30-50 percent in theother selected Asian countries.
The comparison with Malaysia is perhaps the most interesting. Malaysia and the Philippines hadsimilar rates of population growth over the past two decades, and unemployment in Malaysiawas also relatively high in the 1980s. However, the unemployment rate fell in Malaysia inthe 1990s while it rose in the Philippines, as employment growth was not high enough to offsetthe labor force growth, in contrast to Malaysia where employment growth was high enough tomore than offset labor force growth. The higher population base in the Philippines (at 76 millionin 2000, compared with about 23 million in Malaysia) meant that the number of new jobsrequired in the Philippines to reduce unemployment was about three times that in Malaysia.
IV. INSTITUTIONAL STRUCTURE OF THE LABOR MARKET
Philippine labor policy supports tripartism, with involvement of the government, employers andunions in labor issues. Tripartism was declared a national policy with the passage of the LaborCode in 1974, itself a product of tripartite discussions. The code prescribed the convening ofregular national tripartite conferences on labor issues (which have been held about once a year)
4 In part, the slower productivity growth in the Philippines may reflect statistical problems withthe national accounts. The national accounts data has not adequately measured the rapid growthof value added in the electronics and information technology sector in the Philippines in the past5-6 years, yet the household labor force survey has likely measured the increased employmentin these sectors. Therefore, growth in both value added and labor productivity are likelyunderstated in the 1990s.

- 8 -
Figure 2. SELECTED ASIAN COUNTRIES: Population, Productivity, andReal GDP Growth
Sources: CEIC database and IMF, World Economic Outlook database.

- 9 -
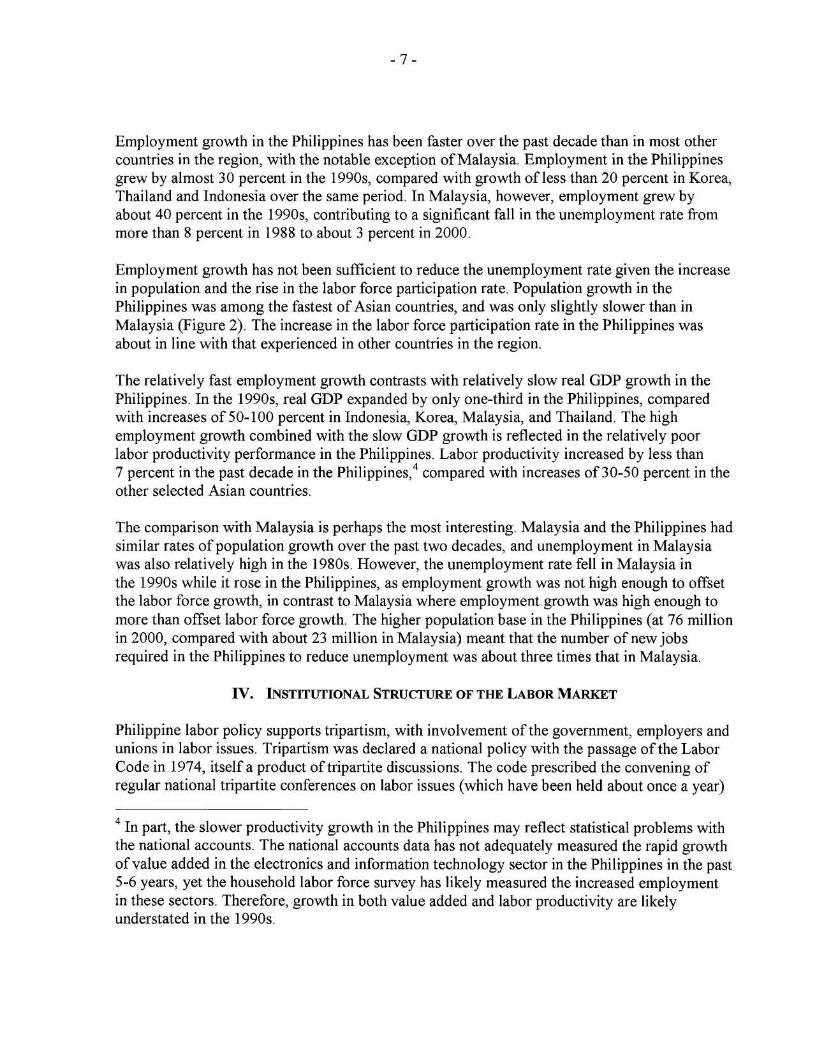
together with the establishment of tripartite agencies to deal with labor matters. Also, the LaborCode requires the government to assist in job training, job search, monitoring of conditions ofemployment, health and safety, and labor relations (with involvement of the employers andunions in all these areas).
Wage bargaining centers on the setting of minimum wages, with limited collective bargaining.Since 1989, Regional Tripartite Wages and Productivity Boards have been responsible forsetting minimum wages, and comprise representatives of the government, employers and unions(Box 1). A National Wages and Productivity Commission (also with a tripartite composition)reviews the decisions of the regional boards to ensure they are in accordance with the criteria tobe used for setting the minimum wage. Collective bargaining at the enterprise level is advocatedby government as the ideal way of setting wages and other terms and conditions, but thecoverage of collective bargaining has remained relatively limited.5
Labor has the right to organize but union membership is relatively small. About 3 3/4 millionworkers (12 percent of the labor force) belonged to some 9,000 unions in 1998. The extent ofunion membership among workers in the sizable electronics sector is limited, as it is in theagriculture sector. Union representatives in the Philippines have expressed concern thatemployers in some sectors (including the electronics sector) do not treat them as partners inseeking improvements in labor productivity and working conditions.
The National Labor Relations Commission is in charge of resolving labor disputes. Thecommission has exclusive jurisdiction to decide on disputes related to unfair practices; wagesand other terms and conditions of employment; and violation of the legality of strikes. Man dayslost to strike action in 1998 (550,000) were about half the level of the early 1990s. Despite thisimprovement, observers note that the process of resolving labor disputes remains overlylegalistic and adversarial.
A Congressional Commission on Labor has been reviewing the Labor Code to ensure thatdevelopments in the labor market and the demands of globalization are reflected. Employergroups are seeking a less legalistic approach to the resolution of labor disputes and greaterflexibility in working hours (currently restricted to five eight-hour days a week). TheDepartment of Labor also notes the need for the Labor Code to conform with InternationalLabor Organization (ILO) conventions ratified by the Philippines.6
5 Only about 500,000 out of 29 million workers are covered by Collective BargainingAgreements.
6 The Philippines recently ratified the anti-child labor conventions No. 138 and No. 182,bringing to seven the number of conventions ratified out of the eight fundamental ILOconventions. The Philippines is working toward ratification of the remaining fundamentalconvention (No. 29) on forced labor.

- 1 0 -
Box 1. Determination of the Minimum Wage
Prior to 1989, the Philippine Congress determined minimum wages, with no variation by region orindustry. The Legislature would set the minimum wage after public hearings and consultations withemployers, unions, and government agencies. Wage adjustments were made irregularly, depending onthe extent of public demands for an increase. The main objective of setting a minimum wage was toprotect workers from exploitation that may arise from imperfections in the labor market. Theminimum wage was to be set at a level sufficient for workers to meet basic living requirements andthereby enable a more equitable sharing of national income.
In 1989, the Regional Tripartite Wage and Productivity Boards were established to take overresponsibility for setting minimum wages from the Philippine Congress, in an effort to have theminimum wage better reflect regional and industry variation in economic conditions. The regionalwage boards are comprised of three government representatives, two employer group representativesand two union representatives. The Boards conduct public hearings before deliberating on theminimum wage adjustment for their region. The Philippine Congress, however, can still legislate theminimum wage, if it were an across-the-board adjustment for the nation as a whole.
In determining minimum wages, the regional boards must consider a range of criteria, including thefollowing:
• the demand for living wages;
• wage adjustment vis-a-vis the consumer price index;
• the need to induce industries to invest in the countryside (where the cost of living is lower);
• the fair return on capital invested and capacity to pay of employers; and
• effects on employment growth and family income.
The frequency of wage adjustments is usually not more than once every 12 months (usually inOctober-December). Adjustments could be more frequent if there are extraordinary increases inpetroleum prices or basic goods and services.
The regional boards are authorized to exempt certain firms from paying the minimum wage. Thesetypically include new establishments, distressed firms, and establishments with less than 10 workers.
Compliance with the minimum wage requirements, however, is a problem. Of the almost 50,000establishments inspected by government in 1999, 19 percent were found to have been violating theminimum wage order for their region.

- 1 1 -
There is no formal government-funded unemployment income support scheme in thePhilippines. The tradition of strong family ties, together with the sizable flow of remittancesfrom workers abroad, provides income support for the unemployed. The government, however,provides a number of services, including job search facilities through an internet-based jobmatching services, and employment creation assistance through the Public Employment ServiceOffice. The government also sponsors a number of job training initiatives in the private sectorand administers the deployment of Filipino workers overseas through the Philippine OverseasEmployment Administration.
V. FACTORS AFFECTING EMPLOYMENT GROWTH IN THE PHILIPPINES
The factors behind employment growth in the Philippines are examined in a simple model thatregresses the level of employment on output and the minimum wage (deflated by productprices), as follows.7
log(employment) = α log (real GDP) + (3 log (minimum wage/price index) + constant
+ seasonals
The equation is estimated using the cointegration approach (the Johannsen method in PCFIML). The advantage of this approach is that it enables analysis of the variables in level form(which all tested as non-stationary, I (1) variables).8
The data is explained in the data annex. Employment is derived from the quarterly householdlabor survey and the minimum wage was used because of the absence of better wage data (aweakness that needs to be addressed to facilitate better analysis). The use of the minimum wagemay imply weaker statistical results for the wage variable in the equation if decisions by firmsare based on wages that are higher than the minimum (or reflect non-wage costs),9 that are notcorrelated with the minimum wage.
7 This approach assumes that the underlying technology is a CES production function, followingFerguson (1969). A cost function for labor can be derived from the production function, asspecified in the equation.
8 The use of simple Ordinary Least Squares analysis of levels data would likely give rise tospurious regression results, hence the use of cointegration. Moreover, analysis of the change inemployment (to ensure stationarity of the variables) would not pick up information in the trendsthat are clearer in the level data.
9 A survey conducted by the Bureau of Labor and Employment Statistics that covered non-agricultural establishments employing at least 20 persons in 1998, found that wages and salariescomprised almost 80 percent of total labor costs. The remaining labor costs included bonusesand gratuities, social security expenses, and payments in kind. The annual salary and wage costsper employee were about 107,000 pesos in 1998, compared with the annualized minimum wage
(continued...)

- 12-
The results from estimating the above equation for aggregate employment show a closecorrelation between output and employment (Table 2). The coefficient on real GDP is estimatedat 0.68-0,93, with the results depending on the sample period (with a somewhat lowercoefficient for the 1990s only) and on whether the GDP deflator (a proxy for prices faced by thefirm) or the consumer price index (CPI) is used to deflate the minimum wage. The results implythat a 10 percent increase in real GDP is correlated with a 7-9 percent increase in employment.Importantly, the results should not be misinterpreted as implying causality between output andemployment—they merely indicate a correlation without testing for the direction of causality.
The estimation results are less robust for the minimum wage. For the full sample period, theminimum wage was not found to be significantly correlated with employment. However, forthe 1990s, the period when the minimum wage was set regularly by Regional Boards, asignificant negative correlation was found. The results for the equation based on the 1990ssuggest that a 10 percent rise in the minimum wage is correlated with a fall in employment ofabout 5-6 percent over the long run. The overall statistical results for the shorter sample periodare not as strong, however, given that the cointegration test is not significant (in contrast, for thefull sample, the null hypothesis of no cointegration could not be rejected).
Employment equations were also estimated for the three major sectors of the economy, andshow similar results to the aggregate equations (Table 3).10 The coefficients for real value addedin the respective sectors range from 0.73 for agriculture to 1.0 for services, which implies that a10 percent increase in output is correlated with a 7-10 percent increase in employment in thesesectors.
The minimum wage was found to be significantly and negatively correlated with employmentfor the agriculture and services sectors. The results suggest that a 10 percent rise in the realminimum wage is correlated with a 4.3 percent decline in employment in agriculture and a2.8 percent decline in employment in services. The significance of the minimum wage foragriculture is somewhat surprising, given that about three-quarters of the workers in this sectorare not directly subject to minimum wage legislation, as they are unpaid family workers or workon their own account. However, the statistical results suggest either that: (1) employment of theone-quarter of workers in agriculture subject to the minimum wage is sensitive to changes inthe minimum wage; and/or (2) that an increase in the minimum wage in other sectors may draw
of 26,000-46,000 (assuming 250 working days annually—the range reflects the regionalvariation in the minimum wage in 1998, with a low of 104 pesos per day and a high of187 pesos per day).
10 Data are only available for employment by sector since the late 1980s. For the industry andservice sector equations, the sample period was shortened to begin in 1991:1 and 1990:2respectively, due to instability in the coefficients for the full period from 1989:2.

- 13 -
Table 2. Philippines: Aggregate Employment Equations 1/
(Cointegration Analysis)
Explanatory variable
Full sample Full sample 1990's 1990's(using GDP (CPI) 2/ (using GDP (CPI)deflator) 2/ deflator)
1/ The employment equation is specified as follows: log(employment) = α log (real GDP) +β log (minimum wage/price index) + constant + seasonals .
2/ Indicates whether the GDP deflator or the Consumer Price Index was used to deflatenominal wages to obtain a measure of real wages.
3/ The maximum and trace statistics provide a test of the null hypothesis of no cointegrationusing the Johannsen approach. If the test statistic is significant, the null hypothesis can berejected.
** indicates that the coefficient is statistically significant at the 5 percent level, * indicatessignificance at the 10 percent level.
Log (real GDP)
Log (real minimum wage)
Lags in analysis
Sample period
λa Max 3/95 percent confidence level
λa Trace 3/95 percent confidence level
0.90**
0.001
1
1983:3-2000:2
24.0*21.0
33.1*29.7
0.93**
-0.05
1
1983:3-2000:2
24.6*21.0
37.1**29.7
0.68**
-0.63*
1
1990:2-2000:2
16.721.0
27.429.7
0.88**
-0.55**
1
1990:2-2000:2
17.821.0
27.829.7

-14-
Table 3. Philippines: Employment Equations by Sector 1/
(Cointegration Analysis)
Long Run
Log (real value added for the sector)
Log (real minimum wage)
Lags in analysis
Sample period
λa Max95 percent confidence level
λa Trace95 percent confidence level
Agriculture
0.73**
-0.43**
1
1990:2-2000:2
21.0*21.0
34.3*29.7
Industry
0.79**
-0.07
1
1991:1-2000:2
20.021.0
32.2*29.7
Services
1.0**
-0.28**
1
1990:2-2000:2
24.6*21.0
47.1**29.7
1/ The employment equation is specified as follows: log(employment) = a log (real GDP) +β log (minimum wage/price index) + seasonals.
Note: For the agriculture equation, the coefficient on wages is a larger negative when theconsumer price index is used to deflate wages rather than the GDP deflator for agriculture. Forthe industry equation, a shorter sample period was used as the coefficients appeared unstablewhen the full 1990's sample period was used. The wholesale price index was used to deflate theminimum wage for industry—using the GDP deflator to deflate the minimum wage also showedan insignificant, but positive, coefficient for the real minimum wage.
** indicates that the coefficient is statistically significant at the 5 percent level, * indicatessignificance at the 10 percent level.

- 15-
workers away from agriculture (which is often seen as a fall-back occupation whenemployment in non-agriculture sectors is not available). The result for services is not surprisinggiven that almost two-thirds of workers in this sector are in formal employment (and subject tominimum wage legislation). For the industry sector, the minimum wage was not significantlycorrelated with employment.
The following table summarizes the findings of the regression analysis and shows that thechange in real GDP was the main factor correlated with the change in employment. Inthe 1990s, total employment increased by 28 3/4 percent, with the equation suggesting that34 1/2 percentage points of the change was related to real GDP growth and negative 3 percentagepoints was related to the increase in real minimum wages (Figure 3). A remaining almost3 percentage points is unexplained by the equation. The negative relationship with the minimumwage is the most significant for the agriculture sector equation, with a negative 10 percentagepoint contribution from the real wage to employment growth. The fall in the real minimumwage in the service sector (by about 14 percent in the 1990s, due to a larger increase in the GDPdeflator in this sector than in other sectors) was related to a 4 percent increase in employment.Nonetheless, a sizable unexplained residual remains for several equations, which may bebecause the equations are specified in levels and take no account of the dynamic adjustment tothe long term equilibrium relationship.
Philippines: Factors Related to Employment Growth
Actual Percent change inEmployment 1/
Fitted percentage point contribution of:(from equations in Tables 2 and 3)
Real GDP growth
Real minimum wage
Unexplained
Agriculture
3.6
17.6
-10.1
-3.9
Industry
25.6
27.9
-1.8
-0.5
Services
53.1
50.6
4.0
-1.5
Total1990s 1/
28.7
34.6
-3.1
-2.8
Total1984-2000 1/
54.8
47.1
-1.9
9.6
1/ From 1989:2 to 2000:2, unless otherwise stated.2/ Using the minimum wage deflated by the CPI.

- 16 -
Figure 3. PHILIPPINES: Employment, Real GDP, and Real Wages, 1990-2000
(1990=100)
Sources: CEIC database, and Fund staff calculations.

- 17-
Direct estimation of the unemployment rate in a reduced form equation is consistent with theabove results (Table 4).11 The results suggest that the unemployment rate was:
• positively autocorrelated, with the first lag of the unemployment rate the most significant;
• negativity related to lagged output growth, showing that an increase in output growth isrelated to a fall in unemployment (with the first lag the most significant); and
• positively related to changes in the minimum wage (deflated by the CPI), suggesting that anincrease in the minimum wage is related to a rise in the unemployment rate (with thefirst and third lags the most significant).
There is also some evidence that the increase in remittances from Filipino workers overseas inthe 1990s was positively related to the unemployment rate (Table 5). This suggests thatremittances from abroad provide income while workers search for a new job. The results for thisequation, however, show that inclusion of remittances makes the minimum wage variable lesssignificant than in the earlier equation (in Table 4).
VI. FACTORS AFFECTING THE MINIMUM WAGE
Given the negative correlation between the minimum wage and employment, it may be useful tounderstand the factors influencing the determination of the minimum wage. A wage equation isestimated as follows (following Layard, Nickell, and Jackman (1991)):
log(nominal wage) = α log (consumer price index) + β log (productivity) +
γ log(unemployment rate) + constant + seasonals
1 1 The reduced form equation is specified as follows: log unemployment rate = a log(unemployment rate) + β Alog (real GDP) + γ Alog (minimum wage/cpi) + constant +seasonals. Given that statistical tests suggest that the unemployment rate may be stationary, thequarterly change in real GDP and the minimum wage were used to obtain stationary explanatoryvariables, and the equation was estimated using Ordinary Least Squares.

- 18-
Table 4. Philippines: Unemployment Equation
(Ordinary Least Squares Analysis)
Dependent variable:
Explanatory variables:
Constant
log (unemployment rate)First lagSecond lagThird lagFourth lagFifth lagSixth lag
Alog (real GDP)First lagSecond lagThird lagFourth lag
Alog (minimum wage/cpi)First lagSecond lagThird lagFourth lag
Plus Seasonals
Sample periodR-squared
Durbin Watson statisticAR 1-3 F(5,43)ARCH 4 F(4, 40)Normality Chi sq. (2)Reset test F(1,47)
log (unemployment rate)
Coefficient
0.66
0.500.220.02
-0.18-0.05
0.19
-1.80-0.16-0.50-0.62
0.460.120.38
-0.26
1983:3-2000:20.83
= 2.03= 2.10(0.08)*= 1.35 (0.26)= 2.25 (0.32)= 0.47 (0.49)
T-statistic
2.36**
3.39**1.50.11.30.41.5
2.86**0.20.70.9
2.06**0.541.67*1.10
** indicates that the coefficient is statistically significant at the 5 percent level, * indicatessignificance at the 10 percent level. Figures in brackets, i.e, ( ), indicate significance levels.

- 19-
Table 5. Philippines: Unemployment Equation (including remittances)
(Ordinary Least Squares Analysis)
Dependent variable:
Explanatory variables:
Constant
log (unemployment rate)First lagFourth lag
Alog (real GDP)First lagFourth lag
Alog (minimum wage/cpi)Third lag
log (unemployment rate)
Coefficient
1.38
0.61-0.28
-1.27-1.86
0.41
Alog (remittances per capita/cpi)First lag 0.10Fourth lag 0.14
Plus seasonals
Sample periodR-squared
Durbin Watson statisticAR 1-3 F(3,25)ARCH 4 F(3, 22)Normality Chi sq.(2)Reset test F(1,27)
1990:4-2000:20.87
= 1.95- 0.76 (0.52)= 0.49 (0.70)= 3.94(0.14)= 3.79(0.06)*
T-statistic
3.45**
3.75**1.89*
1.011.71*
1.31
1.552.06**
** indicates that the coefficient is statistically significant at the 5 percent level, * indicatesignificance at the 10 percent level. Figures in brackets, i.e., ( ), indicate significance lesvNote=the above equation was obtained after excluding lags of each variables that were nosignificant at the 2025 percent level A shorter sample period was used then for Tableasremittance data was available from 1990 only.

- 2 0 -
The estimation results (again using cointegration) suggest that the minimum wage is correlatedwith the CPI and unemployment rate but less so with productivity (Table 6). The results showthat a 10 percent increase in the CPI is correlated with an 11-13 percent increase in theminimum wage rate, depending on the sample period used. The unemployment rate isnegatively correlated with the minimum wage, suggesting that regional wage boards take intoaccount labor market conditions in setting the minimum wage (as required by the criteria usedto set the minimum wage).12 Productivity is significant in the equation for the 1990s sampleperiod when the unemployment rate is excluded, suggesting that the regional wage boards mayhave taken some account of productivity developments in setting the minimum wage.
Table 6. Philippines: Minimum Wage Equation 1/
(Cointegration Analysis)
Explanatory variable
Log (consumer price index)
Log (productivity)
Log (unemployment rate)
Lags in analysis
Sample period
λa Max95 percent confidence level
λa Trace95 percent confidence level
Full sample
1.27**
-0.43
-0.7**
1
1983:3-2000:2
31.5**27.0
87.6**47.2
1990's
1.23**
0.59
-0.36*
1
1990:1-2000:2
27.4**27.0
56.1**47.2
1990's(ex unemployment
rate)
1.12**
0.69*
1
1990:1-2000:2
27.1**21.0
44.3**29.7
1/ The employment equation is specified as follows: log(nominal minimum wage) = α log(consumer price index) + β log (productivity) + C log(unemployment rate) + constant +seasonals** indicates that the coefficient is statistically significant at the 5 percent level, * indicatessignificance at the 10 percent level.
12 The unemployment rate is not a strongly trending variable (i.e., it is likely a stationary orI(0) variable), hence it strictly should not be included in the cointegration equation. Therefore,the results of the cointegration equation including unemployment should be treated withcaution.
- 2 1 -
VII. CONCLUSION
Unemployment has remained high in the Philippines, at almost twice the level of someneighboring countries, despite a relatively strong rise in employment. Job growth was not fastenough to reduce the unemployment rate, given rapid population growth and increased laborforce participation in the Philippines.
This paper found that employment growth and the unemployment rate were strongly correlatedwith real GDP growth in the Philippines. In particular, a 10 percent increase in real GDP wascorrelated with a rise in total employment of around 7-9 percent. Similar results were shown forthe agriculture, industry and services sectors. The unemployment rate was also found to benegatively correlated with real GDP growth,
A less robust correlation was found between employment and the minimum wage. The resultsshow that a 10 percent increase in the real minimum wage was correlated with a 5-6 percentdecline in aggregate employment in the 1990s. The analysis by sector showed a somewhatweaker relationship, with employment in agriculture and services more sensitive to theminimum wage than employment in the industry sector. The unemployment rate was alsopositively correlated with increases in the real minimum wage.
A key policy implication is that higher economic growth and moderate increases in the realminimum wage are required to reduce unemployment to a level more consistent with othercountries in the region. In turn, this will require sustained implementation of a comprehensivepolicy package focused on macroeconomic stability, structural reform, poverty reduction, andbetter governance (see for example, IMF Occasional Paper 187, Philippines: TowardSustainable and Rapid Growth, 1999). Moreover, the results suggest that excessive increases inthe minimum wage, not justified by price inflation or productivity increases, will likelyadversely affect employment growth, especially in the agriculture and service sectors.
A reduction in population growth may reduce pressures on the job market, and on economicinfrastructure more generally, but the impact would only be felt in the long run. Even if the birthrate fell sharply in coming years, the population entering the workforce (i.e., those over 15 yearsold) would likely grow relatively quickly for the next 15 years (at about 2 percent per year)given that more than one-third of the current population is less than 15 years old. The continuedgrowth in the work force underscores the need for strong policies to support sustained economicgrowth and thereby create jobs for the new entrants.
- 2 2 -
References
Ferguson, C., 1969, The Neoclassical Theory of Production and Consumption, (Cambridge,Cambridge University Press).
Jackman, Richard, Richard Layard, and Stephen Nickell, 1991, Unemployment, MacroeconomicPerformance and the Labour Market, (Oxford University Press).
Rodlauer, M. et al, Philippines: Toward Sustainable and Rapid Growth, Recent Developmentsand the Agenda Ahead, Occasional Paper 187, International Monetary Fund, WashingtonDC 2000.
- 23 - ANNEX I
Labor Force Survey
Data on the labor force, employment and unemployment (presented in Table 1) is derived fromthe Labor Force Survey. The survey covers 41,000 households and is conducted four times ayear, in January, April, July and October. The reference period for the survey is the week priorto the survey interview. The definitions used in the survey are as follows:
Labor force: persons 15 years old and over who are either employed or unemployed.
Employed: persons 15 years old and over who: (1) worked for one hour or more during thereference period for pay or profit (or without pay on the farm or business enterprise operated bya member of the same household); or (2) have a job but are not at work because of temporaryillness/injury, vacation, or other reasons.
Unemployed: persons who have no job/business and are actively looking for work. Alsoconsidered unemployed are persons without a job or business who are not looking for workbecause of their belief that no work was available or because of temporary illness/disability, badweather, or pending job interviews.
Underemployed: employed persons who express the desire to have additional hours of work intheir present job or an additional job, or to have a new job with longer hours.
Comparison with neighboring countries
The statistical basis of the above data is similar to that in neighboring countries such asIndonesia, Korea, Thailand, and Malaysia.13
In Indonesia, data is derived from a quarterly National Labor Force Survey, based on conceptsthat are being similar to the Philippine data except that unemployment is defined morenarrowly. Unemployment excludes those not actively seeking work because of the belief that nojobs are available, whereas these persons are recorded as unemployed in the Philippines.Employment is defined broadly the same as in the Philippines, except that it covers personsaged 10 years and over (compared with 15 years and over in the Philippines).
In Malaysia, data is derived from a quarterly Labor Force Survey, with unemployment definedin the same way as in the Philippines. The main difference is that persons aged 65 and over areexcluded from the employment and unemployment data, whereas they are included in thePhilippines. Unemployment is defined in much the same way as in the Philippines, with adistinction made between those actively seeking work and those "inactively unemployed" whodid not seek work during the reference week (because they did not believe work was available
13 See the International Labor Organization website laborsta.ilo.org for further details.

- 24 - ANNEX I
or those who would have looked for work if they had not been temporarily ill, faced badweather, or were awaiting answers to job applications).
In Korea, a monthly survey of the labor force is the basis for the data, with the definitionsbroadly comparable with the Philippines. The survey covers those aged 15 years and over, withthe main difference with the Philippines being for unpaid family workers (they need to work for18 hours or more to be counted as employed in Korea, compared with only one hour in thePhilippines). Unemployment is defined much as in the Philippines.
In Thailand, data are based on a survey taken three times a year and the definitions are similar tothe Philippines. The survey covers those aged .15 years and over since 1996 (and 13 years andolder before that) who worked for at least one hour for wages, dividends or other forms ofpayment (or those temporarily out of work). The unemployed are defined much the same way asin Korea, Malaysia, and the Philippines.
Data used for modeling
Employment and unemployment data used in the paper are derived from the labor force surveyoutlined above, and is available from 1982.
Wage data used for modeling is based on a weighted average of the minimum wage14 as a noother consistent and timely data for labor costs is available. Average monthly compensation ofpaid employees is available from the Annual Survey of Establishments conducted by theNational Statistics Office, but the latest data is for 1995. An index of compensation peremployee is also published by the National Statistics Coordination Board, but is derived simplyas total compensation divided by total employment and therefore is unadjusted for changes inskill levels of the workforce.15 Better wage data is needed to facilitate labor market analysis. Inparticular, a labor cost index is needed that adjusts for quality changes in the labor force.
Real gross domestic product data is derived from the Philippine National Accounts, as is datafor the GDP deflator. Seasonally adjusted GDP data is used.
The minimum wage for Manila and outside Manila are weighted together using employment.A distinction is made between the minimum wage for agriculture and non-agriculture (with thelatter used in the industry and services employment equations).
For example, the index of compensation per employee for manufacturing fell by about half inthe 1990s (in constant price terms), apparently because a growing share of lower paid jobslowered the average compensation for the sector as a whole.