Why is g so deeply insinuated in social inequality? Linda S. Gottfredson, PhD School of Education...
29
Why is g so deeply insinuated in social inequality? Linda S. Gottfredson, PhD School of Education University of Delaware, USA International Society for the Study of Individual Differences London, July 26, 2011 1
-
date post
19-Dec-2015 -
Category
Documents
-
view
214 -
download
0
Transcript of Why is g so deeply insinuated in social inequality? Linda S. Gottfredson, PhD School of Education...
1
Why is g so deeply insinuated in social inequality?
Linda S. Gottfredson, PhDSchool of Education
University of Delaware, USA
International Society for the Study of Individual Differences London, July 26, 2011

2
Total-Evidence Rule forces opposing explanations to compete head-on
The 2 competitors—• Social privilege theory
• Useful tool theory
3
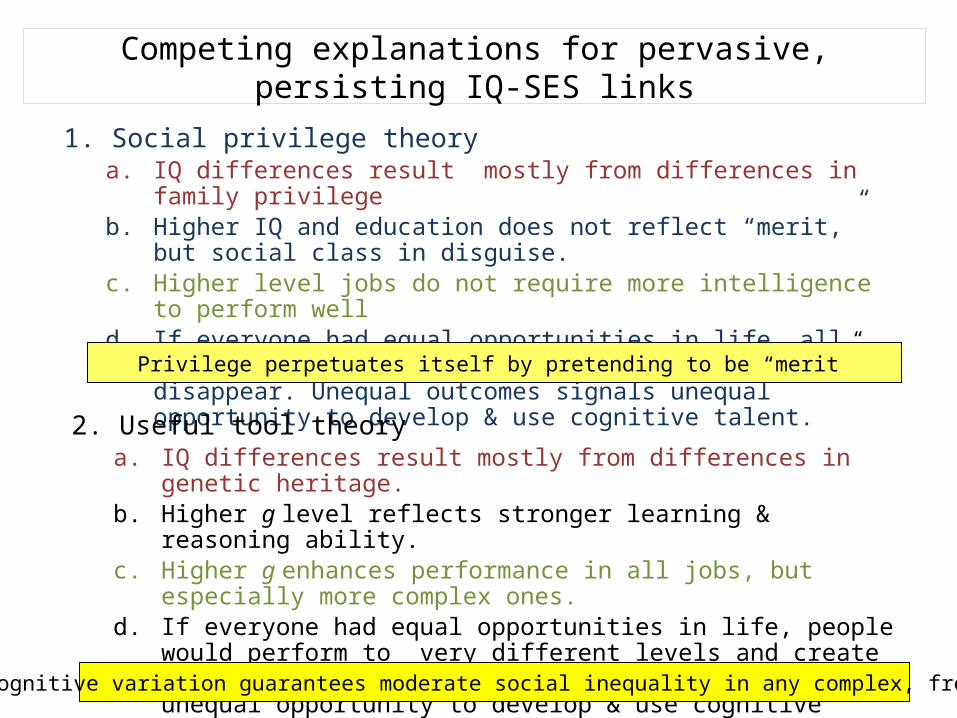
Competing explanations for pervasive, persisting IQ-SES links
1. Social privilege theorya. IQ differences result mostly from differences in family privilegeb. Higher IQ and education does not reflect “merit,” but social class in disguise. c. Higher level jobs do not require more intelligence to perform welld. If everyone had equal opportunities in life, all could perform well and social
inequality would disappear. Unequal outcomes signals unequal opportunity to develop & use cognitive talent.
2. Useful tool theorya. IQ differences result mostly from differences in genetic heritage.b. Higher g level reflects stronger learning & reasoning ability.c. Higher g enhances performance in all jobs, but especially more complex
ones.d. If everyone had equal opportunities in life, people would perform to very
different levels and create social inequality. Equal outcomes would require unequal opportunity to develop & use cognitive talent.
Human cognitive variation guarantees moderate social inequality in any complex, free society
Privilege perpetuates itself by pretending to be “merit”
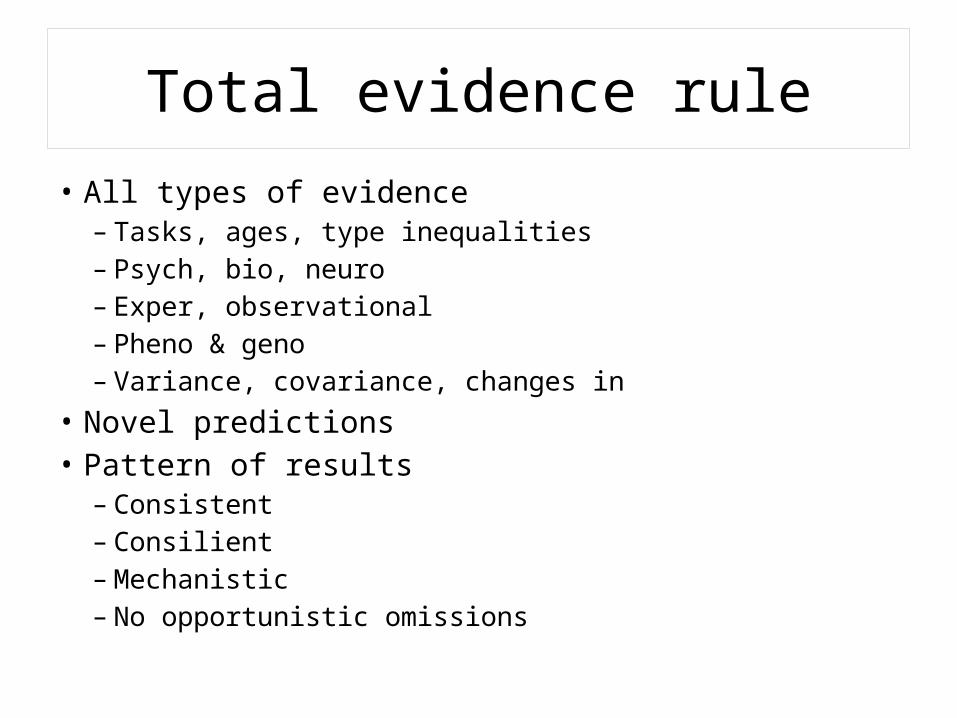
Total evidence rule
• All types of evidence – Tasks, ages, type inequalities– Psych, bio, neuro– Exper, observational– Pheno & geno– Variance, covariance, changes in
• Novel predictions• Pattern of results
– Consistent– Consilient – Mechanistic– No opportunistic omissions

Individual differences (IDs) at issueBackground Personal Socioeconomic Outcomes: Social Rungs & Task Performances Influences Attributes Variation in environments: Opportunities, barriers Personality (“big five”)
g Variation in genotypes: (within age) * ages --
ecific skills, lities, habits Figure 1
Opportunities, barriers Personality (“big five”)
NON- SHARED
SHARED (“family”)
GENES
Education level Occupation level Income level (years completed) (prestige) (dollars)
Academic performance Job performance (within grade) (within occupation)
g (within age) Specific skills, abilities

Causal claims—“social privilege” theoryBackground Personal Socioeconomic Outcomes: Social Rungs & Task Performances Influences Attributes Variation in environments: Opportunities, barriers Personality (“big five”)
g Variation in genotypes: (within age) * ages --
ecific skills, lities, habits Figure 1
Opportunities, barriers Personality (“big five”)
NON- SHARED
SHARED (“family”)
GENES
Education level Occupation level Income level (years completed) (prestige) (dollars)
Academic performance Job performance (within grade) (within occupation)
g (within age) Specific skills, abilities
IQ

Causal claims—“useful tool” theoryBackground Personal Socioeconomic Outcomes: Social Rungs & Task Performances Influences Attributes Variation in environments: Opportunities, barriers Personality (“big five”)
g Variation in genotypes: (within age) * ages --
ecific skills, lities, habits Figure 1
Opportunities, barriers Personality (“big five”)
NON- SHARED
SHARED (“family”)
GENES
Education level Occupation level Income level (years completed) (prestige) (dollars)
Academic performance Job performance (within grade) (within occupation)
g (within age) Specific skills, abilities
8
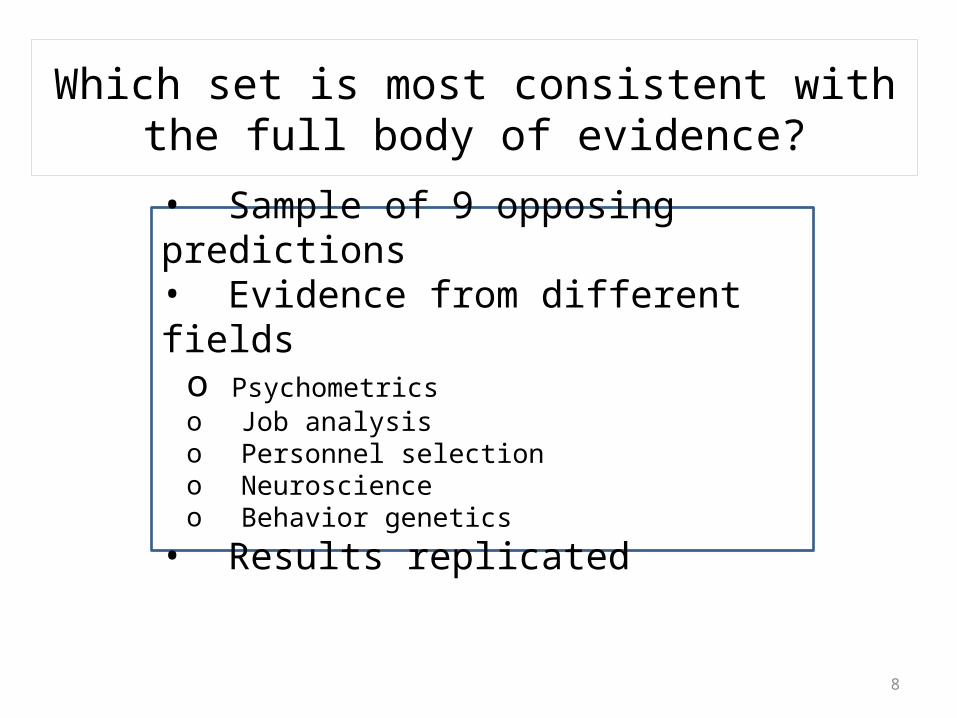
Which set is most consistent with the full body of evidence?
• Sample of 9 opposing predictions • Evidence from different fieldso Psychometricso Job analysiso Personnel selectiono Neuroscienceo Behavior genetics
• Results replicated
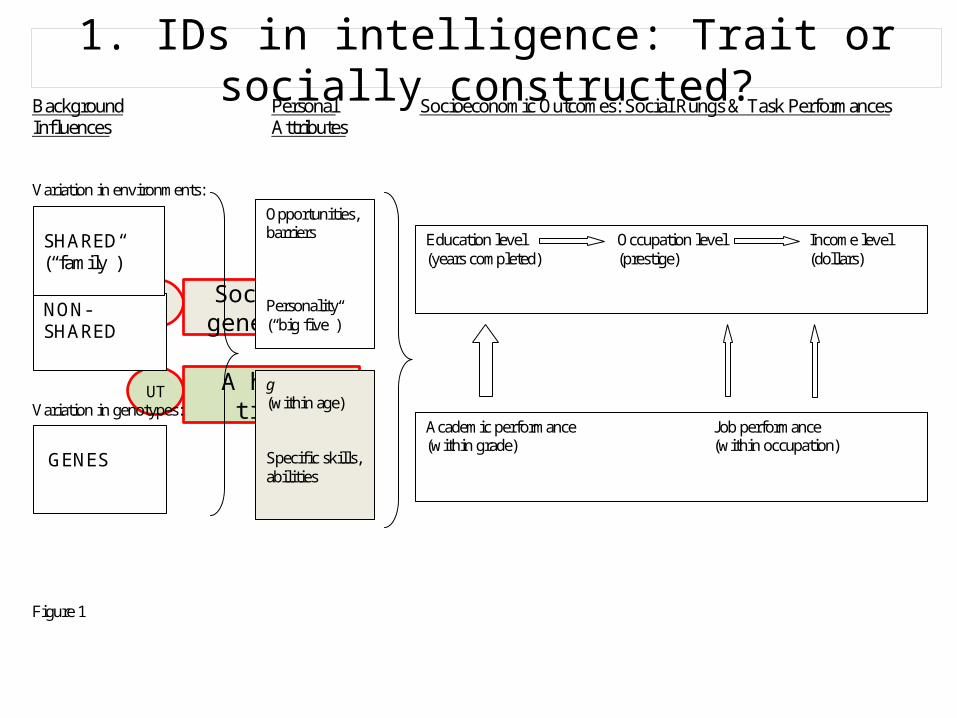
1. IDs in intelligence: Trait or socially constructed?Background Personal Socioeconomic Outcomes: Social Rungs & Task Performances Influences Attributes Variation in environments: Opportunities, barriers Personality (“big five”)
g Variation in genotypes: (within age) * ages --
ecific skills, lities, habits Figure 1
Opportunities, barriers Personality (“big five”)
NON- SHARED
SHARED (“family”)
GENES
Education level Occupation level Income level (years completed) (prestige) (dollars)
Academic performance Job performance (within grade) (within occupation)
g (within age) Specific skills, abilities
SP
UT
Socially generated
A human trait
10
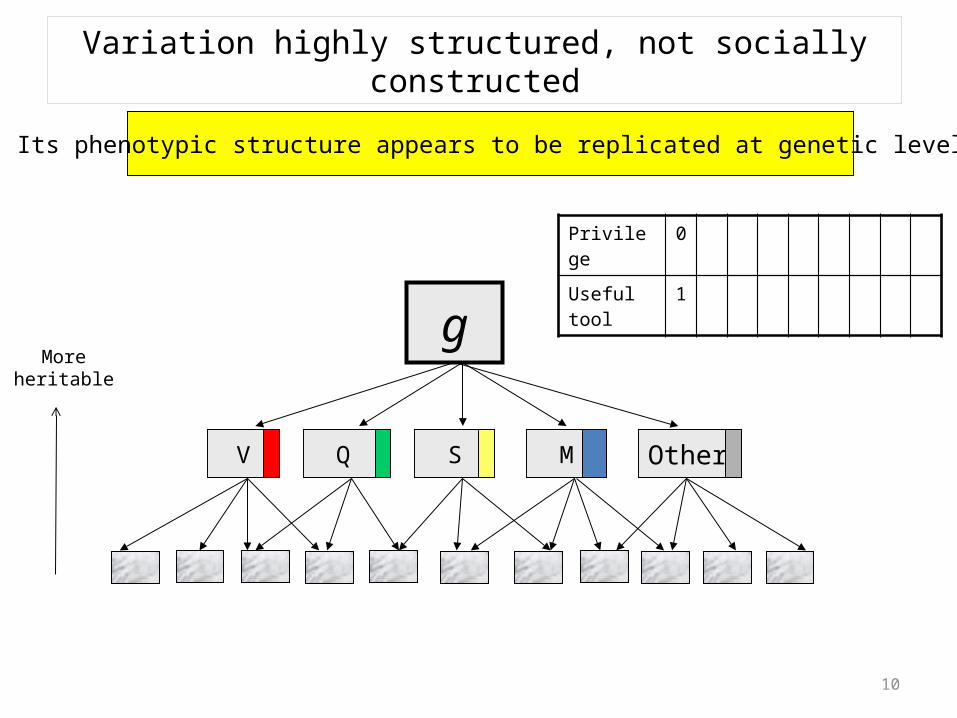
Variation highly structured, not socially constructed
g
V Q S M Others
Its phenotypic structure appears to be replicated at genetic level
More heritable
Privilege 0
Useful tool
1

2. Adult trajectory: Social or biological?Background Personal Socioeconomic Outcomes: Social Rungs & Task Performances Influences Attributes Variation in environments: Opportunities, barriers Personality (“big five”)
g Variation in genotypes: (within age) * ages --
ecific skills, lities, habits Figure 1
Opportunities, barriers Personality (“big five”)
NON- SHARED
SHARED (“family”)
GENES
Education level Occupation level Income level (years completed) (prestige) (dollars)
Academic performance Job performance (within grade) (within occupation)
g (within age) Specific skills, abilities
SP
UT
Adding knowledgeBiological
decline
12
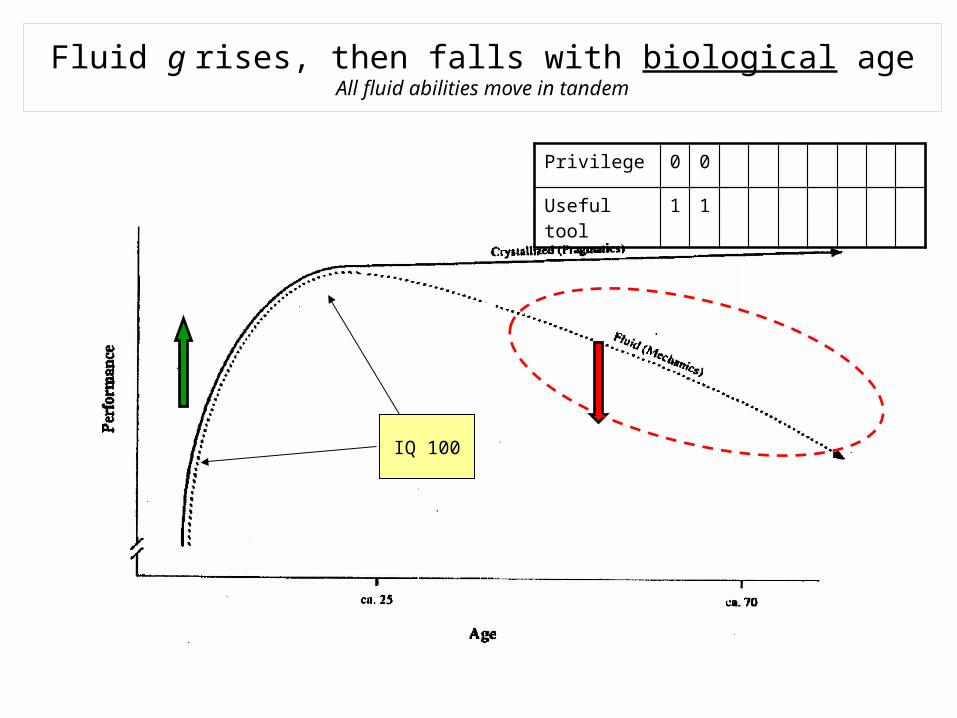
Fluid g rises, then falls with biological ageAll fluid abilities move in tandem
IQ 100
Privilege 0 0
Useful tool 1 1
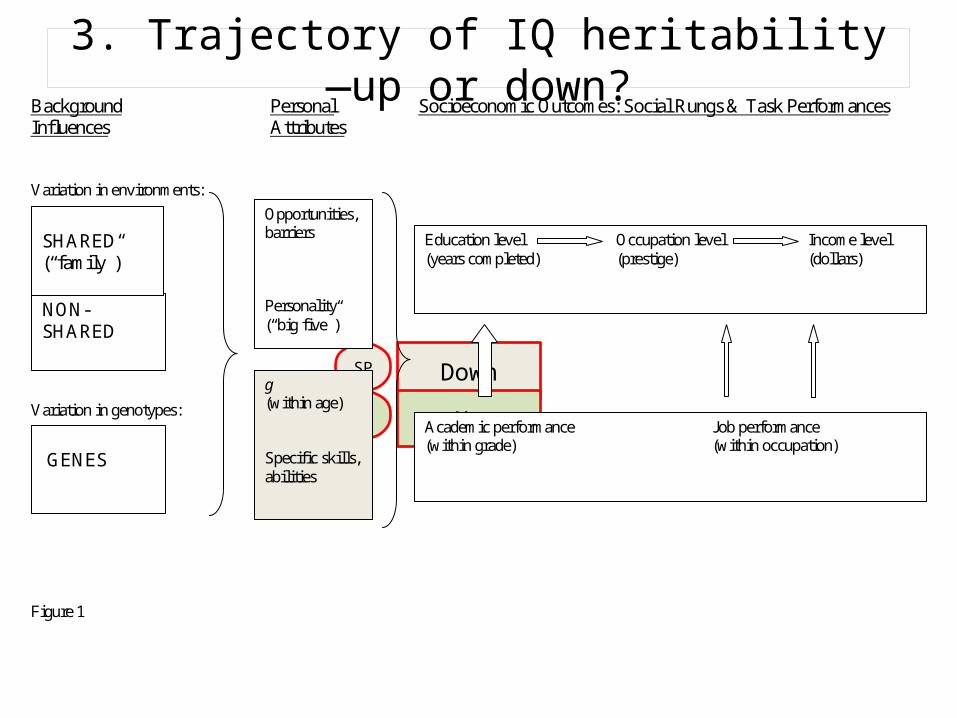
3. Trajectory of IQ heritability—up or down?Background Personal Socioeconomic Outcomes: Social Rungs & Task Performances Influences Attributes Variation in environments: Opportunities, barriers Personality (“big five”)
g Variation in genotypes: (within age) * ages --
ecific skills, lities, habits Figure 1
Opportunities, barriers Personality (“big five”)
NON- SHARED
SHARED (“family”)
GENES
Education level Occupation level Income level (years completed) (prestige) (dollars)
Academic performance Job performance (within grade) (within occupation)
g (within age) Specific skills, abilities
SP
UT
Down
Up

14
Genetic portion of IQ variation rises with ageFamily SES contributions to IQ variation wash away
Privilege 0 0 0
Useful tool 1 1 1
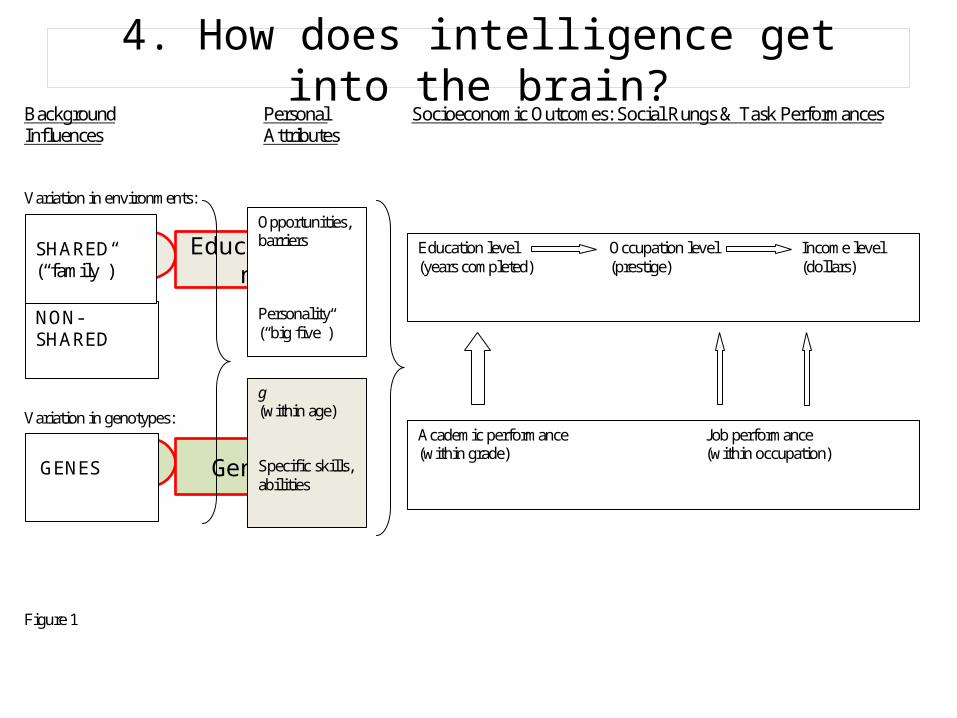
4. How does intelligence get into the brain?Background Personal Socioeconomic Outcomes: Social Rungs & Task Performances Influences Attributes Variation in environments: Opportunities, barriers Personality (“big five”)
g Variation in genotypes: (within age) * ages --
ecific skills, lities, habits Figure 1
Opportunities, barriers Personality (“big five”)
NON- SHARED
SHARED (“family”)
GENES
Education level Occupation level Income level (years completed) (prestige) (dollars)
Academic performance Job performance (within grade) (within occupation)
g (within age) Specific skills, abilities
SP
UT
Education
Genes
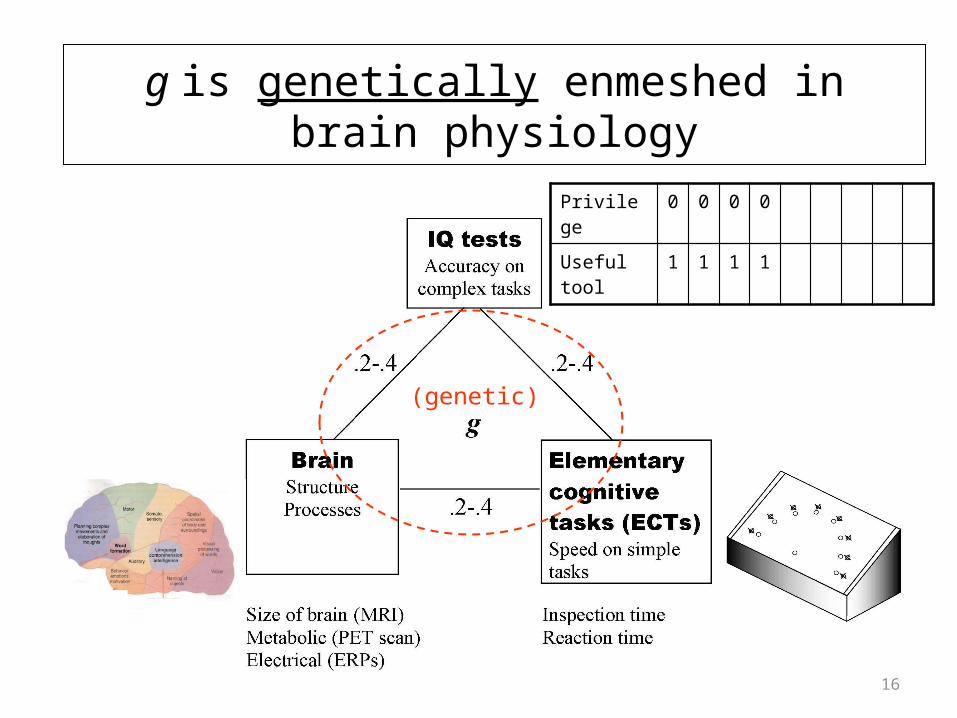
16
(genetic)
g is genetically enmeshed in brain physiology
Privilege 0 0 0 0
Useful tool
1 1 1 1

5. Are higher jobs really more cognitive?Background Personal Socioeconomic Outcomes: Social Rungs & Task Performances Influences Attributes Variation in environments: Opportunities, barriers Personality (“big five”)
g Variation in genotypes: (within age) * ages --
ecific skills, lities, habits Figure 1
Opportunities, barriers Personality (“big five”)
NON- SHARED
SHARED (“family”)
GENES
Education level Occupation level Income level (years completed) (prestige) (dollars)
Academic performance Job performance (within grade) (within occupation)
g (within age) Specific skills, abilities
Background Personal Socioeconomic Outcomes: Social Rungs & Task Performances Influences Attributes Variation in environments: Opportunities, barriers Personality (“big five”)
g Variation in genotypes: (within age) * ages --
ecific skills, lities, habits Figure 1
Opportunities, barriers Personality (“big five”)
NON- SHARED
SHARED (“family”)
GENES
Education level Occupation level Income level (years completed) (prestige) (dollars)
Academic performance Job performance (within grade) (within occupation)
g (within age) Specific skills, abilities
SP
UT
No
Yes

18
The work is more complex
Privilege 0 0 0 0 0
Useful tool 1 1 1 1 1

6. Does g really predict job performance? Background Personal Socioeconomic Outcomes: Social Rungs & Task Performances Influences Attributes Variation in environments: Opportunities, barriers Personality (“big five”)
g Variation in genotypes: (within age) * ages --
ecific skills, lities, habits Figure 1
Opportunities, barriers Personality (“big five”)
NON- SHARED
SHARED (“family”)
GENES
Education level Occupation level Income level (years completed) (prestige) (dollars)
Academic performance Job performance (within grade) (within occupation)
g (within age) Specific skills, abilities
Background Personal Socioeconomic Outcomes: Social Rungs & Task Performances Influences Attributes Variation in environments: Opportunities, barriers Personality (“big five”)
g Variation in genotypes: (within age) * ages --
ecific skills, lities, habits Figure 1
Opportunities, barriers Personality (“big five”)
NON- SHARED
SHARED (“family”)
GENES
Education level Occupation level Income level (years completed) (prestige) (dollars)
Academic performance Job performance (within grade) (within occupation)
g (within age) Specific skills, abilities
SP
UT
No
Yes

20
The work is more complexpredictive
validity of g
Privilege 0 0 0 0 0 0
Useful tool
1 1 1 1 1 1
.8
.5
.2

7. Do social outcomes have genetic component?Background Personal Socioeconomic Outcomes: Social Rungs & Task Performances Influences Attributes Variation in environments: Opportunities, barriers Personality (“big five”)
g Variation in genotypes: (within age) * ages --
ecific skills, lities, habits Figure 1
Opportunities, barriers Personality (“big five”)
NON- SHARED
SHARED (“family”)
GENES
Education level Occupation level Income level (years completed) (prestige) (dollars)
Academic performance Job performance (within grade) (within occupation)
g (within age) Specific skills, abilities
IQ
SP
UT Yes
No
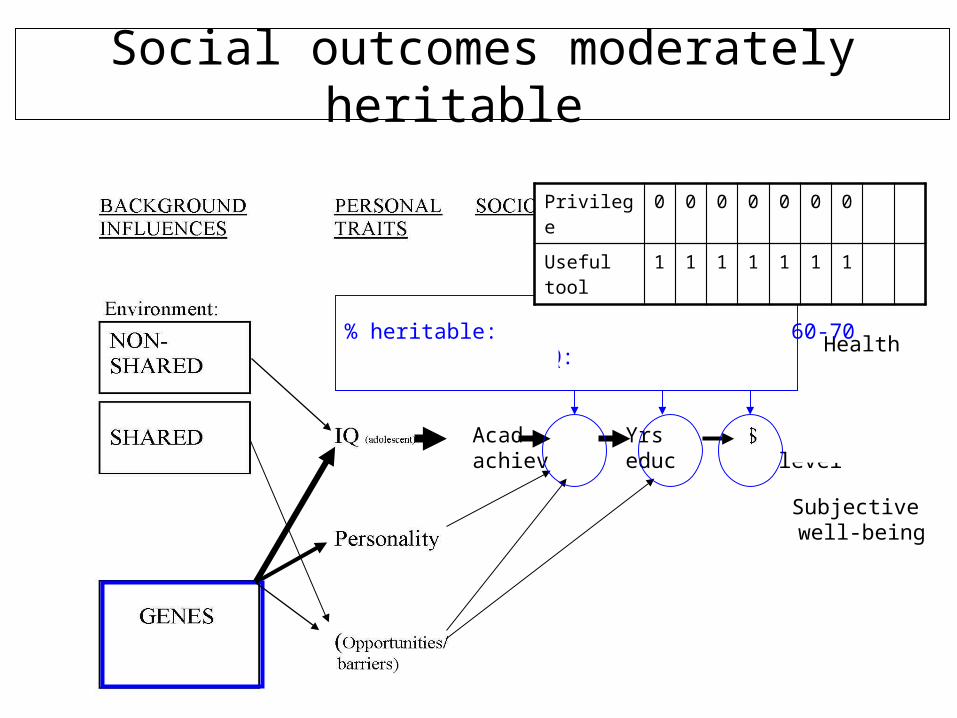
22
Acad Yrs Occachiev educ level
Health
Subjective well-being
% heritable: 60-70 50 40-50% jointly with IQ:
Social outcomes moderately heritable
Privilege 0 0 0 0 0 0 0
Useful tool 1 1 1 1 1 1 1

8. Is IQ-outcome covariation entirely social?Background Personal Socioeconomic Outcomes: Social Rungs & Task Performances Influences Attributes Variation in environments: Opportunities, barriers Personality (“big five”)
g Variation in genotypes: (within age) * ages --
ecific skills, lities, habits Figure 1
Opportunities, barriers Personality (“big five”)
NON- SHARED
SHARED (“family”)
GENES
Education level Occupation level Income level (years completed) (prestige) (dollars)
Academic performance Job performance (within grade) (within occupation)
g (within age) Specific skills, abilities
IQ
SP
UT
Yes
No

24
Acad Yrs Occachiev educ level
Health
Subjective well-being
% heritable: 60-70 50 40-50% jointly with IQ: 40 25 20
Privilege 0 0 0 0 0 0 0 0
Useful tool 1 1 1 1 1 1 1 1
Covariation also moderately heritable

25
Acad Yrs Occachiev educ level
Health
Subjective well-being
% heritable: 60-70 50 40-50% jointly with IQ: 40 25 20
Privilege 0 0 0 0 0 0 0 0
Useful tool 1 1 1 1 1 1 1 1
Covariation also moderately heritable
Also—Predictions about geno components of covariance with g

9. Can equal training or experience eliminate IQ-performance link?
Background Personal Socioeconomic Outcomes: Social Rungs & Task Performances Influences Attributes Variation in environments: Opportunities, barriers Personality (“big five”)
g Variation in genotypes: (within age) * ages --
ecific skills, lities, habits Figure 1
Opportunities, barriers Personality (“big five”)
NON- SHARED
SHARED (“family”)
GENES
Education level Occupation level Income level (years completed) (prestige) (dollars)
Academic performance Job performance (within grade) (within occupation)
g (within age) Specific skills, abilities
SP
UT
Yes
No
g remains predictive—always need to learn & reason
Privilege 0 0 0 0 0 0 0 0 0
Useful tool 1 1 1 1 1 1 1 1 1

9. Can equal training or experience eliminate IQ-performance link?
Background Personal Socioeconomic Outcomes: Social Rungs & Task Performances Influences Attributes Variation in environments: Opportunities, barriers Personality (“big five”)
g Variation in genotypes: (within age) * ages --
ecific skills, lities, habits Figure 1
Opportunities, barriers Personality (“big five”)
NON- SHARED
SHARED (“family”)
GENES
Education level Occupation level Income level (years completed) (prestige) (dollars)
Academic performance Job performance (within grade) (within occupation)
g (within age) Specific skills, abilities
SP
UT
Yes
No
g remains predictive—always need to learn & reason
Also—novel predictions on social interventions aimed at changing variance or covariance
Privilege 0 0 0 0 0 0 0 0 0
Useful tool 1 1 1 1 1 1 1 1 1
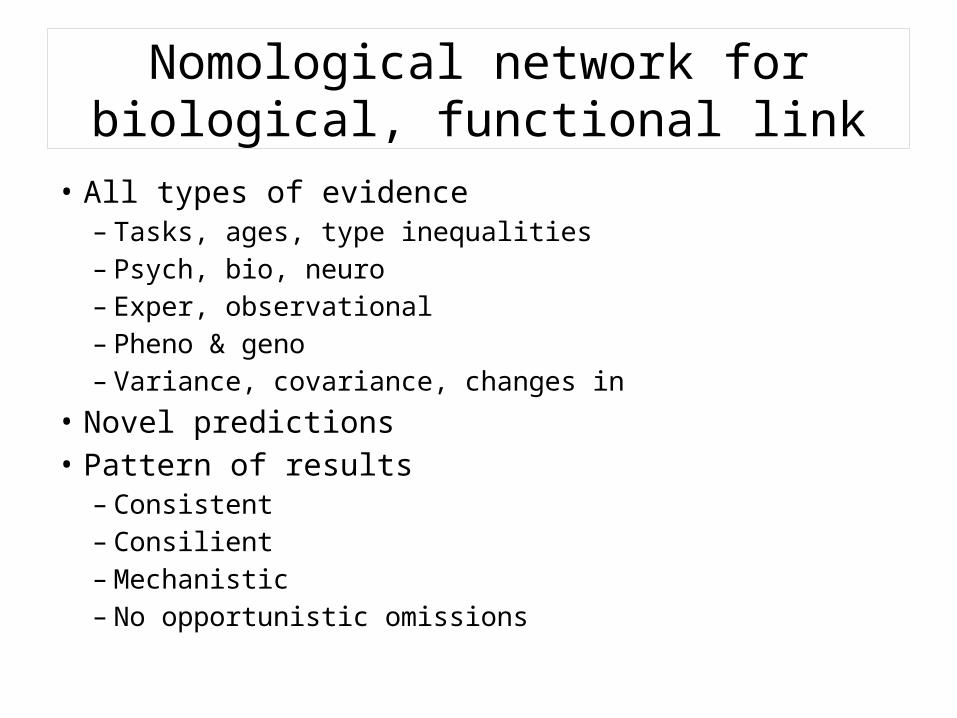
Nomological network for biological, functional link
• All types of evidence – Tasks, ages, type inequalities– Psych, bio, neuro– Exper, observational– Pheno & geno– Variance, covariance, changes in
• Novel predictions• Pattern of results
– Consistent– Consilient – Mechanistic– No opportunistic omissions

Thank you


![A Study of the Behavior of Law [Michael R. Gottfredson and Michael J. Hindelang, 1979]](https://static.fdocuments.us/doc/165x107/577cc4581a28aba71198f8b6/a-study-of-the-behavior-of-law-michael-r-gottfredson-and-michael-j-hindelang.jpg)