Why Invest in Property? - Riverside Capital
10
Why Invest in Property? A Comparative Analysis of UK Commercial Property, Bonds and Gilts
Transcript of Why Invest in Property? - Riverside Capital

Why Invest in Property? A Comparative Analysis of UK Commercial Property, Bonds and Gilts

Why Invest in Property? A Comparative Analysis of UK Commercial Property, Bonds and Gilts
2
Why Include Commercial Property in an Investment Portfolio?
The last decade has seen investors make significant returns from investing in property.
Whilst the market crash of 2007-2009 was a reminder that property investment was not
without risk, it remains a core investment due to its long term secure cash-flow, relatively
high income (compared to bonds and gilts) and lower volatility (than equities).
Commercial property’s overall lack of correlation to fixed income and equities make it an
important asset class to include, by way of diversifying risk, in an investment portfolio.
With bond yields at unprecedentedly low levels, institutional investors have been looking
beyond government bond markets for sources of income to meet their liabilities, leading to
a widespread increase in such investors looking to increase their allocation to commercial
property.
The significant returns on offer, and the ability to increase these returns through various
asset management strategies, make property investment attractive.
Commercial Property Performance Cycle Property is a cyclical asset, albeit one whose value can fluctuate over long-lasting cycles. The Centre for Economics and Business Research (CEBR) has summarised the four stages of a property cycle: Stage I: Businesses contract, resulting in a reduction in demand for property, causing rents and values to fall. Borrowing becomes difficult as banks show a reluctance to lend. Stage II: Prime property, such as that within the City of London and the West End, provide a floor in prices. Investors are often from overseas and operate with a long-term view on their investments. Stage III: There is a flight to quality, with only the best space seeing rental increases. Stage IV: Secondary market locations begin to rise in value. At this stage, financing is more easily available and investor interest extends outward from prime real estate owing to a lack of investment opportunities.

Why Invest in Property? A Comparative Analysis of UK Commercial Property, Bonds and Gilts
3
Historical Performance
According to data from the Investment Property Databank (IPD), UK equities outperformed
UK property in fifteen out of twenty years between 1980 and 2000. Over this period,
equities were in bull market and property returns were deemed to be relatively unexciting.
Commercial property therefore remained an underinvested asset class.
Equity values eventually collapsed in 2000 as the Dot Com bubble burst, and over the
following three years investors saw a significant fall in the value of their holdings. Over the
same period, property exhibited a significant lack of correlation as returns remained
positive due, largely, to the stable income that property can offer. Whilst a global recession
was fully expected it failed to materialise as the US government started to print money and
ushered in an extended period of low interest rates. This policy was replicated around the
world, and the significant level of money flowing into the market, together with the
availability of unprecedented levels of bank debt, combined to drive property values ever
higher between 2003 & 2007.
This upward trend came to an abrupt halt with the onset of the financial crisis in 2008 and the subsequent global recession. Many commercial property funds and over leveraged buyers were forced to sell assets at heavily discounted prices and lending banks largely withdrew from the market. By late 2009, the market had fallen by approximately 50%, on average, from the mid 2007 peak. In the case of some poorer quality commercial property assets, the falls were even steeper. Whilst property values have bounced somewhat since the market bottomed in 2009, when investors took advantage of distressed valuations, they still remain 29% below their 2007 peaks (Fig. 1). Fig. 1
100
150
200
250
300
Gro
wth
of
£10
0 in
vest
ed i
n 1
980
All property capital growth
IPD, All Property Index (1980 = 100)

Why Invest in Property? A Comparative Analysis of UK Commercial Property, Bonds and Gilts
4
Unsurprisingly, there has been a significant difference between the performance of London & non London properties, with offices in the city and West end being the strongest performing sector. Many prime central London properties are now trading at values similar to the peak values of mid 2007 (Fig. 2). Fig.2
Commercial Property Returns V UK equities and UK Gilts The argument for investing in commercial real estate remains compelling. Historical data shows that over varying periods, property returns have been highly competitive with the other major asset classes (Fig. 3). Fig. 3
100
150
200
250
300
350
19
80
19
85
19
90
19
95
20
00
20
05
20
10
20
12
Gro
wth
of
£1
00
in
vest
ed i
n 1
98
0
Capital growth of West End & City offices
City offices West End offices
0%
2%
4%
6%
8%
10%
12%
14%
1 yrs 10 yrs 20yrs 40 yrs
Total Return by Asset Class
Commercial Property UK Gilts FTSE all-share
Why Invest in Property? A Comparative Analysis of UK Commercial Property, Bonds and Gilts
5
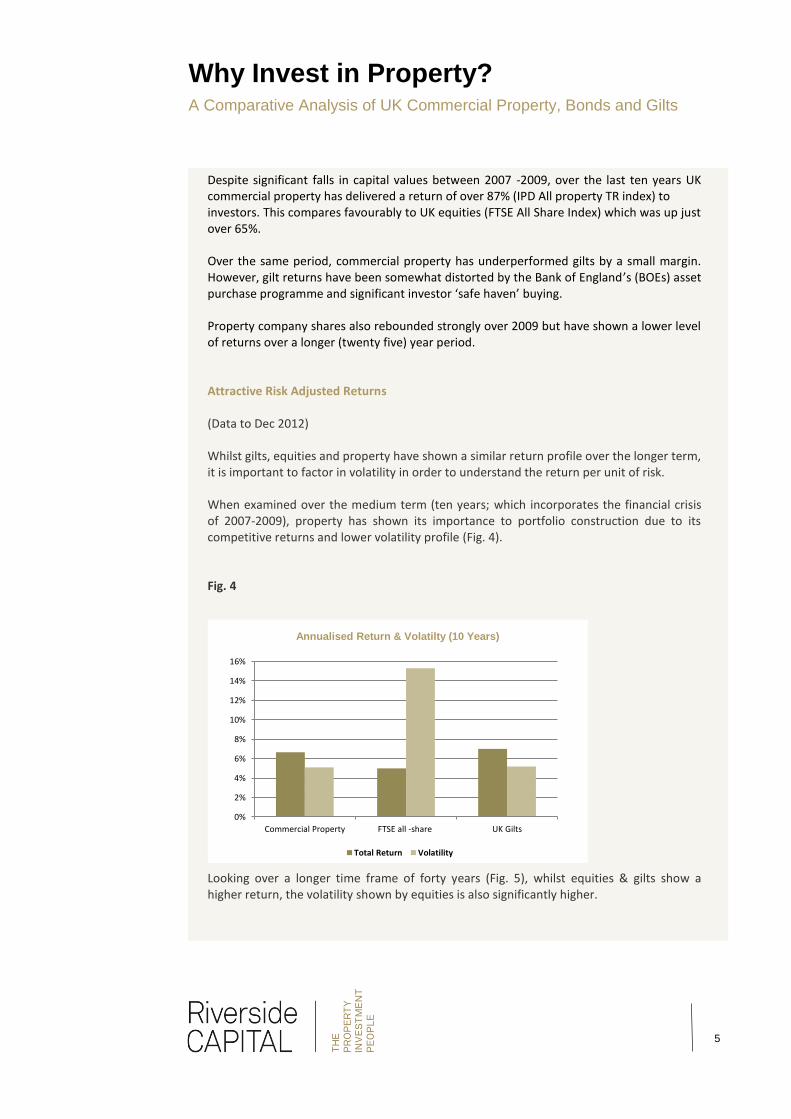
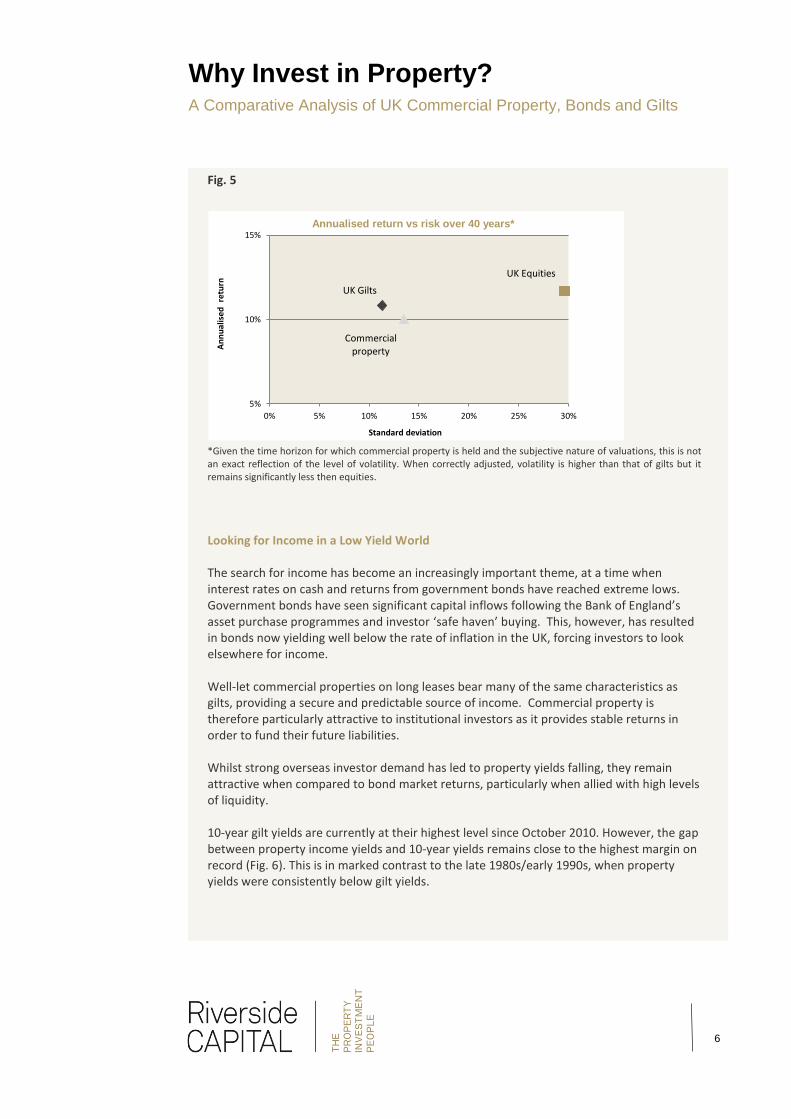
Despite significant falls in capital values between 2007 -2009, over the last ten years UK commercial property has delivered a return of over 87% (IPD All property TR index) to investors. This compares favourably to UK equities (FTSE All Share Index) which was up just over 65%. Over the same period, commercial property has underperformed gilts by a small margin. However, gilt returns have been somewhat distorted by the Bank of England’s (BOEs) asset purchase programme and significant investor ‘safe haven’ buying. Property company shares also rebounded strongly over 2009 but have shown a lower level of returns over a longer (twenty five) year period. Attractive Risk Adjusted Returns (Data to Dec 2012) Whilst gilts, equities and property have shown a similar return profile over the longer term, it is important to factor in volatility in order to understand the return per unit of risk. When examined over the medium term (ten years; which incorporates the financial crisis of 2007-2009), property has shown its importance to portfolio construction due to its competitive returns and lower volatility profile (Fig. 4). Fig. 4 Looking over a longer time frame of forty years (Fig. 5), whilst equities & gilts show a higher return, the volatility shown by equities is also significantly higher.
0%
2%
4%
6%
8%
10%
12%
14%
16%
Commercial Property FTSE all -share UK Gilts
Annualised Return & Volatilty (10 Years)
Total Return Volatility
Why Invest in Property? A Comparative Analysis of UK Commercial Property, Bonds and Gilts
6
Fig. 5 *Given the time horizon for which commercial property is held and the subjective nature of valuations, this is not an exact reflection of the level of volatility. When correctly adjusted, volatility is higher than that of gilts but it remains significantly less then equities.
Looking for Income in a Low Yield World The search for income has become an increasingly important theme, at a time when interest rates on cash and returns from government bonds have reached extreme lows. Government bonds have seen significant capital inflows following the Bank of England’s asset purchase programmes and investor ‘safe haven’ buying. This, however, has resulted in bonds now yielding well below the rate of inflation in the UK, forcing investors to look elsewhere for income. Well-let commercial properties on long leases bear many of the same characteristics as gilts, providing a secure and predictable source of income. Commercial property is therefore particularly attractive to institutional investors as it provides stable returns in order to fund their future liabilities. Whilst strong overseas investor demand has led to property yields falling, they remain attractive when compared to bond market returns, particularly when allied with high levels of liquidity. 10-year gilt yields are currently at their highest level since October 2010. However, the gap between property income yields and 10-year yields remains close to the highest margin on record (Fig. 6). This is in marked contrast to the late 1980s/early 1990s, when property yields were consistently below gilt yields.
Commercial property
UK Equities
UK Gilts
5%
10%
15%
0% 5% 10% 15% 20% 25% 30%
An
nu
alis
ed r
etu
rn
Standard deviation
Annualised return vs risk over 40 years*

Why Invest in Property? A Comparative Analysis of UK Commercial Property, Bonds and Gilts
7
Fig. 6
Source IPD Quarterly Digest Q4 2012
The Importance of Income to Overall Returns As with equities and bonds, property returns are derived from two different components; income (return) & capital (growth). While capital growth has been important, particularly over shorter time frames, historically, the income element of commercial property has accounted for two thirds of the overall total return. Over the last 10 years this has been even higher, with rental income accounting for 94% of the overall return. Strong capital growth over 2003–2007 was wiped out by significant falls in 2008 as markets crashed, liquidity dried up and investors were forced to sell assets (often at distressed prices) in an effort to raise capital. Property markets recovered sharply in 2010 with capital growth once again being the primary driver behind gains. Despite the post 2008 recovery, capital growth has essentially remained flat over the past 10 years. Over the same period however, a stable level of Income has been sufficient for property to achieve an attractive annualised return of just over 6%.
-1
0
1
2
3
4
5
6
7
8
Dec
-01
Dec
-02
Dec
-03
Dec
-04
Dec
-05
Dec
-06
Dec
-07
Dec
-08
Dec
-09
Dec
-10
Dec
-11
Dec
-12
Pe
rcen
tage
10 year govt yield vs IPD all property yield
All Property 10 Year Govt bond yield Yield Gap

Why Invest in Property? A Comparative Analysis of UK Commercial Property, Bonds and Gilts
8
Fig. 7 The income generating characteristics (Fig.7) will continue to be an attractive option for investors in what is expected to be a low growth environment.
Diversification Benefits
With returns showing a low correlation to equities and fixed income assets (Table. 1), an allocation to property can therefore help reduce risk and smooth returns as part of a diversified portfolio.
Over a twenty five year period the correlation between Commercial property and equities
is statistically insignificant and with gilts is negative.
Table. 1
Correlation Coefficient 1987 -2011 All property index UK Equities FT Gilts 5-15 years
(IPD) (FTSE All Share)
All property Index - 0.11 -0.18
UK Equities 0.11 - 0.01
FT Gilts 5-15 years -0.18 0.01 -
At times of market dislocation, property has shown a negative correlation to both equities
and bonds. In 1990 property prices fell as did equities, whilst bonds made positive returns.
In 1987 and 2002, equities fell sharply, with property exhibiting positive returns for the
year.
The benefits of diversification were not shown during the financial crisis (post 2008) as
most major asset classes correlated to 1 and property and equities (FTSE 100) fell -22% & -
31% respectively.
-30%
-25%
-20%
-15%
-10%
-5%
0%
5%
10%
15%
20%
Dec-01 Dec-02 Dec-03 Dec-04 Dec-05 Dec-06 Dec-07 Dec-08 Dec-09 Dec-10 Dec-11 Dec-12
Income return vs Capital growth
Income Return (IPD) Capital Return (IPD)

Why Invest in Property? A Comparative Analysis of UK Commercial Property, Bonds and Gilts
9
With cheap debt no longer driving investment returns and macro-economic concerns
easing, however, we are now starting to see property regain its former uncorrelated
relationship with equities. This was evidenced in 2011 where property returns were up
7.7%, whereas the FTSE was down 3.5%.
Property as an Inflation Hedge
When examined over the longer term, there is a powerful argument for using commercial property as an inflation hedge. Since 1980, IPD All Property Returns have averaged 9% per annum vs. inflation of 4.2% (see Fig. 8) with only two periods (1990-1993) & (2007 -2008) showing real returns as negative. Fig. 8 In response to the financial crisis, central banks around the world commenced programmes of Quantitative Easing (QE) in order to stimulate the global economy. The Bank of England implemented programs to the tune of £325 billion (or $517 billion), whilst the US Federal Reserve used QE to purchase US$2 trillion of bonds. Though we are yet to see this money flow through to the real economy, central bank actions have almost made higher inflation inevitable at some point in the future. In an environment of rising inflation, the value of “real assets” becomes more valuable. Real assets typically pay income and can act as an excellent hedge against inflation. Given that there are limited inflation hedging investments, the attraction of property, and the opportunity it provides to protect against rising inflation, will likely lead to an inflow of capital and result in property values rising.
-30.0
-20.0
-10.0
0.0
10.0
20.0
30.0
40.0
Commercial property returns vs Inflation (RPI)
UK commercial property Return (nominal) Inflation RPI

Why Invest in Property? A Comparative Analysis of UK Commercial Property, Bonds and Gilts
10
Conclusion Over the last thirty years, commercial property has provided investors with a highly attractive level of total returns. According to the IPD, the average annualised return from 1980 was 9.0%, of which 6.8% represented income return.
For an asset-backed, relatively low-volatility investment, commercial property continues to offer a very attractive level of income (6.1% annualised over the last three years).
Commercial property can provide protection against inflation over the medium to long term as a result of index linked rent increases. It can also add further protection through active asset management.
A good asset manager would expect to beat inflation through active strategies, which would not only focus on capital growth but also look to achieve higher rents, longer income and improved tenancies by better utilising the space, or by carrying out a complete refurbishment or redevelopment. Whilst an ‘extraordinary’ environment has led to heightened volatility over the short term, over the longer term, commercial property has proved to be a much less volatile asset class than equities. The yield advantage over bonds has never been higher. This is in marked contrast to the late 1980s/early 1990s, when property yields were consistently below bond yields. Property is a valuable portfolio diversification tool as historically, commercial property returns have tended to have a low correlation with returns from equities and bonds. Commercial property and equity markets typically respond differently to the economic cycle, therefore, the inclusion of property in an investment portfolio could reduce risk and smooth overall returns. Despite the current macro-economic uncertainty, commercial property will continue to be an attractive asset class for many investors. Following a two year recovery period, markets appear to have settled and now provide an excellent opportunity for investors with a long-term perspective to acquire UK commercial property at attractive yields. For further information please contact:
Jaspal Phull Head of Research Tel: +44 (0)20 7297 4480 Email: [email protected]