WHY INDIA & BANGALORE? - Coviamcoviam.com/files/coviam_Ebrochure.pdfThe world is coming to India for...
28
3/16/2016 Company Confidential 1 WHY INDIA & BANGALORE?
Transcript of WHY INDIA & BANGALORE? - Coviamcoviam.com/files/coviam_Ebrochure.pdfThe world is coming to India for...

3/16/2016 Company Confidential 1
WHY INDIA &BANGALORE?

The world is coming to India for their talent needs…
• 30 year old industry - Began in 1985 in Bangalore
• IT Sector employs 3.2 million directly and ~ 10 million indirectly
• 200,000 engineers joining the IT industry every year
• 825+ global corporate offshore centers are in India
• Total industry revenues of $118 billion in 2014
• Industry growing at 14%
• Data security and privacy regulations are in place – The IT Act
2000
• SEZ act provides for a 15 year tax holiday scheme
• Labor costs advantage – salary differentials of 50% - 70% lower
than US
• Increasing talent maturity and deep domain expertise
• Service delivery, quality of output and types of engagements
have matured to cater to all types of requirements
• Global talent with many qualified global expatriates &
returnees
• Many companies driving their innovation, R&D centers, patent
portfolios and product ideation programs out of their India
offshore centers
0%
10%
20%
30%
40%
50%
60%
70%
80%
90%
100%
2005 2009 2010 2011 2012 2013
India's share RoW share
RoW – Rest of the World Source : Nasscom
51% 49% 45% 42% 43% 48%
49% 51% 55% 58% 58% 52%
India’s share in global sourcing of services

62%17%
11%
8%
2%
Geographic Diversification
US
UK
Continental
Europe
APAC
RoW
45%
32%
13%
5%
5%
Industry skill based estimate
Graduate (excl. Engg)
Engg Graduates
Post Graduates
Finance Specialists
Others
16%
19%
10%5%
3%3%
2%
42%
Industry Diversification
Manufacturing
Hi-Tech / Telecom
Retail
Healthcare
T&T
Construction & Utilities
MPE
BFSI
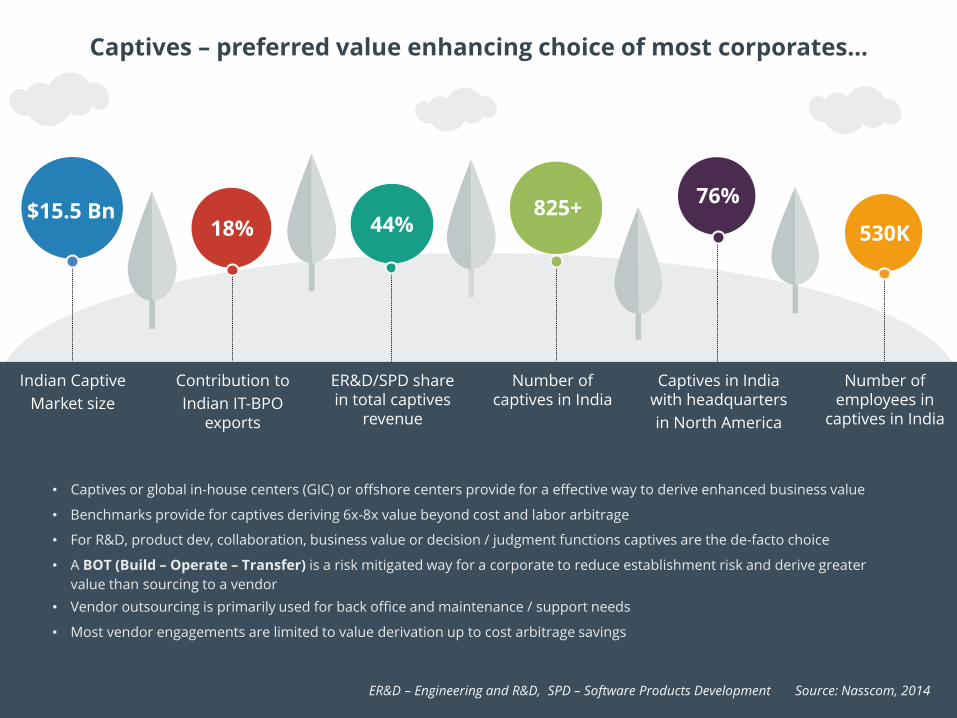
Indian Captive
Market size
18%$15.5 Bn 825+
76%
44% 530K
Contribution to
Indian IT-BPO exports
Number of captives in India
Captives in India with headquarters
in North America
ER&D/SPD share in total captives
revenue
Number of employees in
captives in India
Captives – preferred value enhancing choice of most corporates…
• Captives or global in-house centers (GIC) or offshore centers provide for a effective way to derive enhanced business value
• Benchmarks provide for captives deriving 6x-8x value beyond cost and labor arbitrage
• For R&D, product dev, collaboration, business value or decision / judgment functions captives are the de-facto choice
• A BOT (Build – Operate – Transfer) is a risk mitigated way for a corporate to reduce establishment risk and derive greater
value than sourcing to a vendor
• Vendor outsourcing is primarily used for back office and maintenance / support needs
• Most vendor engagements are limited to value derivation up to cost arbitrage savings
ER&D – Engineering and R&D, SPD – Software Products Development Source: Nasscom, 2014

Higher controlHigher costsLower Risk
Joint Venture
Company Captive
BOT
Hybrid – Captive
& Outsourced
Outsourced
Lower controlLower costsHigher Risk
Some of the leading MNCs that have captive centers in India are…
ABN Amro
Acceenture
AIA
Airbus
Amazon
Amex
ANZ
AOL
AT&T
Axa
Barclays
British Telecom
Caterpillar
Cisco
Continental
Dell
Dow Chemical
Exxon Mobile
Ford
GM
HP
Honeywell
HSBC
IBM
Intel
JP Morgan
Marriott
McKinsey
Mercedes Benz
Microsoft
Motorola
Nokia
Oracle
Pfizer
Philips
Prudential
RBS
Shell
Siemens
Target
Telstra
Tesco
Thomson
Reuters
Volvo
World bank
Yahoo
3M

Bangalore – The preferred choice of the majority….
• Bangalore is home to 39% of all R&D centers & 44% of all GIC’s
in India
• Is home to 4158 schools, 55 polytechnics, 66 engineering
colleges & 9 universities including India’s top most universities
in management, IT, design, statistics and astrophysics
• Attracts graduates from 18,000 institutes of higher learning
from all over India
• Has the most talented and diverse talent pool compared to any
other city
• Has a unique eco-system for R&D, IT, startup and product
companies

Patents out of Bangalore centers
• IBM (4800)
• HP (1100)
• GE (1000)
• Texas Instruments (800)
• CISCO (800)
• Qualcomm (230)
• Phillips (210)
• Samsung (135)
• Huawei (200)
• Mercedes (200)
44%
21%
15%
10%7%
3%
Bangalore Delhi NCR Mumbai/Pune
Chennai Hyderabad Other cities
56%
18%
24%
2%
<500 500-1000 1000-1500 >5000

3/16/2016 Company Confidential 8
BOT MODELEXPLAINED

Independent developers
Multiple locations
No cohesive process
Complicated to manage
Expensive
Freelancers
Fixed bid
No control over talent
No continuity
Discipline on
requirements
Process maturity
needs high
Dev. factories
Dedicated talent
Management effort required
Less control over talent
Indirect costs high
Located on vendor site – IP loss possible
OffshoreDev. center
Local experience
required
Max control
Mgmt. involved day to day
Highest costs
Operational & establishment
risks high
Captive
Max flexibility & control
Hiring & scale Management Process
Minimized risk
Pay as you go
Lower costs
Tax efficient
Take ownership when ready
PBOT
POSSIBLE SOURCING MODELS

3/16/2016 Company Confidential 10COVIAM Services Provided in The PBOT Model

3/16/2016
PBOT - COST Plus model
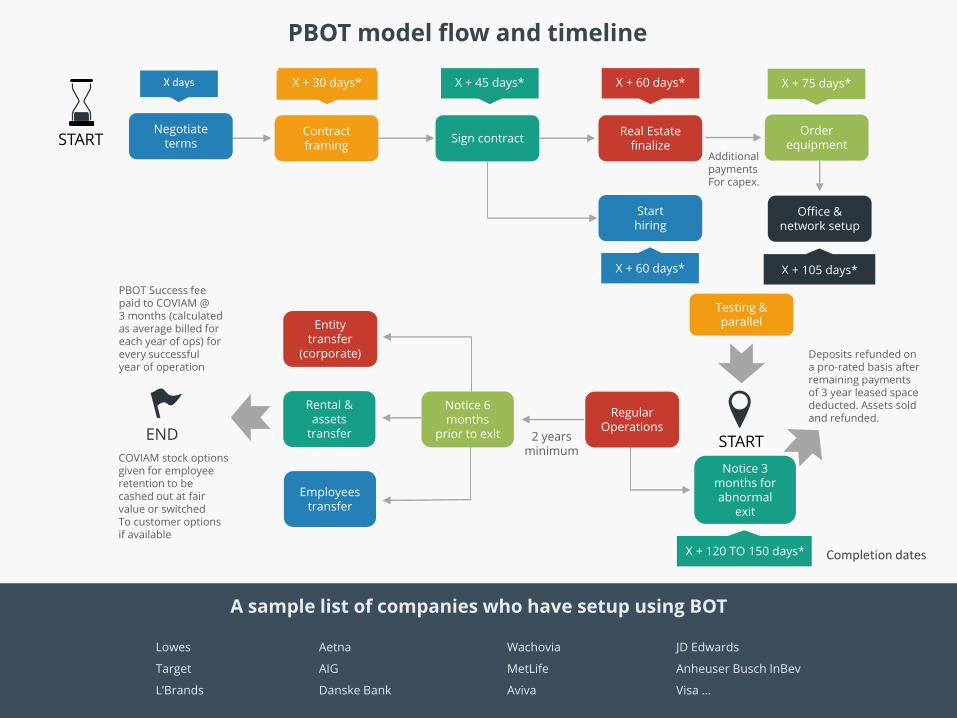
Contract framing
Sign contractReal Estate
finalize
Start hiring
Order equipment
Office & network setup
Additional payments For capex.
Testing & parallel
START
Notice 3 months for abnormal
exit
Entity transfer
(corporate)
Employeestransfer
Rental & assets
transfer
PBOT Success feepaid to COVIAM @3 months (calculatedas average billed foreach year of ops) forevery successful year of operation
END 2 yearsminimum
Notice 6 months
prior to exit
Deposits refunded on a pro-rated basis after remaining payments of 3 year leased space deducted. Assets sold and refunded.
COVIAM stock options given for employee retention to be cashed out at fair value or switched To customer options if available
A sample list of companies who have setup using BOT
PBOT model flow and timeline
Negotiateterms
X days X + 30 days* X + 45 days* X + 60 days* X + 75 days*
X + 60 days* X + 105 days*
START
X + 120 TO 150 days*
RegularOperations
Lowes
Target
L’Brands
Aetna
AIG
Danske Bank
Wachovia
MetLife
Aviva
JD Edwards
Anheuser Busch InBev
Visa …
Completion dates

3/16/2016 Company Confidential 13
WHY COVIAM?

WHO WE ARE?
We are a boutique lifecycle management consulting & services company – providing strategy & mandate setup through to
establishment, enablement, realignment, transformation, and governing your services and sourcing strategy within a stable
support and risk mitigated framework.
COVIAM – Value Based Best of Breed Services
WHAT WE DO?

HOW WE WORK?
• Global track record
• Experience setting multiple centers & engagements
• Strategic and execution focus
• Pool of dedicated available talent

Why Us?
Inspired by our diverse leadership backgrounds we use the power of skills, data and innovative thinking to drive results.
We are your trusted partners to solve business problems, focused on value optimization by using a multidimensional
innovation framework enhanced by our skills and continuous experimentation approach.
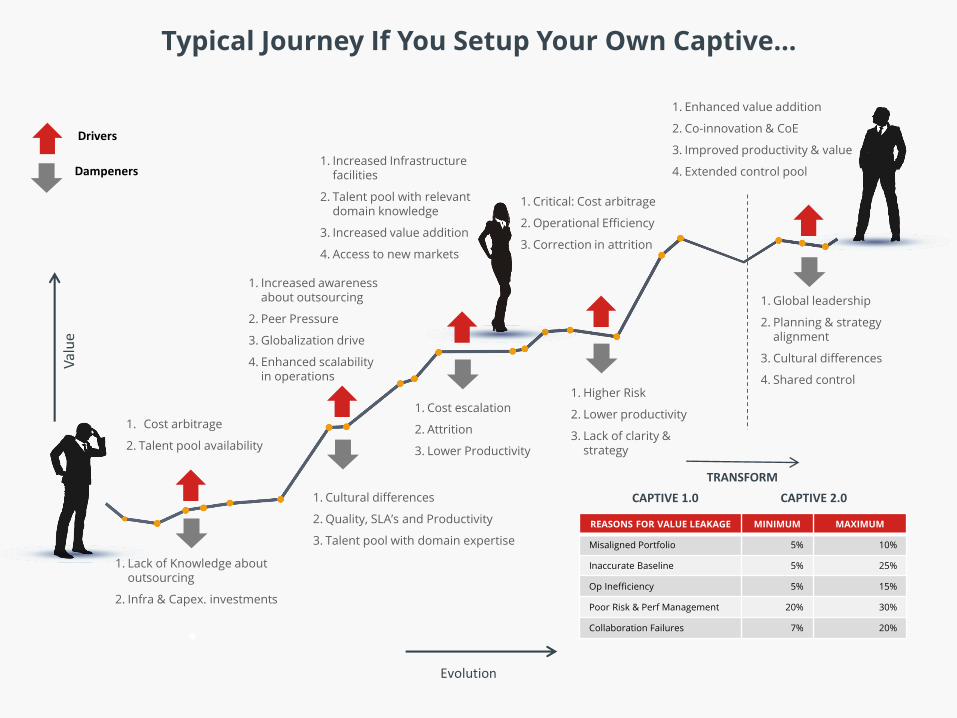
Drivers
Dampeners
Evolution
1. Cost arbitrage
2. Talent pool availability
1. Lack of Knowledge about outsourcing
2. Infra & Capex. investments
1. Increased Infrastructure facilities
2. Talent pool with relevant domain knowledge
3. Increased value addition
4. Access to new markets
1. Cost escalation
2. Attrition
3. Lower Productivity
1. Critical: Cost arbitrage
2. Operational Efficiency
3. Correction in attrition
1. Higher Risk
2. Lower productivity
3. Lack of clarity & strategy
1. Enhanced value addition
2. Co-innovation & CoE
3. Improved productivity & value
4. Extended control pool
1. Global leadership
2. Planning & strategy alignment
3. Cultural differences
4. Shared control
Val
ue
1. Cultural differences
2. Quality, SLA’s and Productivity
3. Talent pool with domain expertise
1. Increased awareness about outsourcing
2. Peer Pressure
3. Globalization drive
4. Enhanced scalability in operations
Typical Journey If You Setup Your Own Captive…
CAPTIVE 1.0 CAPTIVE 2.0
TRANSFORM
REASONS FOR VALUE LEAKAGE MINIMUM MAXIMUM
Misaligned Portfolio 5% 10%
Inaccurate Baseline 5% 25%
Op Inefficiency 5% 15%
Poor Risk & Perf Management 20% 30%
Collaboration Failures 7% 20%

Evolution
Val
ue
Strategy & Vision formulation
Location strategy
Soft landing strategy
Talent source mapping
Facilities search & setup
Legal & compliance
Corporate registration
Risk assessment
F & A services setup
HR model & practices
Organizational model
Governance framework
Risk & control
Taxation & SEZ leverage
Leadership hiring
IT setup
Change management
M & A advisory
Strategic realignment
services
Operational realignment
services
Talent assessment
Operational assessment
CoE setup
Benchmarking
Future state roadmap
Value assessment
ROI model creation
Monetization
Mandate reassessment
Communication plan
Roles, resp. authority levels
Compensation & Benefits practices
Operating Models & Metrics
Frameworks
COVIAM Journey…

* Estimated
Comparison With Other Models – Costs / Control / Effort / Taxes
ITO/BPO/Specialist firm PBOT Own captive
CONS
- Resource quality suspect
- Lack of resource control
- Attrition issues
- Vendor has 45% + op. margins
- Build and enhance relationships
with vendor top management
who are not interested in small
accounts
- Not building talent for the future
- Uses expensive onshore
resources
- IP and competitor risk
PROS
- Standard delivery model (GDM)
- Breadth of resources available for
expedited needs (scale)
- Min. hiring time (pool available)
CONS
- Deal through an affiliate
- Services margin
- Hiring period longer than ITO
- Success fee
PROS
- Cost effective
- Control over resources
- Transparent model
- Tax efficient
- Stock options incentive / dilution
not needed upfront
- Backend setup and running by
affiliate
- Ownership option (T of PBOT)
- You have a trusted partner with
demonstrated captive setup
capability
- Hiring / Firing decisions
CONS
- Not cost effective
- Exposure to Indian tax laws and
rules
- General management and other
talent to be hired additional
- Stock options incentives are
needed (dilution)
- Parent Co. management involved
in day to day decisions of
running operations than growing
business
- Hiring period longer than ITO
- Additional transfer pricing taxes
need to be paid (6% of run rate)
PROS
- Complete ownership of ops
- Control over resources
- Hiring / Firing control

3/16/2016 Company Confidential 20
SERVICES MATURITY& INDIA ETAIL
JOURNEY

GICs – Services Maturity And Retail / e-Commerce Presence
Evolution


140 M
213 M
400 M
CY2012 CY2013 CY2016P
3.00%
2.70%
2.90%
CY2012 CY2013 CY2016P
1.50
1.55
1.70
CY2012 CY2013 CY2016P
Internet Users in India
X
Conversion from Visitors to Buyers
X
Orders per Buyer per Month
% of Internet Users Who Visit
e-commerce Sites = 60%
4 M
5 M
1.2 M
CY2012 CY2013 CY2016P
1.50
1.55
1.70
CY2012 CY2013 CY2016P
=
# of Orders per Month
X
Average Order Value$816 M
$1,983 M
$8,519 M
CY2012 CY2013 CY2016P
=
Annualized Online Shopping GMV
MARKET SIZE AND GROWTH
• 301M users online
• $6B – 2015 (70% growth over 2014)
• < 1% of total retail opportunity
• Mobile eCommerce – 30% of total
traffic
KEY PRIORITIES
• Mobile and commerce platforms
• Search
• Order management
• Marketing
EXPANSION IN
• Mobile channel development
• Digital marketing, customer
experience
• Web analytics, optimizing supply
chain
• Big data
CHALLENGES
• Low volume & ticket per customer
• Multiple payment modes (CoD, debit,
CC)
• Logistics & fulfillment
• Customer retention
India e-Tailing Industry Snapshot
X

Mobile, Tablets
& Accrssories,
35%
Computers,
Cameras,
Electronics &
appliances, 18%
Health &
Personal Care,
2%
Babycare, 3%
Fashion,
Footwear &
Accessories,
28%
Jewellery, 2%
Home decore,
3%
Others, 2%
BooksBooks,
7%
Categories by GMV (%)
Mobile, Tablets
& Accrssories,
9% Computers,
Cameras,
Electronics &
appliances, 10%
Health &
Personal
Care, 4%
Babycare, 8%
Fashion,
Footwear &
Accessories,
35%
Jewellery, 1%
Home decore,
8%
Others, 4%
BooksBooks,
21%
Categories by # of Transactions (%)

$5B $30M $65M
CMV 2015 P 2014 Revenue 2014 Loss
Flipkart
$3B $28M $53M
CMV 2015 P 2014 Revenue 2014 Loss
Amazon
$3B $26M $46M
CMV 2015 P 2014 Revenue 2014 Loss
Snapdeal
CoD Credit Card Debit Card Net Banking EMI Digital Wallets
60%
16%
11%
12%1%
-
30%
12%
15%
11%
5%
7%
2013 2016 P

7%
6%-14%
4%-10%
8%-10%
5%-8%
5%-16%0
IT (Maintain)
IT (R&D)
Marketing & Sales
Supplychain & Logistics
Fulfillment
General & Admin
Programming
Facilities
Software Telecom
OtherTraining
Hardware Services
Supplies OtherCosts
Ops/Tech support
29%
Labor (Includes Benefits)
51%
17% 5% 13% 10%5% 4% 3% 3%10% 1%
IT Cost Breakdown by Category
(% to Total IT Costs- Weighted Average)
A typical eCommerce retail spend cycle
SPEND AND GROWTH
• Approx. on average eCommerce companies spend 20% of revenues on IT
• Growth and scale drives higher spend
• Mature eTailing business spend more R&D on
• Mobile eCommerce
• Logistics . fulfillment & supply chain tuning
• New channels & customer acquisition
• Data analytics & mining
• Risk, fraud and security
• A $100M company would expect to spend $20M post establishment of
marketplace and payments platform
• 8-10% of total staff (employee + vendors) of IT engineers
3/16/2016 Company Confidential 28
Feel free to say hi!We are friendly and social
company/coviam @COVIAMTech COVIAMTech [email protected]
THANK YOU
#1076, 24th main, 11th cross,HSR Layout, Bangalore,
Karnataka 560-102 INDIA