WHY IKE A CATEGORY 2 HURRICANE WAS SO DEVASTATING THE FREEMAN HURRICANE DAMAGE POTENTIAL SCALE 2011...
47
WHY IKE A CATEGORY 2 HURRICANE WHY IKE A CATEGORY 2 HURRICANE WAS SO DEVASTATING WAS SO DEVASTATING THE FREEMAN HURRICANE DAMAGE THE FREEMAN HURRICANE DAMAGE POTENTIAL SCALE POTENTIAL SCALE 2011 Hurricane Outlook 2011 Hurricane Outlook Jill F. Hasling, President Jill F. Hasling, President Certified Consulting Meteorologist Certified Consulting Meteorologist Weather Research Center Weather Research Center 5104 Caroline St. Houston, Texas 77004 5104 Caroline St. Houston, Texas 77004 www.wxresearch.com www.wxresearch.com
-
date post
21-Dec-2015 -
Category
Documents
-
view
219 -
download
2
Transcript of WHY IKE A CATEGORY 2 HURRICANE WAS SO DEVASTATING THE FREEMAN HURRICANE DAMAGE POTENTIAL SCALE 2011...

WHY IKE A CATEGORY 2 HURRICANE WHY IKE A CATEGORY 2 HURRICANE WAS SO DEVASTATING WAS SO DEVASTATING
THE FREEMAN HURRICANE DAMAGE THE FREEMAN HURRICANE DAMAGE POTENTIAL SCALE POTENTIAL SCALE 2011 Hurricane Outlook2011 Hurricane Outlook
Jill F. Hasling, PresidentJill F. Hasling, President
Certified Consulting MeteorologistCertified Consulting Meteorologist
Weather Research CenterWeather Research Center
5104 Caroline St. Houston, Texas 77004 5104 Caroline St. Houston, Texas 77004
www.wxresearch.comwww.wxresearch.com

Home of the Nation’s First Weather Museum
Weather Research Center


WRC inspires students through science experiments and presentations that cover a wide variety of meteorological and climatology topics.
Programs which emphasize science and mathematics are available at both the museum and through our websites. These programs include Weather Camp, Weather Labs, Teacher Weather Workshops and Student Summer Internships.
Who We Are

The John C. Freeman Weather Forecast Training and Operations Center
WRC Meteorologists

The John C. Freeman Weather Forecast Training and Operations Center
• World Wide Marine Weather Forecasts
• Hurricane/Tropical Cyclone Predictions
• Environmental Studies• Weather Forensics• Long Range Weather
Forecasts• Development of Forecast
Models

Significant Projects:• Established the Nation’s First Weather Museum• Texas First Tornado Warning Network• 1st Storm Tide Prediction System (Bathystrophic Storm Tide)

Hurricane Ivan – 2004 Hurricanes Katrina and Rita – 2005 and Hurricane Ike 2008 would make one believe that hurricanes are getting larger and stronger.

Hurricane Ivan – 2004 Hurricanes Katrina and Rita – 2005 and Hurricane Ike 2008 would make one believe that hurricanes are getting larger and stronger.
Is this due to climate change or is human’s understanding of hurricanes changing?


Atlantic Basin Category 5 Hurricanes32 Category 5 Hurricanes have occurred since 1900
Lowest Pressure –
Hurricane Wilma 2005 - 882 mbs
Highest maximum sustained winds –
Hurricane Allen 1980 - 165 Knots
Most Category 5 Hurricanes per season
2005 – (Four) – Emily, Katrina, Rita and Wilma
2007 – (Two) – Dean and Felix
1961 – (Two) – Carla and Hattie
1960 – (Two) – Donna and Ethel


NOTABLE CATEGORY 5 GOM LEASE HURRICANESNOTABLE CATEGORY 5 GOM LEASE HURRICANES
165 kts 165 kts Hurricane Camille Hurricane Camille 1969 1969
155 kts155 kts Hurricane Allen Hurricane Allen 19801980
155 kts155 kts Hurricane RitaHurricane Rita 20052005
150 kts150 kts Hurricane Carla Hurricane Carla 19611961
150 kts150 kts Hurricane KatrinaHurricane Katrina 20052005
140 kts140 kts Hurricane BeulahHurricane Beulah 19671967
140 kts140 kts Hurricane EthelHurricane Ethel 19601960
135 kts135 kts Hurricane BetsyHurricane Betsy 19651965

Atlantic Ocean 1900-2008
0
5
10
15
20
25
30
1900 1920 1940 1960 1980 2000
Year
Nu
mb
er
of
Sto
rms
PLOT OF THE NUMBER OF KNOWN TROPICAL CYCLONES 1900-2008
Seems to indicate that the number of cyclones is increasing?

Problems with Using Historical Tropical Cyclone Data
• 1851-1914 – Landfall observations and Ship
Reports • 1915-1945 – Density of Ship Reports
expanded after the Panama Canal opened
• 1946-1965 – Ship traffic expands after WWII
• 1966 – Continuous monitoring by satellite begins• 2002 – QuikScat wind vectors – Improved
satellite observations

Atlantic ship traffic changes
Vecchi and Knutson (2008)
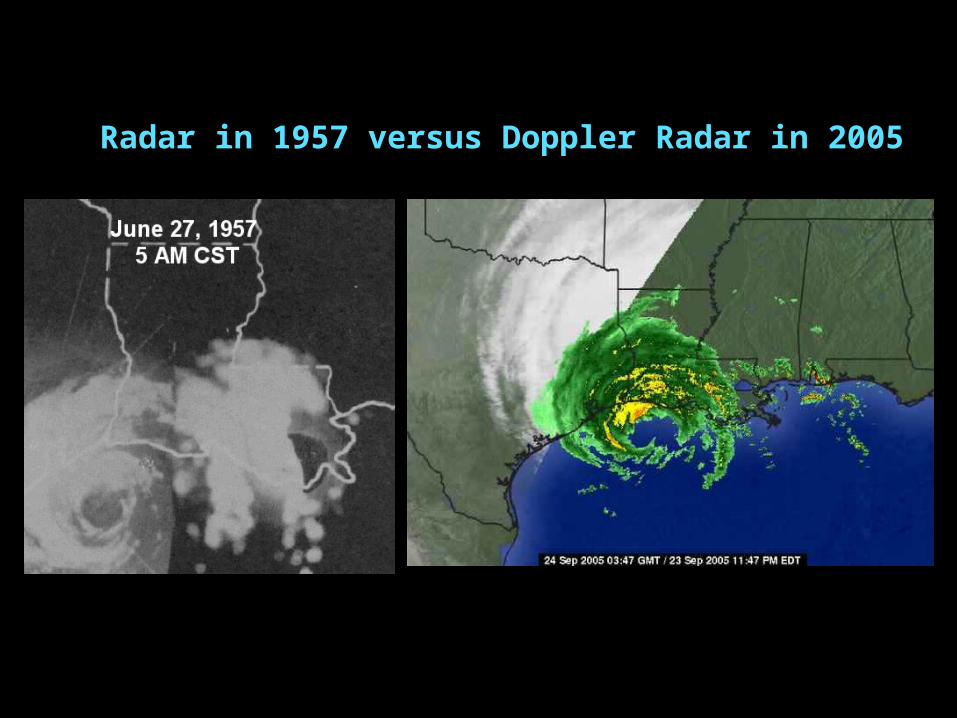
Radar in 1957 versus Doppler Radar in 2005

Open AtlanticOcean Differences
1933 Hurricane Season
2005 Hurricane Season
Data problem: Hurricanes were hardly detected over open ocean before the era of aircraft reconnaissance (mid-1940s) and satellite
technology (mid-1960s).
Landsea (2007, Eos)

Estimated Number of “Missed” Tropical Storms and Hurricanes of Medium to Long Duration
3 per year in 1880s
2 per year in 1900s
<1 per year in 1950s

Tropical Storm and Hurricane Numbers –Upward Trend Gone After Adding in “Missed”
and Removing Very Short-Lived Cyclones
98

Size Matters!

Hurricane Wind Fields for Past GOM Hurricanes

Radius of Hurricane Force Winds
70
50
60
100
60
50 50
8075
70
60 60
50 50 50
60 60
25
70
5045
60
50
40
109
50
60
100
40
30
50
75
40
50
60
50
75 75
100
40
125
60
35
45
90 90
75
20
60
110
0
20
40
60
80
100
120
140
1886
1886
1900
1906
1909
1909
1910
1915
1915
1916
1916
1916
1919
1926
1932
1933
1942
1943
1945
1947
1949
1953
1957
1960
1961
1964
1965
1967
1969
1970
1974
1975
1977
1979
1980
1983
1985
1985
1988
1992
1995
1998
1999
2002
2004
2005
2005
2008
2008
2008
Radius of Hurricane Force Winds

There were 50 Gulf of Mexico Oil Lease Hurricanes where the size of the hurricane wind field could be estimated.
10 of these hurricanes had a radius of maximum sustained winds of 50 nautical miles or less.
23 of the hurricanes had a radius greater than 50 nautical miles but less than 61 nautical miles.
17 of the hurricanes had a radius of hurricane force winds greater than 69 nautical miles.

WHY SIZE MATTERS!
The distance the wind blows over a body of water [fetch] and the duration of the high winds, the higher the waves can become.
Sig Wave by Fetch for maximum sustained winds of 34, 50, 64 and 95 kt
0
20
40
60
80
100
120
140
0 50 100 150 200 250 300 350 400 450 500 550 600
Fetch n. mi
Sig
Wav
e F
eet

Gulf of Mexico Category 3, 4 & 5
Hurricanes


The result of this research is the development of
The Freeman/Hasling Hurricane Damage Potential Scale
[Freeman/Hasling - HDP Scale]

The Freeman/Hasling Hurricane Damage Potential Scale is based on:
• Maximum Sustained Wind• Radius of Hurricane Force Winds• Central Pressure• Area of Significant Wave > 34 Feet• Hurricane Track• Hurricane Speed• Duration of Hurricane Force Winds• Exposed Offshore Properties

Freeman/Hasling Hurricane Damage Potential Scale
R64 <=30 >30 >=45 >=60 >=80
Saffir/Simpson
1 1 1 1 4 5
2 1 1 1 5 5
3 1 1 1 5 5
4 1 1 2 5 5
5 1 2 3 5 5Freeman/Hasling HDP Scale
1 2 3 4 5
HDP Percent 2% 4% 6% 8% 10%

Are Humans at Fault for More and Stronger Offshore Hurricanes?
Yes
In Summary, to answer the questions:

Have there been similar Gulf of Mexico hurricanes to Ivan 2004, Katrina 2005, Rita 2005 and Ike
2008?
Yes the hurricanes in the 1960s, 1910s, and 1880s. In the 1960s,
there were four Category 5 hurricanes over the Gulf leases.

If the Gulf of Mexico hurricanes are sorted by decades, are there differences in the number and
strength of hurricanes by decade?
Yes, for two decades you will have an active period of major
hurricanes followed by a decade of very few major hurricanes over the
Gulf leases.

How would the early Gulf of Mexico hurricanes impact the Gulf oil leases
today?
The 1910s would have been very devastating to the properties in the Gulf
of Mexico with five Category 5 hurricanes. There were two Category 4 hurricanes in 1915, one that went over
the eastern oil leases and one that went through the western oil leases.

Were the hurricanes of the 1960s smaller and weaker or was the
exposure offshore less dense?
The exposure of the properties to the hurricanes of the 1960s was less dense. Hurricane Carla in 1961 was
a Category 5 hurricane offshore with a very large wind field. At the time,
there were only 517 offshore properties.

How have humans observed hurricanes throughout history?
How humans have observed hurricanes has changed through
the years as technology improves. This has impacted the number of
observed hurricanes and the hurricane climatology.

What part do improved observations play in the size and strength of
hurricanes?
Humans are responsible for the implied increase in hurricane frequency and strengths by
developing the improved observing tools.