Why Have Corporate Tax Revenues Declined? Another Lookauerbach/AJA_CESifo_revised.pdf · national...
23
Why Have Corporate Tax Revenues Declined? Another Look Abstract The relative constancy of nonfinancial corporate tax revenues as a share of U.S. GDP masks offsetting trends in the ratio of corporate profits to GDP (declining) and the average tax rate (increasing). The average tax rate rose steadily between 1996 and 2003, an increase largely attributable to the importance of tax losses. This rise casts some doubt on the role of tax planning activities in reducing corporate taxes. So, too, does the relative stability of the rate of profit (relative to net assets), which might be expected to have declined had the understatement of profits for tax purposes been increasing. JEL Code: H25, G32 Keywords: corporate profits, tax shelters, tax losses Alan J. Auerbach Department of Economics University of California 549 Evans Hall Berkeley, CA 94720-3880 USA [email protected] December 2006 This paper was presented at the CESifo workshop, The Future of Capital Income Taxation, Venice, July 17-18, 2006. I am grateful to Anne Moore for excellent and timely research assistance and to Dhammika Dharmapala, Mihir Desai, conference participants, and an anonymous referee for comments on earlier drafts.
Transcript of Why Have Corporate Tax Revenues Declined? Another Lookauerbach/AJA_CESifo_revised.pdf · national...
Why Have Corporate Tax Revenues Declined? Another Look
Abstract The relative constancy of nonfinancial corporate tax revenues as a share of U.S. GDP masks offsetting trends in the ratio of corporate profits to GDP (declining) and the average tax rate (increasing). The average tax rate rose steadily between 1996 and 2003, an increase largely attributable to the importance of tax losses. This rise casts some doubt on the role of tax planning activities in reducing corporate taxes. So, too, does the relative stability of the rate of profit (relative to net assets), which might be expected to have declined had the understatement of profits for tax purposes been increasing. JEL Code: H25, G32 Keywords: corporate profits, tax shelters, tax losses
Alan J. Auerbach Department of Economics University of California
549 Evans Hall Berkeley, CA 94720-3880
December 2006
This paper was presented at the CESifo workshop, �The Future of Capital Income Taxation,� Venice, July 17-18, 2006. I am grateful to Anne Moore for excellent and timely research assistance and to Dhammika Dharmapala, Mihir Desai, conference participants, and an anonymous referee for comments on earlier drafts.

1
I. Introduction
Corporate income taxes present a challenge for economists. Their incidence has
seemed particularly difficult to assign1 and there have been persistent questions about the
logic of a separate tax on corporations (e.g., McLure 1979). In recent years, the pressures of
financial innovation and international tax competition have presented new challenges to
countries seeking to maintain a corporate tax, leading to further questions about the role of
this tax as a component of tax structure. Yet corporate taxes remain an integral component of
national tax systems. In this paper, I review the recent evolution of U.S. corporate tax
collections, considering the factors that have contributed to the relatively small share of
federal tax revenues for which they account in order to gain insight into the future of the U.S.
corporate income tax.
Figure 1 shows U.S. corporate income taxes as a share of GDP and of federal
revenues for fiscal years 1962-2006. The two series track each other closely because overall
revenues as a share of GDP have remained rather stable during the period, with an average
just below 20 percent. During most of the 1960s, corporate taxes accounted for more than
one fifth of revenues and nearly 4 percent of GDP. But these figures fell steadily during the
1970s and early 1980s so that, by 1983, corporate taxes accounted for just 1 percent of GDP
and 6 percent of federal revenues. This decline prompted an examination by Auerbach and
Poterba (1987), who developed a methodology for attributing changes in corporate tax
revenues to different sources. Their decomposition assigned some of the decline in the
importance of the corporate tax to a fall in corporate profitability and some to a fall in the
corporate average tax rate, the latter to a considerable extent attributable to changes in capital
recovery provisions. Subsequent analyses using the Auerbach-Poterba methodology
considered why corporate revenues did not increase by as much as predicted after the Tax 1 For a recent survey of the literature, see Auerbach (2006)

2
Reform Act of 1986 (Poterba 1992) and why corporate taxes collections rebounded during
the 1990s, even as the demise of the corporate tax was being predicted (Mackie 1999).
Figure 1. Trends in U.S. Federal Corporate Income Tax Revenue
0
1
2
3
4
5
1962 1966 1970 1974 1978 1982 1986 1990 1994 1998 2002 2006
Fiscal Year
Perc
ent o
f GD
P (s
olid
)
0
5
10
15
20
25
Perc
ent o
f Rev
enue
(das
hed)
Corporate taxes fell in nominal terms between 1998 and 1999 as the economy grew
strongly and fell sharply again as a share of GDP and of revenues in 2001. These
developments helped prompt examinations of the potential role of corporate tax shelters in
eroding the corporate tax base (e.g., Desai 2003). But, since a local trough in 2003, corporate
tax collections have rebounded so strongly that they accounted for a higher share of revenues
and GDP in 2006 than in any fiscal year since the 1970s.
To help understand these recent developments and get a sense of the role that different
factors will play in the future, I apply and extend the Auerbach-Poterba methodology to
examine the trends in taxes paid by nonfinancial corporations from 1983 through 2003 (the
last year for which the required data are currently available), starting in 1983 to provide a few
years� overlap with the original Auerbach-Poterba analysis, which ended its sample in 1985.
The Appendix describes the methodology and data sources.

3
II. Corporate Taxes, Assets and Profitability
The first column of Table 1 shows the taxes paid by all corporations during the period
1983-2003, scaled by GDP, tracking the corresponding series in Figure 1 except that (1) tax
years are used, and (2) some adjustments to the measure of taxes are made, as outlined in the
Appendix, to reflect the timing distinction between tax payments and the accrual of tax
liability. The next column of the table excludes the taxes paid by financial corporations.
Because a significant share of the financial corporate sector (such as insurance companies
and mutual funds) is subject to a variety of special tax regimes, it is useful to exclude
financial corporations when considering the importance of broad tax provisions; following
Auerbach and Poterba, I do so and consider only nonfinancial corporations (NFCs) for the
remainder of the paper.
Before moving on, however, it is worth noting a couple of points about financial
corporations revealed by a comparison of the first two columns of the table. First, this
comparison shows an increase over time in the importance of financial corporations among
corporate taxpayers. In 1983, financial corporations accounted for just over 5 percent of all
corporate revenues, but this share rose fairly steadily until, over the period 1991-2003,
financial corporations accounted for roughly one quarter of all corporate tax revenues.
Without further analysis, it is not possible to exclude changes in tax rules as a contributing
factor, but the growing importance of the financial sector seems an obvious primary
explanation for the observed trend. Second, the strong cyclical behavior of corporate profits
in recent years is traceable primarily to nonfinancial corporations. While NFC taxes fell as a
share of GDP by over 40 percent (from 2.02 percent of GDP to 1.20 percent of GDP)
between 1999 and 2002, the balance of corporate taxes, paid by financial companies, fell by
less than 15 percent (from 0.36 percent of GDP to 0.31 percent). To a considerable extent,
this stronger volatility in taxes among nonfinancial corporations reflects a stronger volatility

4
in profits2. As discussed below, however, the volatility of nonfinancial corporate taxes would
have been even greater had average tax rates remained constant as profits fell.
Table 1. Federal Corporate Revenues, 1983-2003
NFC Taxes as a Percent of: Year
Corporate Taxes as a
Percent of GDP GDP CNFC Assets
1983 1.33 1.26 1.36
1984 1.50 1.41 1.70
1985 1.38 1.20 1.57
1986 1.48 1.22 1.81
1987 1.80 1.51 2.42
1988 1.83 1.53 2.57
1989 1.74 1.40 2.49
1990 1.63 1.32 2.42
1991 1.48 1.10 2.12
1992 1.68 1.19 2.69
1993 1.84 1.26 3.27
1994 1.93 1.47 3.77
1995 2.11 1.50 3.96
1996 2.18 1.55 4.15
1997 2.20 1.58 4.31
1998 2.03 1.63 4.47
1999 2.02 1.66 4.43
2000 1.98 1.62 4.08
2001 1.36 1.06 2.73
2002 1.20 0.89 2.34
2003 1.57 1.16 3.29
2 According to the National Income and Product Accounts, NFC before-tax profits (with inventory valuation adjustment) fell in nominal terms between 1999 and 2000 and again between 2000 and 2001, while the comparable measure for financial corporations (excluding the Federal Reserve System, which is classified in the accounts as part of the financial corporate sector) rose in both years.
5
The third column of Table 1 divides the taxes of NFCs by the estimated replacement
cost of net assets (assets net of credit market debt) held by nonfinancial C corporations, or
CNFCs. A growing share of corporate assets is held by S corporations, which legally are
corporations but are not liable for corporate income taxes, their earnings being passed directly
to shareholders prior to taxation. As corporate taxes are paid only by C corporations,
therefore, it is useful to use C corporation assets in forming a tax-assets ratio.3
While NFC revenues as a share of GDP fluctuated with the business cycle but without
any obvious trend between 1983 and 2003, these revenues as a share of CNFC assets have
increased over the same period. The difference in trends between columns 2 and 3 reflects
the fact that the size of the nonfinancial C corporation sector, as measured by assets, has been
falling relative to GDP and other aggregate measures of activity. Indeed, GDP grew over 2.6
times more rapidly over the two decades between 1983 and 2003. Part of this decline in the
importance of CNFC assets comes from the increase in the share of corporate assets held by S
corporations. But, in terms of pure accounting, the slow growth in NFC assets as a whole and
the increasing debt-assets ratio are much more important.4 I consider this decline in NFC
assets further below.
The last column of Table 1 leaves us with a new question: why have corporate tax
revenues increased, relative to their related asset base? To explore this question, Table 2
breaks down the ratio of taxes to assets into the product of two components, the ratio of taxes 3 NFC net corporate assets at replacement cost are calculated using data from the Federal Reserve Flow of Funds accounts. They equal assets at replacement cost, as provided by the accounts, minus credit market debt adjusted to market values from the book values provided by the accounts using a perpetual inventory method described in the Appendix. Because we do not have a breakdown of NFC assets into those of C and S corporations, we assume that the share of net NFC assets accounted for by C corporations is the same as the C corporation share of gross assets, at book value, based on annual assets of active corporations (excluding those in Finance, Insurance and Real Estate) as reported by the IRS. 4 Our method of calculating net CNFC assets is to subtract NFC credit market debt from NFC assets and then multiply the resulting amount by the share of CNFC assets of all (C and S) NFC assets. Thus, the ratio of net CNFC assets to GDP is r = f*a*(1-d), where f is the ratio of C assets to C + S assets, a is the ratio of total NFC assets to GDP, and d is the debt-assets ratio for the NFC sector. Decomposing the changes in r between 1983 and 2003 (in the order in which the terms appear in the expression for r), the rise in S corporations accounts for 9 percent of the decline in r, the decline in NFC assets relative to GDP accounts for 43 percent of the decline in r, and the increase in the NFC debt-assets ratio accounts for 47 percent of the decline in r.
6
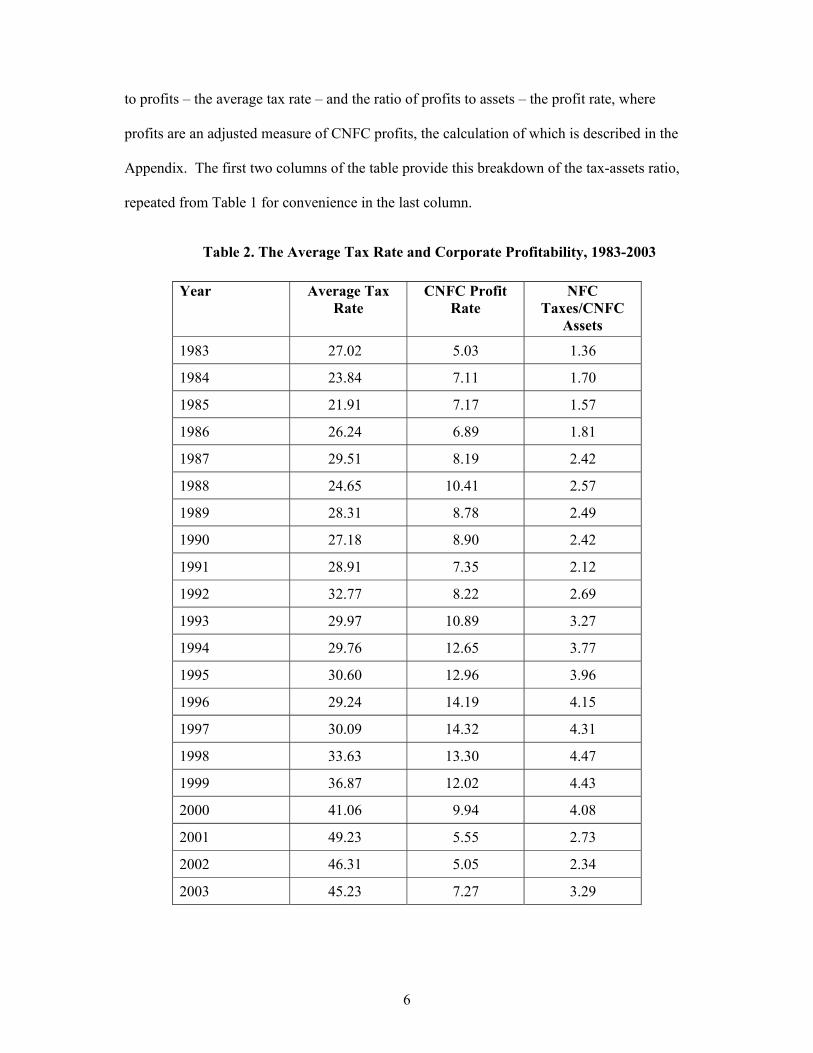
to profits � the average tax rate � and the ratio of profits to assets � the profit rate, where
profits are an adjusted measure of CNFC profits, the calculation of which is described in the
Appendix. The first two columns of the table provide this breakdown of the tax-assets ratio,
repeated from Table 1 for convenience in the last column.
Table 2. The Average Tax Rate and Corporate Profitability, 1983-2003
Year Average Tax Rate
CNFC Profit Rate
NFC Taxes/CNFC
Assets
1983 27.02 5.03 1.36
1984 23.84 7.11 1.70
1985 21.91 7.17 1.57
1986 26.24 6.89 1.81
1987 29.51 8.19 2.42
1988 24.65 10.41 2.57
1989 28.31 8.78 2.49
1990 27.18 8.90 2.42
1991 28.91 7.35 2.12
1992 32.77 8.22 2.69
1993 29.97 10.89 3.27
1994 29.76 12.65 3.77
1995 30.60 12.96 3.96
1996 29.24 14.19 4.15
1997 30.09 14.32 4.31
1998 33.63 13.30 4.47
1999 36.87 12.02 4.43
2000 41.06 9.94 4.08
2001 49.23 5.55 2.73
2002 46.31 5.05 2.34
2003 45.23 7.27 3.29

7
The profit rate, shown in Table 2�s second column, has been strongly procyclical,
rising with the expansion of the 1980s, falling slightly during the mild recession of 1990-91,
rising very sharply during the extended boom later in the 1990s, falling once again with the
recession of 2001 and beginning to recover again in 2003. Profit rates were especially high
during the period 1993-99, during which federal revenues, including not only corporate taxes
but also individual income taxes, surged. But there is no obvious or significant trend in the
rate of profit, which in recent years has fallen in the same range as at the beginning of the
sample period.
The average tax rate, on the other hand, does show evidence of a trend, averaging
below 25 percent during the first few years of the sample5 and exceeding 40 percent in every
year since 2000. Although year to year fluctuations make higher frequency trends more
difficult to discern, the average tax rate appears to have increased in the late �80s and once
again in the late �90s, with the period in between, from around 1987-1997, characterized by a
tax rate relatively stable around 30 percent. The first of these increases is consistent with
what one might have expected, as it coincides with the passage of the Tax Reform Act of
1986, which sought to increase the share of federal revenues coming from the corporate
income tax. But the much larger increase in recent years has no obvious legislative
explanation, and the concern about corporate tax shelters and heightened corporate tax
avoidance already discussed would seem to have predicted a movement in the other direction.
III. A Decomposition of Changes in the Average Tax Rate
Table 3 sheds light on these movements in the average tax rate, breaking them down
into six mutually exclusive components, the construction of which is described in the
Appendix. The first column of the table shows the statutory corporate tax rate for the
5 The profit rates are somewhat higher and the average tax rates correspondingly lower for the period 1983-85 than those reported in the comparable table in Auerbach and Poterba (1987), the changes due primarily to revisions in the national income account components of the profit measure.

8
corresponding year, while the last column shows the average tax rate, repeated from Table 2.
The columns in between show the contributions of different factors to the gap between the
statutory and average tax rates, with positive components increasing the average tax rate and
negative components decreasing them.
Table 3. Causes of Changing Average Tax Rates, 1983-2003
Year Statutory Rate
Capital Recovery
Other Inflation
Tax Losses
Foreign Tax
Effects
Progres-sivity
Other Factors
Average Tax Rate
1983 46.0 -22.9 -5.9 10.6 1.7 -3.6 1.0 27.0 1984 46.0 -19.8 -6.3 7.8 1.1 -3.8 -1.2 23.8 1985 46.0 -21.7 -6.4 9.6 0.0 -3.9 -1.7 21.9 1986 46.0 -15.9 -8.0 10.4 1.7 -4.9 -3.0 26.2 1987 40.0 -9.7 -5.8 6.1 3.2 -2.0 -2.2 29.5 1988 34.0 -7.0 -5.6 3.4 1.1 0.1 -1.4 24.7 1989 34.0 -7.0 -7.5 6.6 2.6 0.3 -0.5 28.3 1990 34.0 -5.9 -10.4 6.2 2.5 1.4 -0.6 27.2 1991 34.0 -4.6 -12.1 10.0 1.6 0.8 -0.8 28.9 1992 34.0 -4.7 -7.5 9.4 2.2 1.0 -1.6 32.8 1993 35.0 -4.7 -7.1 6.3 2.0 0.2 -1.7 30.0 1994 35.0 -4.8 -4.8 3.6 1.8 0.2 -1.2 29.8 1995 35.0 -5.1 -3.6 3.4 2.3 0.1 -1.5 30.6 1996 35.0 -5.4 -4.9 4.3 1.9 -0.1 -1.5 29.2 1997 35.0 -5.9 -4.9 4.9 2.1 0.3 -1.4 30.1 1998 35.0 -6.2 -4.9 8.8 2.4 -0.2 -1.3 33.6 1999 35.0 -6.8 -5.3 11.6 3.6 -0.2 -1.0 36.9 2000 35.0 -6.8 -7.7 18.3 3.9 -0.1 -1.7 41.1 2001 35.0 -8.1 -19.6 38.3 5.5 -0.4 -1.6 49.2 2002 35.0 -17.1 -13.4 35.9 6.1 -0.2 0.1 46.3 2003 35.0 -11.5 -10.2 30.1 2.8 -0.4 -0.5 45.2
The second column of Table 3 is labeled �capital recovery� and (when negative)
accounts for reductions in the average tax rate attributable to investment-related tax benefits
greater than what would be provided by economic depreciation deductions. This component
also accounts for the use of historic cost in measuring depreciation allowances, a factor that
by itself would increase the average tax rate, but on balance capital recovery provisions have

9
contributed to a reduction in the average tax rate. This was especially true until 1986, when
the investment tax credit was repealed. In the years since, capital recovery provisions led to a
relatively stable reduction in the average tax rate until 2002. The explanation for this recent
rise is the fall in the rate of profit already discussed. Because capital recovery provisions are
based on assets, rather than profits, a decline in the rate of profit will increase the ratio of
capital recovery provisions to profits. That is, a tax benefit of a given absolute magnitude
reduces the average tax rate more when profits and hence the taxes on those profits fall.
The next column of Table 3, �other inflation,� accounts for two offsetting effects of
inflation, the general overtaxation of profits due to inventory accounting (the understatement
of the cost of goods sold) and the undertaxation of the economic gains on nominal liabilities.
Once again, the net impact could go either way but throughout the period has on balance
reduced average tax rates. As with capital recovery provisions, this component�s impact on
the average tax rate has tended to be larger in low-profit years, ceteris paribus, because it is
based on assets rather than on profits.
The factors considered thus far only deepen the puzzle of why average tax rates have
risen in recent years. The next component, though, points strongly in the other direction.
The column labeled �Tax Losses� takes account of changes in the average tax rate due to the
asymmetric treatment of gains and losses under the corporate income tax. There are two
pieces included in this component. First, firms with negative taxable income can deduct
losses only to the extent that these losses can be carried back and offset against the profits of
earlier years. Thus, the lack of a tax refund on losses not carried back increases the average
tax rate. On the other hand, taxable firms may deduct losses carried forward from earlier
years, thereby shielding current profits from taxation and lowering the average tax rate.
Whether the net effect is to decrease or increase the average tax rate in a given year depends
on whether deductions for previous net operating losses exceed current losses not carried
10
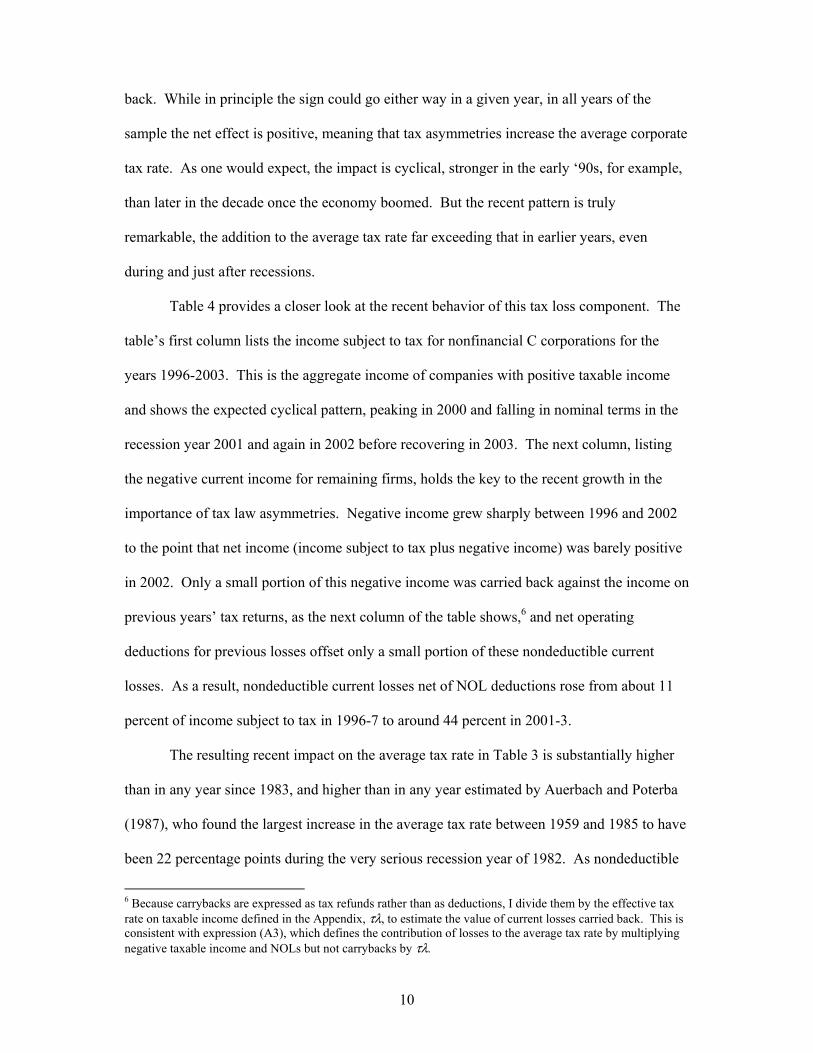
back. While in principle the sign could go either way in a given year, in all years of the
sample the net effect is positive, meaning that tax asymmetries increase the average corporate
tax rate. As one would expect, the impact is cyclical, stronger in the early �90s, for example,
than later in the decade once the economy boomed. But the recent pattern is truly
remarkable, the addition to the average tax rate far exceeding that in earlier years, even
during and just after recessions.
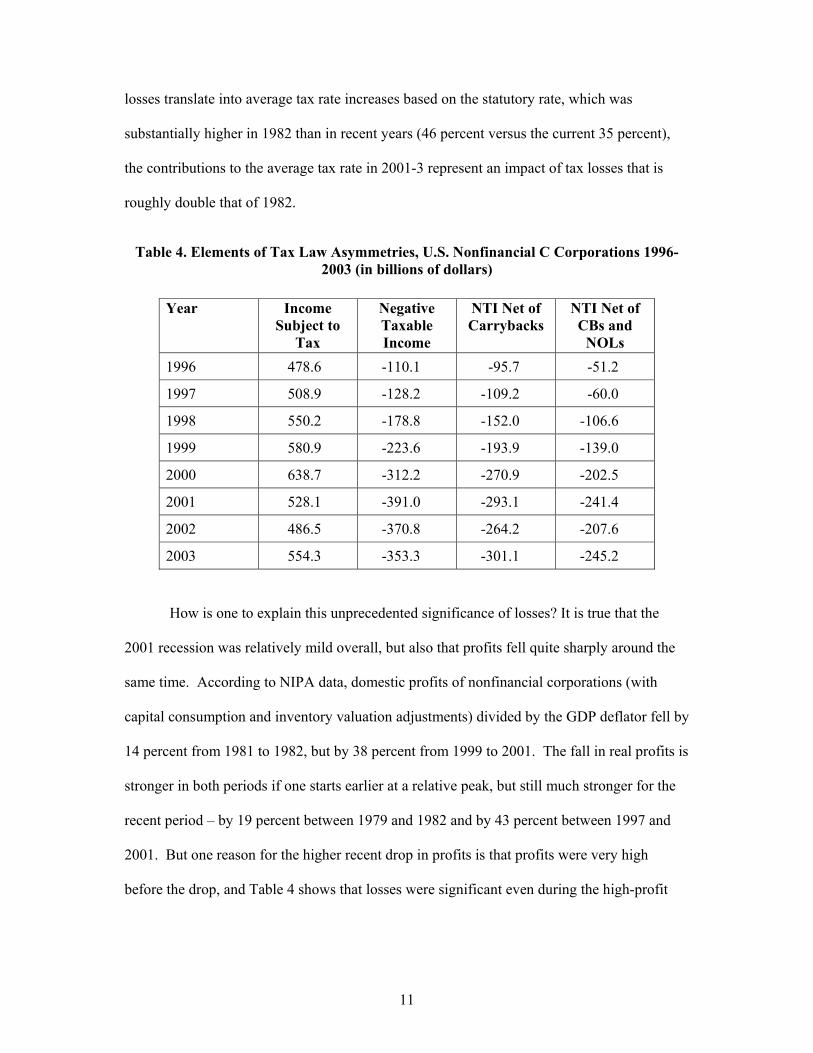
Table 4 provides a closer look at the recent behavior of this tax loss component. The
table�s first column lists the income subject to tax for nonfinancial C corporations for the
years 1996-2003. This is the aggregate income of companies with positive taxable income
and shows the expected cyclical pattern, peaking in 2000 and falling in nominal terms in the
recession year 2001 and again in 2002 before recovering in 2003. The next column, listing
the negative current income for remaining firms, holds the key to the recent growth in the
importance of tax law asymmetries. Negative income grew sharply between 1996 and 2002
to the point that net income (income subject to tax plus negative income) was barely positive
in 2002. Only a small portion of this negative income was carried back against the income on
previous years� tax returns, as the next column of the table shows,6 and net operating
deductions for previous losses offset only a small portion of these nondeductible current
losses. As a result, nondeductible current losses net of NOL deductions rose from about 11
percent of income subject to tax in 1996-7 to around 44 percent in 2001-3.
The resulting recent impact on the average tax rate in Table 3 is substantially higher
than in any year since 1983, and higher than in any year estimated by Auerbach and Poterba
(1987), who found the largest increase in the average tax rate between 1959 and 1985 to have
been 22 percentage points during the very serious recession year of 1982. As nondeductible
6 Because carrybacks are expressed as tax refunds rather than as deductions, I divide them by the effective tax rate on taxable income defined in the Appendix, τλ, to estimate the value of current losses carried back. This is consistent with expression (A3), which defines the contribution of losses to the average tax rate by multiplying negative taxable income and NOLs but not carrybacks by τλ.
11
losses translate into average tax rate increases based on the statutory rate, which was
substantially higher in 1982 than in recent years (46 percent versus the current 35 percent),
the contributions to the average tax rate in 2001-3 represent an impact of tax losses that is
roughly double that of 1982.
Table 4. Elements of Tax Law Asymmetries, U.S. Nonfinancial C Corporations 1996-2003 (in billions of dollars)
Year Income
Subject to Tax
Negative Taxable Income
NTI Net of Carrybacks
NTI Net of CBs and
NOLs 1996 478.6 -110.1 -95.7 -51.2
1997 508.9 -128.2 -109.2 -60.0
1998 550.2 -178.8 -152.0 -106.6
1999 580.9 -223.6 -193.9 -139.0
2000 638.7 -312.2 -270.9 -202.5
2001 528.1 -391.0 -293.1 -241.4
2002 486.5 -370.8 -264.2 -207.6
2003 554.3 -353.3 -301.1 -245.2
How is one to explain this unprecedented significance of losses? It is true that the
2001 recession was relatively mild overall, but also that profits fell quite sharply around the
same time. According to NIPA data, domestic profits of nonfinancial corporations (with
capital consumption and inventory valuation adjustments) divided by the GDP deflator fell by
14 percent from 1981 to 1982, but by 38 percent from 1999 to 2001. The fall in real profits is
stronger in both periods if one starts earlier at a relative peak, but still much stronger for the
recent period � by 19 percent between 1979 and 1982 and by 43 percent between 1997 and
2001. But one reason for the higher recent drop in profits is that profits were very high
before the drop, and Table 4 shows that losses were significant even during the high-profit

12
boom years of the late 1990s.7 Moreover, losses remained large even as profits recovered in
2003. Thus, it appears that the increasing importance of losses is due not simply a downward
shift in the distribution of the rate of profit among firms, but also a greater dispersion in the
rate of profit, causing many firms to have losses even when the overall rate of profit is not
low. Although this explanation is hard to verify using aggregate data, it squares with recent
evidence of increasing idiosyncratic volatility of various real measures of firm performance.
Surveying this evidence, Comin and Philippon (2005) argue that increases in product-market
competition and capital market access have contributed to this increasing volatility.8
How does the importance of tax losses relate to recent concerns about the viability of
the corporate tax? While there has been concern about the possible understatement of income,
it is difficult to see how tax shelters and heightened tax avoidance activity can be implicated,
given that such activity would be of far less value to taxpayers without current tax liability or
the ability to carry losses back. Indeed, as one tax avoidance strategy involves using
transactions between parties with different tax status to reduce overall tax liability, one might
have expected increases in tax avoidance behavior to have reduced the significance of
nondeductible losses, with loss-making firms transferring such losses to taxable firms which
could make better use of them.9
Returning to Table 3, none of the remaining three components are as important in
explaining the gap between the statutory and average tax rates as those already considered.
�Foreign Tax Effects� equals the taxes due on foreign source earnings in excess of foreign
tax credits. Because we are measuring the tax rate relative to domestic profits, the taxes paid
7 In 1999, for example, negative taxable income was 38 percent of income subject to tax, close to the previous high of 42 percent ratio reached in the serious recession year 1982. 8 There could be many other causes of increased volatility as well, including increased incentives for risk-taking induced by changes in the structure of executive compensation. 9 The ability of firms without taxable income to transfer deductions to other firms through �safe harbor� leasing helped reduce the cross-firm dispersion of income in the early �80s, but this provision was repealed early in 1982. See Warren and Auerbach (1983)

13
on foreign earnings represent an increase in the average tax rate. The contribution of this
term has grown somewhat over time, with the increasing importance of multinational
corporations. However, the very recent increase in 2001-2 is due to primarily to a reduction
in the denominator of the tax rate calculation, domestic profits.
The next column of Table 3, labeled �Progressivity,� accounts for the fact that taxes
before credits do not equal the product of the statutory tax rate and income subject to tax, as
they would under a proportional tax system. There are two reasons for this. First, the
corporate income tax structure has a small element of progressivity at very low levels of
income, which reduces the average tax rate. Second, the corporate minimum tax imposes an
extra tax burden on some firms, thereby increasing the average tax rate. The net impact of
these two offsetting effects is sometimes positive and sometimes negative, but always small
in magnitude. The same is true of the remaining, residual category that picks up the effects
of tax credits other than the investment and foreign tax credits and national income account
retabulations.
In summary, the average tax rate on the domestic income of nonfinancial C
corporations has increased in recent years, with the unprecedented impact of tax losses more
than offsetting other factors tending to reduce corporate tax burdens.
IV. Factors in the Change in Corporate Tax Revenues
Table 3 provided an exhaustive decomposition of changes in tax revenues, given the
profits of nonfinancial C corporations. As discussed in relation to Table 2, the rate of profit
for such corporations exhibits no obvious trend. But there are factors that could reduce both
net assets and profits, having no necessary impact on the rate of profit but still reducing
corporate taxes. Two such factors, already discussed, are the increased debt-assets ratios of
nonfinancial corporations and the growth of S corporations. Both have long been viewed as
channels for reducing taxes, although the overall reduction in taxes associated with such

14
factors is likely lower than the reduction in corporate taxes because of the increased
individual tax liabilities of recipients of interest payments and S corporation income.
Nevertheless, it is interesting to consider the role that these factors may have played in the
evolution of corporate tax collections.
Of course, it is impossible to know what corporate tax collections would have been
without the growth of debt and S corporations, but we can get an idea of the magnitude with
some simple calculations, in particular what corporate taxes would have been without interest
deductions or if all S corporation profits had been taxed at the average tax rate in Tables 2
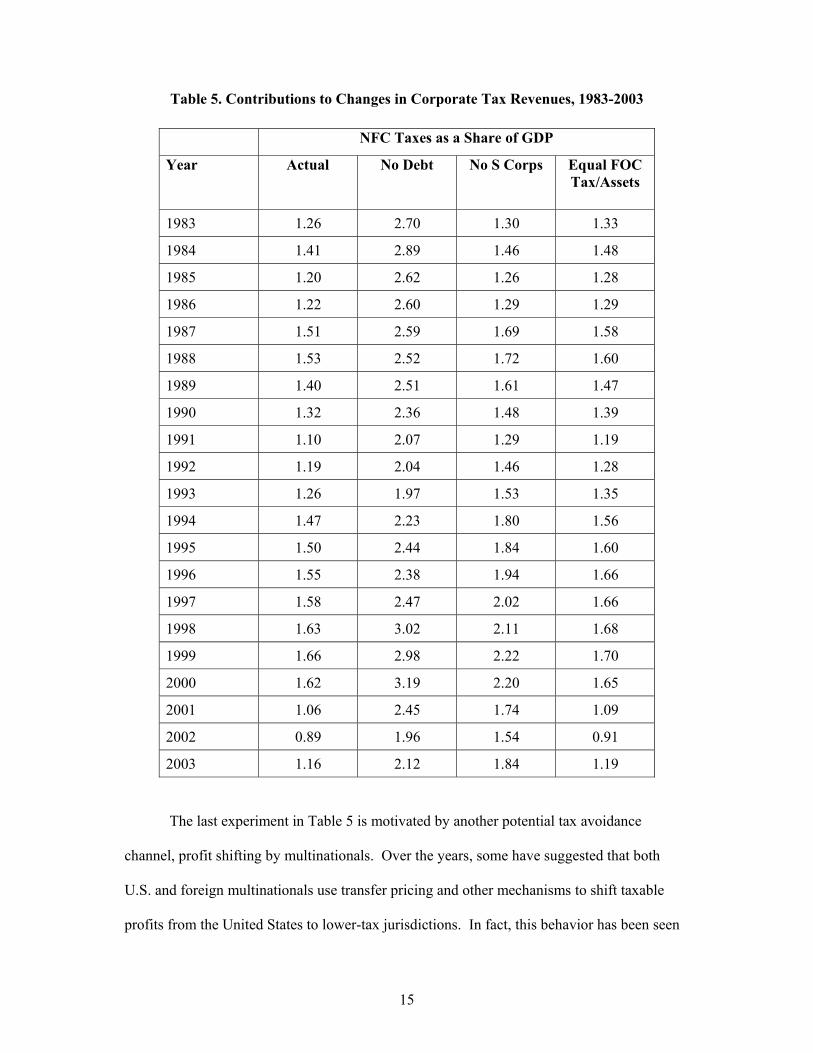
and 3. These effects of these two counterfactual calculations on NFC revenues as a share of
GDP are given in the second and third columns of Table 5, the first column of which repeats
the series for actual revenues as a share of GDP from Table 1.
Eliminating interest deductions, of course, increases corporate tax revenues.10
However, there is no clear trend to this adjustment between 1983 and 2003, as the declines in
the statutory corporate rate and the nominal interest rate (on which deductions are based) over
the period have offset the rise in debt-asset ratios.
By contrast, taxing S corporation profits would have increased the growth rate of
corporate tax collections, given the growth of S corporation assets and profits as a share of
the corporate total, especially in 1987, when the Tax Reform Act of 1986 increased the
incentive to shift from C- to S-corporate status11, and in recent years, when C corporation
profits declined so much.
10 Simulating the elimination of interest deductions requires some calculation of the tax savings generated by those deductions, which is complicated by the fact that firms vary in their ability to deduct interest and any given firm�s tax status is endogenous with respect to the interest deductions themselves. Graham (1999) produces estimates of the marginal tax rates before and after interest deductions for a large universe of firms, as well as means, medians, and other percentiles of the distribution of before-interest and after-interest marginal tax rates. To take account of the impact of interest deductions on tax status, I use the average of Graham�s mean before-interest and mean after-interest marginal tax rates for each year in my sample, based on unpublished updates of the series in Graham (1999) kindly provided by John Graham. 11 See Auerbach and Slemrod (1997)
15
Table 5. Contributions to Changes in Corporate Tax Revenues, 1983-2003
NFC Taxes as a Share of GDP
Year Actual No Debt No S Corps Equal FOC Tax/Assets
1983 1.26 2.70 1.30 1.33
1984 1.41 2.89 1.46 1.48
1985 1.20 2.62 1.26 1.28
1986 1.22 2.60 1.29 1.29
1987 1.51 2.59 1.69 1.58
1988 1.53 2.52 1.72 1.60
1989 1.40 2.51 1.61 1.47
1990 1.32 2.36 1.48 1.39
1991 1.10 2.07 1.29 1.19
1992 1.19 2.04 1.46 1.28
1993 1.26 1.97 1.53 1.35
1994 1.47 2.23 1.80 1.56
1995 1.50 2.44 1.84 1.60
1996 1.55 2.38 1.94 1.66
1997 1.58 2.47 2.02 1.66
1998 1.63 3.02 2.11 1.68
1999 1.66 2.98 2.22 1.70
2000 1.62 3.19 2.20 1.65
2001 1.06 2.45 1.74 1.09
2002 0.89 1.96 1.54 0.91
2003 1.16 2.12 1.84 1.19
The last experiment in Table 5 is motivated by another potential tax avoidance
channel, profit shifting by multinationals. Over the years, some have suggested that both
U.S. and foreign multinationals use transfer pricing and other mechanisms to shift taxable
profits from the United States to lower-tax jurisdictions. In fact, this behavior has been seen

16
as leading to increasing tax competition among countries and declines in statutory corporate
tax rates (e.g., Devereux et al. 2002). The responsiveness of the location of both investment
and profits to tax incentives is the subject of a considerable literature and beyond the scope of
this paper, but the last column in Table 5 provides a measure of the potential importance of
one channel through which such activity operates. The column indicates how much higher
U.S. corporate taxes would have been if foreign-controlled U.S. subsidiaries, presumably
with access to profit-shifting opportunities, had the same tax-assets ratio as other domestic
corporations. Under this assumption, taxes of U.S. nonfinancial corporations would have
been higher, because foreign-owned companies have consistently had lower tax-assets ratios.
The effect is small throughout the period, given the relatively small gap between tax-assets
ratios and the relatively small share of U.S. companies that are foreign-controlled. But there
are many other channels for international tax avoidance and behavioral responses not
accounted for here, such as the shifting of profits abroad by U.S.-owned companies and the
movement of activities themselves, which would show up as a decline in U.S. assets.
V. Other Considerations
This paper has examined many of the factors contributing to the evolution of the
corporate income tax as a revenue source in the United States, breaking these down into those
affecting the average tax rate on corporate profits and those affecting corporate profits
themselves. The measure of profits used has been is based on profits declared for tax
purposes, with a few transparent adjustments. As shown in Table 2, there has been no
obvious trend in the rate of profit based on this measure, which suggests that the decline in
the profits of CNFCs as a share of GDP is traceable to the decline in CNFC net assets,
attributable to the growth of S corporations, increased debt-assets ratios, and the decline in
the size of NFC assets. Part of the explanation for the decline in NFC assets may be a shift in
domestic industrial composition from nonfinancial to financial activities, as discussed in

17
relation to Table 1. But the downward trend in NFC assets may also be overstated by the
focus on tangible assets. A more comprehensive asset measure that includes the value of
capitalized intangibles would not only be larger, but likely would also have a different trend,
given estimates of the increasing importance of intangible assets in relation to tangible
assets.12 Including intangibles would increase estimated corporate assets, and also estimated
corporate profits, given that most expenditures on intangibles are immediately expensed for
tax purposes and hence deducted from income.13 Thus, the estimated average tax rate would
be reduced. The impact on the estimated rate of profit is ambiguous, but it is certainly
possible that accounting for intangibles would reduce the estimated rate of profit,14 and this
would lend credence to arguments that the profits reported for tax purposes have been
increasingly understated in recent years as the result of aggressive tax avoidance behavior.
Some have argued that there is a widening gap between profits declared to tax
authorities and some measure of �true� profits, and cite this gap as evidence of increasing
dependence on tax shelters. For example, Desai (2003) calculates that the standard
adjustments to the income on tax returns yield predictions of book income falling
increasingly short of actual book income over the course of the late 1990s. This could be
evidence of understated tax income, but also possibly of overstated book income or
increasing error in the adjustments in translating tax income into estimated book income.
Desai argues in favor of the first of these hypotheses, but the evidence is necessarily indirect,
given the nature of tax shelters. It is noteworthy, though, that the gap between book and tax
income fell sharply after the late 1990s, actually becoming negative in 2001 (Plesko and
12 See Corrado, Hulten and Sichel (2006) for recent estimates of the growth of business intangible assets in the United States. 13 Replacing current expenditures on intangibles with a measure of the depreciation of the intangibles stock would reduce estimated expenses and hence increased estimated profits as long as expenditures exceed depreciation, i.e., the stock of intangibles is growing, as seems surely to be the case. 14 This would be the case if the adjustment to profits, relative to the stock of intangibles, was smaller than the previously estimated rate of profit.

18
Shumofsky 2004/5), suggesting perhaps that the unexplained gap between book income
predicted from tax income and actual book income may have fallen as well.15 Even if the
tax-book gap has declined or can be explained by other factors, though, the possible growth
of tax shelters cannot be ruled out to the extent that they reduce both book and tax income
measures. Thus, it is very difficult to estimate the extent to which tax shelters and aggressive
tax planning arrangements reduce current corporate tax collections.
VI. Conclusions
As a share of GDP, U.S. federal tax revenues from nonfinancial corporations have
held relatively constant since the early 1980s, after falling precipitously during the late 1960s
and the 1970s. But this relative constancy masks offsetting trends in the ratio of nonfinancial
C corporation profits to GDP (declining) and the average tax rate on this profits (increasing).
The recent upward spike in the average tax rate is largely extent attributable to the
importance of tax losses, and casts some doubt on the importance of tax planning activities as
a vehicle for reducing corporate taxes. So, too, does the relative stability of the rate of profit,
which might be expected to have declined had the understatement of profits for tax purposes
been increasing. Still, the year-to-year volatility of the measured rate of profit as well as the
possibility that assets are being increasingly understated by the exclusion of intangibles limits
our ability to draw conclusions about the extent of tax shelters and other aggressive corporate
tax avoidance activity.
The recent increase in the significance of tax losses may reflect a growing dispersion
in profit outcomes among firms, which would be consistent with other recent evidence
showing increasing firm-level volatility. If there has been an increase in dispersion and
volatility, then the asymmetry of the corporate tax takes on more importance as a source of
15 Or, perhaps what happened in 2001 was an anomaly. The book-tax gap appears to have rebounded since then, based on 2004 IRS data from firms filing the new M-3 form. See Boynton, DeFilippes, and Legel (2006).

19
distortion and cyclical instability, presenting different firms with different incentives to invest
and discouraging investment during periods of low profitability. Thus, the recent strength of
corporate tax revenues need not lessen the need for corporate tax reform.
Appendix
This appendix provides a brief review of the updated Auerbach-Poterba methodology
and the data sources used, focusing on basic concepts and areas in which the methodology
has been adapted. Further details are provided in Auerbach and Poterba (1987), as well as in
an unpublished data appendix, available upon request, which describes the assumptions,
imputations and interpolations that were required to deal with missing data and to separate
NFC corporate profits from all corporate profits, to break NFC corporate profits into those of
C and S corporations and into those of foreign-owned and domestic-owned corporations, and
to deal with changing data definitions in the National Income and Product Accounts.
The methodology calculates the average tax rate on domestic income of nonfinancial
C corporations and decomposes this average tax rate into a number of components. By
focusing on nonfinancial C corporations, we exclude the financial corporations that are
subject to different tax rules and S corporations for which earnings are passed through to
owners for tax purposes.
The first step in the methodology involves separate computations of taxes and profits
for U.S. nonfinancial C corporations, using data from three sources, the National Income and
Product Accounts produced by the Bureau of Economic Analysis (NIPA), information from
tax returns compiled by the Statistics of Income division of the Internal Revenue Service
(SOI), and the Flow of Funds Accounts of the Federal Reserve System (FOF). Although
most of the data are available either online or from published tables and articles, some
individual components have been obtained from unpublished sources.

20
Profits
The objective in estimating profits is to measure the real economic profits of
nonfinancial C corporations. The measure is based on expression (A1):
(A1) Profits = Income Subject to Tax (SOI) + Net Operating Loss Deductions (SOI) + Negative Taxable Income (SOI) � Foreign Source Income (SOI) + CCADJ (NIPA) + IVA (NIPA) + Debtgain (FOF) = ISTT + NOL + NTI � FSI + CCADJ + IVA +DG
where the second, abbreviated version of the expression will be used below.
The first two components of this expression equal the income for tax purposes of
taxable companies, before deductions for previous tax losses. The third component is the
income of companies with no tax liability, so the first three components together equal the
income of all companies. The fourth component is subtracted to obtain a measure of
domestic income. The fourth and fifth components, the capital consumption and inventory
valuation adjustments from the national income accounts, are needed to convert income for
tax purposes into a measure of economic income. The final component of expression (A1)
equals the gain to owners of corporations due to the inflation-induced decline in value of
corporate liabilities, measured as the inflation rate multiplied by market value of the
nonfinancial corporate credit-market debt.16
Because information on the breakdown between C and S corporations is available
only for data obtained from SOI, we assume that the breakdown between C and S
corporations of the three remaining components in (A1) is the same as the sum of the first
four.
16 The Flow of Funds Accounts provide only the book values of credit market debt. We convert this series of book values into a series of estimated market values using a perpetual inventory method, starting in 1968 with the assumption that market and book values were the same in that year and assuming that each year�s gross issues of debt had a maturity of 30 years and carried level coupon payments at the year of issue�s Baa corporate bond rate, taken from the Economic Report of the President.

21
Taxes
No breakdown of taxes between C and S nonfinancial corporations is needed, because
only C corporations pay corporate income taxes. Taxes are defined using the expression:
(A2) Taxes = Income Taxes Before Credits (SOI) � Tax Credits (SOI) � Carryback Refunds (NIPA) + Other Retabulations (NIPA) = τλISTT � CB � ITC � FTC � OC + RETAB
where the second, abbreviated version will be used below. This version breaks tax credits
into three components, the investment tax credit (ITC), the foreign tax credit (FTC) and other
credits, and defines the parameter λ implicitly as the adjustment to the statutory tax rate,τ,
required to make the product of income subject to tax (ISTT) and the tax rate equal to income
taxes before credits. This adjustment accounts not only for the very minor progressivity in the
regular corporate tax code, but also for variations in tax payments due to the application of
the corporate minimum tax, which when applicable imposes a different tax base and a
different tax rate.
Average Tax Rate Decomposition
Dividing expression (A2) by (A1) and rearranging terms yields:
(A3) Taxes/Profits = τ � τλ(ccadj + itc) � τλ(iva + dg) � [τλ(nol + nti) + cb] � (ftc � τλfsi) � τ(1 � λ) � (oc � retab)
where lower case variables equal the corresponding upper case variables in (A1) and (A2)
divided by Profits as defined in (A1). Expression (A3) provides the breakdown used in Table
3, starting from the statutory tax rate, τ, and accounting for adjustments for, respectively,
capital recovery, other inflation effects, tax losses, foreign tax effects, tax progressivity, and
other factors. Each of these adjustments is defined as a reduction in the effective tax rate, but

22
it is logically possible in most cases for the adjustments to increase taxes rather than
decreasing them.
References
Auerbach, Alan J., 2006, �Who Bears the Corporate Tax?� in J. Poterba, ed., Tax Policy and the Economy 20, pp. 1-40. Auerbach, Alan J., and James M. Poterba, 1987, �Why Have Corporate Tax Revenues Declined?� in L. Summers, ed., Tax Policy and the Economy 1, pp. 1-28. Auerbach, Alan J., and Joel Slemrod, 1997, �The Economic Effects of the Tax Reform Act of 1986,� Journal of Economic Literature 35(2), June, pp. 589-632. Boynton, Charles, Portia DeFilippes, and Ellen Legel, 2006, �A First Look at 2004 Schedule M-3 Reporting by Large Corporations,� Tax Notes, September 11, pp. 943-981. Comin, Diego, and Thomas Philippon, 2005, �The Rise in Firm-Level Volatility: Causes and Consequences,� in M. Gertler and K. Rogoff, eds., NBER Macroeconomics Annual, pp. 167-201. Corrado, Carol, Charles R. Hulten, and Daniel E. Sichel, 2006, �Intangible Capital and Economic Growth,� NBER Working Paper 11948, January. Desai, Mihir A., 2003, �The Divergence between Book Income and Tax Income,� in J. Poterba, ed., Tax Policy and the Economy 17, pp.169-206. Devereux, Michael P., Rachel Griffith and Alexander Klemm, 2002, �Corporate Income Tax Reforms and International Tax Competition,� Economic Policy 17(2), October, pp. 450-495. Graham, John R., 1999, �Do Personal Taxes Affect Corporate Financing Decisions?� Journal of Public Economics 73(2), August, pp. 147-185. Mackie, James B., III, 1999, �The Puzzling Comeback of the Corporate Income Tax,� National Tax Association 92nd Annual Proceedings, pp. 93-102. McLure, Charles E., Jr., 1979, Must Corporate Income Be Taxed Twice? Washington DC: Brookings Institution. Plesko, George A., and Nina L. Shumofsky, 2004-5, �Reconciling Corporation Book and Tax Net Income, Tax Years 1995-2001,� Statistics of Income Bulletin 24(3), Winter, pp. 103-108. Poterba, James M., 1992, �Why Didn�t the Tax Reform Act of 1986 Raise Corporate Taxes?� in J. Poterba, ed., Tax Policy and the Economy 6, pp.43-58. Warren, Alvin C., Jr., and Alan J. Auerbach, 1983, �Tax Policy and Equipment Leasing After TEFRA,� Harvard Law Review 96(7), May, pp. 1579-1598.