Why government expenditure cuts are necessary
28
Working Paper 57 London's food exports Melisa Wickham June 2013
Transcript of Why government expenditure cuts are necessary

Working Paper 57
London's food exports Melisa Wickham June 2013

London's food exports
copyright
Greater London Authority June 2013
Published by Greater London Authority City Hall The Queens Walk London SE1 2AA
www.london.gov.uk Tel 020 7983 4922
Minicom 020 7983 4000
ISBN 978 1 84781 555 2
Cover photograph
© Sutterstock.com
For more information about this publication, please contact:
GLA Economics
Tel 020 7983 4922
Email [email protected]
GLA Economics provides expert advice and analysis on London’s economy and the economic issues facing the capital. Data and analysis from GLA Economics form a basis for the policy and investment decisions facing the Mayor of London and the GLA group. GLA Economics uses a wide range of information and data sourced from third party suppliers within its analysis and reports. GLA Economics cannot be held responsible for the accuracy or timeliness of this information and data. The GLA will not be liable for any losses suffered or liabilities incurred by a party as a result of that party relying in any way on the information contained in this report.
London's food exports
GLA Economics 1
Contents
Executive summary ...................................................................................................................... 2
Introduction ................................................................................................................................ 3
Background ................................................................................................................................. 4
London’s total food exports ........................................................................................................ 5
London’s food exports by product and destination ................................................................... 10
Annex A: Breakdown of countries within global regions, 2001-2011 ........................................ 15
Annex B: Analysis of destination of London’s top food exports since 2001............................... 16
Annex C: Top destinations for London’s food exports in 2011 .................................................. 24

London's food exports
GLA Economics 2
Executive summary
In the decade to 2011, the value of London’s food exports rose by £0.7 billion to £1.8 billion. As a share of all goods exported from the capital, food’s share has remained stable at around 5 per cent. The value of beverage exports make up the largest proportion of London’s food exports, which at £821.4 million made up 46 per cent of all London food exports in 2011.Over two-fifths of these beverage exports were to EU countries, with a further 34 per cent destined for Asia and Oceania.
As might be expected given its proximity and the number of countries comprising it, the EU is the largest market region for London’s food exports, accounting for half of all exports by value. Asia and Oceania was the second most important region in 2011. Looking at individual countries, in 2011 the Irish Republic had the highest total value of food exports from London (with a 14 per cent share of London’s global food exports), followed by France and Hong Kong respectively.
London's food exports
GLA Economics 3
Introduction
This note looks at London’s exports of food from 2001 to 2011 to help inform London’s policy on trade missions and promotion of trade to London businesses within the food industry. The report begins with a broad overview of the value of London’s food exports, looking at how the product composition has changed over the decade as well as changes in the importance of different markets. The report then goes on to look at the country/product mix of London’s food exports (supported by two Annexes which provide a more detailed analysis of London’s food exports).

London's food exports
GLA Economics 4
Background
In line with national reporting of trade statistics, the values reported here represent only the revenue to London from exporting food. They do not allow for any judgement on the value added to London’s economy from this revenue. In a world of increasingly globalised production chains it is possible that only a small fraction of the value of the exports stays within the domestic economy (and this is likely to vary considerably across food commodities). In the same way as a shop which sells £2 worth of goods does not make £2 profit, an economy which exports £2bn of food does not add £2bn of value to its economy. For example, the £2bn of exports may have required £1bn of raw materials to be imported in which case the exports have only added a net £1bn to the economy.
Data on London’s food exports has been taken from HMRC UK Trade Info Regional Trade Statistics (RTS) dataset. These estimates are based on both (a) Customs administrative data based on the declarations of goods exports transactions to non-EU countries and (b) the Intrastat system which records exports to the EU. Exports are then assigned to regions by using the postcode associated with a company’s VAT registration. HMRC make some adjustment to account for head office bias (which would otherwise artificially inflate London estimates) but some bias is likely to remain.
Further details on the methodology behind the HMRC estimates can be found at: https://www.uktradeinfo.com/Statistics/Documents/rtsMethodsrevision2007v3.pdf
Export data from the RTS is available down to the 2-digit Standard International Trade Classification (SITC) level. For the purposes of this work ‘food’ is taken to comprise of the following SITC commodities: 00: Live animals other than animals of division 03, 01: Meat & meat preparations, 02: Dairy products & birds’ eggs, 03: Fish, crustaceans, molluscs & aquatic invertebrates, and preparations thereof, 04: Cereals and cereal preparations, 05: Vegetables and fruit, 06: Sugars, sugar preparations and honey, 07: Coffee, tea, cocoa, spices, and manufactures thereof, 09: Miscellaneous edible products and preparations, 11: Beverages, 41: Animal oils and fats, 42: Fixed vegetable fats and oils, crude, refined or fractionated and 43: Animal or vegetable fats and oils, processed; waxes of animal or vegetable origin; inedible mixtures or preparations of animal or vegetable fats or oils, not elsewhere specified (n.e.s.).
Looking at exports to global regions over time raises issues in terms of the changing country compositions (e.g. EU) and data availability (where data in some years is available for individual countries but in other years is grouped within ‘other’ due to data size). As such, the 2011 HMRC definitions have been used for each year throughout the analysis, thereby providing a consistent basis to analyse changes over time. Annex A provides a breakdown of the countries comprising each region.
London's food exports
GLA Economics 5
London’s total food exports
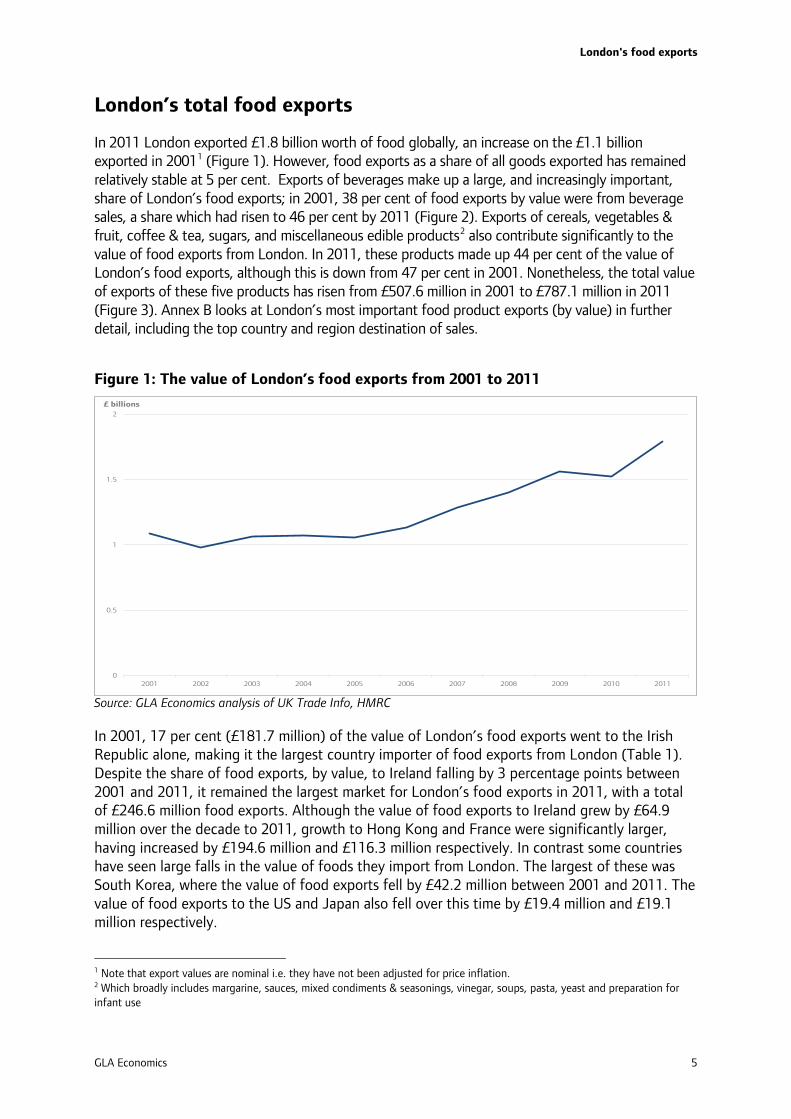
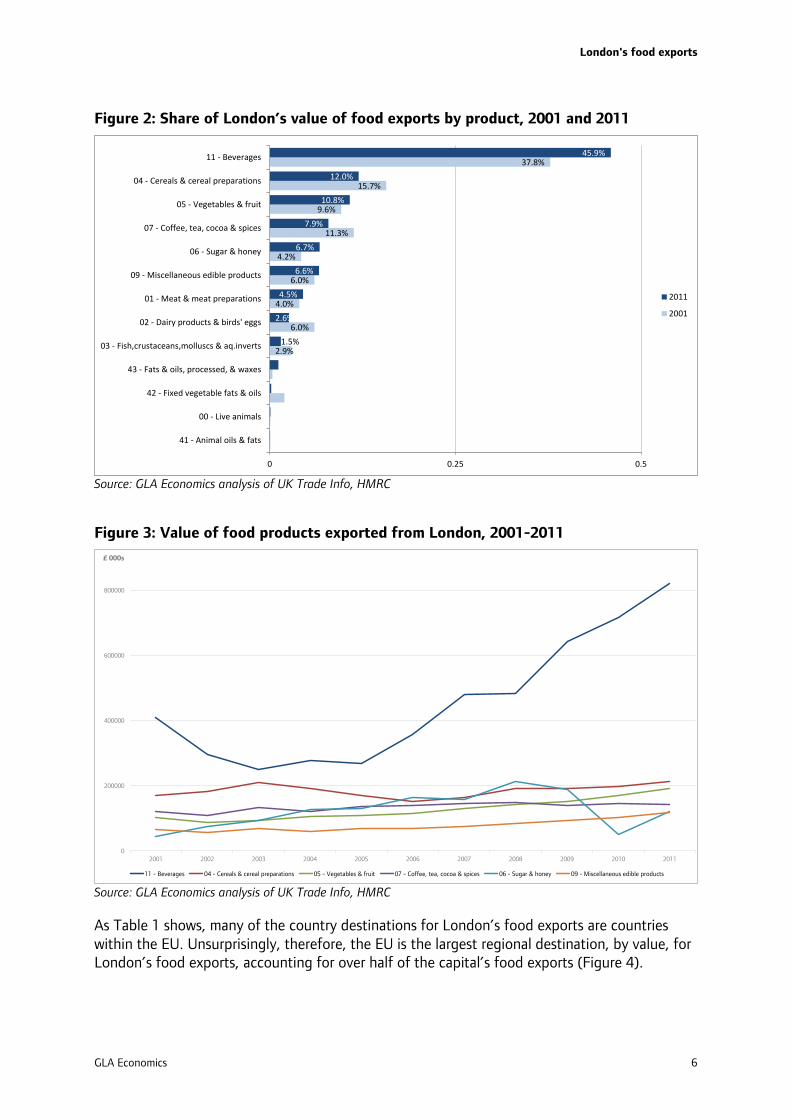
In 2011 London exported £1.8 billion worth of food globally, an increase on the £1.1 billion exported in 20011 (Figure 1). However, food exports as a share of all goods exported has remained relatively stable at 5 per cent. Exports of beverages make up a large, and increasingly important, share of London’s food exports; in 2001, 38 per cent of food exports by value were from beverage sales, a share which had risen to 46 per cent by 2011 (Figure 2). Exports of cereals, vegetables & fruit, coffee & tea, sugars, and miscellaneous edible products2 also contribute significantly to the value of food exports from London. In 2011, these products made up 44 per cent of the value of London’s food exports, although this is down from 47 per cent in 2001. Nonetheless, the total value of exports of these five products has risen from £507.6 million in 2001 to £787.1 million in 2011 (Figure 3). Annex B looks at London’s most important food product exports (by value) in further detail, including the top country and region destination of sales.
Figure 1: The value of London’s food exports from 2001 to 2011
Source: GLA Economics analysis of UK Trade Info, HMRC
In 2001, 17 per cent (£181.7 million) of the value of London’s food exports went to the Irish Republic alone, making it the largest country importer of food exports from London (Table 1). Despite the share of food exports, by value, to Ireland falling by 3 percentage points between 2001 and 2011, it remained the largest market for London’s food exports in 2011, with a total of £246.6 million food exports. Although the value of food exports to Ireland grew by £64.9 million over the decade to 2011, growth to Hong Kong and France were significantly larger, having increased by £194.6 million and £116.3 million respectively. In contrast some countries have seen large falls in the value of foods they import from London. The largest of these was South Korea, where the value of food exports fell by £42.2 million between 2001 and 2011. The value of food exports to the US and Japan also fell over this time by £19.4 million and £19.1 million respectively.
1 Note that export values are nominal i.e. they have not been adjusted for price inflation. 2 Which broadly includes margarine, sauces, mixed condiments & seasonings, vinegar, soups, pasta, yeast and preparation for infant use
0
0.5
1
1.5
2
2001 2002 2003 2004 2005 2006 2007 2008 2009 2010 2011
£ billions
London's food exports
GLA Economics 6
Figure 2: Share of London’s value of food exports by product, 2001 and 2011
Source: GLA Economics analysis of UK Trade Info, HMRC
Figure 3: Value of food products exported from London, 2001-2011
Source: GLA Economics analysis of UK Trade Info, HMRC
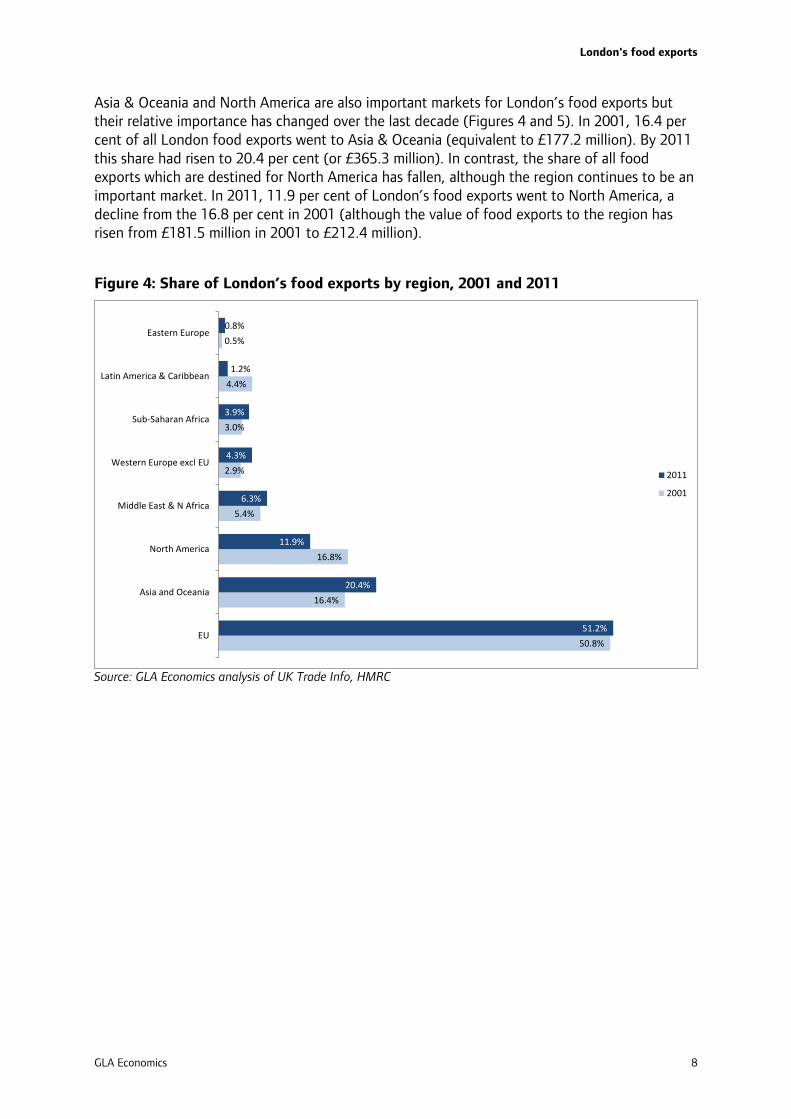
As Table 1 shows, many of the country destinations for London’s food exports are countries within the EU. Unsurprisingly, therefore, the EU is the largest regional destination, by value, for London’s food exports, accounting for over half of the capital’s food exports (Figure 4).
2.9%
6.0%
4.0%
6.0%
4.2%
11.3%
9.6%
15.7%
37.8%
1.5%
2.6%
4.5%
6.6%
6.7%
7.9%
10.8%
12.0%
45.9%
0 0.25 0.5
41 - Animal oils & fats
00 - Live animals
42 - Fixed vegetable fats & oils
43 - Fats & oils, processed, & waxes
03 - Fish,crustaceans,molluscs & aq.inverts
02 - Dairy products & birds' eggs
01 - Meat & meat preparations
09 - Miscellaneous edible products
06 - Sugar & honey
07 - Coffee, tea, cocoa & spices
05 - Vegetables & fruit
04 - Cereals & cereal preparations
11 - Beverages
2011
2001
0
200000
400000
600000
800000
2001 2002 2003 2004 2005 2006 2007 2008 2009 2010 2011
£ 000s
11 - Beverages 04 - Cereals & cereal preparations 05 - Vegetables & fruit 07 - Coffee, tea, cocoa & spices 06 - Sugar & honey 09 - Miscellaneous edible products

London's food exports
GLA Economics 7
Table 1: Top food export markets for London by value in 2011 and change since 2001
Source: GLA Economics analysis of UK Trade Info, HMRC.
Exports destination2001 2011 Change 2001 2011 Change
Irish Republic 1 1 181.7 246.6 France 3 2 109.9 226.2 Hong Kong 11 3 19.1 213.6 United States 2 4 144.8 125.5 Netherlands 5 5 48.0 100.4 Canada 9 6 32.5 82.3 Germany 7 7 43.1 58.1 Belgium 10 8 26.6 57.5 Italy 18 9 14.4 51.8 Singapore 17 10 15.2 46.1 Spain 6 11 47.4 43.3 Norway 21 12 12.2 42.4 UAE 24 13 11.4 42.2 Nigeria 15 14 15.7 36.9 Sweden 13 15 17.5 27.1 Denmark 12 16 18.5 22.9 Israel 16 17 15.3 21.0 Switzerland 20 18 12.3 20.8 Japan 8 19 38.2 19.1 Australia 22 20 11.9 17.8 China 41 21 3.8 17.4 Czech Republic 33 22 5.0 16.7 Other Asia and Oceania 30 23 6.3 15.7 Poland 43 24 3.6 11.6 South Africa 27 25 7.6 11.2 Cyprus 31 26 5.5 11.2 Egypt 26 27 9.4 9.7 Ghana 56 28 1.6 9.2 Saudi Arabia 38 29 4.2 8.3 Malta 32 30 5.1 8.3 Russia 36 31 4.3 8.0 Finland 35 32 4.4 7.9 South Korea 4 33 49.5 7.3 Turkey 58 34 1.4 7.0 Other Latin America and the Caribbean 14 35 16.0 6.7 Taiwan 23 36 11.7 6.7 Other Sub-Saharan Africa 37 37 4.3 6.5 Pakistan 59 38 1.4 6.0 India 57 39 1.5 5.9 Greece 29 40 6.6 5.3 Portugal 28 41 7.1 4.9 Mexico 42 42 3.6 4.6 Kuwait 34 43 4.9 4.4 Jordan 76 44 0.4 4.3 Other Middle East and North Africa 63 45 1.1 4.0 Ukraine 84 46 0.2 4.0 Thailand 19 47 12.8 3.9 Iceland 49 48 2.5 3.6 Other Western Europe 48 49 2.7 3.6 Libya 89 50 0.1 3.1
Rank Export value (£ million)
London's food exports
GLA Economics 8
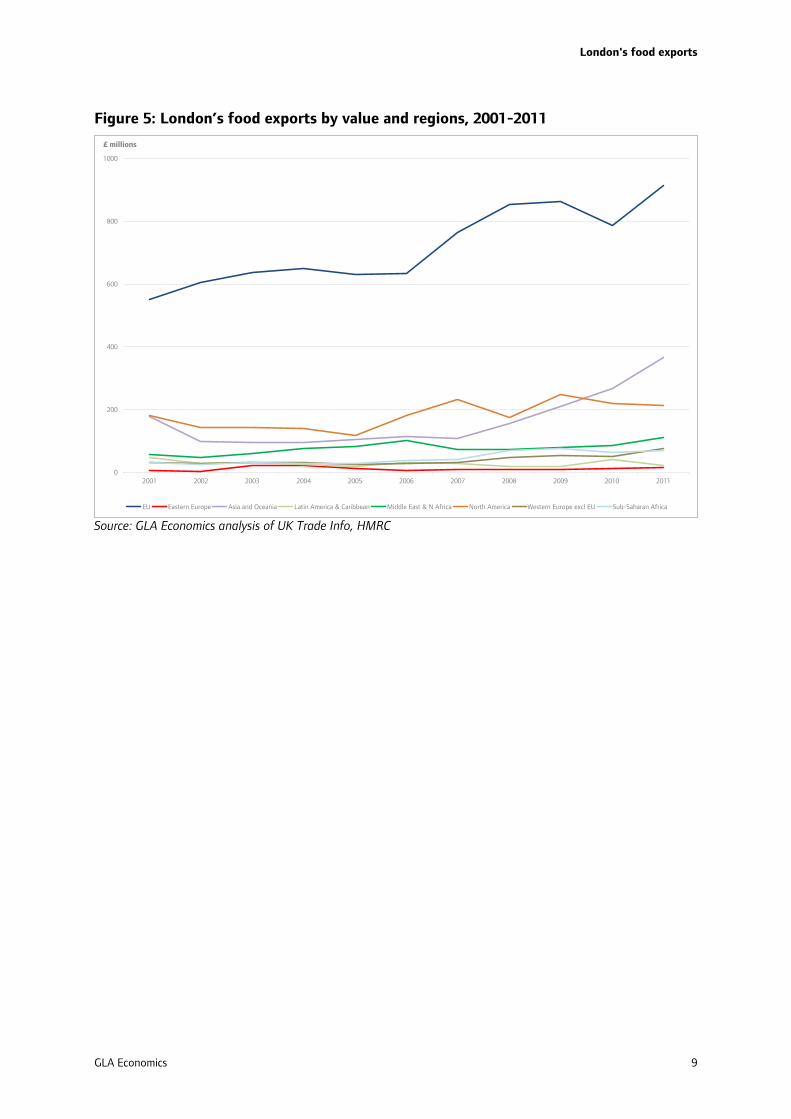
Asia & Oceania and North America are also important markets for London’s food exports but their relative importance has changed over the last decade (Figures 4 and 5). In 2001, 16.4 per cent of all London food exports went to Asia & Oceania (equivalent to £177.2 million). By 2011 this share had risen to 20.4 per cent (or £365.3 million). In contrast, the share of all food exports which are destined for North America has fallen, although the region continues to be an important market. In 2011, 11.9 per cent of London’s food exports went to North America, a decline from the 16.8 per cent in 2001 (although the value of food exports to the region has risen from £181.5 million in 2001 to £212.4 million).
Figure 4: Share of London’s food exports by region, 2001 and 2011
Source: GLA Economics analysis of UK Trade Info, HMRC
50.8%
16.4%
16.8%
5.4%
2.9%
3.0%
4.4%
0.5%
51.2%
20.4%
11.9%
6.3%
4.3%
3.9%
1.2%
0.8%
EU
Asia and Oceania
North America
Middle East & N Africa
Western Europe excl EU
Sub-Saharan Africa
Latin America & Caribbean
Eastern Europe
2011
2001
London's food exports
GLA Economics 9
Figure 5: London’s food exports by value and regions, 2001-2011
Source: GLA Economics analysis of UK Trade Info, HMRC
0
200
400
600
800
1000
2001 2002 2003 2004 2005 2006 2007 2008 2009 2010 2011
£ millions
EU Eastern Europe Asia and Oceania Latin America & Caribbean Middle East & N Africa North America Western Europe excl EU Sub-Saharan Africa
London's food exports
GLA Economics 10
London’s food exports by product and destination
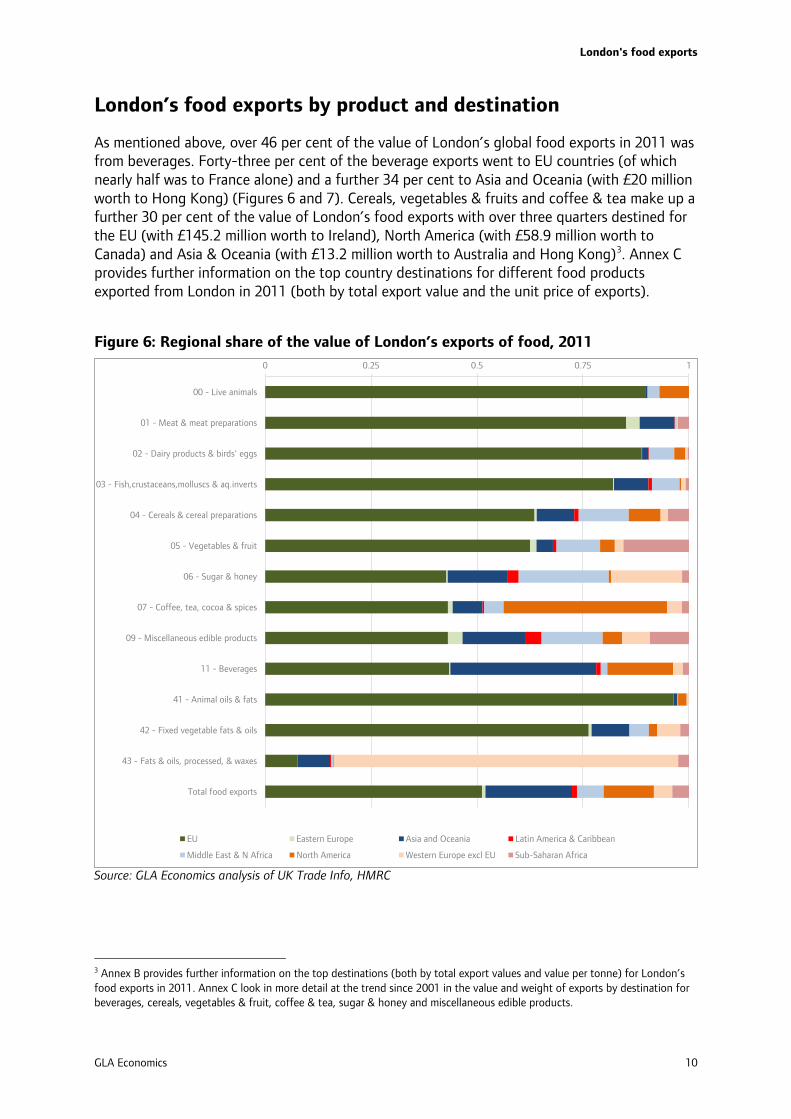
As mentioned above, over 46 per cent of the value of London’s global food exports in 2011 was from beverages. Forty-three per cent of the beverage exports went to EU countries (of which nearly half was to France alone) and a further 34 per cent to Asia and Oceania (with £20 million worth to Hong Kong) (Figures 6 and 7). Cereals, vegetables & fruits and coffee & tea make up a further 30 per cent of the value of London’s food exports with over three quarters destined for the EU (with £145.2 million worth to Ireland), North America (with £58.9 million worth to Canada) and Asia & Oceania (with £13.2 million worth to Australia and Hong Kong)3. Annex C provides further information on the top country destinations for different food products exported from London in 2011 (both by total export value and the unit price of exports).
Figure 6: Regional share of the value of London’s exports of food, 2011
Source: GLA Economics analysis of UK Trade Info, HMRC
3 Annex B provides further information on the top destinations (both by total export values and value per tonne) for London’s food exports in 2011. Annex C look in more detail at the trend since 2001 in the value and weight of exports by destination for beverages, cereals, vegetables & fruit, coffee & tea, sugar & honey and miscellaneous edible products.
0 0.25 0.5 0.75 1
00 - Live animals
01 - Meat & meat preparations
02 - Dairy products & birds' eggs
03 - Fish,crustaceans,molluscs & aq.inverts
04 - Cereals & cereal preparations
05 - Vegetables & fruit
06 - Sugar & honey
07 - Coffee, tea, cocoa & spices
09 - Miscellaneous edible products
11 - Beverages
41 - Animal oils & fats
42 - Fixed vegetable fats & oils
43 - Fats & oils, processed, & waxes
Total food exports
EU Eastern Europe Asia and Oceania Latin America & Caribbean
Middle East & N Africa North America Western Europe excl EU Sub-Saharan Africa

London's food exports
GLA Economics 11
Figure 7: Share of the value of London’s food exports by region, 2011
Source: GLA Economics analysis of UK Trade Info, HMRC
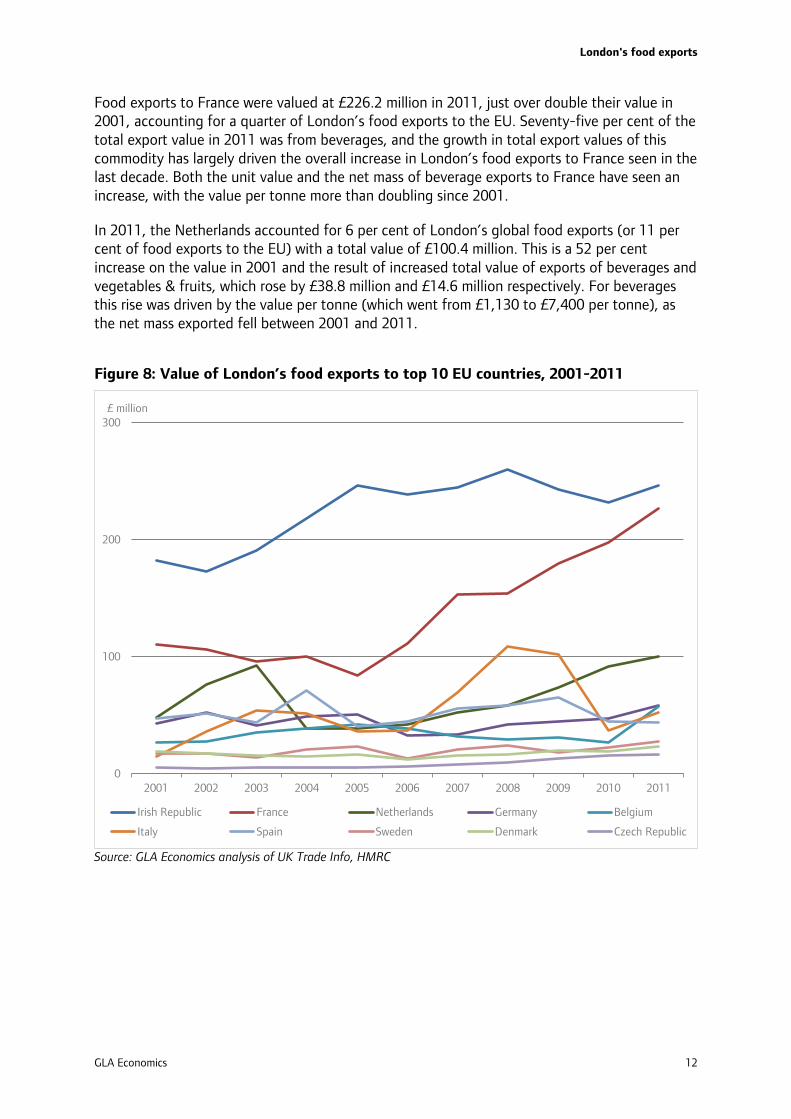
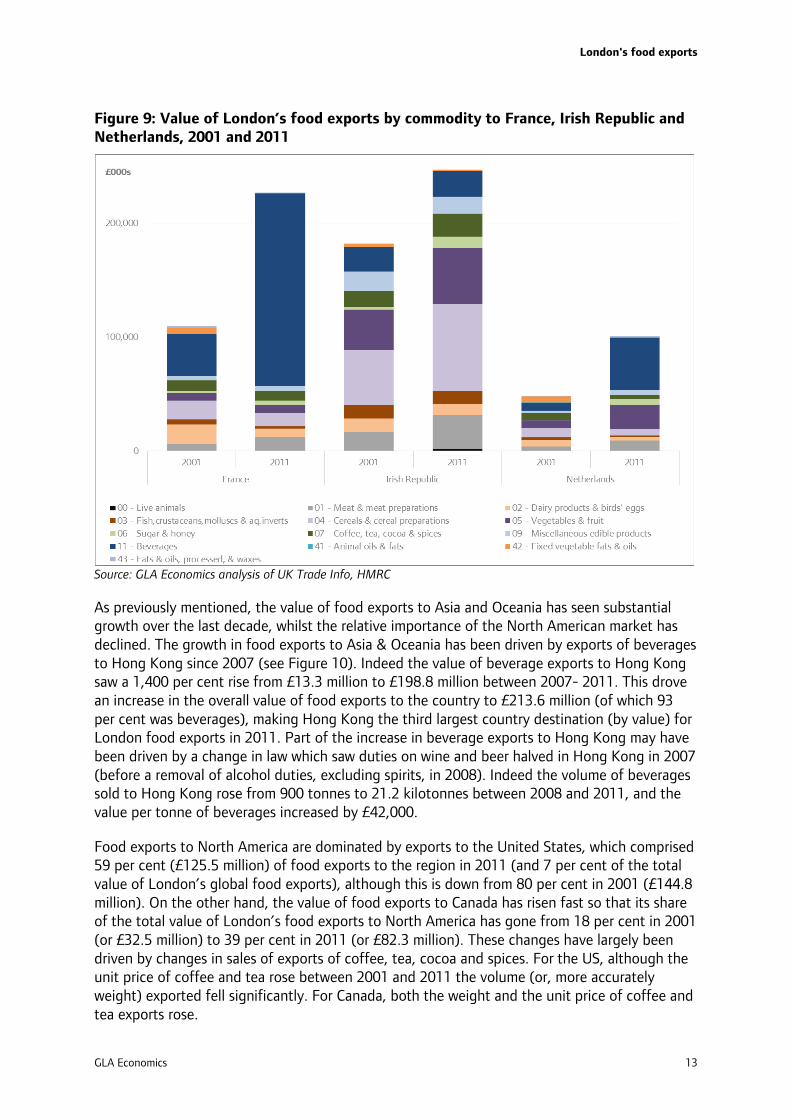
Just over half of all food exports from London are to the EU, dominated by exports of beverages (39 per cent of all exports to the EU), cereals & cereal preparation (15 per cent) and vegetables & fruit (13 per cent). Ireland, France and the Netherlands are particularly important markets, accounting for nearly a third of the global value of London’s food exports, or 63 per cent of food exports to the EU (Figure 8). In 2011, total food exports to Ireland amounted to £247 million (equivalent to 14 per cent of global food exports and 27 per cent of food exports to the EU). This was up by 26 per cent from the value in 2001 (Figure 9), driven largely by an increase in the total value of cereals, meat and vegetables & fruit exported (which rose by a combined £54.7 million). Sugars and coffee & tea contributed a further £13.3 million increase in total sales to the country. In contrast to meats, cereals and sugars the net mass of vegetables & fruit and coffee & tea exported to Ireland has fallen in the ten years to 2011. Nonetheless, amongst these commodities exported to Ireland, only the unit price4 for sugars fell between 2001 and 2011, with the unit price for coffee & tea experiencing the largest increase5.
4 The unit price has been estimated by dividing the total value of sales of a commodity by the weight. 5 Annex C provides further information of the unit price of food products exported from London to different countries in 2011.
0 0.25 0.5 0.75 1
EU
Eastern Europe
Asia and Oceania
Latin America & Caribbean
Middle East & N Africa
North America
Western Europe excl EU
Sub-Saharan Africa
Global total
00 - Live animals 01 - Meat & meat preparations 02 - Dairy products & birds' eggs
03 - Fish,crustaceans,molluscs & aq.inverts 04 - Cereals & cereal preparations 05 - Vegetables & fruit
06 - Sugar & honey 07 - Coffee, tea, cocoa & spices 09 - Miscellaneous edible products
11 - Beverages 41 - Animal oils & fats 42 - Fixed vegetable fats & oils
43 - Fats & oils, processed, & waxes
London's food exports
GLA Economics 12
Food exports to France were valued at £226.2 million in 2011, just over double their value in 2001, accounting for a quarter of London’s food exports to the EU. Seventy-five per cent of the total export value in 2011 was from beverages, and the growth in total export values of this commodity has largely driven the overall increase in London’s food exports to France seen in the last decade. Both the unit value and the net mass of beverage exports to France have seen an increase, with the value per tonne more than doubling since 2001.
In 2011, the Netherlands accounted for 6 per cent of London’s global food exports (or 11 per cent of food exports to the EU) with a total value of £100.4 million. This is a 52 per cent increase on the value in 2001 and the result of increased total value of exports of beverages and vegetables & fruits, which rose by £38.8 million and £14.6 million respectively. For beverages this rise was driven by the value per tonne (which went from £1,130 to £7,400 per tonne), as the net mass exported fell between 2001 and 2011.
Figure 8: Value of London’s food exports to top 10 EU countries, 2001-2011
Source: GLA Economics analysis of UK Trade Info, HMRC
0
100
200
300
2001 2002 2003 2004 2005 2006 2007 2008 2009 2010 2011
£ million
Irish Republic France Netherlands Germany Belgium
Italy Spain Sweden Denmark Czech Republic
London's food exports
GLA Economics 13
Figure 9: Value of London’s food exports by commodity to France, Irish Republic and Netherlands, 2001 and 2011
Source: GLA Economics analysis of UK Trade Info, HMRC
As previously mentioned, the value of food exports to Asia and Oceania has seen substantial growth over the last decade, whilst the relative importance of the North American market has declined. The growth in food exports to Asia & Oceania has been driven by exports of beverages to Hong Kong since 2007 (see Figure 10). Indeed the value of beverage exports to Hong Kong saw a 1,400 per cent rise from £13.3 million to £198.8 million between 2007- 2011. This drove an increase in the overall value of food exports to the country to £213.6 million (of which 93 per cent was beverages), making Hong Kong the third largest country destination (by value) for London food exports in 2011. Part of the increase in beverage exports to Hong Kong may have been driven by a change in law which saw duties on wine and beer halved in Hong Kong in 2007 (before a removal of alcohol duties, excluding spirits, in 2008). Indeed the volume of beverages sold to Hong Kong rose from 900 tonnes to 21.2 kilotonnes between 2008 and 2011, and the value per tonne of beverages increased by £42,000.
Food exports to North America are dominated by exports to the United States, which comprised 59 per cent (£125.5 million) of food exports to the region in 2011 (and 7 per cent of the total value of London’s global food exports), although this is down from 80 per cent in 2001 (£144.8 million). On the other hand, the value of food exports to Canada has risen fast so that its share of the total value of London’s food exports to North America has gone from 18 per cent in 2001 (or £32.5 million) to 39 per cent in 2011 (or £82.3 million). These changes have largely been driven by changes in sales of exports of coffee, tea, cocoa and spices. For the US, although the unit price of coffee and tea rose between 2001 and 2011 the volume (or, more accurately weight) exported fell significantly. For Canada, both the weight and the unit price of coffee and tea exports rose.

London's food exports
GLA Economics 14
Figure 10: Food exports from London to countries in Asia & Oceania
Source: UK Trade Info, HMRC
0
50,000
100,000
150,000
200,000
250,000
0
20,000
40,000
60,000
2001 2002 2003 2004 2005 2006 2007 2008 2009 2010 2011
£000s£000s
Australia China India IndonesiaJapan New Zealand Other Asia and Oceania PakistanPhilippines Singapore South Korea TaiwanThailand Honk Kong excl beverages Hong Kong (RHS)

London's food exports
GLA Economics 15
Annex A: Breakdown of countries within global regions, 2001-2011
Asia and Oceania Eastern Europe EU Latin America and Caribbean Middle East and N Africa North America Sub-Saharan Africa Western Europe exc EUAustralia Croatia Austria Argentina Algeria Canada Angola Iceland
China Other Eastern Europe Belgium Barbados Bahrain Mexico Botswana NorwayHong Kong Russia Bulgaria Brazil Egypt Other North America (incl Puerto Rico) Cameroon Other Western Europe
India Ukraine Cyprus Chile Iran United States Ethiopia SwitzerlandIndonesia Czech Republic Colombia Israel Ghana Turkey
Japan Denmark Costa Rica Jordan Ivory CoastNew Zealand Estonia Dominican Rep Kuwait Kenya
Other Asia and Oceania Finland Ecuador Lebanon MauritiusPakistan France Guyana Libya Namibia
Philippines Germany Jamaica Morocco NigeriaSingapore Greece Other Latin America and the Caribbean Oman Other Sub-Saharan Africa
South Korea Hungary Panama Other Middle East and North Africa South AfricaTaiwan Irish Republic Trinidad:Tobago Qatar Tanzania
Thailand Italy Uruguay Saudi Arabia ZimbabweLatvia Venezuela Syria
Lithuania TunisiaLuxembourg Uae
MaltaNetherlands
PolandPortugalRomaniaSlovakiaSlovenia
SpainSweden

London's food exports
GLA Economics 16
Annex B: Analysis of destination of London’s top food exports since 2001
In 2011, exports of beverages, cereals, vegetables & fruit and coffee & tea made up 77 per cent of the total value of London’s food exports, equivalent to £1.37 billion. A further 13 per cent came from exports of sugar & honey and miscellaneous edible products (which broadly includes margarine, sauces, mixed condiments & seasonings, vinegar, soups, pasta, yeast and preparation for infant use). The trend in London’s exports of these products are analysed further below.
Beverages Between 2001 and 2011 the value of beverage exports from London doubled to £821.4 million. As a result, while 38 per cent of the value of all food exports was beverages in 2001 this had risen to 46 per cent in 2011. Some of the increase in the total value of beverage exports was due to an increase in sales volumes (from 176.0 kilotonnes in 2001 to 210.5 kilotonnes in 2011), but there was also an increase in the unit weight of sales (from £2,300 per tonne in 2001 to £3,900 in 2011).
In 2001 the US was the top destination for beverage exports (in total value terms) but by 2011 it had been overtaken by Hong Kong and France (Figure B1). These trends are broadly reflected in the regional distribution of London’s beverage exports, although the total value of exports to the EU is partly exacerbated by the relative number of large countries within it (Figure B2). Up until 2007 the volume of beverage exports to the EU had seen a large rise resulting in the increase in the total value of exports seen. Since then, however, the total value has been driven by higher unit prices. In contrast, the total value of beverage exports to North America has been driven by increases in the volumes exported.
Figure B1: Top 10 countries based on total value of beverage exports from London and corresponding volume of exports, 2001-2011
Source: GLA Economics analysis of UK Trade Info, HMRC
0
50,000
100,000
150,000
200,000
2001 2002 2003 2004 2005 2006 2007 2008 2009 2010 2011
£000s
Hong Kong France United States Netherlands BelgiumSingapore Irish Republic Spain Canada Japan
0
20,000
40,000
60,000
80,000
100,000
2001 2002 2003 2004 2005 2006 2007 2008 2009 2010 2011
tonnes
Hong Kong France United States Netherlands BelgiumSingapore Irish Republic Spain Canada Japan

London's food exports
GLA Economics 17
Figure B2: Value and volume of beverage exports from London by region, 2001-2011
Source: GLA Economics analysis of UK Trade Info, HMRC
Cereals and cereal preparations In 2011, cereals made up 12 per cent of the total value of London’s food exports (making it the second most valuable food export to London after beverages), although this is down from 16 per cent in 2001. Despite this fall in share, the value of cereal exports has risen by £44.2 million to £214.2 million in 2011. Exports of cereals, by total value, are dominated by Ireland (Figure B3), a trend which has strengthened since 2001 (in 2001, 29 per cent of the value of export cereals went to Ireland but by 2011 this had risen to 35 per cent). Excluding 2002 and 2003 (when there an unexplained one-off increase in the volume of cereal exports to the US and Italy respectively), the Irish Republic also imports the greatest volume of cereals from London.
As might be expected given the size of London’s cereal exports to Ireland, the EU is, and has been, by some margin the top regional destination (by total value and volume) for cereals exported from London (Figure B4).
Figure B3: Top 10 countries based on total value of cereal and cereal preparations exports from London and corresponding volume of exports, 2001-2011
Note: The 2003 estimates for Italy appear to be an outlier for which we have been unable to find an explanation. This estimate should, therefore, be treated with caution. Source: GLA Economics analysis of UK Trade Info, HMRC
0
100,000
200,000
300,000
400,000
2001 2002 2003 2004 2005 2006 2007 2008 2009 2010 2011
£000s
EU Eastern Europe Asia and Oceania Latin America & Caribbean
Middle East & N Africa North America Western Europe excl EU Sub-Saharan Africa
0
40,000
80,000
120,000
160,000
200,000
2001 2002 2003 2004 2005 2006 2007 2008 2009 2010 2011
tonnes
EU Eastern Europe Asia and Oceania Latin America & Caribbean
Middle East & N Africa North America Western Europe excl EU Sub-Saharan Africa
0
20,000
40,000
60,000
80,000
2001 2002 2003 2004 2005 2006 2007 2008 2009 2010 2011
£000s
Irish Republic France United States Uae Italy
Denmark Belgium Netherlands Australia Germany
0
20,000
40,000
60,000
80,000
100,000
120,000
140,000
2001 2002 2003 2004 2005 2006 2007 2008 2009 2010 2011
tonnes
Irish Republic France United States Uae Italy
Denmark Belgium Netherlands Australia Germany
London's food exports
GLA Economics 18
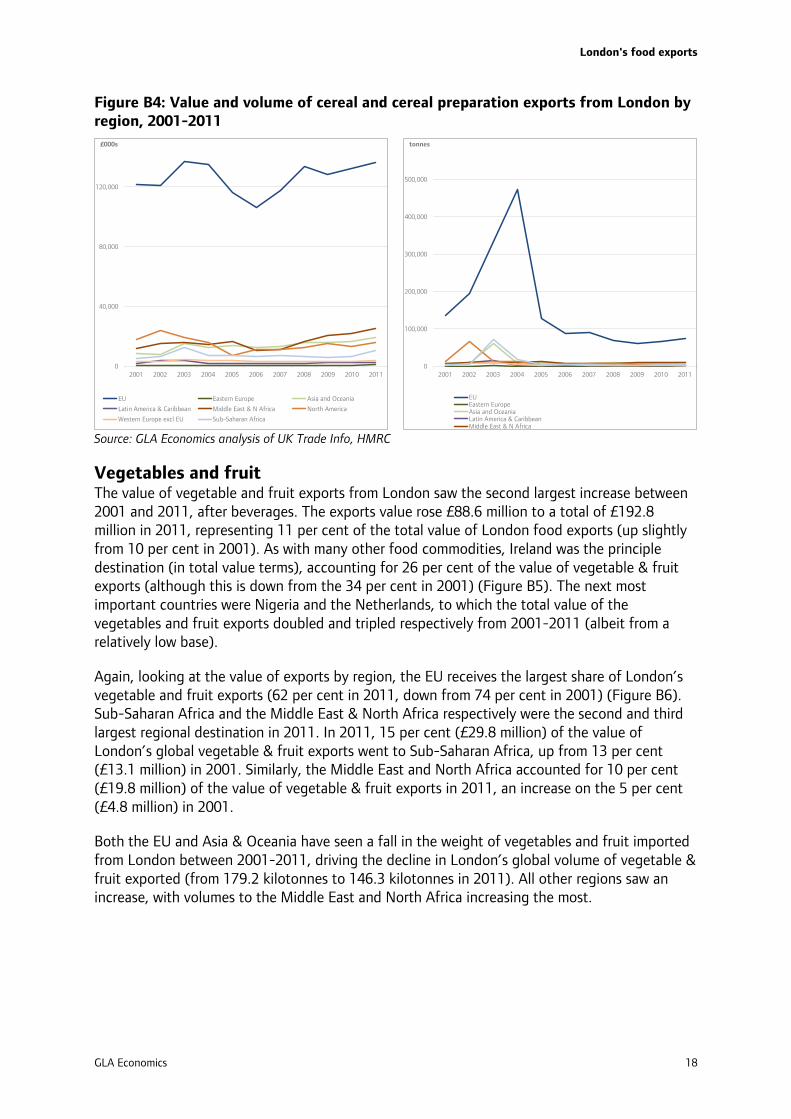
Figure B4: Value and volume of cereal and cereal preparation exports from London by region, 2001-2011
Source: GLA Economics analysis of UK Trade Info, HMRC
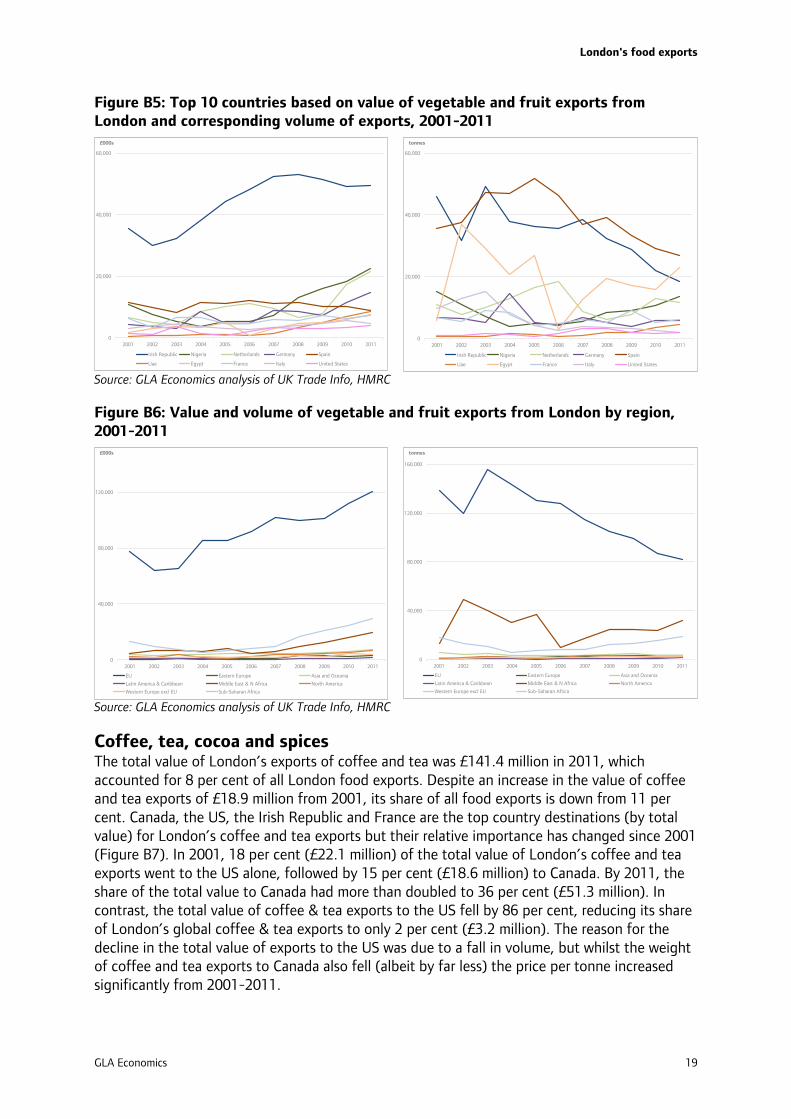
Vegetables and fruit The value of vegetable and fruit exports from London saw the second largest increase between 2001 and 2011, after beverages. The exports value rose £88.6 million to a total of £192.8 million in 2011, representing 11 per cent of the total value of London food exports (up slightly from 10 per cent in 2001). As with many other food commodities, Ireland was the principle destination (in total value terms), accounting for 26 per cent of the value of vegetable & fruit exports (although this is down from the 34 per cent in 2001) (Figure B5). The next most important countries were Nigeria and the Netherlands, to which the total value of the vegetables and fruit exports doubled and tripled respectively from 2001-2011 (albeit from a relatively low base).
Again, looking at the value of exports by region, the EU receives the largest share of London’s vegetable and fruit exports (62 per cent in 2011, down from 74 per cent in 2001) (Figure B6). Sub-Saharan Africa and the Middle East & North Africa respectively were the second and third largest regional destination in 2011. In 2011, 15 per cent (£29.8 million) of the value of London’s global vegetable & fruit exports went to Sub-Saharan Africa, up from 13 per cent (£13.1 million) in 2001. Similarly, the Middle East and North Africa accounted for 10 per cent (£19.8 million) of the value of vegetable & fruit exports in 2011, an increase on the 5 per cent (£4.8 million) in 2001.
Both the EU and Asia & Oceania have seen a fall in the weight of vegetables and fruit imported from London between 2001-2011, driving the decline in London’s global volume of vegetable & fruit exported (from 179.2 kilotonnes to 146.3 kilotonnes in 2011). All other regions saw an increase, with volumes to the Middle East and North Africa increasing the most.
0
40,000
80,000
120,000
2001 2002 2003 2004 2005 2006 2007 2008 2009 2010 2011
£000s
EU Eastern Europe Asia and Oceania
Latin America & Caribbean Middle East & N Africa North America
Western Europe excl EU Sub-Saharan Africa
0
100,000
200,000
300,000
400,000
500,000
2001 2002 2003 2004 2005 2006 2007 2008 2009 2010 2011
tonnes
EUEastern EuropeAsia and OceaniaLatin America & CaribbeanMiddle East & N Africa
London's food exports
GLA Economics 19
Figure B5: Top 10 countries based on value of vegetable and fruit exports from London and corresponding volume of exports, 2001-2011
Source: GLA Economics analysis of UK Trade Info, HMRC
Figure B6: Value and volume of vegetable and fruit exports from London by region, 2001-2011
Source: GLA Economics analysis of UK Trade Info, HMRC
Coffee, tea, cocoa and spices The total value of London’s exports of coffee and tea was £141.4 million in 2011, which accounted for 8 per cent of all London food exports. Despite an increase in the value of coffee and tea exports of £18.9 million from 2001, its share of all food exports is down from 11 per cent. Canada, the US, the Irish Republic and France are the top country destinations (by total value) for London’s coffee and tea exports but their relative importance has changed since 2001 (Figure B7). In 2001, 18 per cent (£22.1 million) of the total value of London’s coffee and tea exports went to the US alone, followed by 15 per cent (£18.6 million) to Canada. By 2011, the share of the total value to Canada had more than doubled to 36 per cent (£51.3 million). In contrast, the total value of coffee & tea exports to the US fell by 86 per cent, reducing its share of London’s global coffee & tea exports to only 2 per cent (£3.2 million). The reason for the decline in the total value of exports to the US was due to a fall in volume, but whilst the weight of coffee and tea exports to Canada also fell (albeit by far less) the price per tonne increased significantly from 2001-2011.
0
20,000
40,000
60,000
2001 2002 2003 2004 2005 2006 2007 2008 2009 2010 2011
£000s
Irish Republic Nigeria Netherlands Germany Spain
Uae Egypt France Italy United States
0
20,000
40,000
60,000
2001 2002 2003 2004 2005 2006 2007 2008 2009 2010 2011
tonnes
Irish Republic Nigeria Netherlands Germany Spain
Uae Egypt France Italy United States
0
40,000
80,000
120,000
2001 2002 2003 2004 2005 2006 2007 2008 2009 2010 2011
£000s
EU Eastern Europe Asia and Oceania
Latin America & Caribbean Middle East & N Africa North America
Western Europe excl EU Sub-Saharan Africa
0
40,000
80,000
120,000
160,000
2001 2002 2003 2004 2005 2006 2007 2008 2009 2010 2011
tonnes
EU Eastern Europe Asia and Oceania
Latin America & Caribbean Middle East & N Africa North America
Western Europe excl EU Sub-Saharan Africa

London's food exports
GLA Economics 20
Although Canada is the single largest country destination, by value, for London’s coffee and tea exports, countries in the EU (combined) also account for a large share of the value of coffee and tea exports. As such, both North America and the EU dominate the regional destination for London’s coffee and tea exports (Figure B8); North America and the EU accounted for 74 per cent and 82 per cent of the total value of London’s coffee and tea exports in 2001 and 2011 respectively. Together, the two regions have also retained a 79 per cent share of the volume of coffee and tea exports from London, despite large falls in the volume of these goods exported to the EU and North America.
Figure B7: Top 10 countries based on value of coffee, tea, cocoa & spices exports from London and corresponding volume of exports, 2001-2011
Source: GLA Economics analysis of UK Trade Info, HMRC.
Figure B8: Value and volume of coffee, tea, cocoa & spices exports from London by region, 2001-2011
Source: GLA Economics analysis of UK Trade Info, HMRC
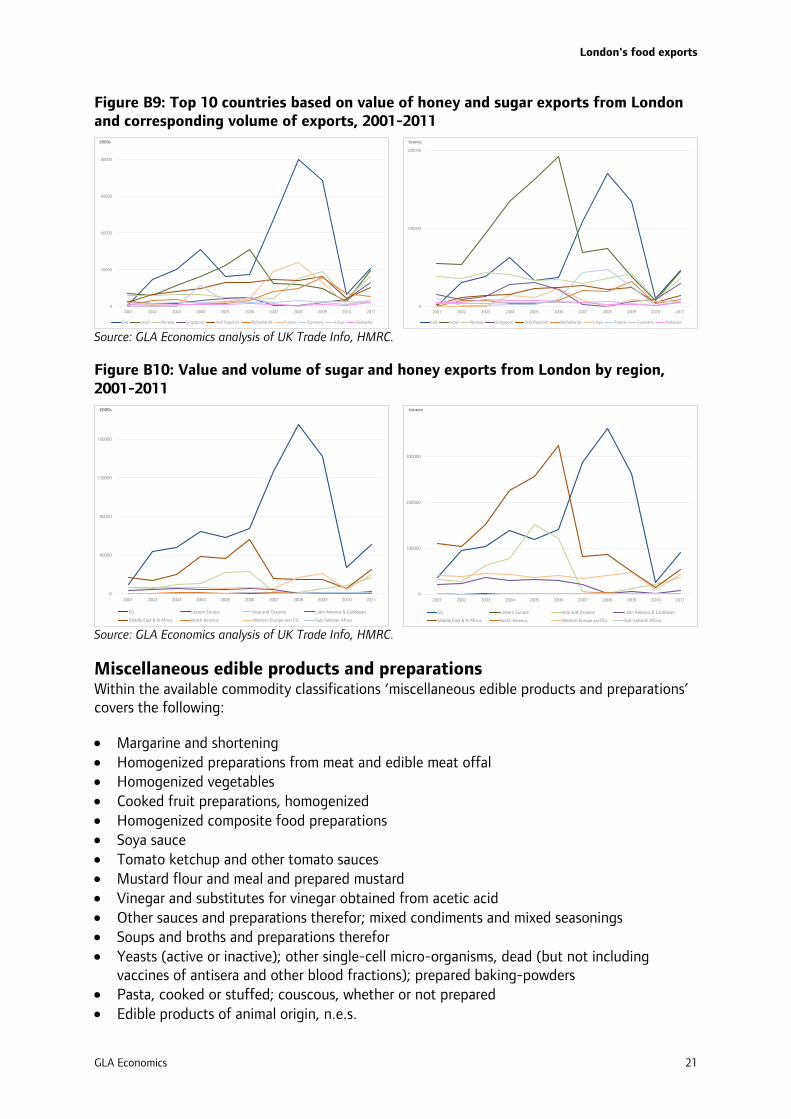
Sugar and honey The value of London’s sugar and honey exports has more than doubled from £45.8 million in 2001 to £120.2 million in 2011. As a result, its share of the value of all London’s food exports has increased from 4 per cent in 2001 to 7 per cent in 2011. Much of this growth was driven by exports to the EU, and in particular Italy, Ireland and Netherlands, to which the total value of these exports grew by £32.4 million (Figure B9). However, as Figure B9 shows, much of this increase in total value is the result of an increase in the volume exported to these countries. The regional pattern in the total value of sugar and honey exports from London follows a similar trend, whereby the total value of exports is driven by the volume of sales to regions, although the value per tonne to regions has also increased (Figure B10).
0
20000
40000
60000
2001 2002 2003 2004 2005 2006 2007 2008 2009 2010 2011
£000s
Canada Irish Republic France Germany Sweden
Uae United States Italy Netherlands Czech Republic
0
5000
10000
15000
20000
2001 2002 2003 2004 2005 2006 2007 2008 2009 2010 2011
tonnes
Canada Irish Republic France Germany Sweden Uae United States Italy Czech Republic
0
20,000
40,000
60,000
2001 2002 2003 2004 2005 2006 2007 2008 2009 2010 2011
£000s
EU Eastern Europe Asia and Oceania Latin America & Caribbean
Middle East & N Africa North America Western Europe excl EU Sub-Saharan Africa
0
5,000
10,000
15,000
20,000
25,000
30,000
2001 2002 2003 2004 2005 2006 2007 2008 2009 2010 2011
tonnes
EU Eastern Europe Asia and Oceania Latin America & Caribbean
Middle East & N Africa North America Western Europe excl EU Sub-Saharan Africa
London's food exports
GLA Economics 21
Figure B9: Top 10 countries based on value of honey and sugar exports from London and corresponding volume of exports, 2001-2011
Source: GLA Economics analysis of UK Trade Info, HMRC.
Figure B10: Value and volume of sugar and honey exports from London by region, 2001-2011
Source: GLA Economics analysis of UK Trade Info, HMRC.
Miscellaneous edible products and preparations Within the available commodity classifications ‘miscellaneous edible products and preparations’ covers the following:
• Margarine and shortening • Homogenized preparations from meat and edible meat offal • Homogenized vegetables • Cooked fruit preparations, homogenized • Homogenized composite food preparations • Soya sauce • Tomato ketchup and other tomato sauces • Mustard flour and meal and prepared mustard • Vinegar and substitutes for vinegar obtained from acetic acid • Other sauces and preparations therefor; mixed condiments and mixed seasonings • Soups and broths and preparations therefor • Yeasts (active or inactive); other single-cell micro-organisms, dead (but not including
vaccines of antisera and other blood fractions); prepared baking-powders • Pasta, cooked or stuffed; couscous, whether or not prepared • Edible products of animal origin, n.e.s.
0
20000
40000
60000
80000
2001 2002 2003 2004 2005 2006 2007 2008 2009 2010 2011
£000s
Italy Israel Norway Singapore Irish Republic Netherlands France Germany Libya Barbados
0
100000
200000
2001 2002 2003 2004 2005 2006 2007 2008 2009 2010 2011
tonnes
Italy Israel Norway Singapore Irish Republic Netherlands Libya France Germany Barbados
0
40000
80000
120000
160000
2001 2002 2003 2004 2005 2006 2007 2008 2009 2010 2011
£000s
EU Eastern Europe Asia and Oceania Latin America & Caribbean
Middle East & N Africa North America Western Europe excl EU Sub-Saharan Africa
0
100000
200000
300000
2001 2002 2003 2004 2005 2006 2007 2008 2009 2010 2011
tonnes
EU Eastern Europe Asia and Oceania Latin America & Caribbean
Middle East & N Africa North America Western Europe excl EU Sub-Saharan Africa
London's food exports
GLA Economics 22
• Food preparations for infant use, put up for retail sale, of flour, meal, starch or malt extract (not containing cocoa powder or containing cocoa powder in a proportion by weight of less than 50%) or of goods of milk and cream and milk products (other than butter or cheese), excluding ice-cream and other edible ice (not containing cocoa powder or containing cocoa powder in a proportion by weight of less than 10%), n.e.s.
• Malt extract; food preparations of flour, meal, starch or malt extract (not containing cocoa powder or containing cocoa powder in a proportion by weight of less than 50%), n.e.s., or of goods of goods of milk and cream and milk products (other than butter or cheese and excluding ice-cream and other edible ice) and whey or products consisting of natural milk constituents n.e.s. (not containing cocoa powder or containing cocoa powder in a proportion by weight of less than 10%), n.e.s.
• Other food preparations.
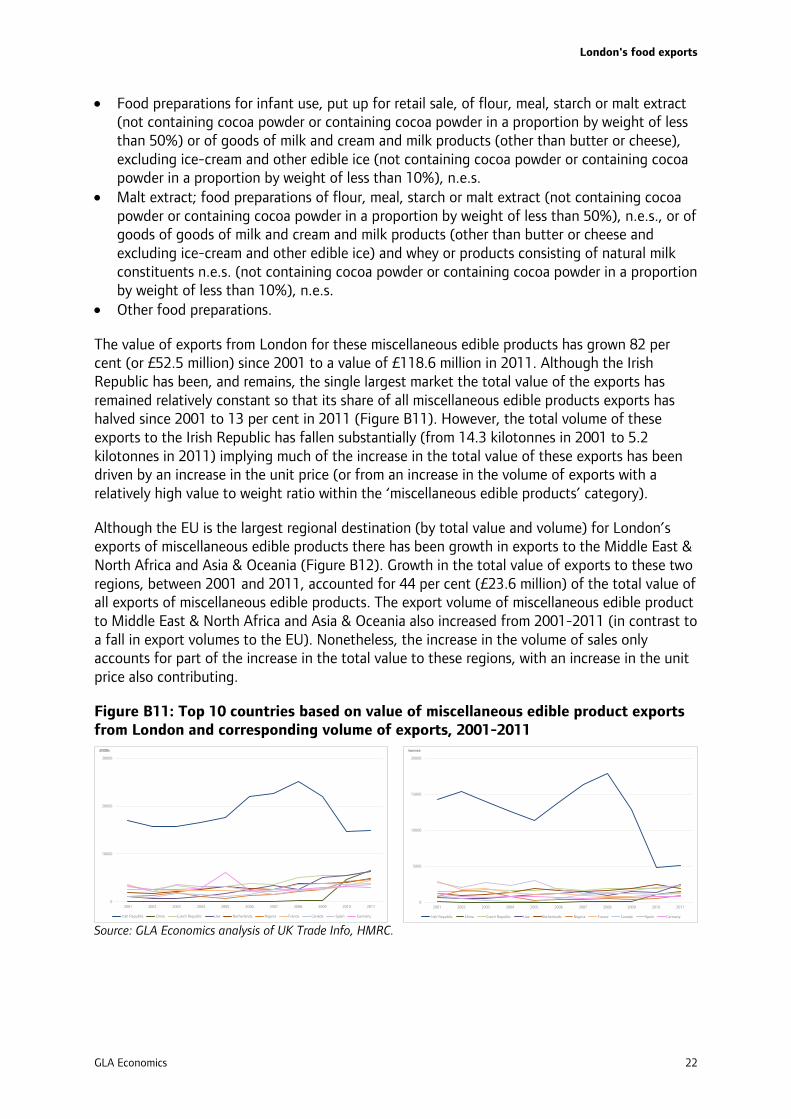
The value of exports from London for these miscellaneous edible products has grown 82 per cent (or £52.5 million) since 2001 to a value of £118.6 million in 2011. Although the Irish Republic has been, and remains, the single largest market the total value of the exports has remained relatively constant so that its share of all miscellaneous edible products exports has halved since 2001 to 13 per cent in 2011 (Figure B11). However, the total volume of these exports to the Irish Republic has fallen substantially (from 14.3 kilotonnes in 2001 to 5.2 kilotonnes in 2011) implying much of the increase in the total value of these exports has been driven by an increase in the unit price (or from an increase in the volume of exports with a relatively high value to weight ratio within the ‘miscellaneous edible products’ category).
Although the EU is the largest regional destination (by total value and volume) for London’s exports of miscellaneous edible products there has been growth in exports to the Middle East & North Africa and Asia & Oceania (Figure B12). Growth in the total value of exports to these two regions, between 2001 and 2011, accounted for 44 per cent (£23.6 million) of the total value of all exports of miscellaneous edible products. The export volume of miscellaneous edible product to Middle East & North Africa and Asia & Oceania also increased from 2001-2011 (in contrast to a fall in export volumes to the EU). Nonetheless, the increase in the volume of sales only accounts for part of the increase in the total value to these regions, with an increase in the unit price also contributing.
Figure B11: Top 10 countries based on value of miscellaneous edible product exports from London and corresponding volume of exports, 2001-2011
Source: GLA Economics analysis of UK Trade Info, HMRC.
0
10000
20000
30000
2001 2002 2003 2004 2005 2006 2007 2008 2009 2010 2011
£000s
Irish Republic China Czech Republic Uae Netherlands Nigeria France Canada Spain Germany
0
5000
10000
15000
20000
2001 2002 2003 2004 2005 2006 2007 2008 2009 2010 2011
tonnes
Irish Republic China Czech Republic Uae Netherlands Nigeria France Canada Spain Germany

London's food exports
GLA Economics 23
Figure B12: Value and volume of miscellaneous edible product exports from London by region, 2001-2011
Source: GLA Economics analysis of UK Trade Info, HMRC.
0
20000
40000
60000
2001 2002 2003 2004 2005 2006 2007 2008 2009 2010 2011
£000s
EU Eastern Europe Asia and Oceania Latin America & Caribbean
Middle East & N Africa North America Western Europe excl EU Sub-Saharan Africa
0
10000
20000
30000
40000
2001 2002 2003 2004 2005 2006 2007 2008 2009 2010 2011
tonnes
EU Eastern Europe Asia and Oceania Latin America & Caribbean
Middle East & N Africa North America Western Europe excl EU Sub-Saharan Africa

London's food exports
GLA Economics 24
Annex C: Top destinations for London’s food exports in 2011
Table C1 shows the top destinations, in terms of the export value in 2011, by country and region for food products from London. The Irish Republic dominates much of London’s food exports, representing 14 per cent of London’s global food exports by value. A further 13 per cent went to France, followed by 12 per cent and 7 per cent to Hong Kong and the US respectively.
Table C1: Top country and region destinations of London’s food exports by value, 2011
Source: GLA Economics analysis of UK Trade Info, HMRC.
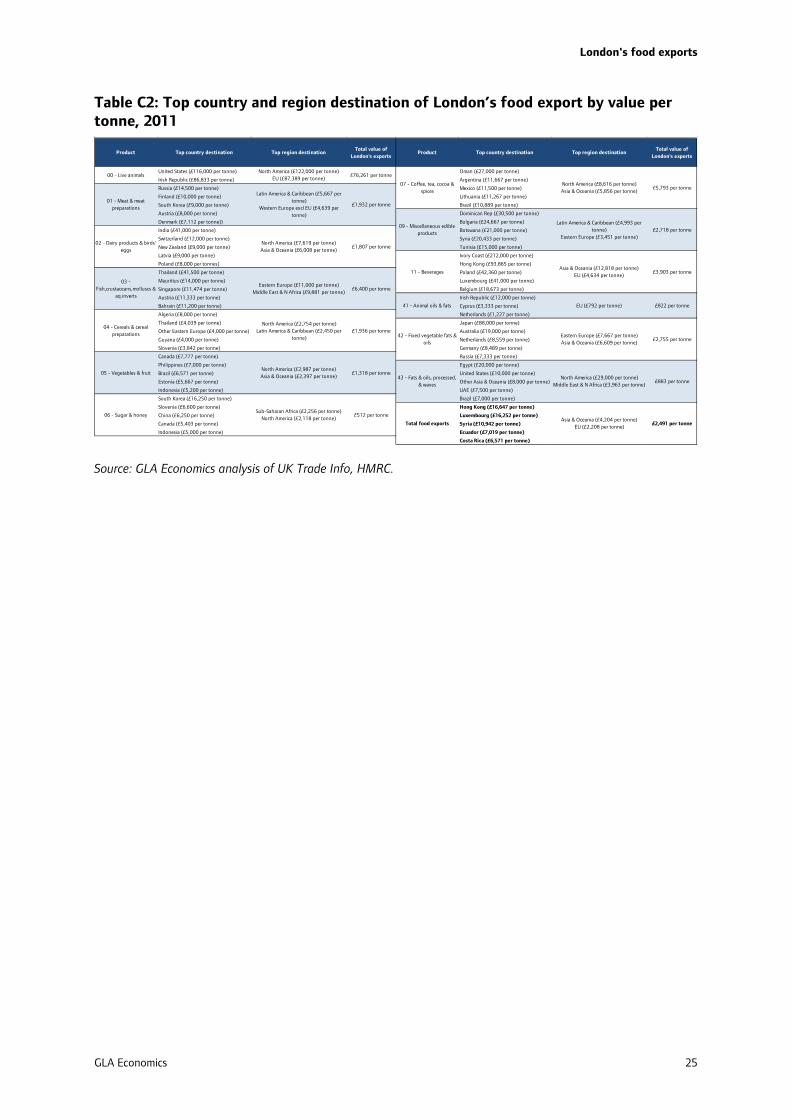
However, accounting for the volume of trade and, therefore, looking at the unit value (£ per tonne) of London’s food exports a very different trend emerges. In 2011 higher unit value food products were largely exported to non-EU countries (see Table C2). Nonetheless, the top country destinations for exports by value per tonne should be treated with some degree of caution, especially for commodities where export volumes and values are small and to countries where there are significant exchange rate fluctuations.
Product Top country destination Top region destinationTotal value of
London's exports
Product Top country destination Top region destinationTotal value of
London's exports
Irish Republic (£1.6 million) Canada (£51.3 million)
United States (£0.1 million) Irish Republic (£19.9)
Irish Republic (£30.0 million) France (£8.6 million)
France (£12.0 million) Germany (£4.5 million)
Netherlands (£9.3 million) Sweden (3.9 million)
Hong Kong (£5.5 million) Irish Republic (£15.0 million)
Germany (£3.8 million) China (£6.6 million)
Irish Republic (£10.0 million) Czech Republic (£6.3 million)
Belgium (£8.9 million) UAE (£6.2 million)
Germany (£8.9 million) Netherlands (£4.7 million)
France (£7.6 million) Hong Kong (£198.8 million)
Netherlands (£3.2 million) France (£166.8 million)
Irish Republic (£11.1 million) United States (£104.0 million)
Italy (£2.8 million) Netherlands (£46.0 million)
France (£2.0 million) Belgium (£35.1 million)
UAE (£1.6 million) Finland (£0.6 million)
Denmark (£1.2 million)
Irish Republic (£76.0 million) Irish Republic (£0.7 million)
France (£11.8 million) Germany (£0.4 million)
United States (£11.2 million) Spain (£0.3 million)
UAE (£10.6 million) Netherlands (£0.3 million)
Italy (£9.0 million) Italy (£0.3 million)
Irish Republic (£49.3 million) Norway (£16.9 million)
Nigeria (£22.6 million) China (£0.8 million)
Netherlands (£21.4 million) Netherlands (£0.6 million)
Germany (£14.8 million) Nigeria (£0.5 million)
Spain (£8.7 million) Germany (£0.4 million)
Italy (£20.4 million) Irish Republic (£246.6 million)
Israel (£19.7 million) France (£226.2 million)
Norway (£16.5 million) Hong Kong (£213.6 million)
Singapore (£12.8 million) United States (125.5 million)
Irish Republic (£10.1 million) Netherlands (£100.4 million)
£141.37 million
01 - Meat & meat preparations
EU (£68.3 million)Asia & Oceania (£6.6 million)
£80.13 million
09 - Miscellaneous edible products
00 - Live animalsEU (£1.6 million)North America (£0.1 million)
£1.75 million
07 - Coffee, tea, cocoa & spices
EU (£70.0 million)North America (£55.6 million)
EU (£51.1 million)Asia & Oceania (£17.7 million)
£118.61 million
02 - Dairy products & birds' eggs
EU (£41.4 million)Middle East & N Africa (£2.8 million)
£46.59 million
11 - BeveragesEU (356.9 million)Asia & Oceania (£282.7 million)
£821.35 million
03 - Fish,crustaceans,molluscs &
aq.inverts
EU (£21.9 million)Asia & Oceania (£2.2 million)
£26.65 million
41 - Animal oils & fatsEU (£0.7 million)North America (£0.02 million)
£0.74 million
04 - Cereals & cereal preparations
EU (£136.2 million)Middle East & N Africa (£25.3 million)
£214.22 million42 - Fixed vegetable fats &
oilsEU (£2.6 million)Asia & Oceania (£0.3 million)
£3.42 million
£1,788.60 million
05 - Vegetables & fruitEU (£120.5 million)Sub-Saharan Africa (£29.8 million)
£192.77 million43 - Fats & oils, processed,
& waxesWestern Europe excl EU (£16.9 million)Asia & Oceania (£1.6 million)
£20.82 million
06 - Sugar & honeyEU (£51.4 million)Middle East & N Africa (£25.5 million)
£120.18 million Total food exportsEU (£915 million)Asia & Oceania (£365 million)
London's food exports
GLA Economics 25
Table C2: Top country and region destination of London’s food export by value per tonne, 2011
Source: GLA Economics analysis of UK Trade Info, HMRC.
Product Top country destination Top region destinationTotal value of
London's exportsProduct Top country destination Top region destination
Total value of London's exports
United States (£116,000 per tonne) Oman (£27,000 per tonne)
Irish Republic (£86,833 per tonne) Argentina (£11,667 per tonne)
Russia (£14,500 per tonne) Mexico (£11,500 per tonne)
Finland (£10,000 per tonne) Lithuania (£11,267 per tonne)
South Korea (£9,000 per tonne) Brazil (£10,889 per tonne)
Austria (£8,000 per tonne) Dominican Rep (£30,500 per tonne)
Denmark (£7,112 per tonne)) Bulgaria (£24,667 per tonne)
India (£41,000 per tonne) Botswana (£21,000 per tonne)
Switzerland (£12,000 per tonne) Syria (£20,433 per tonne)
New Zealand (£9,000 per tonne) Tunisia (£15,000 per tonne)
Latvia (£9,000 per tonne) Ivory Coast (£212,000 per tonne)
Poland (£8,000 per tonnes) Hong Kong (£93,865 per tonne)
Thailand (£41,500 per tonne) Poland (£42,360 per tonne)
Mauritius (£14,000 per tonne) Luxembourg (£41,000 per tonne)
Singapore (£11,474 per tonne) Belgium (£18,673 per tonne)
Austria (£11,333 per tonne) Irish Republic (£12,000 per tonne)
Bahrain (£11,200 per tonne) Cyprus (£3,333 per tonne)
Algeria (£8,000 per tonne) Netherlands (£1,227 per tonne)
Thailand (£4,039 per tonne) Japan (£88,000 per tonne)
Other Eastern Europe (£4,000 per tonne) Australia (£19,000 per tonne)
Guyana (£4,000 per tonne) Netherlands (£8,559 per tonne)
Slovenia (£3,842 per tonne) Germany (£8,489 per tonne)
Canada (£7,777 per tonne) Russia (£7,333 per tonne)
Philippines (£7,000 per tonne) Egypt (£20,000 per tonne)
Brazil (£6,571 per tonne) United States (£10,000 per tonne)
Estonia (£5,667 per tonne) Other Asia & Oceania (£8,000 per tonne)
Indonesia (£5,200 per tonne) UAE (£7,500 per tonne)
South Korea (£16,250 per tonne) Brazil (£7,000 per tonne)
Slovenia (£6,600 per tonne) Hong Kong (£16,647 per tonne)
China (£6,250 per tonne) Luxembourg (£16,252 per tonne)
Canada (£5,403 per tonne) Syria (£10,942 per tonne)
Indonesia (£5,000 per tonne) Ecuador (£7,019 per tonne)
Costa Rica (£6,571 per tonne)
£5,793 per tonne
01 - Meat & meat preparations
Latin America & Caribbean (£5,667 per tonne)
Western Europe excl EU (£4,639 per tonne)
£1,932 per tonne
09 - Miscellaneous edible products
00 - Live animalsNorth America (£122,000 per tonne)
EU (£87,389 per tonne)£76,261 per tonne
07 - Coffee, tea, cocoa & spices
North America (£8,616 per tonne)Asia & Oceania (£5,856 per tonne)
Latin America & Caribbean (£4,993 per tonne)
Eastern Europe (£3,451 per tonne)£2,718 per tonne
02 - Dairy products & birds' eggs
North America (£7,619 per tonne)Asia & Oceania (£6,008 per tonne)
£1,807 per tonne
11 - BeveragesAsia & Oceania (£12,818 per tonne)
EU (£4,634 per tonne)£3,903 per tonne
03 - Fish,crustaceans,molluscs &
aq.inverts
Eastern Europe (£11,000 per tonne)Middle East & N Africa (£9,881 per tonne)
£6,400 per tonne
41 - Animal oils & fats EU (£792 per tonne) £822 per tonne
04 - Cereals & cereal preparations
North America (£2,754 per tonne)Latin America & Caribbean (£2,450 per
tonne)£1,936 per tonne
42 - Fixed vegetable fats & oils
Eastern Europe (£7,667 per tonne)Asia & Oceania (£6,609 per tonne)
£2,755 per tonne
Asia & Oceania (£4,204 per tonne)EU (£2,208 per tonne)
£2,491 per tonne
05 - Vegetables & fruitNorth America (£2,987 per tonne)Asia & Oceania (£2,397 per tonne)
£1,318 per tonne43 - Fats & oils, processed,
& waxesNorth America (£29,000 per tonne)
Middle East & N Africa (£3,963 per tonne)£883 per tonne
06 - Sugar & honeySub-Saharan Africa (£2,256 per tonne)
North America (£2,118 per tonne)£512 per tonne
Total food exports

Greater London Authority
City Hall The Queens Walk London SE1 2AA
Tel 020 7983 4922 Fax 020 7983 4674
Minicom 020 7983 4000 Email [email protected]
http://www.london.gov.uk/gla-economics-publications