Why go beyond indicators?
17
Genuine Progress Index for Atlantic Canada Indice de progrès véritable - Atlantique From Wellbeing Indicators to GPI Accounts Genuine Progress Institute Halifax, NS. 6 July, 2011
description
Genuine Progress Index for Atlantic Canada Indice de progrès véritable - Atlantique From Wellbeing Indicators to GPI Accounts Genuine Progress Institute Halifax, NS. 6 July, 2011. Why go beyond indicators?. Good indicator work of past years lays necessary ground. But is that enough? - PowerPoint PPT Presentation
Transcript of Why go beyond indicators?

Genuine Progress Index for Atlantic CanadaIndice de progrès véritable - Atlantique
From Wellbeing Indicators to GPI
Accounts
Genuine Progress InstituteHalifax, NS. 6 July, 2011

Why go beyond indicators?
• Good indicator work of past years lays necessary ground. But is that enough?
• The side streets and the highway
• GDP is not an indicator, but an accounting system. To challenge its power and dominance, we must enter the world of economic valuation
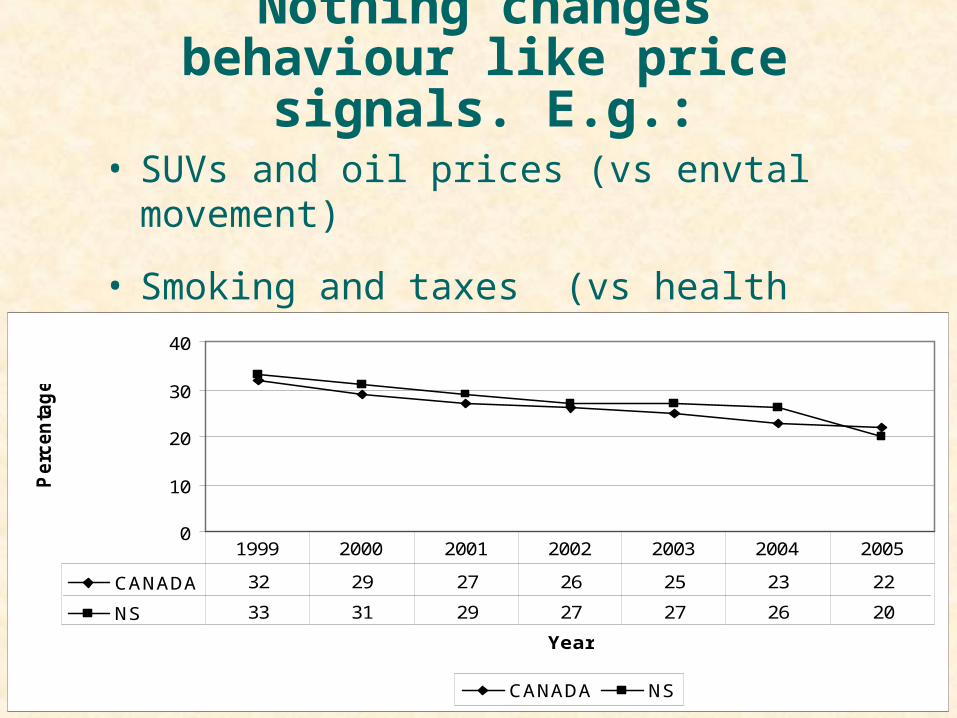
Nothing changes behaviour like price
signals. E.g.:• SUVs and oil prices (vs envtal
movement)
• Smoking and taxes (vs health messages) – youth smokers 15-24, 1999-2005
0
10
20
30
40
Year
Perc
en
tag
e
CANADA NS
CANADA 32 29 27 26 25 23 22
NS 33 31 29 27 27 26 20
1999 2000 2001 2002 2003 2004 2005

Till we take aim at perverse messages of existing
accounting system, nothing will change
• A/c GDP-based accounting: The more fossil fuels we burn, more trees we cut, the better off we are
• Losses out of sight, out of mind: Local farms, cod, forests, voluntary work, free time (unmeasured)
• 2008-09 economic crisis: Consensus on “injection” of “fiscal stimulus” to spur spending and growth. By contrast, recession, reduced consumption = R & R for natural world – dare we say “less may sometimes be better”?

Fishery GDP for Nova Scotia, 1984-1999 (1997$ millions):
Depletion of Natural Wealth as Economic Gain
NS Fishery GDP
0
100
200
300
400
1984
1987
1990
1993
1996
1999
Year
Mill
ions
of 1
997$
0
100
200
300
400
500
600
1970 1975 1980 1985 1990 1995 2000 2005
Year
Mil
lion
s of
$
NS
Linear (NS)
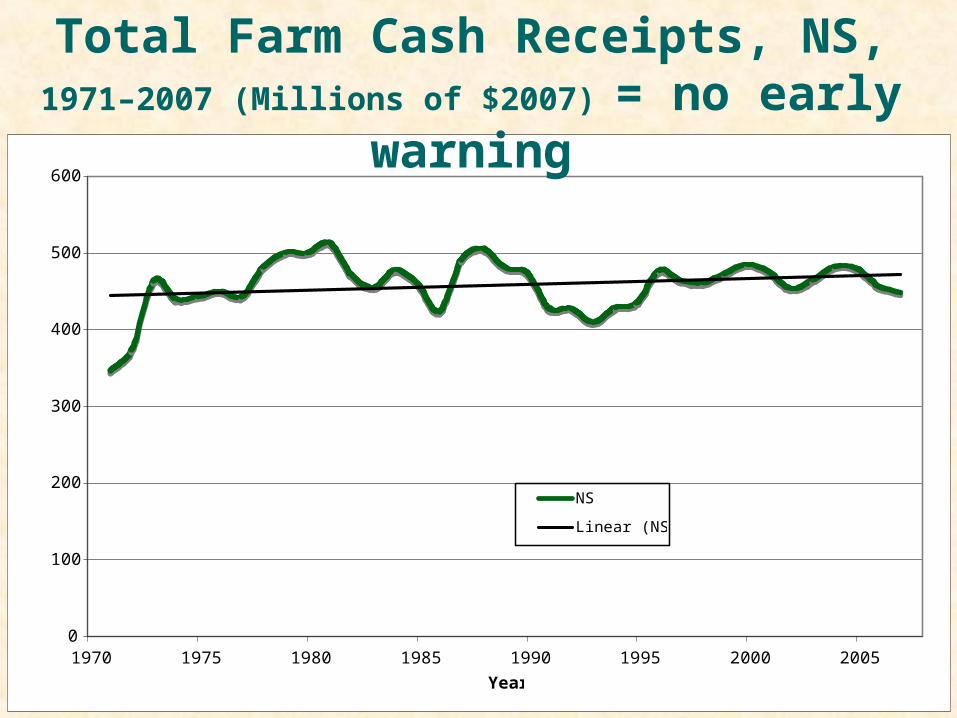
Total Farm Cash Receipts, NS, 1971–2007
(Millions of $2007) = no early warning

50
55
60
65
70
75
80
85
90
95
100
105
110
1970 1975 1980 1985 1990 1995 2000 2005
Year
Ex
pen
se t
o I
nco
me
Ra
io (
%)
NS Expense to Income Ratio
Linear (NS Expense to Income Ratio)
//
Expense to Income Ratio (%), Nova Scotia Farms, 1971–2006
-30
-20
-10
0
10
20
30
40
50
60
70
80
90
100
110
120
130
140
1970 1975 1980 1985 1990 1995 2000 2005
Year
Mill
ions
of
$
NS Farms
Linear (NS Farms)
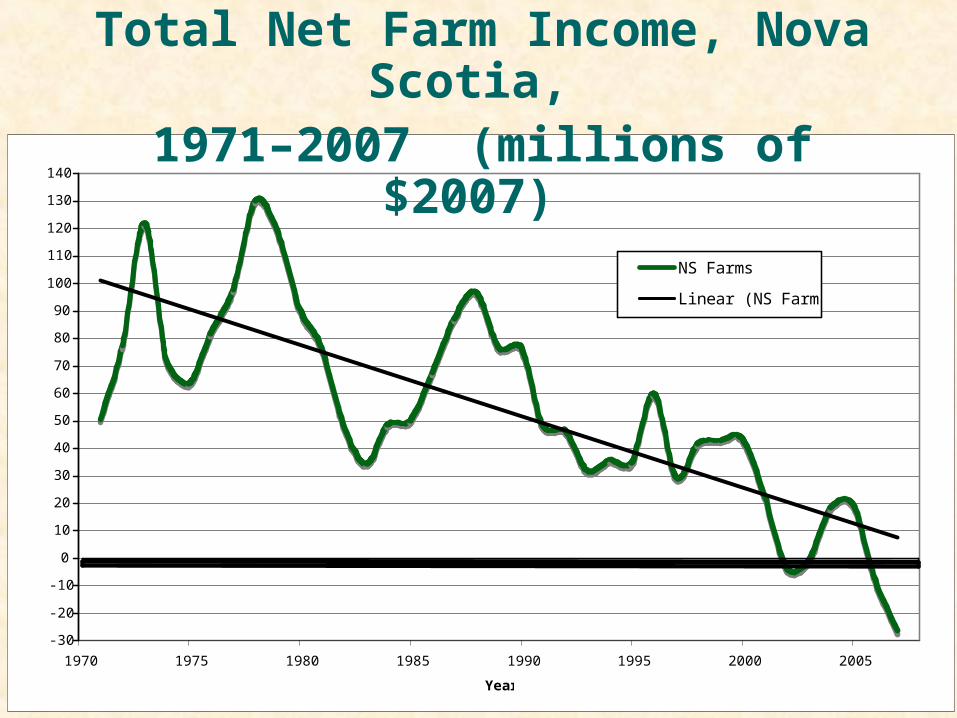
Total Net Farm Income, Nova Scotia, 1971–2007 (millions of $2007)

Total Net Farm Income and Total Debt, NS Farms, 1971-
2006 (millions of $2007)

Indicators and Accounts
• Indicators assess progress – based on physical measures (e.g. crime rates, GHG emissions).
• Accounts assess value:
- Balance sheets, stocks = assets and liabilities
- Flows = what we earn and spend. GPI accounts, unlike GDP, include costs of economic activity, crime, GHG emissions, resource extraction
• GDP assesses only market flows, treats social and environmental costs/benefits as “externalities.”

Accounting/valuation examples:
• Trends in volunteerism = indicator. Volunteer work contributes $1.8 billion to NS economy = accounts
• Crime costs NS $700 million + / year
• Smoking costs NS health care $171 million / year
• Stern (WB-UK): Compared GHG control costs (1% global GDP) with climate change damage costs (5%-20% global GDP). Concluded: "The benefits of strong, early action on climate change outweigh the costs.”

The Capital Accounting Model
• To assess nation’s true wealth, need to measure the value of natural, human, social, cultural, built, and financial capital.
• Only the latter two are currently valued but all capital is subject to depreciation and requires periodic re-investment. E.g. forests, health, crime, language, voluntary decline (vs car sector bailout)
• The good news – we are able to measure and even quantify aspects of the other capitals
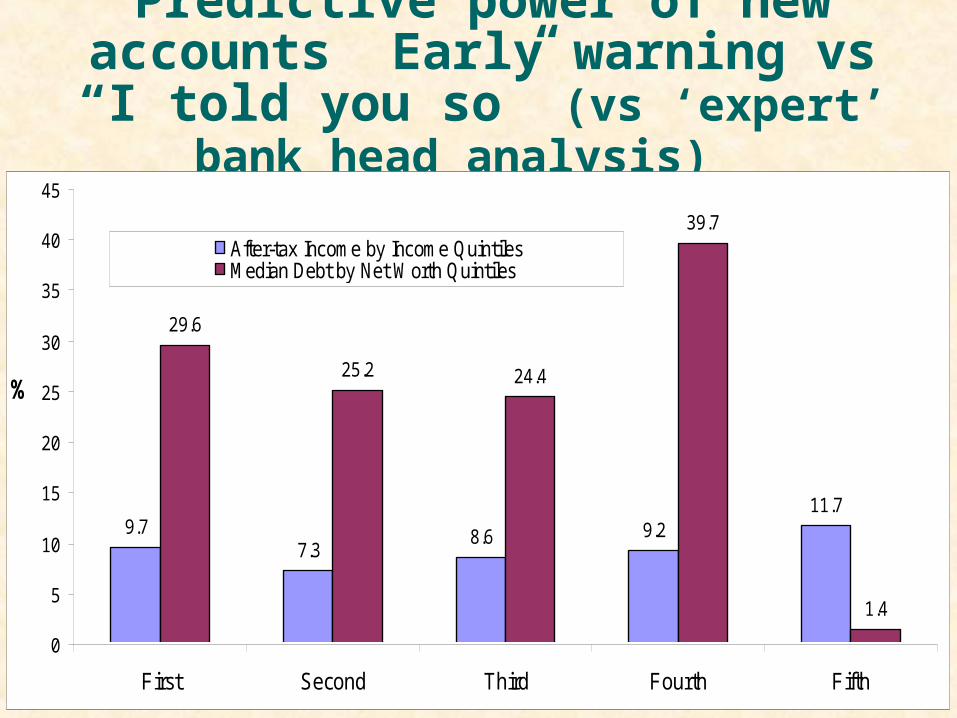
Predictive power of new accounts Early warning vs “I told you so” (vs ‘expert’ bank
head analysis)
9.77.3
8.6 9.211.7
29.6
25.2 24.4
39.7
1.4
0
5
10
15
20
25
30
35
40
45
First Second Third Fourth Fifth
%
After-tax Income by Income QuintilesMedian Debt by Net Worth Quintiles

Examples of policy impacts:
• NS voluntary work worth $1.8 billion/year -> Premier
• Preventable chronic disease costs NS $500m in excess health care costs –> DHPP
• Costs tobacco, obesity, inactivity –> e.g. HRM planning process; smoke-free legislation
• Full CBAs – e.g. Solid Waste; Halifax Harbour cleanup; HRM transportation
Caveat: New GNH accounts do not seek to replace GDP
• … But replace the misuse of GDP as a measure of progress, wellbeing, and prosperity: Cite Kuznets warnings on proper use of GDP – what is growing
• Anything can make economic grow, incl. depletion of natural wealth + activities that signify decline in wellbeing, prosperity (e.g. crime, crashes, pollution)
• Quantitative measure of size cannot assess quality of life, though GDP will always have role in assessing size of market economy – less important
Measuring what we value through indicators and
accounts to leave a sustainable and
prosperous Nova Scotia for our children

Genuine Progress Index for Atlantic CanadaIndice de progrès véritable - Atlantique
www.gpiatlantic.org