WHY FUNCTION POINT COUNTS COMPLY WITH BENFORD'S LAW … Proceedings/ISMA4-2009/ISMA2009-30... ·...
27
WHY FUNCTION POINT COUNTS COMPLY WITH BENFORD’S LAW Charley Tichenor, Ph.D., Defense Security Cooperation Agency 201 12 th St. South Arlington, VA 22202 703-901-3033 Bobby Davis, Ph.D. Florida A&M University School of Business and Industry 2400 Wahnish Way Tallahassee, FL 32307 1
Transcript of WHY FUNCTION POINT COUNTS COMPLY WITH BENFORD'S LAW … Proceedings/ISMA4-2009/ISMA2009-30... ·...

WHY FUNCTION POINT COUNTS COMPLY WITH BENFORD’S LAW
Charley Tichenor, Ph.D., Defense Security Cooperation Agency201 12th St. SouthArlington, VA 22202703-901-3033
Bobby Davis, Ph.D.Florida A&M UniversitySchool of Business and Industry2400 Wahnish WayTallahassee, FL 32307
1

Why Function Point Counts Comply with Benford’s Law
PRESENTATION OVERVIEW
Introduction
Review of the Related Literature
Research Design and Methodology
Presentation and Analysis of Data
Conclusions
References
2

Why Function Point Counts Comply with Benford’s Law
INTRODUCTION
Benford’s Law is a very unusual and counterintuitive mathematical phenomena. The purpose of this presentation is to answer the question “Why does Benford’s Law work?” and to show how it relates to function point counting.
Benford’s Law can be used to test the quality of a portfolio of function point counts. It can also be used to indicate the degree of soundness of the function point structure in itself.
3
Why Function Point Counts Comply with Benford’s Law
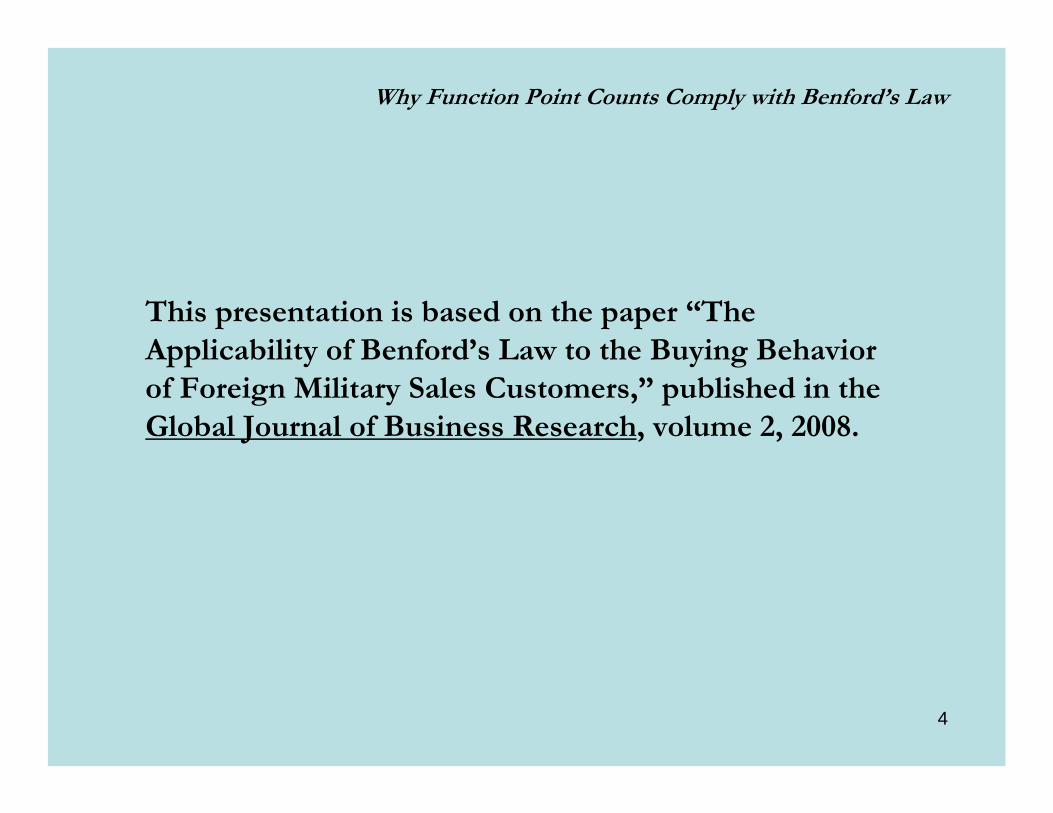
This presentation is based on the paper “The Applicability of Benford’s Law to the Buying Behavior of Foreign Military Sales Customers,” published in the Global Journal of Business Research, volume 2, 2008.
4

Why Function Point Counts Comply with Benford’s Law
REVIEW OF THE RELATED LITERATURE
Benford’s Law is an initially counterintuitive mathematical phenomena. A good application is in software sizing.
• Sample a statistically large set of function point counts (n is large).
• List the values of all of the counts.
• Don’t examine the value of each count -- just examine the first digit of each value.
• Determine the percentage of the time each first digit value from 1 to 9 appears.
5
Why Function Point Counts Comply with Benford’s Law
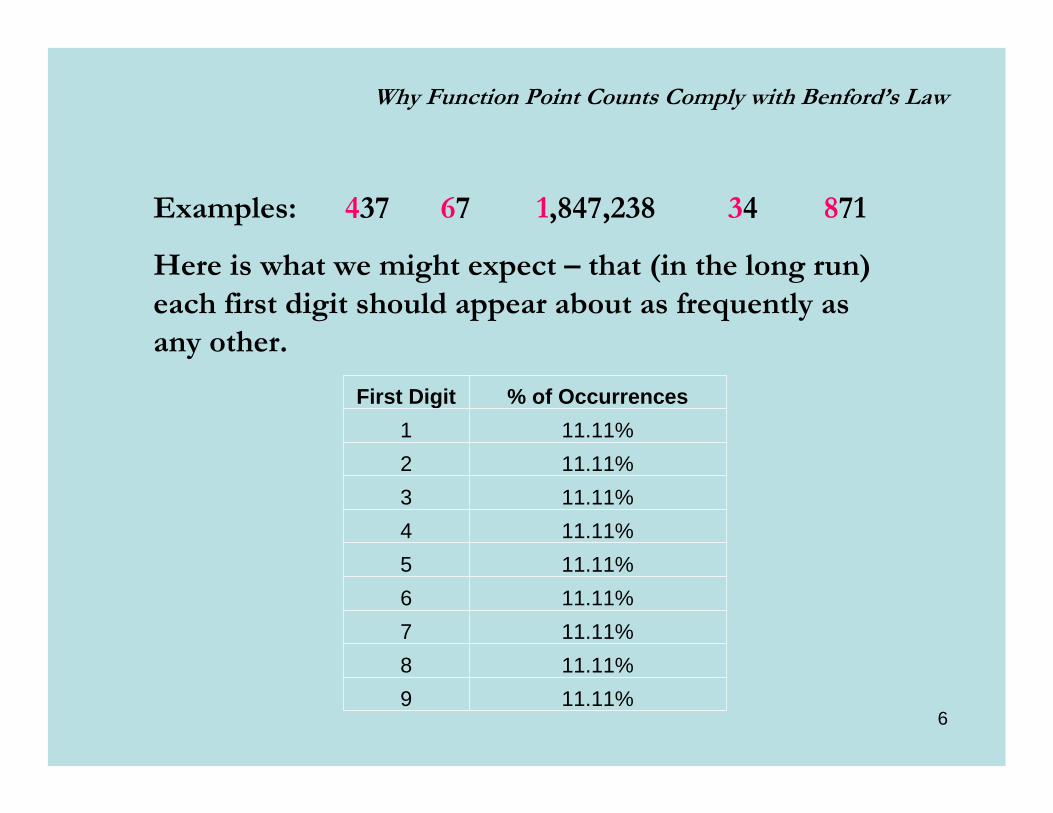
Examples: 437 67 1,847,238 34 871
Here is what we might expect – that (in the long run) each first digit should appear about as frequently as any other.
First Digit % of Occurrences1 11.11%2 11.11%3 11.11%4 11.11%5 11.11%6 11.11%7 11.11%8 11.11%9 11.11%
6
Why Function Point Counts Comply with Benford’s Law
In 1938, Frank A. Benford of GE tested this expectation by looking at the first digits of 20 lists of numbers with a total of 20,229 observations. His lists came from varied sources, such as geographic, scientific, and demographic data. One list contained all the numbers in an issue of Reader's Digest. (Nigrini 1999).
Here is what he found. (It may not be what you’d expect.)
7
Why Function Point Counts Comply with Benford’s Law
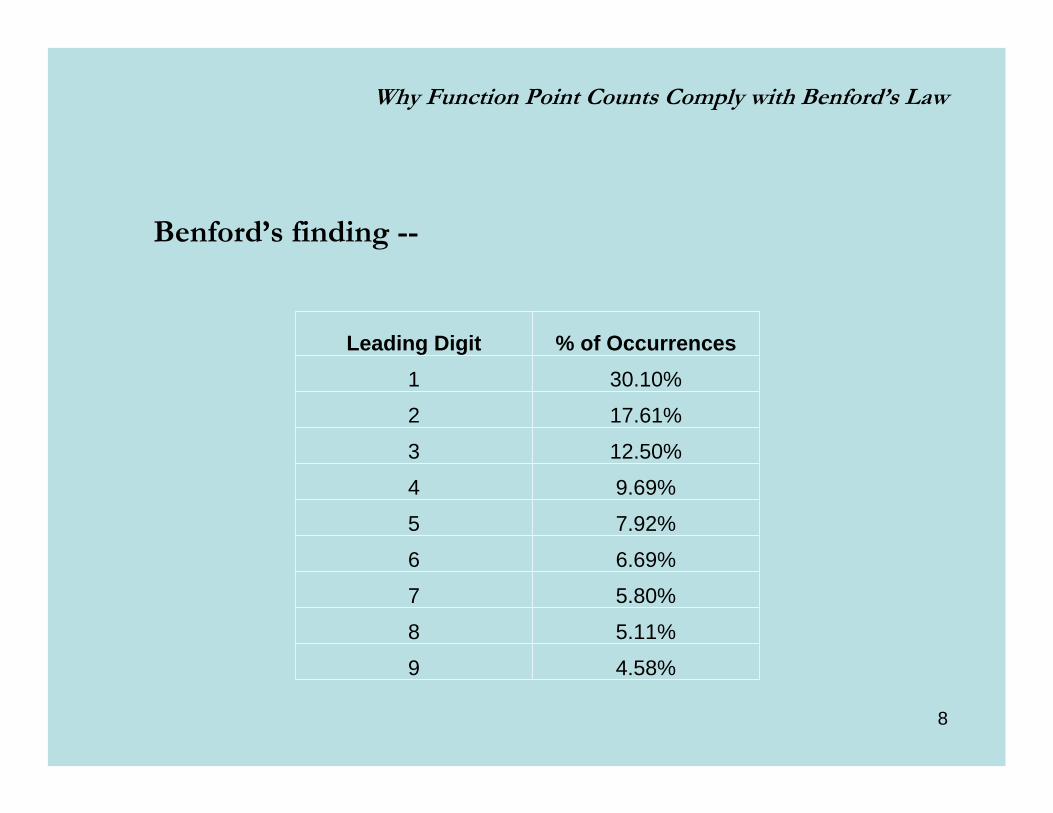
Benford’s finding --
Leading Digit % of Occurrences1 30.10%
2 17.61%
3 12.50%
4 9.69%
5 7.92%
6 6.69%
7 5.80%
8 5.11%
9 4.58%
8

Why Function Point Counts Comply with Benford’s Law
This unusual finding is now known as “Benford’s Law.”
Benford’s law has been found to apply to many sets of financial data, including income tax or stock exchange data, corporate disbursements and sales figures, demographics and scientific data. Since the 1940s, more than 150 academic papers on Benford's law have been published by mathematicians, statisticians, engineers, physicists and—recently—by accountants. (Nigrini 1999)
Although Benford’s Law is shown to be associated with numerous data sets, the question is … what causes it?
9
Why Function Point Counts Comply with Benford’s Law
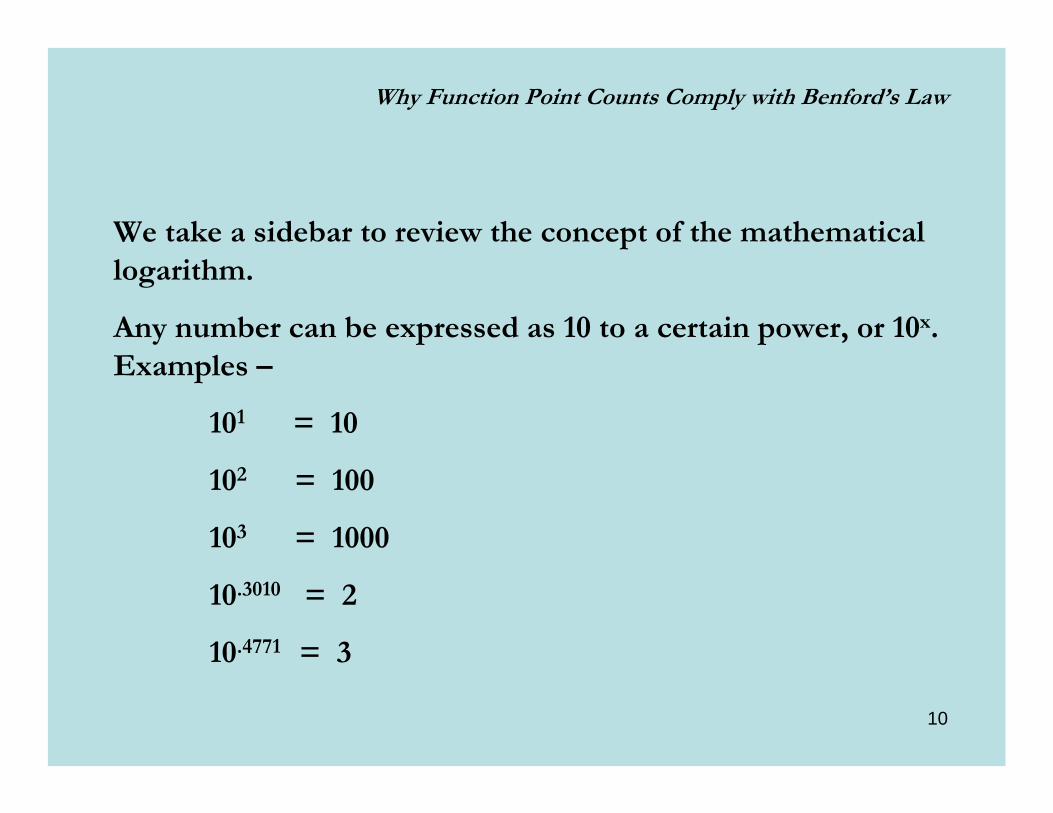
We take a sidebar to review the concept of the mathematical logarithm.
Any number can be expressed as 10 to a certain power, or 10x.Examples –
101 = 10
102 = 100
103 = 1000
10.3010 = 2
10.4771 = 3
10
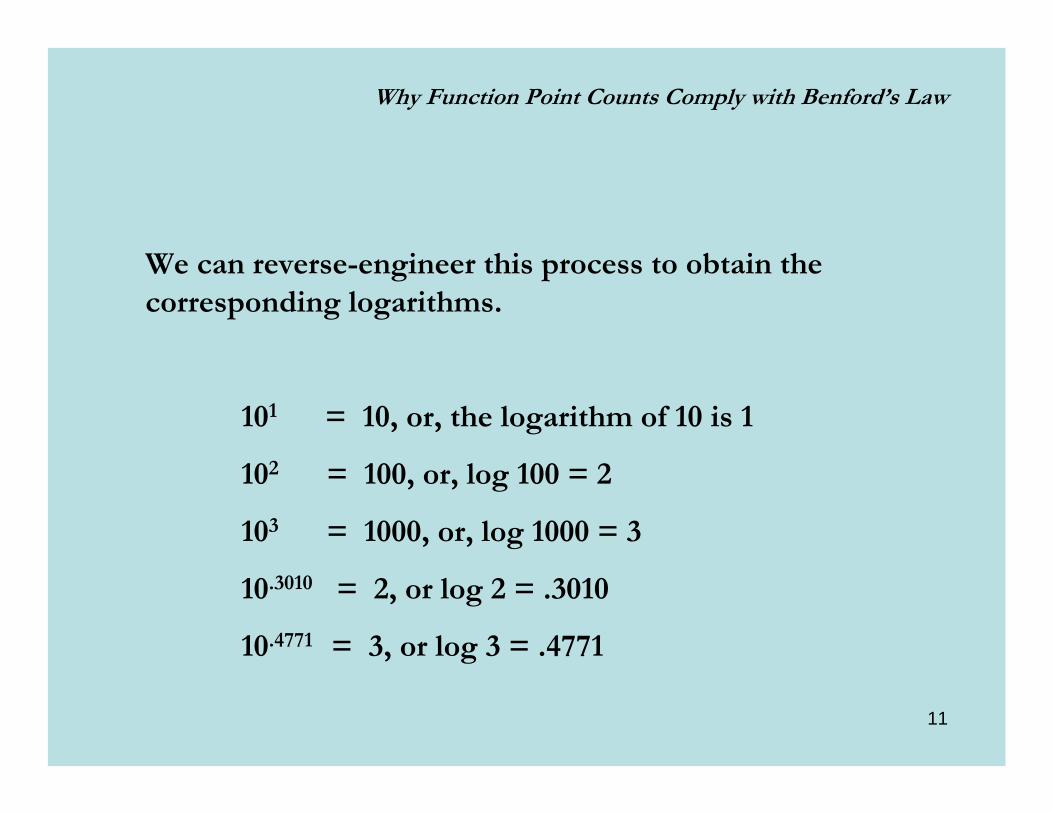
We can reverse-engineer this process to obtain the corresponding logarithms.
101 = 10, or, the logarithm of 10 is 1
102 = 100, or, log 100 = 2
103 = 1000, or, log 1000 = 3
10.3010 = 2, or log 2 = .3010
10.4771 = 3, or log 3 = .4771
Why Function Point Counts Comply with Benford’s Law
11
Why Function Point Counts Comply with Benford’s Law
We next turn to the study of stimulus and response.
Ernst Heinrich Weber (1795-1878), in his “Study of the Perception of Human Stimuli and the Decreasing Utility Function of Natural Law” (Wikipedia 2005) found a form of a law of diminishing returns relationship in humans between stimulus and response: as stimulus increased, response also increased but at a logarithmically decreasing rate. This was further developed by Gustav Fechner, and became known as the Weber-Fechner Law.
12
Why Function Point Counts Comply with Benford’s Law
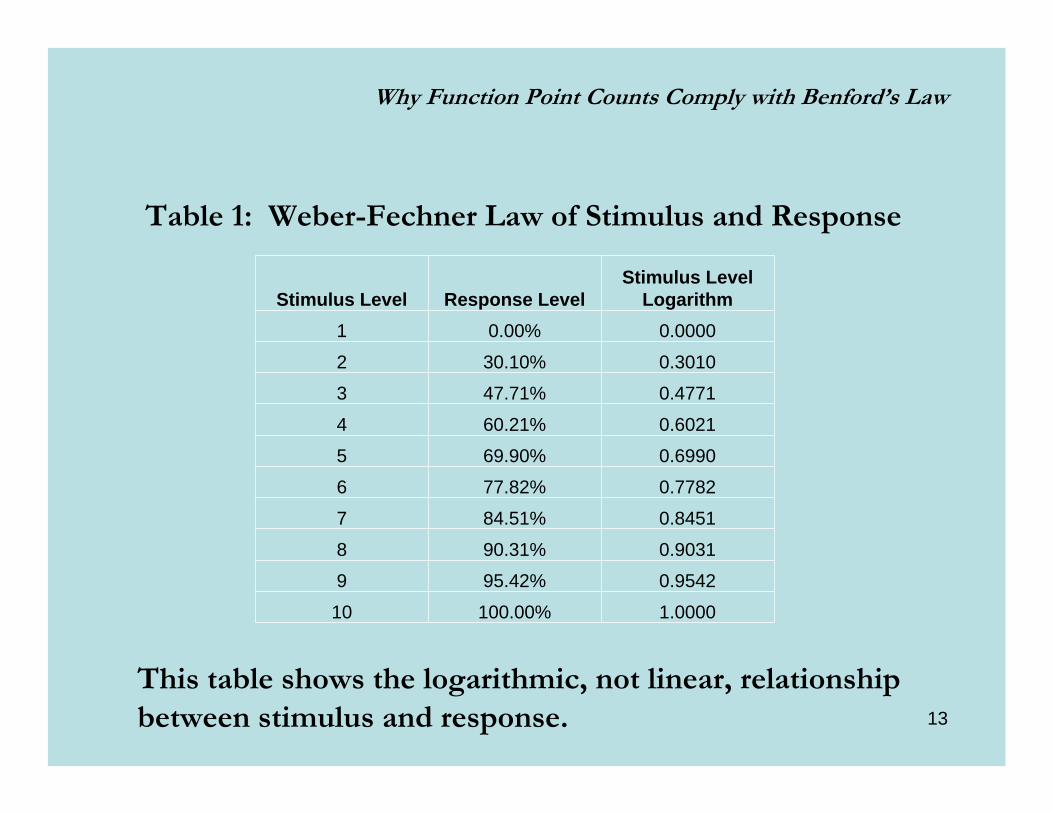
This table shows the logarithmic, not linear, relationship between stimulus and response.
Table 1: Weber-Fechner Law of Stimulus and Response
Stimulus Level Response LevelStimulus Level
Logarithm1 0.00% 0.0000
2 30.10% 0.3010
3 47.71% 0.4771
4 60.21% 0.6021
5 69.90% 0.6990
6 77.82% 0.7782
7 84.51% 0.8451
8 90.31% 0.9031
9 95.42% 0.9542
10 100.00% 1.0000
13
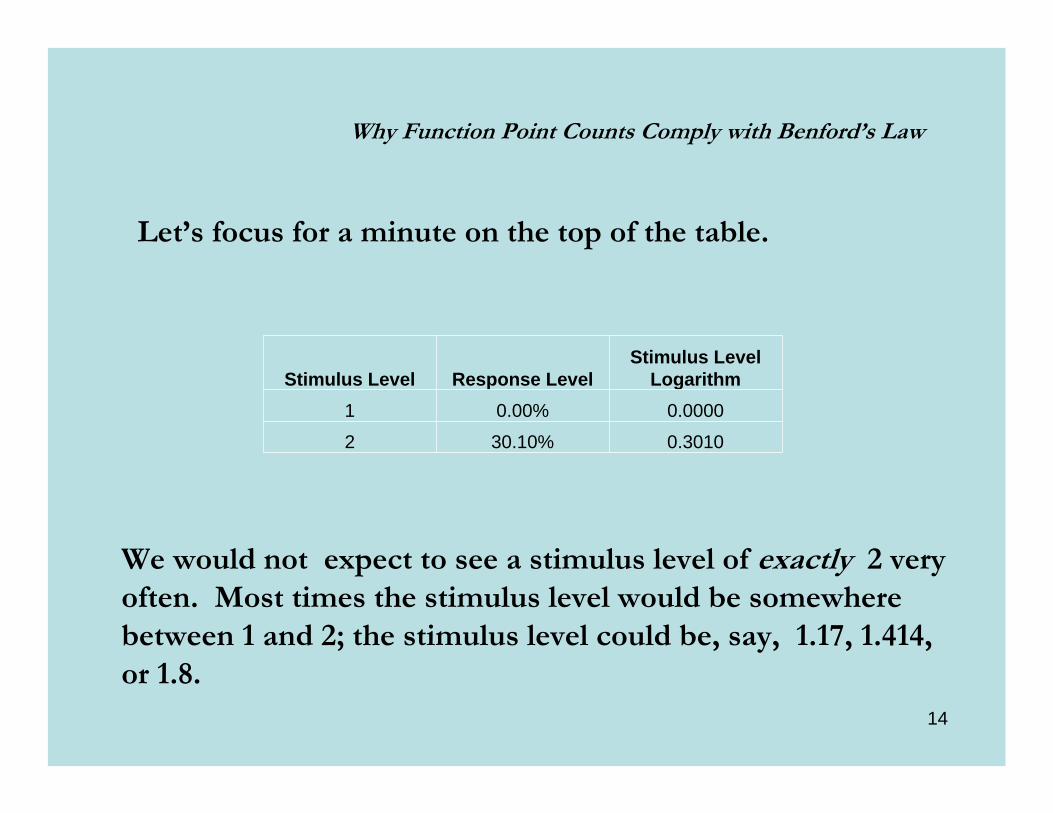
We would not expect to see a stimulus level of exactly 2 very often. Most times the stimulus level would be somewhere between 1 and 2; the stimulus level could be, say, 1.17, 1.414,or 1.8.
Why Function Point Counts Comply with Benford’s Law
Stimulus Level Response LevelStimulus Level
Logarithm1 0.00% 0.0000
2 30.10% 0.3010
Let’s focus for a minute on the top of the table.
14

Why Function Point Counts Comply with Benford’s Law
The key point here is that any stimulus level of at least 1, and less than 2, will have a leading digit of “1” and the percentage of time the set of those response levels should occur is about
.3010 – 0, or 30.10%.
Stimulus Level Response LevelStimulus Level
Logarithm1 0.00% 0.0000
2 30.10% 0.3010
15

The same thing applies to stimulus levels ranging from at least 2 to 3. Most of the time we should see intermediate stimulus levels, like 2.01, 2.236, or 2.8.
Why Function Point Counts Comply with Benford’s Law
Stimulus Level Response LevelStimulus Level
Logarithm1 0.00% 0.0000
2 30.10% 0.3010
3 47.71% 0.4771
The percentage of time we should therefore see a leading digit of “2” should be about
.4771 - .3010 = .1761
or, 17.61%.16
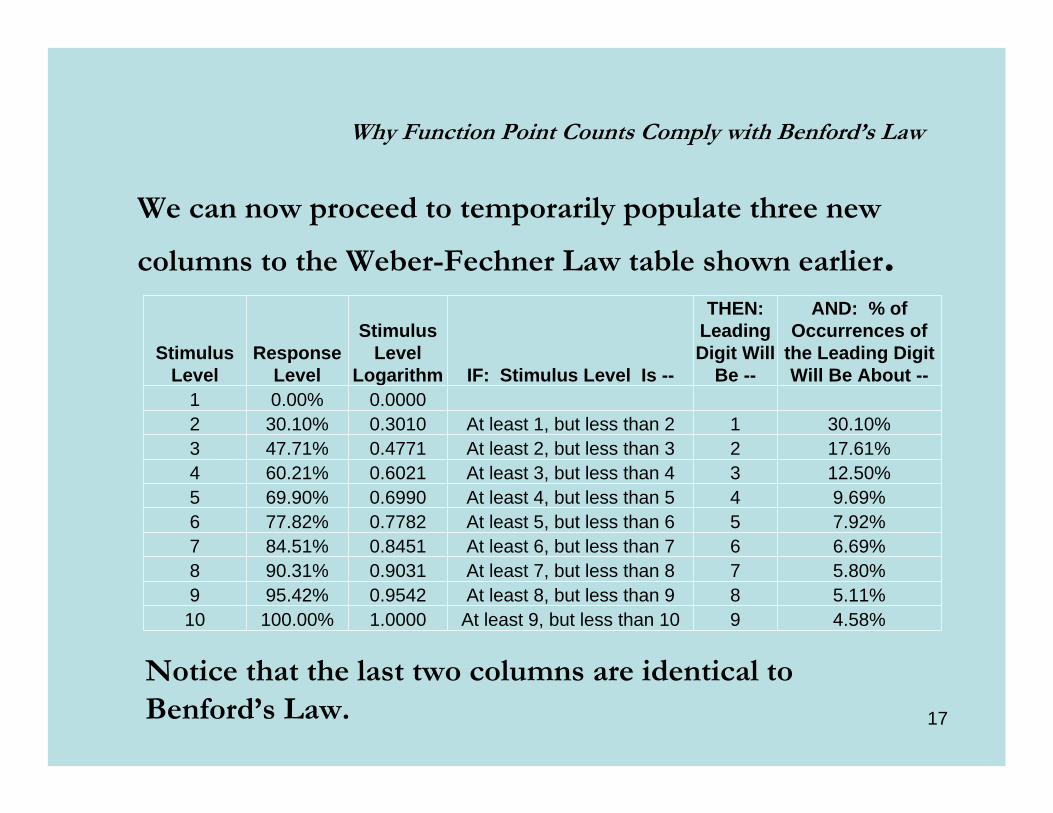
We can now proceed to temporarily populate three new
columns to the Weber-Fechner Law table shown earlier.
Why Function Point Counts Comply with Benford’s Law
Stimulus Level
Response Level
Stimulus Level
Logarithm IF: Stimulus Level Is --
THEN: Leading Digit Will
Be --
AND: % of Occurrences of
the Leading Digit Will Be About --
1 0.00% 0.00002 30.10% 0.3010 At least 1, but less than 2 1 30.10%3 47.71% 0.4771 At least 2, but less than 3 2 17.61%4 60.21% 0.6021 At least 3, but less than 4 3 12.50%5 69.90% 0.6990 At least 4, but less than 5 4 9.69%6 77.82% 0.7782 At least 5, but less than 6 5 7.92%7 84.51% 0.8451 At least 6, but less than 7 6 6.69%8 90.31% 0.9031 At least 7, but less than 8 7 5.80%9 95.42% 0.9542 At least 8, but less than 9 8 5.11%10 100.00% 1.0000 At least 9, but less than 10 9 4.58%
Notice that the last two columns are identical to Benford’s Law. 17
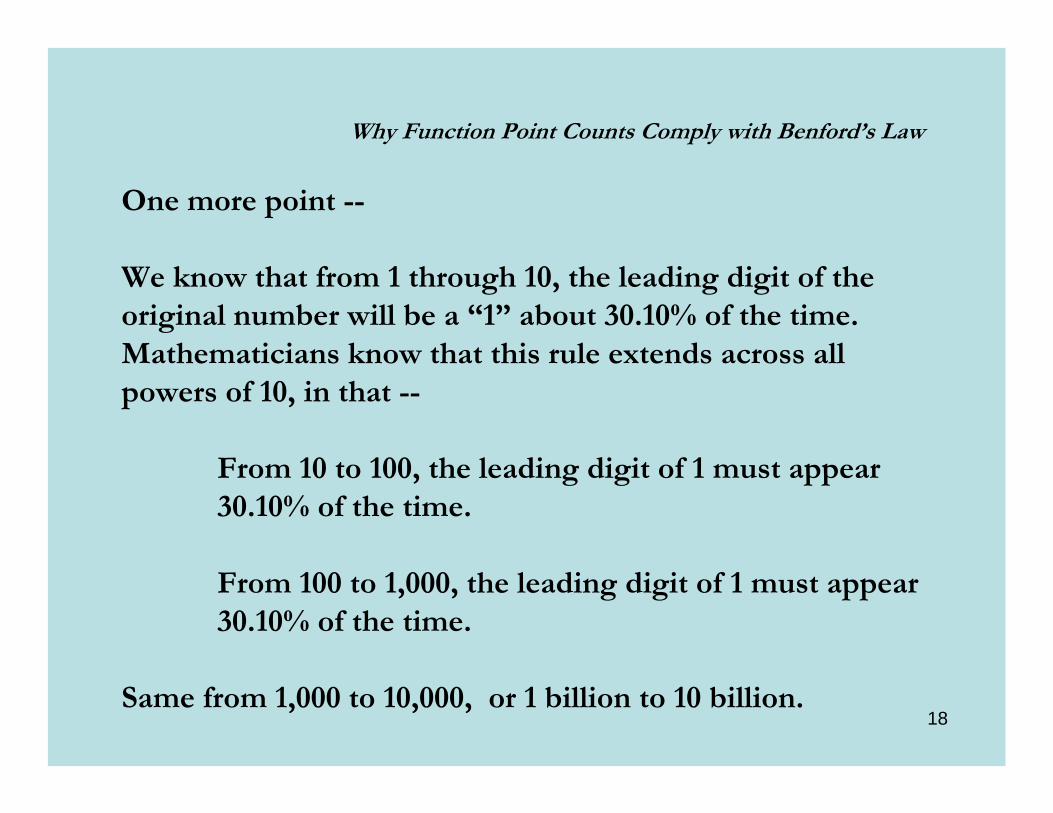
One more point --
We know that from 1 through 10, the leading digit of the original number will be a “1” about 30.10% of the time. Mathematicians know that this rule extends across all powers of 10, in that --
From 10 to 100, the leading digit of 1 must appear 30.10% of the time.
From 100 to 1,000, the leading digit of 1 must appear 30.10% of the time.
Same from 1,000 to 10,000, or 1 billion to 10 billion.
Why Function Point Counts Comply with Benford’s Law
18
Why Function Point Counts Comply with Benford’s Law
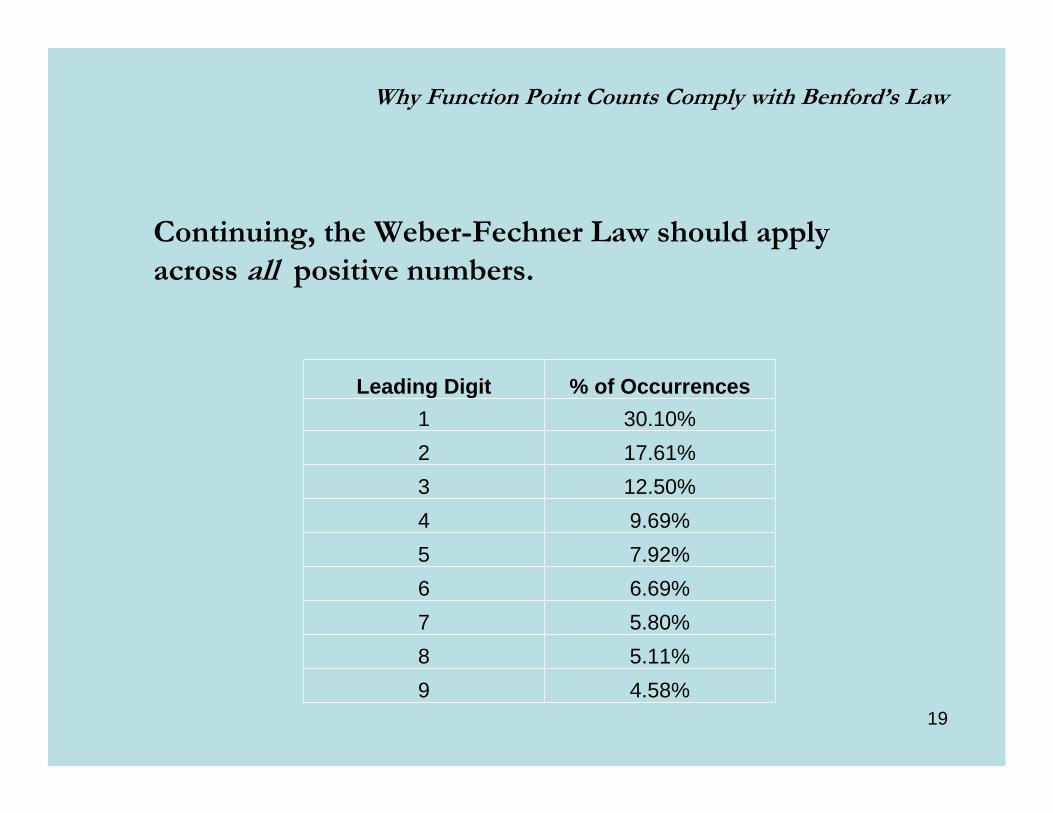
Continuing, the Weber-Fechner Law should apply across all positive numbers.
Leading Digit % of Occurrences1 30.10%2 17.61%3 12.50%4 9.69%5 7.92%6 6.69%7 5.80%8 5.11%9 4.58%
19

Why Function Point Counts Comply with Benford’s Law
In another study, in August 2002, Hans-Werner Sinn of the Institute and University of Munich proved that biological species that do not make survival decisions based on the Weber-Fechner Law “will, with a probability that approaches certainty, disappear relative to the population following this preference as time goes to infinity.” [Sinn, 2002]
Thus, it seems well-verified that species that plan their resource allocation according to this pattern – eg, doubling their work effort results in a benefit of .3010 (etc.) -- have the best chances of survival.
20
I’m wondering …
Is software development a stimulus and response activity??? If so, then the stimulus might be the amount of functionality delivered to the user. The response might be the level of “customer satisfaction.”If this is true, then we can measure the amount of stimulus as the function point count. Function point counts should follow Benford’s Law.
Let’s try it.
Why Function Point Counts Comply with Benford’s Law
21
Hypothesis:
In stimulus and response situations, examination of a large data set of randomly sampled stimulus measurements – even over a wide range of powers of ten – will show that the leading digit of “1” should appear about 30.10% of the time; 2 should appear about 17.1 % of the time, etc., as modeled by Benford’s Law.
Why Function Point Counts Comply with Benford’s Law
22
Why Function Point Counts Comply with Benford’s Law
RESEARCH DESIGN AND METHODOLOGY
Benford’s Law seems to be the descriptive statistic of the stimulus and response mechanism predicted by the Weber-Fechner Law and Sinn. Since software development is a process of stimulus and response, we should be able to find that statistical distribution in sales data.
Examine a large sample of function point counts. Obtain the frequency of each first digit of the counts. Compare these frequencies to that predicted by Benford’s Law.
23
Why Function Point Counts Comply with Benford’s Law
PRESENTATION AND ANALYSIS OF DATA
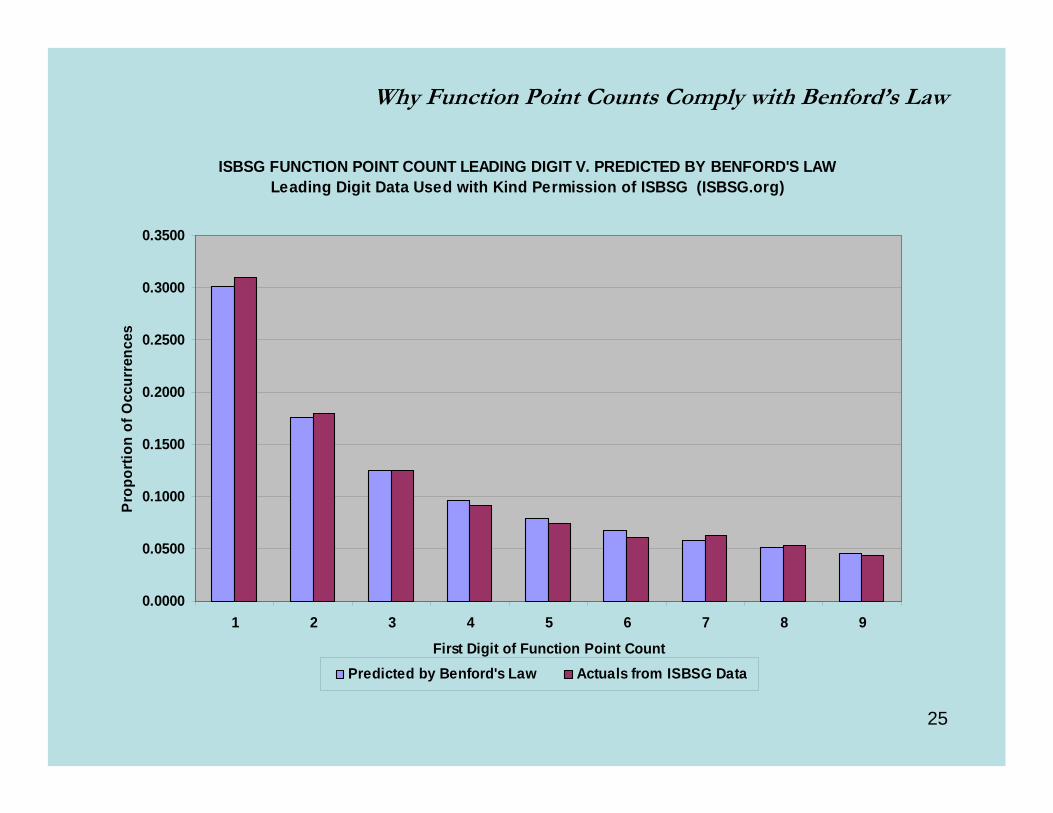
To test whether function point counts seem to follow Benford’s Law, a census of all 3,103 ISBSG function point counts rated as either “A” or “B” quality from ISBSG Release 10 was examined. A histogram was built to compare the frequency of first digits with those forecast by Benford’s Law. The graph on the next viewgraph shows the results. The blue bars represent the values predicted by Benford’s Law, and the maroon the actual ISBSG data. See how closely the actual values match those predicted.
24
Why Function Point Counts Comply with Benford’s Law
ISBSG FUNCTION POINT COUNT LEADING DIGIT V. PREDICTED BY BENFORD'S LAWLeading Digit Data Used with Kind Permission of ISBSG (ISBSG.org)
0.0000
0.0500
0.1000
0.1500
0.2000
0.2500
0.3000
0.3500
1 2 3 4 5 6 7 8 9
First Digit of Function Point Count
Prop
ortio
n of
Occ
urre
nces
Predicted by Benford's Law Actuals from ISBSG Data
25

Why Function Point Counts Comply with Benford’s Law
CONCLUSIONS
Benford’s Law is a descriptive statistic of the stimulus and response activity known as the Weber-Fechner Law, and also found by Sinn. Benford’s Law can be used as one method for assessing the quality of a portfolio of function point counts. It also can be used as an indicator of the high quality of the structure of the function point methodology, because function points should accurately measure the stimulus and response effect of software development.
26

Why Function Point Counts Comply with Benford’s Law
REFERENCES
Nigrini, Mark J. (1999) “I’ve Got Your Number,” Journal of Accountancy, Online issue, May.
Wikipedia 2005 “Weber-Fechner law” , http://en.wikipedia.org/wiki/Weber-Fechner_Law
Sinn, Hans-Werner, “Weber’s Law and the Biological Evolution of Risk Preference,” presented at the 29th Seminar of the European Group of Risk and Insurance Economists, Rutland Square Hotel, Nottingham, 16-18 September 2002. Sponsored by the Geneva Association.
27