Why Farming of Marine Fish
26
Why Farming of Marine Fish? Carlos Massad Marine Farms Vietnam & Bjørn Myrseth Marine Farms ASA
Transcript of Why Farming of Marine Fish
Why Farming of Marine Fish?
Carlos MassadMarine Farms Vietnam
&
Bjørn MyrsethMarine Farms ASA

CARLOS F. MASSADMarine Farms Vietnam
Mr. Massad has over 25 years experience in various commercial aquaculture operations in different countries around the world.Since 2008, Mr. Massad has been Managing Director for Marine Farms Vietnam - an international company and subsidiary of Marine Farms A/S Norway - dedicated to the production of cobia, with a total annual production of 1,500 tonnes. The company employs a workforce of over 100 and posts annual sales of US$ 6 million. Before, he was Business Manager for Armstrong-Keta Inc. in Juneau, Alaska (USA), a regional salmon enhancement hatchery based in Alaska.

Environmental Concerns
• Freshwater – limited resources.
• Seawater ‐ higher availability of resources.
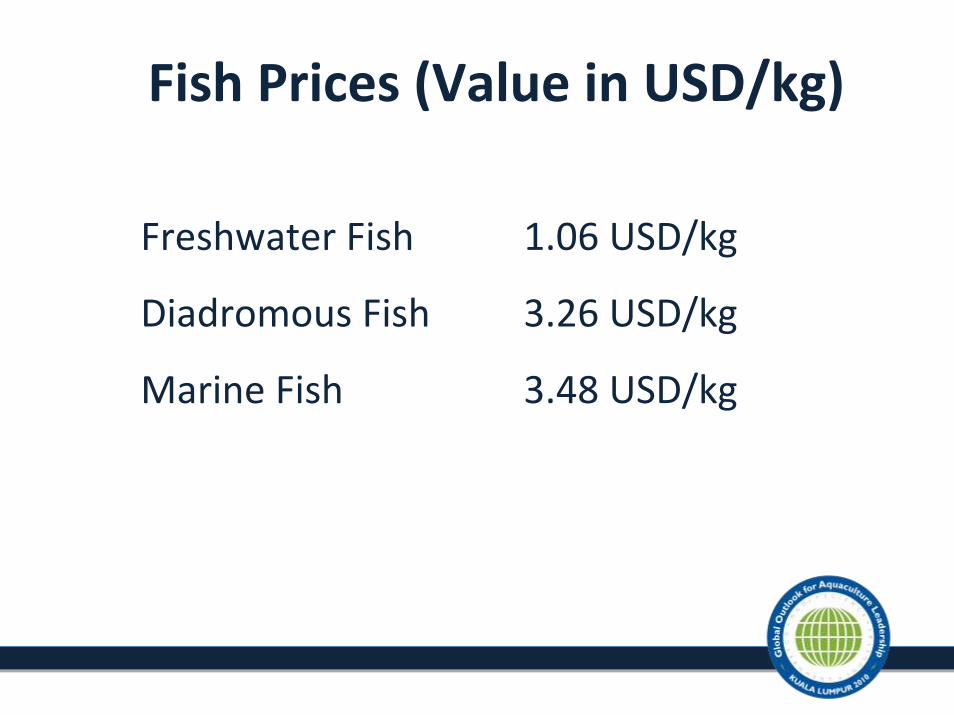
Fish Prices (Value in USD/kg)
Freshwater Fish 1.06 USD/kg
Diadromous Fish 3.26 USD/kg
Marine Fish 3.48 USD/kg

Growth In Farmed Finfish(Mill. Tonnes)
1996 1999 2002 2005Av. Growth pr. year
Freshwater fish 14.6 18.6 23.0 25.8 8%
Diadromous fish 1.7 2.1 2.6 2.9 7%
Marine fish 0.6 0.9 1.2 1.6 17%
Source: FAO

A Conclusion
Marine fish offer:
– Less environmental concerns.
– Better prices.
– Better growth prospects.
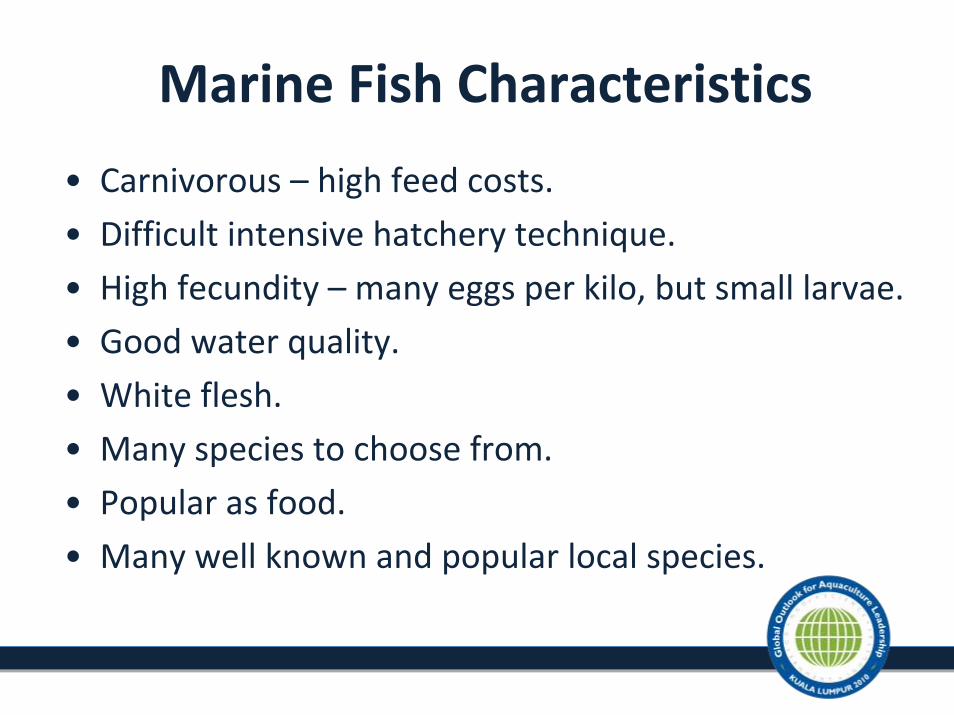
Marine Fish Characteristics
• Carnivorous – high feed costs.
• Difficult intensive hatchery technique.
• High fecundity – many eggs per kilo, but small larvae.
• Good water quality.
• White flesh.
• Many species to choose from.
• Popular as food.
• Many well known and popular local species.

Cold Water Farming Candidates
Species Tons Farmed
Price to Farmer(USD)
Halibut 2,000 12
Cod 20,000 4‐5
Turbot 10,000 12+
Sole 1,000 12+

Temperate Water Species Europe
• Mediterranean sea bass ‐ 150 000 tons• Mediterranean sea bream ‐ 150 000 tons
• Corvina (meagre) ‐ 5 000 tons?• A number of other candidates – but similar eating quality
Asia• Japanese sea bream• Rockfish in Korea• Flounder in Korea• Yellowfin tuna
What Is The Next Area To Be Developed For Marine Fish?
The Tropics!!
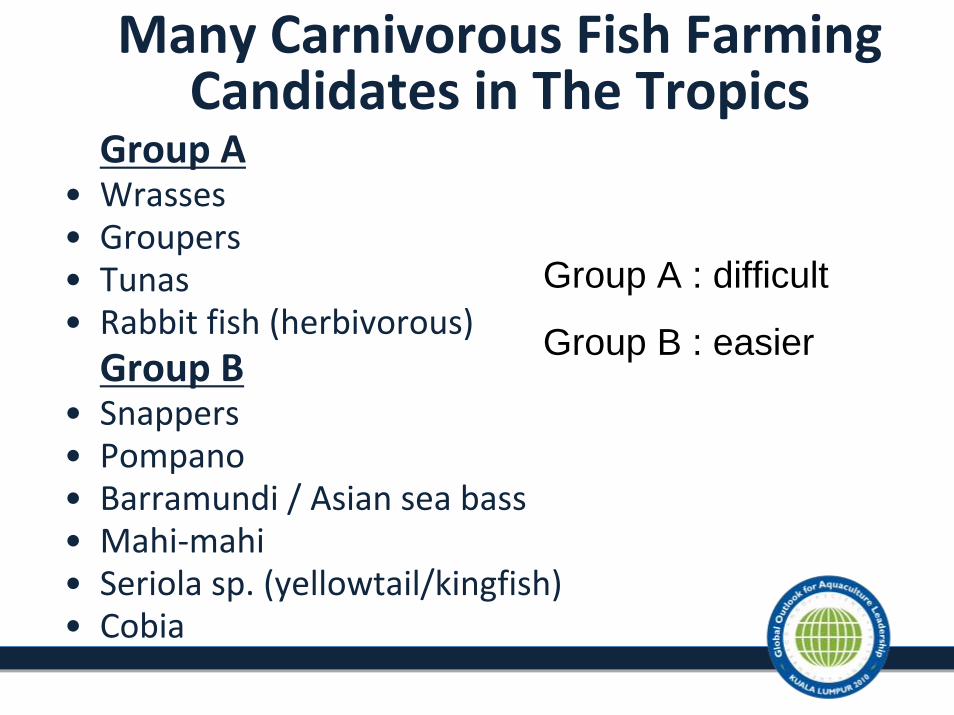
Many Carnivorous Fish Farming Candidates in The Tropics
Group A• Wrasses• Groupers• Tunas• Rabbit fish (herbivorous)Group B
• Snappers• Pompano• Barramundi / Asian sea bass• Mahi‐mahi• Seriola sp. (yellowtail/kingfish)• Cobia
Group A : difficult
Group B : easier

Bottlenecks
• Broodfish and eggs.• Larval rearing.• Nutrition – develop plant protein ingredients.• Diseases and parasites.• Yield.• Progress every year.

Hatchery Production

Semi Intensive
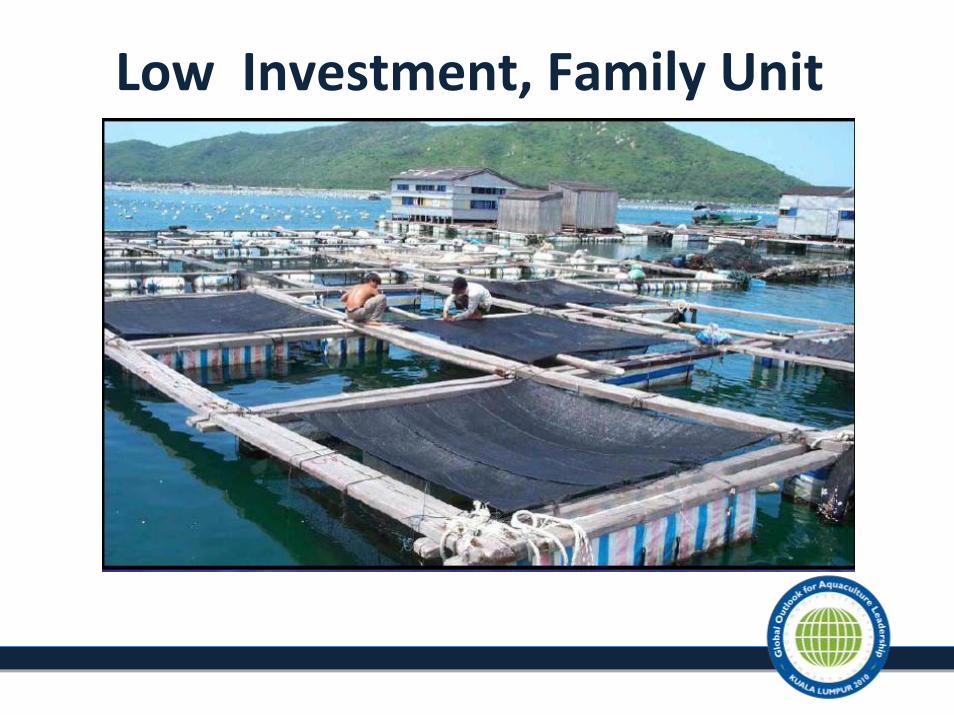
Low Investment, Family Unit

Intensive, High Capital Requirements
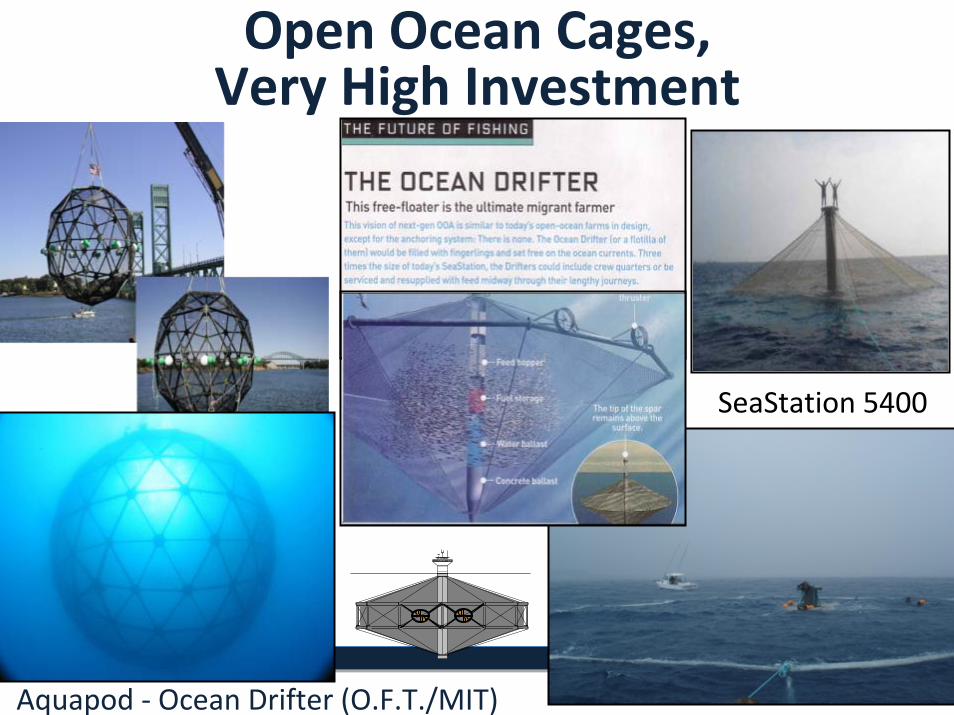
Aquapod ‐ Ocean Drifter (O.F.T./MIT)
SeaStation 5400
64,000 Cubic Meter Ocean Drifter
Open Ocean Cages, Very High Investment

Why Farming Cobia?Cobia has all the traits you want in a farmed fish:
• Excellent eating qualities:Grilled, baked, deep fried and as sashimi.
• White flesh.• Large fillets.• High in Omega‐3.• Do well in cages.• Fast growth.• Year round egg supplies can be developed.
• Efficient production.

Fast Growth
0
1
2
3
4
5
6
7
0 months 6 months 12 months 18 months 24 months
Kg
Cobia Salmon Seabass/bream Cod

Omega‐3 Content:Salmon and Cobia have 1,000x more Omega‐3 than Pangasius
1,4
1,4
0,3
0,3
0,002
0,0 0,2 0,4 0,6 0,8 1,0 1,2 1,4 1,6 1,8
Pangasius
Cobia
Atlantic salmon
gram omega-3 / 150 gram product
gram Omega-3 / 150 gram product +/- range

World Production of Farmed Cobia
• Estimated world production (tons) in 2007– China 20.000
– Taiwan 4.000
– Vietnam 2.000
– Caribbean 1.000
– Philippines 500
– Thailand 500
– Japan 500
• Total 28.500 tons

Cobia Cuisine
Cobia SashimiCobia CarbonnataPan Fried Cobia

Vietnam ‐ Sales• Infrastructure and cages, nets, etc. for 2000 tons.• Processing – contract production.• Marketing:
‐ Frozen to Nordic Group, Boston.‐ Fresh to Taiwan and Japan.‐ Fresh to other Asian markets.‐ Frozen to Europe.
• Plan to sell 1500 tons this year.
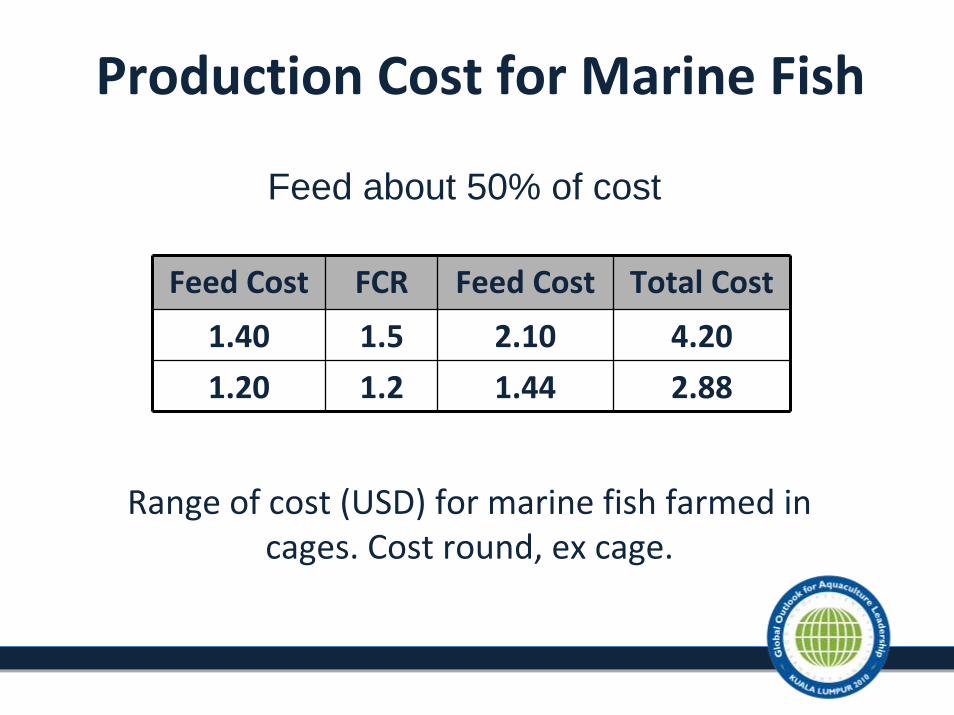
Production Cost for Marine Fish
Feed Cost FCR Feed Cost Total Cost
1.40 1.5 2.10 4.20
1.20 1.2 1.44 2.88
Feed about 50% of cost
Range of cost (USD) for marine fish farmed in cages. Cost round, ex cage.

Development Cost and Market Price (FOB Norwegian border)and World Supply Atlantic Salmon, 1987‐ 2008E
-
10
20
30
40
50
60
70
80
90
100
0
150
300
450
600
750
900
1 050
1 200
1 350
1 500
1987
1988
1989
1990
1991
1992
1993
1994
1995
1996
1997
1998
1999
2000
2001
2002
2003
2004
2005
2006
2007
2008
E
Adjusted according to consumer index basis 2008 = 100 Source: The Norwegian Seafood Export Council / Kontali
1.00
0 TO
NS
RO
UN
D W
EIG
HT
NO
K / K
G
Harvest quantityAtlantic salmon World wideEstimate for 2008
Average cost/ kg fresh guttedAtlantic salmon, (fob Norwegian border)
Average export price fob Norwegian border, fresh gutted Atlantic salmon
For marine fish we will see the same developments:
• Better feed – R&D.• Better fish (genetics).• Lower costs.• Higher volume.
Cobia (and tuna) will be winners!